v1 revised 2 feb 15 stp investor press - finalstptower.com/wp-content/uploads/v1 revised 2 feb 15...
TRANSCRIPT

Investor PresentationPT Solusi Tunas Pratama Tbk
February 2015

These materials have been prepared by PT Solusi Tunas Pratama, Tbk (“STP” or the “Company”) and have not beenindependently verified. No representation or warranty, expressed or implied, is made and no reliance should be placedon the accuracy, fairness or completeness of the information presented or contained in these materials. Neither theCompany nor any of its affiliates, advisers or representatives accepts any liability whatsoever for any loss arising fromany information presented or contained in these materials. The information presented or contained in these materialsis subject to change without notice and its accuracy is not guaranteed.
These materials contain statements that constitute forward-looking statements. These statements include descriptionsregarding the intent, belief or current expectations of the Company or its officers with respect to the consolidatedresults of operations and financial condition of the Company. These statements can be recognized by the use ofwords such as “expects,” “plan,” “will,” “estimates,” “projects,” “intends,” “outlook” or words of similar meaning. Suchforward-looking statements are not guarantees of future performance and involve risks and uncertainties, and actualresults may differ from those in the forward-looking statements as a result of various factors and assumptions. TheCompany has no obligation and does not undertake to revise forward-looking statements to reflect future events orcircumstances.
These materials are for information purposes only and do not constitute or form part of an offer, solicitation orinvitation to buy or subscribe for any securities of the Company in any jurisdiction, nor should these materials or anypart of them form the basis of, or be relied upon in any connection with, any contract, commitment or investmentdecision whatsoever.
Disclaimer

Contents
Section 1: Introduction to STP
Section 2: Overview of Acquired XL Assets
Section 3: Key Investment Highlights
Section 4: Strong Financial Performance & Funding Headroom
Section 5: Well Positioned For Growth
Appendix
I. Additional Materials

Introduction to STP
Section 1

Company overviewThird largest and fast growing independent Indonesian tower company with a unique combination of tower assets and fibre network
2011-2013 revenue CAGR of 59.3% 2013 revenue of IDR840bn (USD67m)
Proforma LQA 3Q14 revenues of c.IDR1,859bn (c.USD149m) and EBITDA margin of 85% post XL Axiata (“XL”) tower acquisition
Founded in 2006Listed on IDX in Oct 2011Current market cap of USD637m(a)
Top 3 independent Indonesian tower companyAll telecom operators and two LTE operators are current customers(b)
c.2,400 km of fibre network(c)
Pioneer in rolling out micro cell for LTE services
DAS networks for indoor coverage
7,149 telecom sites(c)
(6,651 towers, 498 shelter/indoor DAS)
11,060 tenancies(c) excluding 671 Bakrie Telecom (“BTel”) tower tenants and 1 BTel indoor DAS tenant(10,521 tower tenancies,1.58x tower tenancy ratio)
Lean team of271 employees(c)
Current portfolio
(a) Solusi Tunas Pratama stock price of IDR 7,000 per share as of 28 January 2015(b) Current LTE customers are First Media and Internux(c) As of 31 December 2014Note: USD/IDR exchange rate of 12,500 applied throughout the presentation unless stated otherwiseSource: Company data, Bloomberg
1
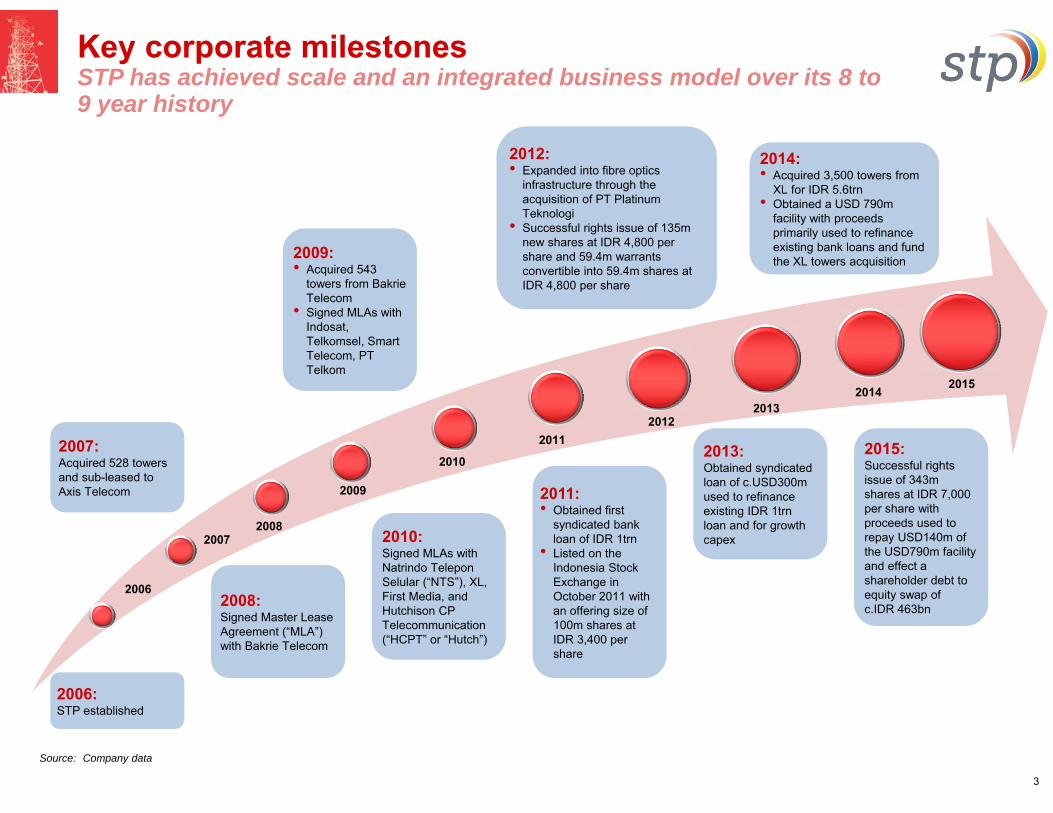
Key corporate milestonesSTP has achieved scale and an integrated business model over its 8 to 9 year history
2006
20072008
2009
2010
20112012
20142013
2015
2006:STP established
2007:Acquired 528 towers and sub-leased to Axis Telecom
2008:Signed Master Lease Agreement (“MLA”) with Bakrie Telecom
2009:• Acquired 543
towers from Bakrie Telecom
• Signed MLAs with Indosat, Telkomsel, Smart Telecom, PT Telkom
2010:Signed MLAs with Natrindo Telepon Selular (“NTS”), XL, First Media, and Hutchison CP Telecommunication (“HCPT” or “Hutch”)
2013:Obtained syndicated loan of c.USD300m used to refinance existing IDR 1trn loan and for growth capex
2011:• Obtained first
syndicated bank loan of IDR 1trn
• Listed on the Indonesia Stock Exchange in October 2011 with an offering size of 100m shares at IDR 3,400 per share
Source: Company data
2012:• Expanded into fibre optics
infrastructure through the acquisition of PT Platinum Teknologi
• Successful rights issue of 135m new shares at IDR 4,800 per share and 59.4m warrants convertible into 59.4m shares at IDR 4,800 per share
2014:• Acquired 3,500 towers from
XL for IDR 5.6trn• Obtained a USD 790m
facility with proceeds primarily used to refinance existing bank loans and fund the XL towers acquisition
3
2015:Successful rights issue of 343m shares at IDR 7,000 per share with proceeds used to repay USD140m of the USD790m facility and effect a shareholder debt to equity swap of c.IDR 463bn

Attractive business model
4
Stable, recurring and predictable revenues coupled with high growth and new adjacent business
• Typical lease period: 10-12 years• Current Tower Tenancy ratio: 1.58x
Micro-cell Poles• Typical lease period: 10 years• Current Tenancy ratio: 1.24xIndoor Building Solution• Typical lease period: 5 years• Current Tenancy ratio: 2.58x
• Lease space on STP’s towers sites to telcos for placing their antennas and other telecom equipment
• Highly predictable and recurring revenue stream based on advance rent collection and long term contracts
• Build-to-suit business model, no speculative builds
• The only listed TowerCo in Indonesia to 1) have obtained the license to lease out space on micro-cell poles (20 year contract) and 2) possess the fiber optics backbone to connect to these poles (c.1,300km in Greater Jakarta area alone) to support aggressive urban 3G / LTE rollout by telcos
• Key solutions include:
• Micro-cell poles: Leasing space on micro-cell poles to traditional telcos and 4G players. Better economics than regular structures given faster time to build and lower cost / higher rentals
• Providing telecommunication operators with access to STP’s Indoor Building Solution networks in shopping malls and residential buildings in major urban areas
• Offering efficient backhaul solutions for telecommunication operators using STP’s fibre network
Revenue split
Current core business New adjacent businessOverview Overview
Fibre Network• Typical lease period: 10
years (for telcos customers included in micro-cell poles)
• Typical lease period: 1-3 years (non telcos customers)
Lease terms & tenancies Lease terms & tenancies
New adjacent
business PF LQA 3Q14: 5%
Current core businessPF LQA 3Q14: 95%

Overview of our asset portfolio
Greater Jakarta
32%
Other Java and Bali
39%
Sumatera22%
Others7%
Structure type(a) Geographic breakdown
Tower assets
Total Towers: 6,651
Ground-based Towers: 78%Sites: 5,186 Tenancy Ratio: 1.66x
5
(a) Tenancy ratios shown exclude BTel tenantsSource: Figures shown as at 31 December 2014
Colocation potential
Urban location
• Ground-based towers structurally have higher capacity for incremental tenancies (1.66x today, able to support up to 3x tenants on average without strengthening capex)
• Our rooftop towers are mostly located in urban areas, where tenancy colocation and additional equipment loading are more common
• Nearly 1/3 of sites are strategically located in Indonesia’s Greater Jakarta, where majority of LTE roll-outs will take place
• Focus on highly urbanized areas – ability to offer VAS and complementary solutions
Microcell Sites: 5%Sites: 301Tenancy Ratio: 1.24x
Rooftop Towers: 17%Sites: 1,164Tenancy Ratio: 1.31x
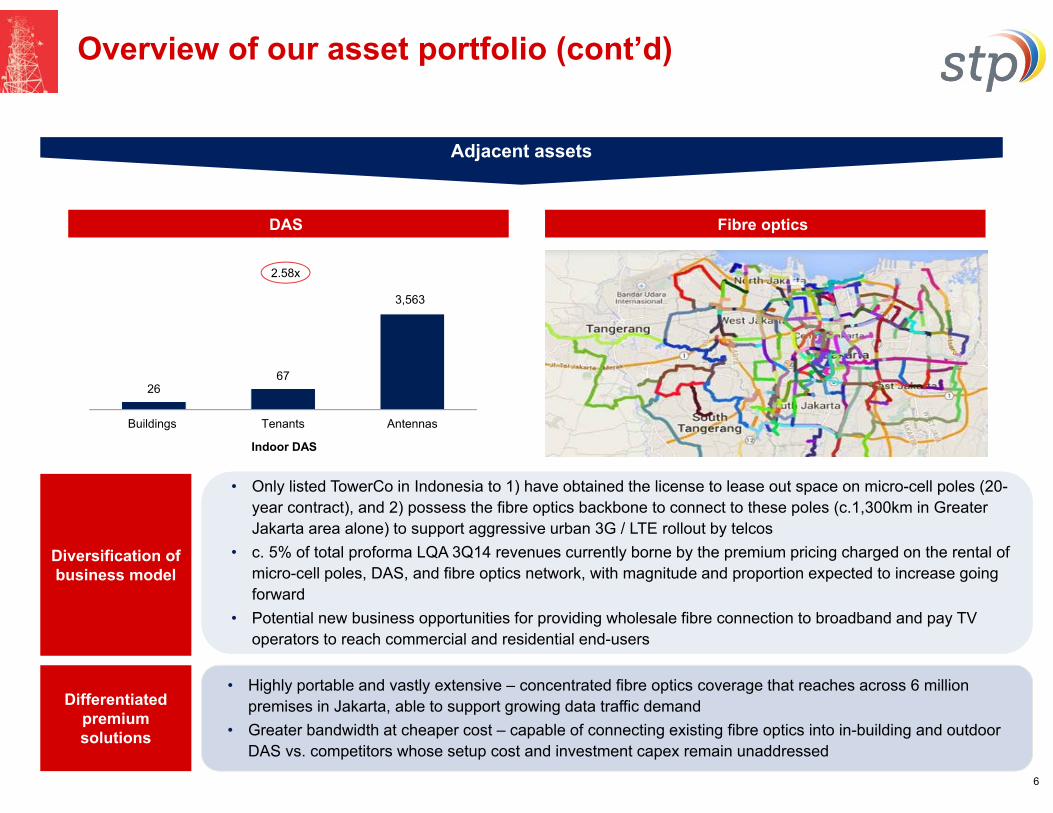
• Only listed TowerCo in Indonesia to 1) have obtained the license to lease out space on micro-cell poles (20-year contract), and 2) possess the fibre optics backbone to connect to these poles (c.1,300km in Greater Jakarta area alone) to support aggressive urban 3G / LTE rollout by telcos
• c. 5% of total proforma LQA 3Q14 revenues currently borne by the premium pricing charged on the rental of micro-cell poles, DAS, and fibre optics network, with magnitude and proportion expected to increase going forward
• Potential new business opportunities for providing wholesale fibre connection to broadband and pay TV operators to reach commercial and residential end-users
Overview of our asset portfolio (cont’d)
26 67
Buildings Tenants Antennas
Indoor DAS
2.58x
3,563
6
Adjacent assets
DAS Fibre optics
Diversification of business model
Differentiated premium solutions
• Highly portable and vastly extensive – concentrated fibre optics coverage that reaches across 6 million premises in Jakarta, able to support growing data traffic demand
• Greater bandwidth at cheaper cost – capable of connecting existing fibre optics into in-building and outdoor DAS vs. competitors whose setup cost and investment capex remain unaddressed

Overview of Acquired XL Assets
Section 2

Overview of XL tower assets
• The XL Tower Assets consist of 3,263 ground-based and 237 roof top towers• These have 2,293 total third party (excluding XL) tenants with XL as the anchor tenant on all the towers, implying a tenancy ratio
of 1.66x • 93% of the XL Tower Assets consists of ground based towers while 89% of the total 3,500 towers are >30m in height
• Ground based towers can typically support up to 5-6 tenants depending on other factors like height• 87% EBITDA margin for XL portfolio
• Each increment in tenancy on existing towers is accompanied by a marginal increase in costs therefore driving high operating and cash flow leverage
• XL Tower Assets have an attractive tenant profile with XL (2nd largest telecom operator in Indonesia) as the anchor tenant • 98% of total tenants from the Big-4 operators in Indonesia (Telkom, XL, Indosat and Hutchison)• Total contracted revenue from XL and Big-4 operators are USD 335m and USD 518m respectively
7
Java and Bali58%
Sumatera 35%
Others7%
Ground based93%
Roof top7%
Total number of towers: 3,500 Total number of tenants: 5,793
XL60%
Hutch28%
Telkom 8%Indosat 2% Others 2%
XL overview of tower portfolio Overview of tenants Breakdown by geography
Total number of towers: 3,500
Source: Company information
Overview of XL tower assets

Seamless integration planned for XL towers
Extensive network overlap Overlap in 27 out of 29 provinces we operate in Indonesia Only one province with XL presence where there is no existing STP
presence On the ground teams actively progressing the integration
Well structured (tower-by-tower) O&M transition plan O&M to be handled by Huawei until tower audit, post which, Ericsson to
take over O&M
Land lease Separate teams assigned on a regional basis XL to renew land leases expiring by Mar-15 at their expense XL to provide assistance for renewal of leases expiring from Apr-15 to
Dec-15; agree to swap tower if renewal is unsuccessful
Others Permits: Specialized external teams with local knowledge and access to
regional governments to be appointed Billing: Single invoice billing planned for all 3,500 towers
8
Accelerated integration given existing presence
Papua
West Papua
North Maluku North Sulawesi
Central Sulawesi
Gorontalo
MalukuSouth East Sulawesi
West Sulawesi
South Sulawesi
East Nusa Tenggara
West Nusa Tenggara
Bali
East JavaYogyakarta
Central Java
West Java
Jakarta
Banten
East Kalimantan
Central Kalimantan
South Kalimantan
West Kalimantan
Riau Islands
Bangka Belitung
Lampung
South Sumatra
Bengkulu
Jambi West
Sumatra
Riau
North Sumatra
Aceh
NorthKalimantan
Provinces with overlaps between XL and STP
Provinces with XL presence onlyProvinces with STP presence only
Provinces with no STP and XL presence
FO Greater Jakarta
1,332 km
FO West Java
258 km FO
East Java68 km
FOSumatra 102 km
FO Submarine Batam Singapore
84 km
FOSubmarine
Anyer Kalianda
71 km
FO Submarine East Java – South
Kalimantan 483 km

Tower audit process
• XL Purchase Agreement provides STP with a 12-month period to complete its tower audit process
• In the event of material discrepancies, Purchase Agreement allows for a 1-for-1 tower swap or true-up purchase consideration adjustment
• STP will deploy a 69-member strong team (50 teams, with 1-2 staff in each team) to conduct a site-by-site audit, expected to be completed by March 2015
• This leaves a 9-month buffer period for tower swaps and true-up purchase consideration adjustments if required
Clear and transparent tower audit process led by both STP and XL
March 2015 December 2015
• Expected completion of tower audit • Deadline for tower swap / cash settlement
9
Tower audit process

Strategic rationale for XL transaction
Solidifies STP’s position as a “Big 3” player in the Indo tower landscape, approximately doubling
its portfolio to 6,651 towers and 10,521 tower tenants (ex. BTel)
Established #2 telecom operator (XL Axiata, Ba1/BBB) as an anchor tenant on 100% of the
acquired sites
Increases total contracted revenue from USD 476m to c.USD 998m, with average lease period
increasing from 6.5 to 7.4 years
Attractive opportunity for value creation by increasing tenancy
Potential to realize cost synergies with existing STP towers business in operation and
maintenance costs
10
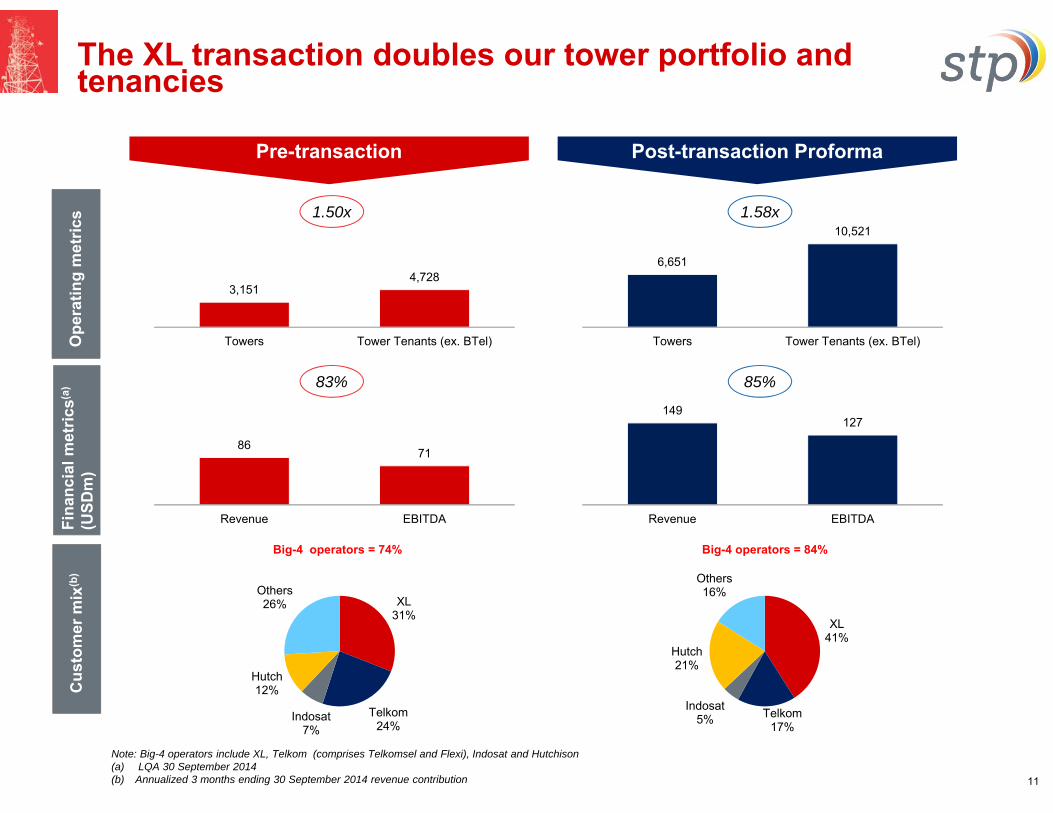
149127
Revenue EBITDA
86 71
Revenue EBITDA
3,1514,728
Towers Tower Tenants (ex. BTel)
6,651
10,521
Towers Tower Tenants (ex. BTel)
XL41%
Telkom17%
Indosat5%
Hutch21%
Others16%
XL31%
Telkom24%
Indosat7%
Hutch12%
Others26%
The XL transaction doubles our tower portfolio and tenancies
Fina
ncia
l met
rics(
a)
(USD
m)
Big-4 operators = 74% Big-4 operators = 84%
Pre-transaction Post-transaction Proforma
83% 85%
1.50x 1.58x
11
Note: Big-4 operators include XL, Telkom (comprises Telkomsel and Flexi), Indosat and Hutchison (a) LQA 30 September 2014(b) Annualized 3 months ending 30 September 2014 revenue contribution
Ope
ratin
g m
etric
sC
usto
mer
mix
(b)

Financial merits of the XL acquisition
Attractive acquisition consideration paid
taking into account lease rate of IDR 10m /
month with XL
No electricity cost in XL portfolio as the
electricity cost is borne by tenants
Post full integration, opex scalability and cost
synergies will further reduce cost structure
and lead to higher EBITDA margin on
proforma basis
(Financials shown for LQA 3Q14 in USDm) STP XL ProformaNo. of towers 3,151 3,500 6,651
No. of tower tenants (ex. BTel) 4,728 5,793 10,521
Tenancy ratio(b) 1.50x 1.66x 1.58x
Revenue 86 63 149
Cost of revenue 8 5 13
% of revenue 9% 8% 9%
SG&A 7 2 9
% of revenue 8% 3% 6%
EBITDA 71 56 127
EBITDA margin 83% 89% 85%
1
2
3
XL TowersIndo peers(a)
avg
EV/ LQA EBITDA 8.0x 16.9x
EV / Tower (USD’000) USD 128 c.USD 400
1
12
(a) Indo peers comprise of Protelindo and Tower Bersama. Market data as of 28 January 2015
32

Key Investment Highlights
Section 3

National presence with asset concentration in the most populous islands in Indonesia
Key investment highlights
1
2
3
5
6
4
13
Unique fibre network and DAS assets provide ability to deploy LTE solutions with superior economics
Predictable revenue stream and locked-in cash flows through long term contracts
7 Experienced management team and reputable Board
Favorable tower industry dynamics in Indonesia
Leading player in Indonesia tower industry
Rapidly diversifying client base towards Big-4 operators in Indonesia

19%22%
27%32%
54%
2011 2012 2013 2014E 2019E
106 219 418
681 1,017
1,497
2,183
3,149
2012
A
2013
A
2014
E
2015
E
2016
E
2017
E
2018
E
2019
E
~77
~87
~129
~162
2014E 2019ETowers ('000) Tenants ('000)
Tenancy ratio
Favorable tower industry dynamics in Indonesia
Strong growth in data traffic...
Mobile data traffic (PB)
...coupled with increase in data heavy smartphone penetration
Smartphone penetration in Indonesia, as % of subscribers
Source: Analysys Mason
High capex spending for Indonesian telcos compared to regional peers...
...limits free cash flows and highlights importance of an asset-light model
Rapid growth in data traffic is putting pressure on telco networks and capex and is driving operators to adopt an asset light model; thus fuelling growth of the independent towers leasing industry
32%
22%
15%12%
Indonesia Philippines Malaysia Singapore
Ave
rage
of C
apex
as
a %
of r
even
ue
Note: Average for Indonesia includes XL, Telkom and Indosat. Average for Philippines includes PDLT and Globe Telecom. Average for Singapore includes Singtel, M1 and Starhub. Average for Malaysia includes Maxis, Digi.com and Axiata
Source: Broker reports
Source: Analysys Mason
(a) Figures for Telkomsel are the mobile business; figures for Indosat and XL are for the entire telco business
Source: Company filings
2013 capex (IDRbn)
... fuels growth for the towers industry
1.7x 1.9x
Source: Analysys Mason
14
19,644
9,322 7,394
Telkomsel (a) Indosat XL
1
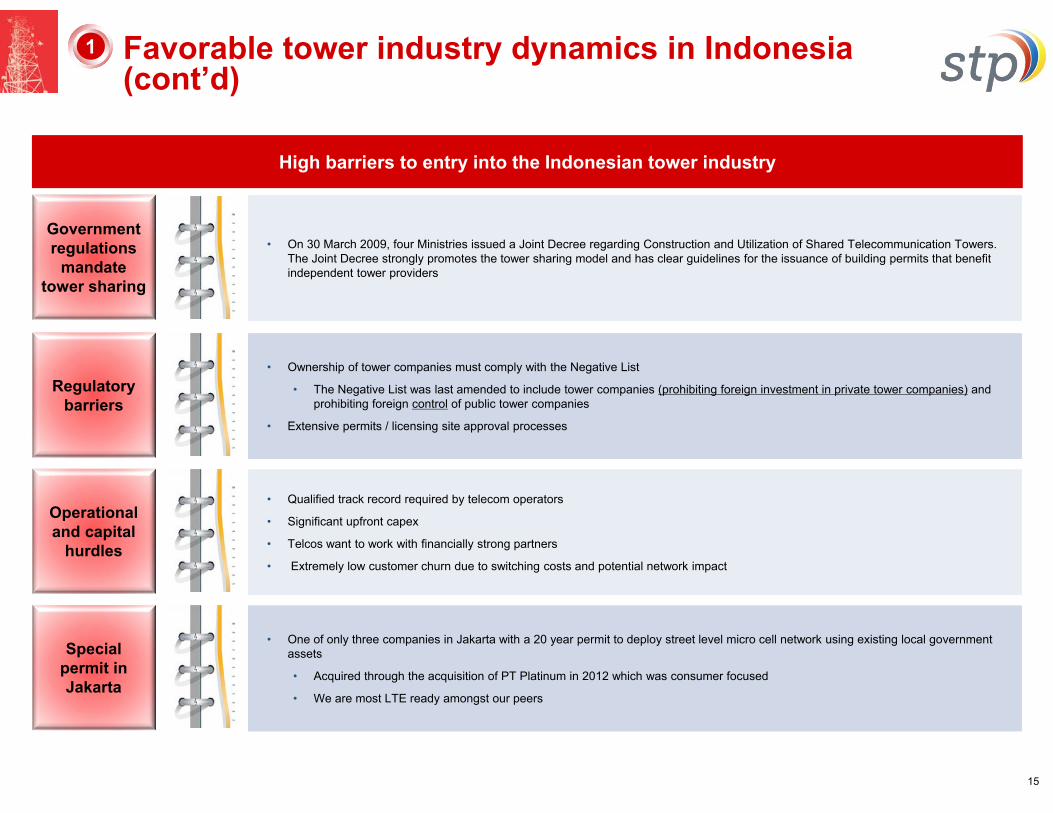
High barriers to entry into the Indonesian tower industry
Regulatory barriers
• Ownership of tower companies must comply with the Negative List
• The Negative List was last amended to include tower companies (prohibiting foreign investment in private tower companies) and prohibiting foreign control of public tower companies
• Extensive permits / licensing site approval processes
Operational and capital
hurdles
• Qualified track record required by telecom operators
• Significant upfront capex
• Telcos want to work with financially strong partners
• Extremely low customer churn due to switching costs and potential network impact
• Qualified track record required by telecom operators
• Significant upfront capex
• Telcos want to work with financially strong partners
• Extremely low customer churn due to switching costs and potential network impact
Special permit in Jakarta
• One of only three companies in Jakarta with a 20 year permit to deploy street level micro cell network using existing local government assets
• Acquired through the acquisition of PT Platinum in 2012 which was consumer focused
• We are most LTE ready amongst our peers
• One of only three companies in Jakarta with a 20 year permit to deploy street level micro cell network using existing local government assets
• Acquired through the acquisition of PT Platinum in 2012 which was consumer focused
• We are most LTE ready amongst our peers
Government regulations
mandate tower sharing
• On 30 March 2009, four Ministries issued a Joint Decree regarding Construction and Utilization of Shared Telecommunication Towers. The Joint Decree strongly promotes the tower sharing model and has clear guidelines for the issuance of building permits that benefit independent tower providers
• On 30 March 2009, four Ministries issued a Joint Decree regarding Construction and Utilization of Shared Telecommunication Towers. The Joint Decree strongly promotes the tower sharing model and has clear guidelines for the issuance of building permits that benefit independent tower providers
15
1 Favorable tower industry dynamics in Indonesia(cont’d)

Independent tower companies in Indonesia (number of towers(a))
STP is a leading player in the Indonesian tower industry
16
(a) No. of towers for Tower Bersama pro forma-ed for Mitratel deal(b) As of PF 9M 14 for STP and latest available 3Q 14 company filings for IBST, Protelindo and Tower Bersama (pre-Mitratel transaction)Source: Company data / filings / presentations / website
Leading player in Indonesia tower industry2
Scale
Strategic location
Tenant quality
Adjacent towers and businesses
• Following the completed acquisition of 3,500 towers from XL Axiata, STP has consolidated its position as one of the top 3 tower operators in Indonesia with 6,651 towers and 10,521 tower tenants (ex. BTel)
• 32% of STP’s towers are located in the Greater Jakarta area which has the greatest wireless subscriber density in Indonesia• 39% are located in Bali and the rest of Java, which is the most populous island in Indonesia
• Acquisition enhances quality of STP’s tower portfolio through increased exposure to XL• Big-4 operators contribute c.84% of STP’s revenue (PF 3 months ending 30 Sep 2014)
• Extensive 2,400km fibre optic network provides good positioning to support rollout of 4G technology• Pioneer to introduce DAS infrastructure that enhances tenants’ network coverage in urbanised areas
82%83%85%67%EBITDA margin(b):
2,104
6,651
11,21614,551
Inti Bangun Sejahtera STP Protelindo TowerBersama

Predictable revenue stream and locked in cash flows through long-term contracts
17
3
Source: Company filings
Predictable and locked-in
payments
Long term leases
Strong lease renewals
• Total contracted revenue of c.USD 998m locked in• Rental income received in advance, booked as deferred income, recognized as income on a
straight-line basis over lease term• Wireless network coverage and quality are key drivers of wireless subscriber acquisition and
retention• As STP maintains the right at all times to disconnect the wireless operators’ equipment due to
non-payment, wireless operators are strongly incentivized to pay their rentals and continue providing services to their subscribers
• As a result of their importance in the telecom operators’ cash flow waterfall, the Company has also managed to structure favorable master lease agreements, generally having tenors of no less than 10 years
• Average outstanding contract length of 7.4 years
• Minimal potential for customer churn at expiration date of the lease given the significant migration cost and service disruption to the respective customer’s network

Sumatra
JavaBali
Nusa Tenggara
Kalimantan
SulawesiPapua
National presence with asset concentration in the most populous islands of Indonesia
Tower assets are strategically located across key areas of Indonesia
Source: Company data
More than 90% of towers located on the most populous islands, Java and Sumatra
4
18
AreaNo. of towers Growth
2013 –20142012 2013 2014
Greater Jakarta 1,164 1,352 2,148 796
Java 566 984 2,241 1,257
Sumatera 142 227 1,483 1,256
Kalimantan -Sulawesi 32 100 409 309
Bali – Nusa Tenggara 25 118 351 233
Papua 17 17 19 2
Total 1,946 2,798 6,651 3,853
...and more than 3/4 of tower portfolio comprises of Ground based towers, which support higher tenancies with no additional capex
Greater Jakarta
32%
Other Java and Bali
39%
Sumatera22%
Others7%
Ground-based Towers: 78%
Microcell Sites: 5%
Rooftop Towers: 17%
XL41%
Telkom17%
Indosat5%
Hutch21%
Others16%
XL31%
Telkom24%Indosat
7%
Hutch12%
Others26%
Ericsson40%
Bakrie53%
Indosat3%
Telkom3% Hutch
1%Others<1%
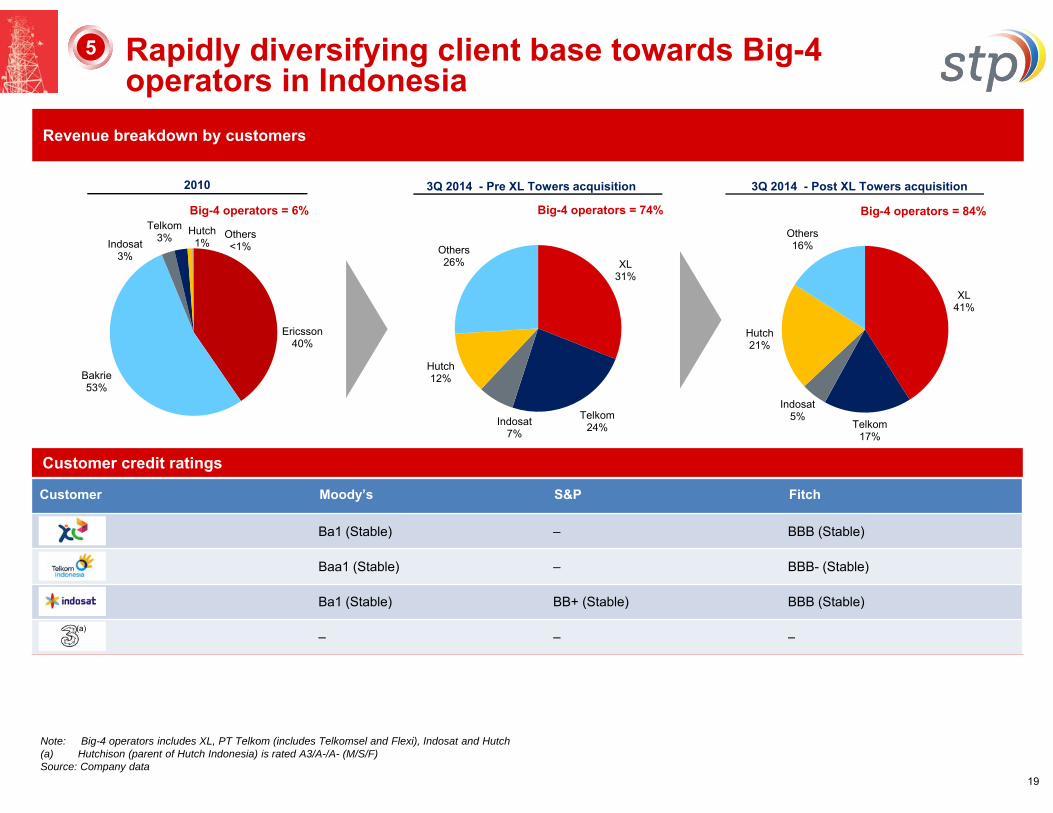
Revenue breakdown by customers
Rapidly diversifying client base towards Big-4 operators in Indonesia
5
19
Customer credit ratings
Customer Moody’s S&P Fitch
Ba1 (Stable) – BBB (Stable)
Baa1 (Stable) – BBB- (Stable)
Ba1 (Stable) BB+ (Stable) BBB (Stable)
– – –(a)
3Q 2014 - Post XL Towers acquisition2010
Big-4 operators = 6% Big-4 operators = 74% Big-4 operators = 84%
Note: Big-4 operators includes XL, PT Telkom (includes Telkomsel and Flexi), Indosat and Hutch(a) Hutchison (parent of Hutch Indonesia) is rated A3/A-/A- (M/S/F)Source: Company data
3Q 2014 - Pre XL Towers acquisition

Unique fibre network and DAS assets provide ability to deploy LTE solutions with superior economics
6
High quality portfolio of fibre assets
Fibre Optics Key benefits
c.2,400 km of fibre optic assets; of which c.1,300 km is located in Greater JakartaProvides fibre backhaul solutions to telecom operators, micro cell sites and economic last mile tower based solutions for OTT mediaWell positioned to support roll out of 4G technology (LTE)
More portable – operators can shift capacity from low utilisation areas to high utilisations areas to enhance performanceAbility to provide internet connection and cross sellLess additional investment requiredLimited amount of leasable fibre optic network capacity in Jakarta serves as an entry barrier to new competitors
20
DAS assets
Indoor DAS
DAS Key benefits
Pioneer tower company in Indonesia to deploy DAS technologyEspecially beneficial for highly urbanised areasDelivers cost effective, high performance GSM, CDMA and UMTS cellular coverageAllows the bulky and highly sensitive BTS equipment to be located at a centralised location known as a “BTS hotel”
Reduces installation and maintenance cost for both the tower operator and telecom operatorsExpands network footprint by adding coverage in hard-to-reach areasCustomers not required to make the capital investment to build their own network system or manage additional infrastructureBenefits the general public and the local government by improving the aesthetics of the towersActs as barrier to entry due to regulatory approvals and investments needed
26 67
Buildings Tenants Antennas
3,563
Papua
West Papua
North Maluku North Sulawesi
Central Sulawesi
Gorontalo
MalukuSouth East Sulawesi
West Sulawesi
South Sulawesi
East Nusa Tenggara
West Nusa Tenggara
Bali
East JavaYogyakarta
Central Java
West Java
Jakarta
Banten
East Kalimantan
Central Kalimantan
South Kalimantan
West Kalimantan
Riau Islands
Bangka Belitung
Lampung
South Sumatra
Bengkulu
Jambi West
Sumatra
Riau
North Sumatra
Aceh
NorthKalimantan
Provinces with overlaps between XL and STP
Provinces with XL presence onlyProvinces with STP presence only
Provinces with no STP and XL presence
FO Greater Jakarta
1,332 km
FO West Java
258 km FO
East Java68 km
FOSumatra 102 km
FO Submarine Batam Singapore
84 km
FOSubmarine
Anyer Kalianda
71 km
FO Submarine East Java – South
Kalimantan 483 km

Experienced management team and reputable Board (Board of Directors)
7
21
Eko Abdurrahman Juliawati Gunawan
Nobel Tanihaha
Tommy Gustavi Utomo Yan Heryana
Operations Director 3 years on the BoD
with 8 years of industry experience
Previously worked with PT Indosat Mega Media and PT XL Axiata
Finance Director 3 years on the BoD
with 21 years of relevant experience
Previously with Ernst & Young, 16 years of experience in auditing and corporate finance before joining STP
President Director 7 years on the BoD
with 10 years of industry experience
Previous work experience in the property and construction sectors in Indonesia, Singapore, Hong Kong and China
Project Management Director 1 year on the BoD with
15 years of industry experience
Previously worked with PT Bakrie Telecom Tbk
Marketing Director 2 years on the BoD
with 10 years of industry experience
Previously worked with PT Hariff Daya Tunggal Engineering and PT Starcom Solusindo, companies engaged in telecommunications

Experienced management team and reputable Board (Board of Commissioners)
7
22
M Senang Sembiring Ludwig Indrawan
Jennivine Yuwono
Thong Thong Sennelius
Erry Firmansyah
Independent Commissioner 3 years on the BoC
with 3 years of industry experience
Previously worked with PT Bursa EfekIndonesia (now IDX) as Director
Vice President Commissioner 2 years on the BoC
with 2 years of industry experience
Previously worked in property and financial sectors in Indonesia and Australia
Also serves as Managing Director of PT Smarts Home Anugrah
President Commissioner 3 years on the BoC
with 8 years of industry experience
Previously worked with Morgan Stanley New York and Singapore
Also serves as Director of PT Deltamas AbadiMakmur and Commissioner of PT Kharisma Indah Ekaprima
Commissioner 3 years on the BoC
with 10 years of industry experience
Previously worked with Morgan Stanley New York and Singapore
Also serves as Director of PT CiptadanaCapital and PT Ciptadana Multifinance
Independent Commissioner 1 year on the BoC with
1 year of industry experience
Previously served as the President Director of IDX
Currently serves as President Director of KSEI
Strong Financial Performance & Funding Headroom
Section 5

89%84% 83% 83% 83% 85%
70%67% 67% 69% 71%
76%
2010 2011 2012 2013 LQA 2014 PF LQA 2014
EBITDA EBIT
202 223354
582758
1,413
2010 2011 2012 2013 LQA 2014 PF LQA2014
286 331529
8401,074
1,859
2010 2011 2012 2013 LQA 2014 PF LQA2014
254 278442
693889
1,585
2010 2011 2012 2013 LQA 2014 PF LQA2014
Robust revenue and earnings growth
Revenue CAGR of >40% over 2010-2013 has outpaced that of competitors(IDRbn)
EBITDA expansion of c.40% p.a. over 2010-2013 has also outpaced that of competitors(IDRbn)
Similar trends observed for EBIT growth(IDRbn)
Robust margin levels of >80% on a EBITDA basis and c.70% on an EBIT basis
Note: LQA = Latest Quarterly Annualized (Q3 2014 X 4)Source: Company data
23

4.7x
1.9x
4.3x5.1x 5.3x
6.9x
Bersama Protelindo STP AmericanTower
CrownCastle
SBA
Year 2011 2013 2014Facility Size • c.USD120m • c.USD300m • c.USD790mCurrency • IDR • USD/IDR • USD
Margin • JIBOR + 450bps
• LIBOR + 300-400bps depending on covenant levels
• JIBOR + 350-450bps depending on covenant levels
• LIBOR + 175-195bps
FinancialCovenants
• Debt/ LQA EBITDA:3.0x stepping down to 2.25x
• DSCR: 1.2x• Debt/Equity: 2.5x
• Net debt/LQA EBITDA: 4.0x stepping down to 3.0x
• DSCR: 1.2x
• Net debt/LQA EBITDA: 5.5x
Banks
• SCB• RBS• CIMB• Mandiri
• >10 financial institutions including SCB, DBS, ING, Mizuho and BII
• SCB• HSBC• BNP• JPM• ING
Proven track record in raising debt financing Improving financing terms accompanied by growing support from the bank market
Prudent FX risk management policy in place
c.90% of USD loans hedged for FX risk
Plans in place to achieve 100% hedging of FX risks
Prudent financing and risk management profile accompanied by strong access to the bank market
Note: Figures expressed in IDRbn
(a) Proforma post XL tower acquisition Source: Bloomberg, Factset, Company data
Indonesia tower co. International tower co.
24
Leverage levels in-line with that of peers
Net debt / LQA EBITDA
293 902 907
2,787 2,778
7,939
229 255 589
2,250 2,445
6,849
2010 2011 2012 2013 Q3 2014 PF Q3 2014Total Debt Net Debt
(a)
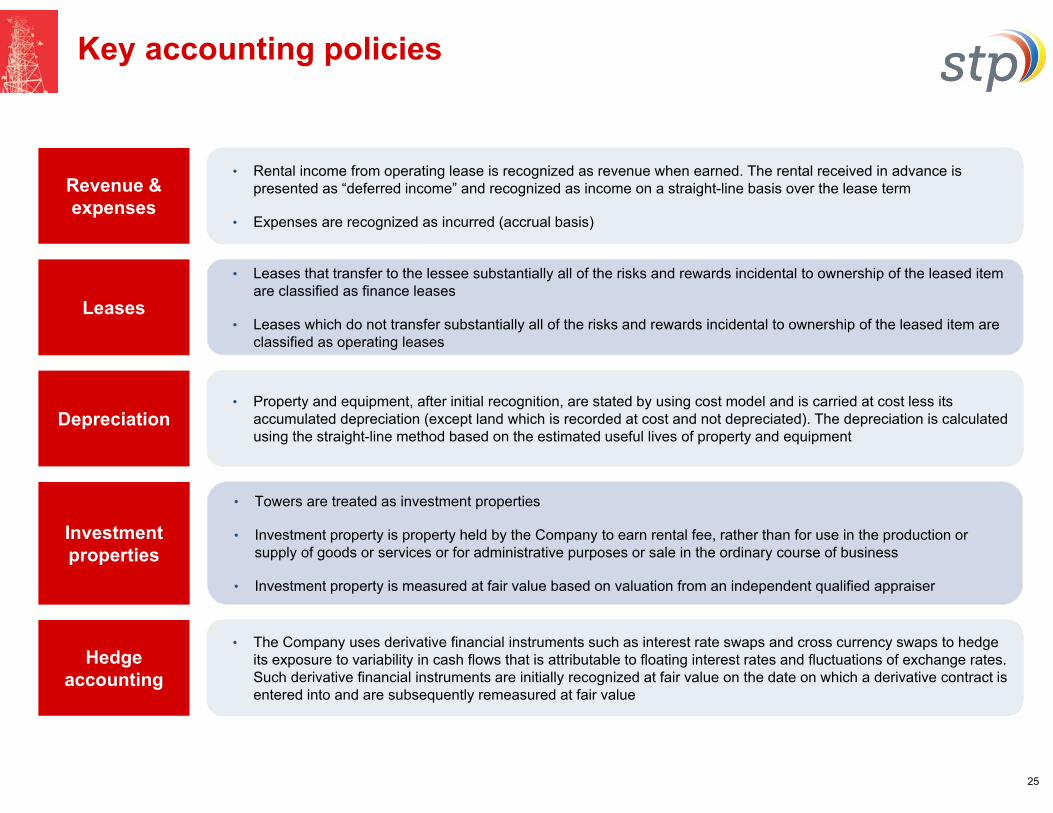
Key accounting policies
Revenue & expenses
Leases
Investment properties
Hedge accounting
Depreciation
• Rental income from operating lease is recognized as revenue when earned. The rental received in advance is presented as “deferred income” and recognized as income on a straight-line basis over the lease term
• Expenses are recognized as incurred (accrual basis)
• Leases that transfer to the lessee substantially all of the risks and rewards incidental to ownership of the leased item are classified as finance leases
• Leases which do not transfer substantially all of the risks and rewards incidental to ownership of the leased item are classified as operating leases
• Property and equipment, after initial recognition, are stated by using cost model and is carried at cost less its accumulated depreciation (except land which is recorded at cost and not depreciated). The depreciation is calculated using the straight-line method based on the estimated useful lives of property and equipment
• Towers are treated as investment properties
• Investment property is property held by the Company to earn rental fee, rather than for use in the production or supply of goods or services or for administrative purposes or sale in the ordinary course of business
• Investment property is measured at fair value based on valuation from an independent qualified appraiser
• The Company uses derivative financial instruments such as interest rate swaps and cross currency swaps to hedge its exposure to variability in cash flows that is attributable to floating interest rates and fluctuations of exchange rates.Such derivative financial instruments are initially recognized at fair value on the date on which a derivative contract is entered into and are subsequently remeasured at fair value
25

Well Positioned For Growth
Section 5
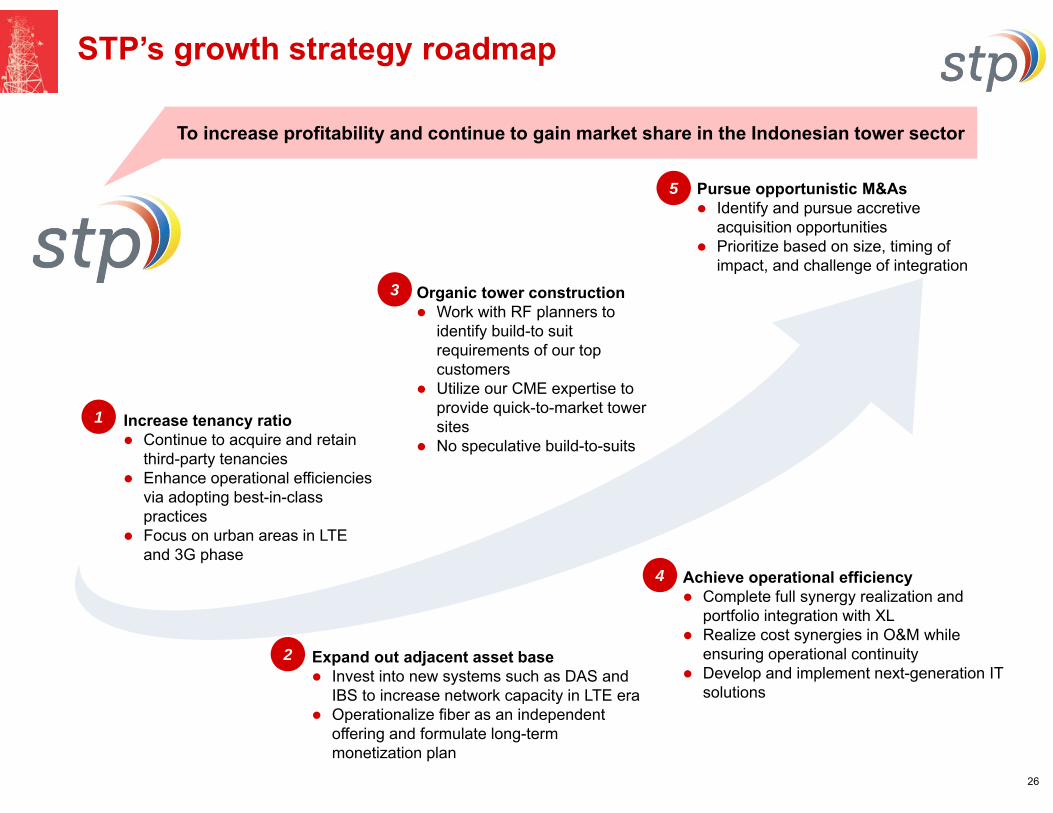
STP’s growth strategy roadmap
26
Increase tenancy ratio Continue to acquire and retain
third-party tenancies Enhance operational efficiencies
via adopting best-in-class practices
Focus on urban areas in LTE and 3G phase
1
Organic tower construction Work with RF planners to
identify build-to suit requirements of our top customers
Utilize our CME expertise to provide quick-to-market tower sites
No speculative build-to-suits
Pursue opportunistic M&As Identify and pursue accretive
acquisition opportunities Prioritize based on size, timing of
impact, and challenge of integration
Expand out adjacent asset base Invest into new systems such as DAS and
IBS to increase network capacity in LTE era Operationalize fiber as an independent
offering and formulate long-term monetization plan
Achieve operational efficiency Complete full synergy realization and
portfolio integration with XL Realize cost synergies in O&M while
ensuring operational continuity Develop and implement next-generation IT
solutions
To increase profitability and continue to gain market share in the Indonesian tower sector
3
4
2
5

Additional MaterialsAppendix I

Key financial performance
(in IDR millions)2009
(Audited)2010
(Audited)2011
(Audited)2012
(Audited)2013
(Audited)9M 2013
(Unaudited)9M 2014
(Unaudited)
9M 2014(Unaudited Proforma)
Revenues 197,426 286,366 330,956 529,408 840,096 600,339 779,601 1,368,059
Growth 405% 45% 16% 60% 59% 71% 30% 128%
Cost of revenue 11,172 16,866 23,679 41,705 70,809 51,084 68,271 115,050
Operating expenses 13,310 15,613 28,963 45,656 76,146 54,848 63,986 83,994
EBITDA 172,944 253,888 278,313 442,047 693,141 494,406 647,343 1,169,015
Margin 88% 89% 84% 83% 83% 82% 83% 85%
Depreciation and amortization (17,890) (52,056) (55,151) (88,144) (111,452) (82,169) (90,079) (120,623)
Operating income 155,054 201,832 223,162 353,903 581,689 412,237 557,264 1,048,392
Margin 79% 70% 67% 67% 69% 69% 71% 77%
Others – net 99,334 105,924 (47,134) (112,948) (313,561) (307,387) (1,026,365) (1,415,869)
Income before tax 254,388 307,756 176,028 240,955 268,128 104,850 (469,101) (367,477)
Income tax expenses (88,614) (77,345) (41,708) (65,251) (70,519) (29,001) 118,609 93,203
Profit for the year 165,774 230,411 134,320 175,705 197,609 75,848 (350,492) (274,274)
Other comprehensive income – – (37,994) (355) 89,811 6,783 (38,551) 10,422
Total comprehensive income for the year 165,774 230,411 96,326 173,350 287,420 82,632 (389,043) (263,853)
Source: Company data
27
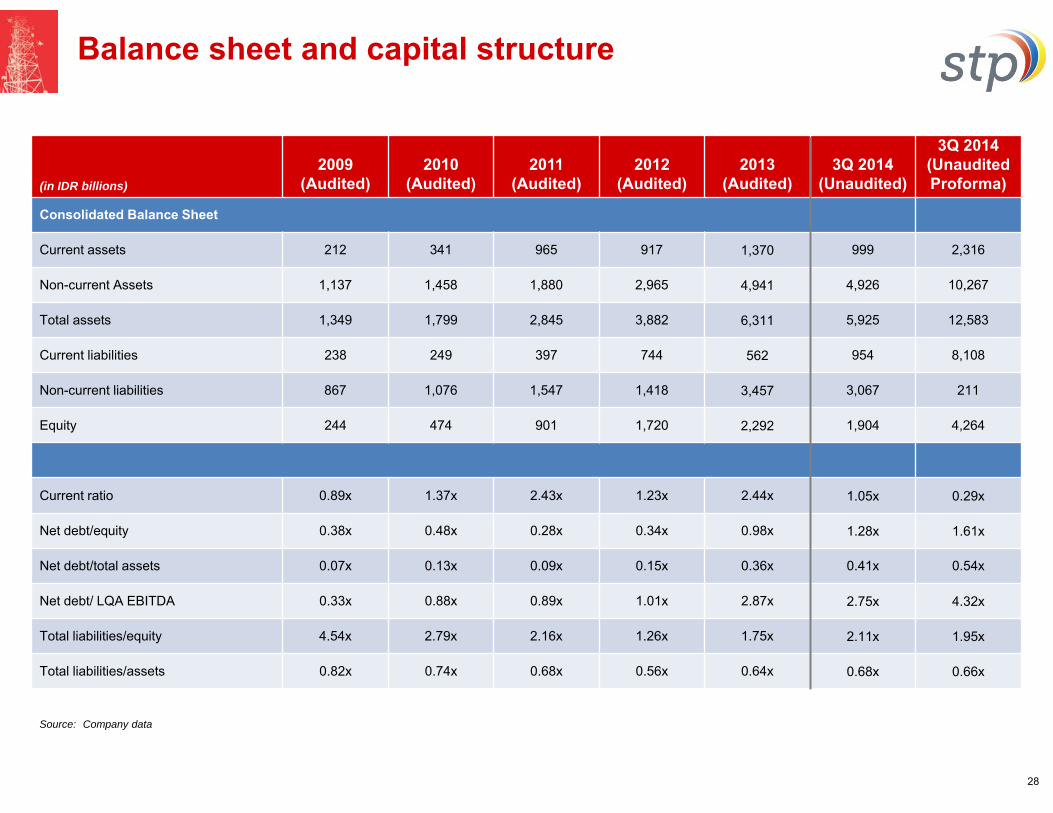
Balance sheet and capital structure
(in IDR billions)2009
(Audited)2010
(Audited)2011
(Audited)2012
(Audited)2013
(Audited)3Q 2014
(Unaudited)
3Q 2014(Unaudited Proforma)
Consolidated Balance Sheet
Current assets 212 341 965 917 1,370 999 2,316
Non-current Assets 1,137 1,458 1,880 2,965 4,941 4,926 10,267
Total assets 1,349 1,799 2,845 3,882 6,311 5,925 12,583
Current liabilities 238 249 397 744 562 954 8,108
Non-current liabilities 867 1,076 1,547 1,418 3,457 3,067 211
Equity 244 474 901 1,720 2,292 1,904 4,264
Current ratio 0.89x 1.37x 2.43x 1.23x 2.44x 1.05x 0.29x
Net debt/equity 0.38x 0.48x 0.28x 0.34x 0.98x 1.28x 1.61x
Net debt/total assets 0.07x 0.13x 0.09x 0.15x 0.36x 0.41x 0.54x
Net debt/ LQA EBITDA 0.33x 0.88x 0.89x 1.01x 2.87x 2.75x 4.32x
Total liabilities/equity 4.54x 2.79x 2.16x 1.26x 1.75x 2.11x 1.95x
Total liabilities/assets 0.82x 0.74x 0.68x 0.56x 0.64x 0.68x 0.66x
Source: Company data
28
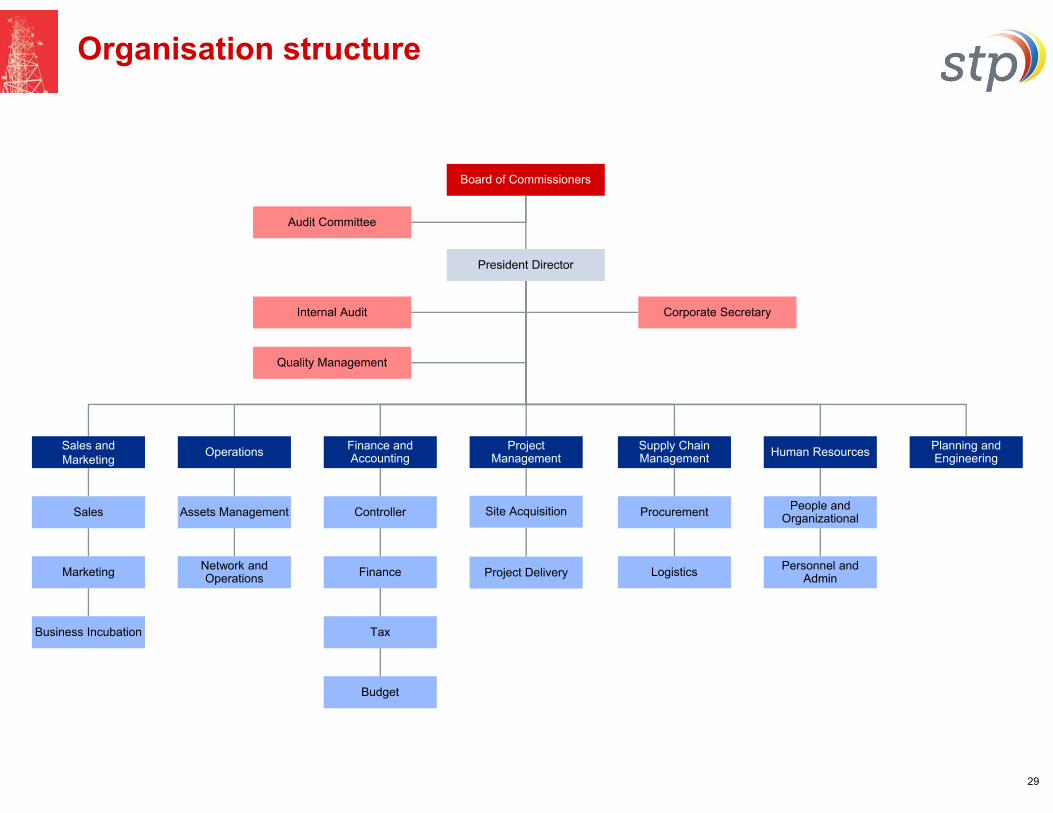
Organisation structure
Audit Committee
Board of Commissioners
President Director
Corporate SecretaryInternal Audit
Sales andMarketing
Sales
Marketing
Business Incubation
Operations
Assets Management
Network and Operations
Supply Chain Management
Procurement
Logistics
Project Management
Site Acquisition
Project Delivery
Finance and Accounting
Controller
Finance
Tax
Budget
Quality Management
Human Resources
People and Organizational
Personnel and Admin
Planning and Engineering
29

Overview of material agreements / contracts
30
Sets out key terms of contractual agreement with each customer
Establishes rights and obligations for both STP and customers‒ Pricing‒ Tenor‒ Escalation‒ Termination‒ Payment terms
Prepaid land lease contracts Generally for 5 to 10 years Escalation likely at each re-negotiation
stage Average life outstanding of 5.2 years
Location of towers Dimension, specification, and limits of
leased premises Definition of leased equipment Other location-specific items
Necessary for sale and lease-back transactions
Historically, acquisition of towers has been structured in tranches over a period of time, with options to switch sites where land leases are not extendable
Master Lease Agreement
Site Lease Agreement
Land Lease Contracts
Tower Purchase Agreement1b
1a
3
2
Telco 1
Telco 2
Telco 3
Landlord 1
Landlord 2
Telco
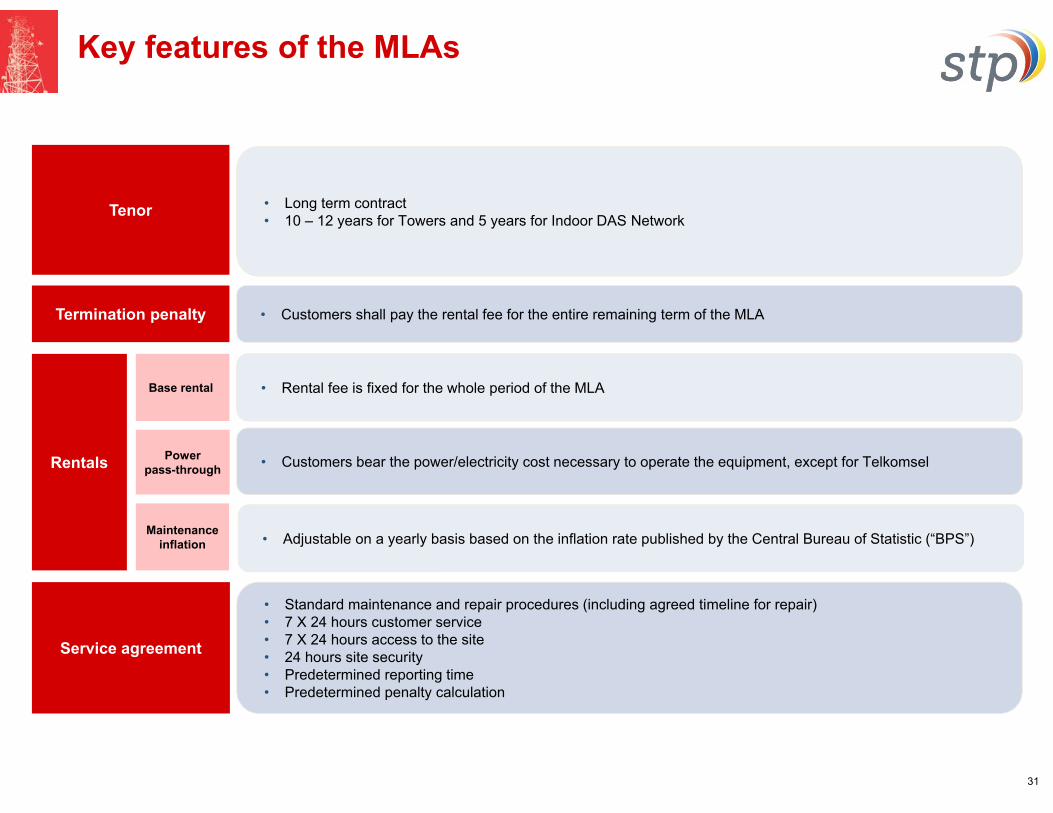
Tenor • Long term contract• 10 – 12 years for Towers and 5 years for Indoor DAS Network
Termination penalty • Customers shall pay the rental fee for the entire remaining term of the MLA
Rentals
Service agreement
• Standard maintenance and repair procedures (including agreed timeline for repair)• 7 X 24 hours customer service• 7 X 24 hours access to the site• 24 hours site security• Predetermined reporting time• Predetermined penalty calculation
• Rental fee is fixed for the whole period of the MLABase rental
Maintenance inflation
Key features of the MLAs
• Customers bear the power/electricity cost necessary to operate the equipment, except for TelkomselPowerpass-through
31
• Adjustable on a yearly basis based on the inflation rate published by the Central Bureau of Statistic (“BPS”)
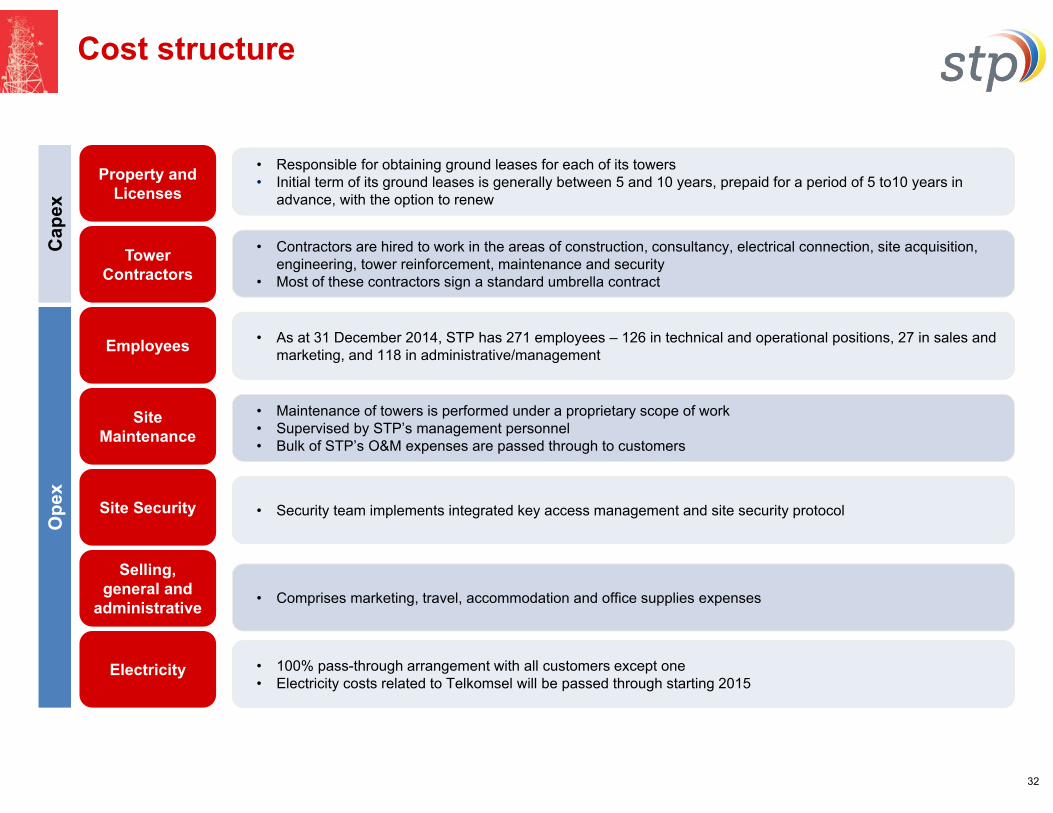
Cost structure
32
Cap
ex
Property and Licenses
Ope
x
Tower Contractors
Employees
Site Maintenance
Site Security
Selling, general and
administrative
Electricity
• Responsible for obtaining ground leases for each of its towers• Initial term of its ground leases is generally between 5 and 10 years, prepaid for a period of 5 to10 years in
advance, with the option to renew
• Contractors are hired to work in the areas of construction, consultancy, electrical connection, site acquisition, engineering, tower reinforcement, maintenance and security
• Most of these contractors sign a standard umbrella contract
• As at 31 December 2014, STP has 271 employees – 126 in technical and operational positions, 27 in sales and marketing, and 118 in administrative/management
• Maintenance of towers is performed under a proprietary scope of work• Supervised by STP’s management personnel• Bulk of STP’s O&M expenses are passed through to customers
• Security team implements integrated key access management and site security protocol
• Comprises marketing, travel, accommodation and office supplies expenses
• 100% pass-through arrangement with all customers except one• Electricity costs related to Telkomsel will be passed through starting 2015

Thank you