v115n11a13 the economics of exhaustible mineral resources ... · optimize a mineral resource...
TRANSCRIPT
IntroductionHenry Lazenby (2014) for the Mining Weeklywrites, ‘Bruised and battered, the globalmining industry today is undergoing a seachange. Practices and policies that might haveworked wonders in the past are not as relevanttoday, and new approaches to runningprofitable mining operations need to be found.’One significant practice the mining industryhad during the last commodities supercycle(2003 to 2011) was chasing volume at anycost; absolute output was deliberatelyprioritized over productivity considerations(Goldsmith, 2013). Lazenby contends that inthe face of falling and volatile commodityprices, many mining majors ‘across allcommodity groups are currently grappling withsagging profits and low company valuations.This is often regarded as the result of theindustry’s “sins” of the past, when companies
were in pursuit of growing their output at allcosts in a high commodity price environment.’Lee Hodgkinson, KPMG’s Canadian miningindustry leader and quoted by Lazenby, saysthat ‘mining companies are now trying to findthe right balance between optimizing currentoperations and preserving their agility to graspfuture opportunities. The runaway costs ofbuilding and operating mines have almostsqueezed out profit margins [whilst] lowergrades of ore are inflating production costs.Mining companies need to look at the businesswith fresh eyes, and develop strategies toattract equity capital as it seems clear thatsome of the traditional approaches to themining business are simply not workinganymore.’
It is the intention of this paper to challengethe practice of chasing production and toprovide an alternative practice in support ofminers ‘looking to optimizing currentoperations whilst preserving their agility tograsp future opportunities.’ To address thisissue the micro-economics of a miningbusiness are revisited, integrating multifariousconcepts to consider the optimal economics ofexhaustible mineral resources. Minnitt (2007)states that the challenge of the past has beenthat while much has been written on thesubject of classical economic concepts,adoption has been slow and limited. Minnittconcedes that in the past, academic literatureon the subject did not provide much in the wayof usable concepts and techniques, andconsequently practitioners relegated theseconcepts to academia with no practicalapplication in the real world. Moreover, in arelated publication he suggests that the subjectmatter is often shrouded in ‘complex
The economics of exhaustible mineralresources—concepts and techniques inoptimization revisitedby C. Hutton*
SynopsisThe last commodities supercycle (2003 to 2011) was characterized by abelief in volume at any cost, where absolute output was deliberatelyprioritized over productivity considerations. This practice fuelled over-optimistic forecasting and planning, which in turn contributed to theeconomic crisis that followed. The sudden collapse of commodity priceshas resulted in mining companies scrambling to find the right balancebetween optimizing current operations and preserving sufficient flexibilityto grasp future opportunities. The runaway costs of building and operatingmines have almost squeezed out profit margins, while lower ore grades areinflating production costs. Mining companies therefore need to look at thebusiness with fresh eyes, and develop strategies to attract equity capital astraditional approaches are simply not working anymore. This is especiallyso in the context of a dwindling investor base that continues to demandgreater returns, despite a significantly lower appetite for risk. This paperrevisits the micro-economic concepts and demonstrates how pressure fromshareholders to prioritize output contributed to spiralling costs and valuedestruction. Practical techniques are described to model cost curves tooptimize a Mineral Resource endowment and address the need to right-balance a business and preserve agility.
Keywordsproduction prioritization, economies of scale, u-shaped cost curves,optimal rate of production, maximum Mineral Resource utilization,sustainable gains, and sustainable shareholder returns.
* Brenthurst Capital Resources.© The Southern African Institute of Mining and
Metallurgy, 2015. ISSN 2225-6253. Paper receivedFeb. 2015; revised paper received Apr. 2015.
1083VOLUME 115 �
http://dx.doi.org/10.17159/2411-9717/2015/v115n11a13

The economics of exhaustible mineral resources
mathematics that detracts from its value and as aconsequence has not been as widely applied as mightotherwise be the case’ (Minnitt, 2004). Considering the needfor miners to ‘look at the business with fresh eyes’ andMinnitt’s concerns about the lack of usable concepts, thispaper seeks to address both challenges in pursuit of theoptimal economic extraction of an exhaustible mineralresource.
To do justice to this subject matter it is necessary toaddress it in three parts, namely:
� Part 1—Prioritizing of the rate of production� Part 2—Modelling the rate of production� Part 3—Integrating the rate of production with
economic mineral resource modelling.
Part 1 explores the prevailing hypothesis that increasingoutput will deliver continuing economies of scale compared tothe alternative hypothesis of Minnitt et al. that considers U-shaped cost curves implying an optimal level of production,while Part 2 addresses Minnitt’s lamentations that the toolsand techniques were not available at the time of writing hispaper and therefore adoption of his hypothesis was slow if, atall. The techniques articulated rely on accepted econometrictechniques and empirical data-sets. Part 3 focuses onincorporating the U-shaped cost curves in an integratedmodel to consider both the cost curve and an orebody’s ‘DNA’exemplified by a grade-tonnage curve to estimate themaximum value creation over the life of the orebody.
Prioritizing the rate of productionThe stagnation of commodity prices through the 1980s and1990s discouraged producers from investing in capacityexpansions. During the following decade global commodityprices soared, driven by strong demand from emergingeconomies, with the boom exceeding that of the 1970s inboth duration and magnitude (Connolly and Orsmond, 2011).Mining companies responded rapidly by prioritizing capacityexpansions to capture greater market share. This narrativesoon translated into ‘Go Big or Go Home’ as the prevailingrationale dictated that in addition to capturing a greatermarket share, increased scale also promised enticingproductivity gains that were simply too good to forego.Shareholders soon started rewarding those stock companiesthat could articulate growth strategies and large projectpipelines. Examples of this strategy included Anglo Platinum,who advised in 1999, that its ‘board has made the decision toincrease its production from the 1999 calendar year base ofsome 2 million ounces to 3.5 million ounces by the end ofcalendar year 2006.’1 As recently as 2013, Endeavour Miningexpanded the Tabakoto mill from 2000 t/d to 4000 t/d, whileBHP Billiton was considering further expansions at theworld’s largest mine, Olympic Dam.
Fast-forward to 2015, and mining companies that hadbeen riding the ‘supercycle’ of higher commodity pricessupported by demand from emerging markets now find thattheir profit margins are being eroded by falling commodityprices and out-of-control cost inflation. Their response has
been to announce aggressive cost reduction programmes thatinclude reducing headcount, closing unprofitable operations,and deferring capital expenditure to reduce cash costs. Whilethese actions ‘might be effective in reducing controllable cashcosts in the near term’, Goldsmith (2013) cautions that in thelong-term, ‘sustainable gains which depend on strongunderlying improvements in the efficiency of operations andinvested capital may be compromised.’ Ernst and Young(2013) bemoan that ‘the same investor base who so long agowas pushing for growth and rewarded those that had themost attractive growth pipeline, now has a lower appetite forrisk but at the same time is still is demanding greaterreturns.’ To be successful at restoring investor confidence,miners will need to more fully understand the potentialimpact of macro- and micro-events … and consider newapproaches to running profitable mining operations if theyare to continue to survive and thrive (Lazenby, 2014)
Two schools of thoughtWhile it is accepted that there is no single panacea for drivingsustainable profitability, one significant factor oftenoverlooked is the cost of not challenging the prevailinghypothesis of the micro-economics of the business of mining.Two key classical micro-economic concepts have beencontested during this last supercycle. While miners embracedthe concept that increasing rates of production would yieldgreater productivity and profitability, academics warned thatprioritizing mass production at all costs had a fatal flaw.Minnitt (2007) articulates the case for diseconomies of scalebeing realized, maintaining that beyond a critical level ofproduction total unit costs begin to rise, eliminating anyfurther gains and risking diminishing returns. In this sectionthe two hypotheses will be considered.
Support for prioritizing production at all costsRudenno’s (2008) work supports the notion of continuedeconomies of scale as production output is successivelyincreased. He derived what he describes as ‘power’ costcurves from a data-set of 95 mining development projectslocated in 33 countries. The data-set includes base metal,precious metals, coal, uranium, and iron ore projects. Anexample of one of these power curves is shown in Figure 1.An equation describing the regression curve in Figure 1 is:
U$/ton = 86.76 × T 0.851 [1]
where T is in Mt/a.Similar curves with best-fit regression lines have been
derived for capital costs, mining costs, and processing costs,differentiating between opencast and underground miningoperations. These regression equations have been applied byRudenno to determine expected capital investmentrequirements and associated total unit costs at different levelsof production. While Rudenno cautions that this toolrepresents an average that requires refinement, itnevertheless implicitly supports the hypothesis thatcontinuing economies of scale can be achieved with increasedlevels of production. To demonstrate this, Rudenno’sequation (Figure 1) is used to derive the classical micro-economic curves illustrated in Figure 2. (The micro-economictheory concepts of average total costs (ATC), average fixedcosts (AFC), average variable costs (AVC), and marginalcosts (MC) are well established in academic literature.)
�
1084 VOLUME 115
1http://www.angloplatinum.com/investors/invest_sub/press_def.asp?/CetegoryID=5&Related=True

In Figure 2, as the rate of production (described on thehorizontal axis) is increased, the ATC continue decreasing,implying continuing economies of scale. The benefits ofadopting this hypothesis are seemingly obvious in that ashigher volumes are mined, so lower ATC translate intoincreased profit margins which in turn translate intoincreasing shareholder returns. Most significantly in a risingprice environment, this benefit is amplified as increasedoutput/sales also attract increased revenue, compoundingprofit margins already inflated from gains realized througheconomies of scale. This hypothesis provided a compellingargument in support of ‘Go Big or Go Home’, and miners whoprioritized production during the last supercycle wererewarded by the market accordingly.
Support for an optimal rate of productionMinnitt (2007) proposed an alternative hypothesis of costresponse in relation to increases in production. Hereproduced an S-curve after Pappas and Hirschey (1985) andSesink-Clee (1991), describing the theoretical relationship ofcost to varying rates of production in absolute terms andillustrated in Figure 3. If q is the rate of production the totalcost, with fixed costs (FC) of 20, is given by Equation [2].
Total cost = 20 + 8q ‐ 2q2 + 1/3q3 [2]
With a commodity price of ZAR2 15 per ton, the totalrevenue (TR) is given in Equation [3].
Total Revenue = 15 x q [3]The equations are illustrated in Figure 3 indicating that
the cost curve is not linear in nature but rather concave. The total cost (TC) curve indicates that beyond nine units
of production, profits are negative and therefore no furthereconomic benefits can be achieved by further prioritization ofoutput. To compare Rudenno’s curve with those of Minnitt etal., the cost curves illustrated in Figure 3 are reduced to unitcosts consistent with classical micro-economic curves andillustrated in Figure 4.
The underlying hypothesis of these curves is clearlyevident and suggests that an optimal rate of production exists(4.5 in this example), beyond which point diseconomies ofscale are realized. The challenge, however, is that while thetheoretical basis has been demonstrated by Minnitt (2007),no empirical evidence was presented to support thishypothesis, as in the case for Rudenno.
Empirical evidenceMiners have been exhorted to better understand the macroand micro events contributing to the industry’s costs inflationif they are to survive. Minnitt (2007) has implicitly proposedthat a significant part of a mining enterprise’s inflation canbe attributed to rising costs related to increased productionthat extends beyond an optimal level of production, and thatprofitability is compromised beyond this optimal level. The2003 to 2011 supercycle can be considered a useful global‘experiment’ for testing the robustness of the hypothesis thatsignificant benefits can be achieved by prioritizingproduction, as exemplified by Rudenno’s curves.
Gravelle et al. of PwC (2014) published a report in whichthe financial performance of the world’s top 40 miners wasconsolidated. Figure 5 illustrates that for the period 2004 to2013, revenue increased at a compound annual growth rate(CAGR) of 11%, which was attributed to both risingcommodity prices and an expansion in output. On the costfrontier, total costs increased on a CAGR basis of 12%, while
The economics of exhaustible mineral resources
1085VOLUME 115 �
2ZAR: South African rands
Figure 1—An example of Rudenno’s power curves
Figure 2—Rudenno’s power curve showing decreasing average totalcosts, average fixed costs, and average variable costs as productionrates increase
Figure 3—Absolute cost and revenue curves total costs (Minnitt, 2007)
Figure 4—Classical micro-economic costs curves

The economics of exhaustible mineral resources
operating costs on a CAGR basis rose at a slightly lowerCAGR rate of 10%, albeit matching the trend in revenue. Thesteady increase in operating costs can conceivably beattributed to the general rise in costs as a result ofcompetition for high input factor costs.
The divergence in total costs and operating costsevidenced in the cost trends for the period is the result ofescalating non-cash line items such as depreciation,amortization, and impairment, which escalated by over7000% on a CAGR basis for the period. Despite being a non-cash item, these costs impact on shareholders’ returns insofaras they reduce profits legally available for distribution whilecash remains unavailable for distribution. It is often statedthat only cash costs are relevant, but it is argued that anybarrier to shareholders’ claims to cash should be consideredwith equal merit. One technique now being invoked to reducethe depreciation and amortization charge is to impair assetsand thus mask the redundancy of previous investmentactivity. Since miners were encouraged to increase capacityand invest in new mining projects it is not surprising thatdepreciation and amortization would also increase, butperhaps not at the rate reflected.
Despite the upward trend, the profitability of the top 40miners illustrated in Figure 6 for the period 2004 to 2011was significantly less than what shareholders could haveexpected had yields been maintained or improved. Sinceincreasing output was based on the premise that greatereconomies of scale would be achieved – implying improvedproductivity – financial yield metrics should have registeredpositive trends too. Counter-intuitively, free cash flow (FCF),return on equity (ROE), and return on assets (ROA),illustrated in Figure 7, all trended downwards for the mostpart of the commodity boom. Although profitability ‘bubbles’can be seen, these benefits were wiped out when massiveimpairments were raised in the accounts of miners, which inturn caused a free-fall in their respective share prices – allwell documented. Invoking the total shareholder return (TSR)metric for a period extending beyond 2011 will most likelydiminish the exuberance of the short-term gains posted andprovide a more sobering assessment of the strategy toprioritize production. That said, these profitability trendsbelie the fact that any productivity gains anticipated byprioritizing production were simply not realized, and ifanything, contributed to a macro and micro environment thatconspired to inflate costs exponentially.
In short, the empirical evidence does not support thehypothesis of continuing economies of scale as output isincreased. If anything, the progressive overall increase inproduction caused price disequilibrium in the macroenvironment for both input factors and ultimately theprecipitous fall in commodity prices as inventory stocksreached saturation. Any gains to shareholders evaporated,making a mockery of the notion of sustainable long-termsgains. Treadgold (2015) cites Citigold, who state thatcompanies such as Rio Tinto are ‘digging their own graves’with overproduction. Treadgold also writes that undeterredby the evidence, the mining industry ploughed ahead in whathas now become a self-destructive race to the bottom as big,low-cost miners chase market share so they can claim thetitle of ‘last man standing’.
Comparing the implications of the alternativehypothesesIt can be demonstrated that the prevailing hypothesis in themining industry, best articulated by Rudenno’s work, mayhave been a significant contributor to the sustained erosionof margins and profitability. Using Rudenno’s information, afinancial model was constructed to compare the effects andimplications of the two cost hypotheses described. By way ofdemonstration, Figure 8 illustrates two curves; the firstassumes constant economies of scale in line with Rudenno’swork, and the second, with an arbitrarily selected level/pointof cost inflexion, implies diseconomies of scale in line withMinnitt et al.
A number of metrics are detailed in the spreadsheet inFigure 8, the critical metrics being net present value (NPV),internal rate of return (IRR), capital investment, and totalaverage cost (TAC). Three points of measure are illustrated:A, B, and C.
�
1086 VOLUME 115
Figure 5—Revenue and cost profiles for PwC top 40 mining companies(PwC, 2014)
Figure 6—Cost profiles for PwC top 40 mining companies (PwC, 2014)
Figure 7—Profitability profiles for PwC top 40 mining companies (PwC,2014)

In this example and at a rate of production of 90 kt/month, point A reflects superior economic metrics whencompared to point C. By comparison, point A anticipates aNPV10% of US$389 million, an IRR of 103%, and a TAC ofUS$70 per ton. In contrast, point C reflects a NPV10% ofUS$322 million with an equivalent IRR of 92% and TAC ofUS$83 per ton. Considering these two outcomes, point Aundoubtedly represents superior returns and a rate ofproduction that should therefore be adopted. Surely the casefor prioritizing production is made?
If, however, the U-shaped cost curve of Minnitt et al. isoperative, an alternative set of economics will be realized fora rate of production of 90 kt/month and represented at pointB. The corresponding NPV10% at point B is US$189 millionwith an equivalent IRR of 59% and TAC US$112 per ton. Themetrics of point B are less compelling than the metrics ofpoint C, and herein lies the rub.
Firstly, adopting point A’s level of production in favour ofpoint C’s level of production requires a greater capitalinvestment. Secondly, if shareholders are advised that thereturns of point A are to be expected, when in fact the returnsof point B will be realized, management’s credibility willsuffer. Thirdly, the profit anticipated at point A will bediminished to almost half in this example, implying that anopportunity cost is foregone when compared to point C.Furthermore, while lower profits are registered, commodityoutput is greater comparing points B and C, feeding surplusproduct into the macro-economy, which arguably willcontribute to price reduction and further reduce profitability.Point C represents an optimal level of production achievingthe highest level of profitability while at the same timedelivering less product to market and thereby enablingequilibrium price stability.
DiscussionConsulting houses called upon to assist miners in thispredicament report that the tendency is to focus onproductivity improvement, cost control, capital allocation,improved portfolio planning, innovation and efficiency, andthe leveraging of available resources. In short: repackagedconsulting products with new spin. This paper, however,challenges a fundamental paradigm against the backdrop ofthe empirical evidence presented by PwC (2014). With thebenefit of hindsight it is difficult to see how increased outputachieved the investment returns anticipated by miners and
shareholders alike. From the evidence it seems thatincreasing output had the opposite effect on investmentreturns, as highlighted in the previous section, and thatignoring diseconomies of scale can result in unfulfilledexpectations and cause miners to invest in over-capacity thatcan never deliver the anticipated financial returns asenvisaged by the ‘Go Big or Go Home’ advocates. It is arguedthat while it may be tempting for some miners to rationalizethe causal relationship of industry inflation in macro-economic terms, concluding that they had little or no control,more astute miners may wish to reconsider the insights ofMinnitt et al. If this is indeed so, perhaps miners should beconsidering more fundamental questions such as:
� How to best extract maximum economic value fromexisting exhaustible resources in a sustainable mannerthat achieves the right balance between optimizingcurrent operations and still preserving their flexibilityto grasp future opportunities?
� How do miners optimally manage lower grades of orecontributing to production cost inflation in addition tocost increases related to micro- and macro-economicforces?
� How do miners minimize the pressures of having toreplace good orebodies with new discoveries?
� How do miners determine optimal levels of productionto ensure that investment activities yield maximumyield and avoid overcapitalization and redundancy?
� How do miners weather the commodity cycle andpreserve profit margins so as to avoid a repeat ofrecord impairments and keep non-cash costs in checkin order that profits can be distributed to shareholderswithout reverting to impairment strategies?
� How to profitably extend the life of existing projects tomaximize value considering that miners exploitexhaustible resources?
It has been established that Minnitt et al’s hypothesisimplies that expanding the capacity of production units to thepoint where diseconomies of scale are realized serves only tocompound inflationary effects as unit costs start risingindependently of industry cost pressures. Miners typicallyrespond to rising costs by high-grading their ‘endowments’,and more so when commodity prices start falling. Thisreaction inevitably leads to a vicious spiral as a high-gradingstrategy shortens mine life; and shortened mine life can
The economics of exhaustible mineral resources
VOLUME 115 1087 �
Figure 8—Continuing economies to scale versus economies followed by diseconomies of scale

The economics of exhaustible mineral resources
result in smaller mineable reserves, which in turn results inpremature exhaustion of mineral resources, leading to afurther round of impairments and accelerated depreciationcharges.
The author therefore agrees with Goldsmith (2013), whowarns that miners’ ‘… reaction of headcount reductions andexpenditure curtailment might be effective in reducingcontrollable cash costs in the near term, but that long-termsustainable gains depend on strong underlying improvementsin the efficiency of operations and invested capital.’ Toachieve this the author echoes Lazenby’s advice that in orderfor mining companies to survive in an increasingly hostileenvironment, ‘mining companies need to look at the businesswith fresh eyes … as it seems clear that some of thetraditional approaches to the mining business are simply notworking anymore.’
Part 2 of this paper will look at tools and technique toapply Minnitt et al’s hypothesis to empirical data-sets toestablish a foundation for an integrated modelling techniquefor mineral resources that will provide miners with the toolsto optimize operations while at the same time giving them theflexibility to take advantage of commodity cycleopportunities.
Modelling the rate of productionIn Part 1 of this discourse namely, revisiting the economics ofexhaustible resources, the case for considering Minnitt et al’s(2007) U-shaped cost curve hypothesis was presented andcompared to that of continuing economies of scale withincreased production exemplified by Rudenno’s (2008) work.Empirical evidence of the world’s top 40 mining companies,sourced from PwC, does not support the hypothesis ofcontinuing economies of scale as pursued by miners duringthe past decade. Considering yield trends (return on equityand return on assets) it is hard to see how shareholder valuecreation was a priority, as these metrics trends declined onaverage during the supercycle (2003 to 2011) for the top 40mining companies. Since this was not the expected outcome,Minnitts et al’s (2007) hypothesis of diseconomies of scalewas revisited and the implications of a U-shaped cost curveconsidered. Minnitt et al’s hypothesis provides a compellingcase for the micro-economic effects affecting and amplifyingcost inflation during the decade long supercycle.
The challenge for miners has been the ability to applyMinnitt et al’s (2007) hypothesis. Minnitt conceded that inthe past, academic literature on the subject did not providemuch in the way of usable concepts and techniques andconsequently practitioners relegated these concepts toacademia with no practical application in the real world.Moreover, in a related publication he suggests that thesubject matter is often shrouded in ‘complex mathematicsthat detracts from its value and as a consequence has notbeen as widely applied as might otherwise be the case’(Minnitt, 2004).
Minnitt’s challenge is now embraced and this sectionendeavors to describe practical techniques in applied micro-economics in deriving U-shaped costs curve from empiricaldata-sets. A graphical format is relied upon in an effort todemystify the mathematics and to demonstrate that theseconcepts and techniques are easily applied using moderndesktop computing.
Curve fitting and the selection of a functional formThe econometric technique of regression analysis is invokedto assist with deriving the classical curves. It is perhapsuseful to pause for a moment and consider the frame ofreference in the application of the econometric techniques andprinciples relied upon by the author. According to Studemund(1992), econometrics is the quantitative measurement andanalysis of actual economic and business phenomena. Heexplains that econometrics attempts to quantify economicreality and bridge the gap between economic theory andbusiness reality using techniques that bridge the gap betweenuseful concepts and practical methodologies. To this end,Studemund dedicates an entire book to the science of single-equation linear regression analysis (SLRA). While this is anexhaustive work, summarizing the basic principles advancedby Studemund is useful in that it provides a common frameof reference. The first and most significant step afterconsidering the quality of the empirical data-set in SLRA isthe selection of the functional form. In selecting anappropriate functional form, the following guidance isprovided by Studemund:
� Theoretical considerations usually dictate the form of aregression model;
� The basic technique involved in deciding on afunctional form is to choose a shape that bestexemplifies the underlying economic or businessprinciples and then to use the mathematical form thatproduces that shape
� The choice of a functional form is a vital part of appliedregression, requiring a good understanding ofeconomic theory and common sense.
A second and important point of reference that the authoroffers is the concept of ‘linear’ regression. While linearregression is often thought to be a linear construct (a straightline). it is significant to consider that many different‘nonlinear’ functional forms are used in linear regression,including exponential, semi-log, polynomial, and inverseexpressions among others in addition to the straight line.Linear regression therefore refers to an equation that is linearin its coefficients rather than linear in its variables. Thisimportant note is significant as it provides the basis of thetechnique described below. A quadratic function, for example,can therefore be used in SLRA to describe a particulareconometric function and still honour the rules of linearity.When considering micro-economic theory and Minnitt et al’shypothesis, the U-shaped cost curve can be described by aquadratic equation that can be used in an SLRA construct.For the purposes of this paper these principles are accepted,but for fuller discourse of this field of study the reader isreferred to Studemund (1992).
To scientifically apply SLRA, Studemund outline thefollowing steps:
1. Model specification (functional form)2. Data collection (sufficiently descriptive, sufficiently
granular)3. Estimation and evaluation of the equation (Excel
regression tool)4. Results (interpretation based on common sense).This framework is adopted and described below to derive
Minnitt’s U-shaped cost curve based on an empirical data-set.
�
1088 VOLUME 115

Derivation of u-shaped cost curves from empiricaldataModel specificationKohler (1992) describes three micro-economic functionalforms, namely: constant economies to scale, continuouseconomies to scale and economies/diseconomies to scale,with the latter option defining U-shaped cost curves. In Part 1of this discourse two functional forms were considered andcompared, namely: continuous economies to scale best,described by Rudenno’s work, and economies/diseconomiesdescribed by Minnitt et al. Constant economies is notconsidered as empirical data, suggesting that mining costs doindeed benefit from increased output, but perhaps notwithout regard to Minnitt et al’s hypothesis.
Data collectionThe empirical data used was sourced from a reputable miningcompany and describes the production rate and cost per tondata for the period 2004 to 2006 for a single mine. Beforeusing this data it was normalized to account for inflation,with the base year being 2006. This data is plotted on thetheoretical curve in Figure 9.
Estimation and evaluation of the equationFigure 10 describes four key steps in the derivation of thecost curve based on an empirical data-set. The tableformulated in Step 4 is similar to Minnitt’s construct and isgraphically illustrated in Figure 9. The average cost curvewith its marginal cost curve are plotted reflecting the classicaleconomic curves described by scholars after Minnitt (2007)and Kohler (1992). Steps 1 and 2 illustrate the normalizationof unit cost data collected for the period 2004 to 2006, whileStep 3 adopts a polynomial expression, namely x2 + x + c,
based on the theoretical understanding after Minnitt et al.The derivation of this curve is relatively simple given theprinciples of SLRA and desktop computing. The standardExcel regression toolkit was used to derive the regressionequation. The polynomial functional form selected is basedon economic theory after Studemund (1992).
ResultsIn this ‘real world’ example, the average cost curve isintersected by the marginal cost curve at a rate of productionof 265 kt/month. Considering the plotted data points from thedata-set (green circles), the inference is that economies ofscale can still be achieved by increasing the rate ofproduction to 265 kt/month. In the context of this paper, 256kt/month is the optimal rate of production beyond whichdiseconomies of scale will be realized, implying that beyondthis point of production, unit costs will start rising.
The economics of exhaustible mineral resources
VOLUME 115 1089 �
Figure 10—Summary of SLRA steps applied
Figure 9—Derived average cost and marginal cost curves fromempirical data

The economics of exhaustible mineral resources
DiscussionMinnitt (2007) bemoaned the fact that miners were slow toadopt classical micro-economics for two reasons: the toolsand techniques were unavailable; and the concepts were oftenshrouded in complex mathematics. It has been conclusivelydemonstrated above that this is no longer the case and thatprovided historical costs have been retained, miners can veryeasily apply the technique outlined. Importantly, and havingdemonstrated the techniques and tools and how accessiblethese are, it is probably worth considering Studemund’scautionary remarks with regard to black-box thinking andthe importance of critical evaluation. Studemund states that:‘… Any good econometrician is one who can diagnose faultsin a particular approach and can figure out how to repairthem. The limitations of regression analysis must be fullyperceived and appreciated when using the technique and itsfindings ... [which can largely be overcome by] a goodunderstanding of economic theory and common sense.’ It isprobably appropriate to state too that in the world ofestimation it is common sense to understand that results areapproximations with inherent windows of error, andtherefore this technique seeks to achieve results that areapproximately correct rather than precisely incorrect – toinvoke an old proverb.
This technique has not, however, been without its critics.Some mining practitioners have suggested that Studemund isincorrect in his position that economic theory should dictatethe functional form and that the functional form shouldrather be determined by considering the data and its spread.The illustration above (used to demonstrate the technique)exhibits data that posts to the left of the point of inflexion ofthe average cost curve, and no data-points are exhibited tothe right of the point of inflexion. As a consequence, somemining practitioners have been quick to dismiss thetechnique as flawed on the basis that the curve seeminglydoes not honour the data.
While the issue of data not exhibiting to the right of thepoint of inflexion may cause some practitioners some unease,it is argued that incomplete data-sets should not be the singlejustification for dismissing this technique. Indeed, whenconsidering Studemund’s work and the widely usedtechnique of SLRA notwithstanding Minnitt et al’s work, it isargued that this technique has the necessary theoretical andapplied support. Moreover, consideration should be given tothe fact that this curve represents a pre-2011 data-set, and islikely to now exhibit data-points beyond the point ofinflection, assuming the interpretation of the empirical datasupplied by PwC is correct.
Despite this argument it is conceded that there may becontinued reluctance by mining economists to adopt Minnittet al’s hypothesis and the techniques described above untilsufficient examples of data-points to the right of the inflexionpoint are forthcoming. Post the recent commodity supercycleand considering that the prioritization of production did notrealize the anticipated results and financial returns (whenconsidering the empirical data presented by PwC), perhaps itis now an appropriate time to re-run this technique on largerdata-sets to provide practitioners with the required comfort.Mining companies that are looking at the business with fresheyes and who are willing to challenge some of the traditional
approaches may wish to reconsider the causal relationshipbetween increasing production and anticipated economies ofscale.
A second topic of importance is the consideration that theabove analysis has only considered costs with respect to, andrelated to, ore tons. While it can be easily argued that the costper ton of ore is the appropriate metric to understand inputcosts, consideration has to be given to cost per output of thecommodity mined, namely: cost per ounce, cost per poundetc. Failure to consider both cost metrics may also lead toresults that do not yield desired outcomes. The challenge isprobably best explained as follows.
Whilst costs are generated by volumes of ore tons mined,the ultimate measure of performance is cost per unit ofcommodity mined. To confirm this, most (if not all) industrycost curves exhibited by market analysts consider only thecost per unit of commodity produced. It is therefore worthhighlighting that this metric is complicated by the fact thatsome producers who may be cost-inefficient on a cost per oreton basis are saved by virtue of mining a high-grade oredeposit. Cost efficiency and cost discipline therefore can onlybe measured on a cost per ore mined/processed basis ratherthan on the cost per unit of commodity produced. Not to doso is to disguise the opportunity cost of ill-discipline.
To illustrate this concept attention is drawn to Figure 11,which attempts to explain the dilemma graphically. Forexample, if one had two identical gold deposits (or copper,nickel, etc.) and one was high grade while the other lowgrade, and both produced the same output or rate ofproduction, then the low-grade deposit would post a highercost of production as compared to the higher grade depositusing the US$/ounce metric. Perversely, the lower costproducer could be the more cost-efficient miner whenmeasured on a cost per ore mined/processed basis. Fourdifferent scenarios can be determined given this construct.Figure 11 illustrates the issue:
� Frame (1) depicts reductions in unit costs for both oretons produced and the cost per unit of commodity. Bothtrends are negative sloping, implying that trueeconomies of scale are being achieved
� Frame (2) illustrates where diseconomies of scale arebeing realized as both metrics show a positive trend,being the scenario that miners would wish to avoid
� Frame (3) describes a scenario where production tonsare prioritized at the expense of commodity tons – inessence the deposit is not being managed to achievethe maximum shareholder returns. Possible reasonscould be that either that significant dilution is beingrealized or the average mined grade of the deposit issuboptimal
� Frame (4) depicts the mirror image of scenario 3 andcould be the result of high-grading the mineralendowment to drive short-term cash flows at theexpense of life of mine and sustainable long-termreturns.
By extension of this logic and referencing metrics fromthe integrated modelling technique, presented below, it can bedemonstrated that increasing the grade without considerationto reducing the rate of production is harmful to futurereturns. In column 1 (Figure 12) and having applied the
�
1090 VOLUME 115

hypothesis of continuing economies of scale, it is anticipatedthat 12.7 thousand ounces of gold per month (kozpm) will beproduced at an operating cost (including royalty fees) atUS$78.64 per ton and an associated US$ 556.92 per ounce. Ifthe reality is that a U-shaped cost curve is operative andkeeping the same rate of production and grade constant, themetrics realized will be US$123.08 per ton and US$871.62per ounce(column 2). If in fact this is the reality thentypically miner will raise the cut-off grade to increase theaverage grade in an effort to reduce unit costs – being costsper ounce in this case (column 3). This strategy does notaffect the cost per ton, which remains at US$123 (column 4).However, the cost per ounce falls from US$871.62 to US$691.14. This is typically termed high-grading and is a usefulstrategy to generate near-term cash flows but is not withoutlong-term consequences. High-grading affects life of mine,and in this example it is almost halved from over 6 years tojust under 4 years with present values increasing onlymarginally (column 3) from US$412 million to US$462million. Increased NPV is often cited as a good enough reasonto support a particular strategy, but this should always beconsidered in the context of alternative strategic outcomes. Itis noteworthy that the practice of high-grading results insimilar economic metrics when mining at a rate of 30 kt/month (ktpm) (column 5), but with the exception that miningat 30 kt/month leads to a longer life of mine and is thereforea superior strategy to high-grading. High-grading alsointroduces another significant business risk, namely that theshorter the life of a deposit the greater the risk with respect toreplacing it with a similar or better deposit, notwithstandingthat additional development capital investment is required.High-grading is therefore not a sustainable strategy and isharmful to shareholder returns even if it generates highernear-term cash flows. Given this example, the only feasibleand sustainable strategy would be to reduce the rate ofproduction (assuming that a U-shaped cost curve isoperative) to harness economies of scale and increase
profitability. Column 4 illustrates that the average minedgrade of 4.75 g/t is lower than the high-grading strategy of5.54 g/t and yet produces a higher present value as a resultof lower unit costs; US$92.64 per ton and US$606.68 perounce.
PwC, quoted in Part 1 of this paper, was critical of short-termism and stated that while ‘miners’ current survivalactions may be effective in reducing controllable cash costs inthe near term, long-term sustainable gains which depend onstrong underlying improvements in the efficiency ofoperations and invested capital may be compromised. Thediscussion relating to Figure 3 can be summarized below inFigure 4. Frame 1 represents true economies of scale as bothmetrics (ore unit costs and commodity unit costs) fall intandem. Frame 2 illustrates the scenario where diseconomiesof scale are realized and should be avoided. Frame 3represents a strategy where cost per unit of ore reduceswhilst the cost per unit of commodity rises. This typicallyhappens when miners focus on driving the unit cost of oreproduction down at the expense of grade and is perhaps themost unprofitable strategy as the reduction in grade causesthe production cost of the commodity produced to spiral,thereby negatively impacting on revenue. Frame 4 describes ahigh grading strategy described above where the unit cost ofthe commodity produced reduces whilst the unit cost of oremined spirals upwards.
This discussion with respect to Minnitt et al’s workhighlights the fact that if economies of scale are consideredwithout regard for the commodity being mined, thenachieving economies of scale for every ore ton mined mayresult in an outcome illustrated in Frame 3 of Figure 4, beingthe least desirable outcome after Frame 2. Minnitt et al’sframework does not consider this and assumes a fixed gradeand mineral endowment. Previous work by Minnitt (2004)does consider the optimization of the cut-off grade, but hedoes not integrate the two concepts. In Part 3 a framework ispresented integrating the derivation of the optimal cut-offgrade with the concept of economies of scale and adopting aU-shaped cost curve.
Integrating the rate of production with economicmineral resource modellingGuzman and Bhappu (1995) concluded that net present value(NPV) and internal rate of return (IRR) criteria were the mostcommonly used metrics for mining investments whilepayback period was a secondary, albeit important,consideration. NPV is a rigorously definable concept thatmaximizes the total wealth and is therefore the most suitableelementary objective to be maximized in the estimation of theeconomically optimum production capacity. It is, however,recommended that the assessment of a proposed miningventure should be supplemented by the measures of wealthgrowth, payback period, and payback time lag. In consideringMinnitt et al’s (2007) hypothesis it was noted that the authorconsidered that the discussion by Minnitt on economies ofscale was divorced from determining cut-off grade andtherefore determining the maximum grade and payability ofan exhaustible resource. It was shown that two cost metricsprevail as they relate to cost in mining economics, namely:cost per ore unit and cost per unit of commodity produced.
The economics of exhaustible mineral resources
VOLUME 115 1091 �
Figure 11—Cost per ounce vs. cost per ton of ore processed
Figure 12—Cost scenarios

The economics of exhaustible mineral resources
Optimizing one without regard for the other will – in theauthor’s opinion – lead to a suboptimal result in maximizingNPV. What is required is a formulation that considers boththese metrics and demonstrates how present value and thenNPV can be maximized. Van Heerden (2015) offers amodelling concept that resonates a simple yet sophisticatedoutcome. Van Heerden demonstrates the underlying grade-tonnage curve which can be used to compute the profitmaximizing cut-off grade that is peculiar to a specific mineralresource. However, by combining both Minnitt’s and VanHeerden’s work into a single integrated modelling tool, theauthor believes that a superior outcome is achieved in theeconomic modelling of a mineral resource.
Three-dimensional optimization modelling of anexhaustible resource At the heart of this integrated technique is the use of a grade-tonnage curve to determine the optimal moments that can besupported by any given resource. It is argued that thesignature of any geological deposit is measured by a grade-tonnage curve, which is useful to incorporate into aneconomic model. Grade-tonnage curves (Figure 13) arecommonly generated by resource scientists using acceptedestimation techniques such as kriging. Secondly, it is alsoassumed that the estimation technique allows for theconstruction of a grade-tonnage curve.
A grade-tonnage curve (GTC) graphically profiles thecumulative distribution of grade to tonnages and shows atlower cut-offs (Point A) that utilization of an exhaustibleresource is high with a corresponding high payability and byimplication rates of development are low as selectivity is low,but the opposite is true at high cut-off grades (Point B)(Minnitt, 2004). Importantly, the life of mine for the latter isshorter than for the former proposition defined by the cut-offs. While it is beyond the scope of this paper, save forcompleteness of thought, it should be noted that the slope ofthe GTC is affected by both the natural grade dispersion aswell as the selected support size used in the estimation. Thispoint is an important consideration when invoking thistechnique in optimizing the rate of production using orebodyeconomics, as it may influence the selection of mining
method, which in turn will have an effect on the rates ofproduction.
Considering the dilemma between the costs of a unit ofore versus the cost of a unit of commodity mined asdiscussed earlier, the challenge is to determine the optimaltrade-off between grade mined and payability of the mineralendowment. Simply put, miners have to consider the besttrade-off between exploiting the endowment (Point A) versusPoint B (illustrated in Figure 13) with the objective ofmaximizing NPV. Too high an average grade of productionwill result in a shortened economic life of a deposit, while toolow a grade will result in suboptimal returns on investmentsince that longer life investments are affected by the discountrate.
The determination of the point where the highest gradecan be mined for the longest period of time speaks to optimalvaluation moments and maximum economic utilization. Byintegrating macro-economic concepts in the determination ofan optimal ‘cut-off’ for an exhaustible resource, themaximizing moments can be easily demonstrated with a viewto balancing the trade-offs between Points (A) and (B).
Model integration detail explainedFigure 14 depicts a spreadsheet representation of a grade-tonnage curve in the first instance. It illustrates a simplespreadsheet model integrating the U-shaped cost curve in thedetermination of an optimal cut-off grade to maximize theaverage grade mined for the maximum life and in so doing,maximize the NPV of a mineral endowment. The example is
�
1092 VOLUME 115
Figure 13—Grade-tonnage curve
Figure 14—Economic optimization of an exhaustible resource
based on a real-world data-set for a gold mine in Africa andexplains how the grade-tonnage curve and U-shaped costcurves can be integrated into a single economic model.
In column 1 of Figure 14 the ‘cut-off’ grade, defined asthe minimum grade defining the cumulative tonnage of aresource, is recorded. In column 2 the cumulative tonnage ofthe mineral resource corresponding to the cut-off grade incolumn 1 is described. Column 3 describes the in situ tenor(in this case gold ounces) corresponding to the cumulativetonnage, while column 4) describes the cumulative per centor payability of the mineral resources at varying cut-offs.Column 5 shows the corresponding average grade of thecumulative mineral resource at the corresponding cut-offgrade. Columns 1 to 5 contain data that is typically generatedby an estimation technique used by geostaticians describingthe mineral endowment.
Typically at this point the resource is then handed over toengineer a mining reserve. It may be useful to revisit thedefinitions of a Mineral Resource and Mineral Reserve and toindicate that these concepts do not imply that the definitionof a Mineral Reserve represents the value maximization of amineral endowment. A Mineral Resource is typically definedas the mineralization and natural material of intrinsiceconomic interest which has been identified and estimatedthrough exploration and sampling and that has reasonableprospects for economic extraction. Mineral Reserves maysubsequently be defined by the consideration and applicationof technical, economic, legal, environmental, socio-economic,and governmental factors. By this definition, the reserve doesnot have to represent an economically optimized outcome todeliver maximum shareholders returns; rather it merely hasto show reasonable economic returns.
It is argued that in many instances optimal economicmoments are not considered and a Mineral Resource is oftensimply converted into a Mineral Reserve without regard fordetermining optimal moments to achieve maximumsustainable returns. It is argued that if micro-economicconcepts are not integrated with an ore deposit’s ‘DNA’represented by a grade-tonnage curve, it is unlikely that amineral endowment has been optimized.
To this end the construct, column 6 onwards in Figure 14describes how optimal economic moments can be determinedwithout the noise of complicated mathematics. Assuming agold price of US$1300 per ounce, the quantum revenuemoments along the grade-tonnage curve can be computedand represented in column 6. Column 7 represents a royaltyrate applied and is self-explanatory, while operating costs
(column 8) are considered static through the grade-tonnagecurve for a fixed production rate. Column 9 represents theoperating profit, which is the difference between revenue andcosts, namely column 6 less columns 7 and 8. The life ofmine is computed by dividing the cumulative tonnage atvarying cut-off grades with the selected rate of productionand is represented in column 10. Multiplying the life of minewith monthly profit, life-of-mine profit is calculated (column11). Finally, column 12 describes the life-of-mine profits at adiscounted rate. This then represents the basic mechanics ofan integrated model invoking micro-economic concepts withthe concept of a grade-tonnage curve to determine optimalmoments for maximum economic utilization of anexhaustible resource.
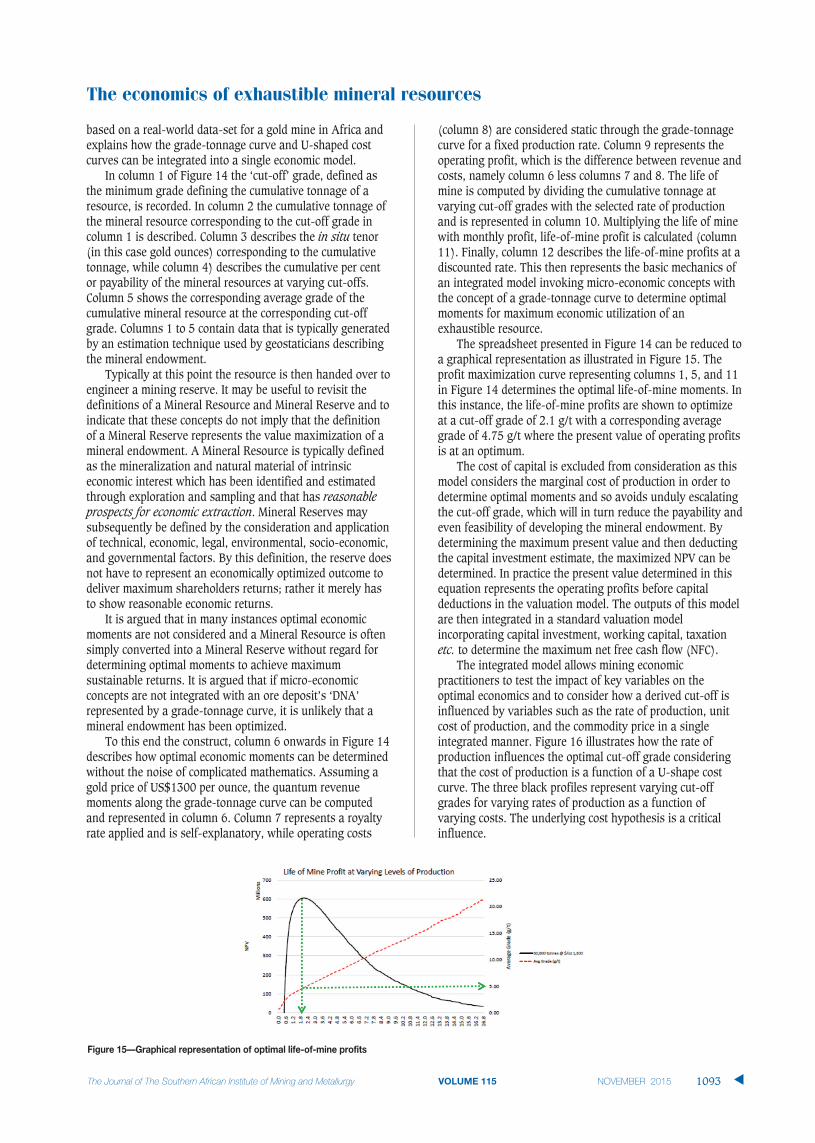
The spreadsheet presented in Figure 14 can be reduced toa graphical representation as illustrated in Figure 15. Theprofit maximization curve representing columns 1, 5, and 11in Figure 14 determines the optimal life-of-mine moments. Inthis instance, the life-of-mine profits are shown to optimizeat a cut-off grade of 2.1 g/t with a corresponding averagegrade of 4.75 g/t where the present value of operating profitsis at an optimum.
The cost of capital is excluded from consideration as thismodel considers the marginal cost of production in order todetermine optimal moments and so avoids unduly escalatingthe cut-off grade, which will in turn reduce the payability andeven feasibility of developing the mineral endowment. Bydetermining the maximum present value and then deductingthe capital investment estimate, the maximized NPV can bedetermined. In practice the present value determined in thisequation represents the operating profits before capitaldeductions in the valuation model. The outputs of this modelare then integrated in a standard valuation modelincorporating capital investment, working capital, taxationetc. to determine the maximum net free cash flow (NFC).
The integrated model allows mining economicpractitioners to test the impact of key variables on theoptimal economics and to consider how a derived cut-off isinfluenced by variables such as the rate of production, unitcost of production, and the commodity price in a singleintegrated manner. Figure 16 illustrates how the rate ofproduction influences the optimal cut-off grade consideringthat the cost of production is a function of a U-shape costcurve. The three black profiles represent varying cut-offgrades for varying rates of production as a function ofvarying costs. The underlying cost hypothesis is a criticalinfluence.
The economics of exhaustible mineral resources
VOLUME 115 1093 �
Figure 15—Graphical representation of optimal life-of-mine profits

The economics of exhaustible mineral resources
For the sake of completeness – and superimposed on theillustration – are optimal cut-off points that are influenced bythe commodity price assumed. The model is therefore able toassist practitioners in understanding the influence ofchanging commodity prices on the optimal cut-off andtherefore payability of the mineral resource endowment. Inthis example, gold prices of US$1000, 1300, and 1500 perounce were applied, with the highest commodity priceyielding the lowest cut-off grade and the lower commodityprice yielding the higher cut-off grade.
The integration of all these concepts, namely commodityprice, endowment grade, rates of production and economiesof scale, and concomitant costs, can therefore be succinctlymodelled. Given this framework, miners no longer have toconsider the economic utilization of a mineral endowment ina segmented way. Rather, the optimal moments of a MineralReserve can be rapidly derived from the Mineral Resourceand the impacts of key variables on the payability of theendowment comprehended.
While the illustration in Figure 16 describes how relevantmoments of optimization can be displayed, Figure 17presents a three-dimensional construct. The critical variablesand the interplay between them, namely the rate ofproduction, the cut-off grade, and the optimal life-of-minepresent value, are clearly illustrated.
As an aside, it is worth highlighting that the cut-off grade(z-axis) declines and then increases. This is the result of theU-shaped cost curve assumed in this modelling. By way ofdemonstration, Figure 18 illustrates that as economies ofscale are being induced through increased output, so cut-offgrades fall in tandem with unit cost of production. In theevent that diseconomies of scale are realized as hypothesizedby Minnitt (2007) and in order to maintain profitability, cut-off grades would have to rise as production rates continueincreasing. The slope of cut-off grades required to maximizecash returns at varying levels of production is seen to mirrorthe cost curve in Figure 18 and is consistent with the sameeffect in Figure 17.
This value surface in Figure 17 presents a succinctsummary illustrating how the rationale of integrating theproduction rate as influence by the U-shaped cost curve andgrade signature represented by a grade-tonnage curveinfluences the determination of maximum valuation for amineral resource. This modelling represents an important tool
in the process of engineering value maximization andprovides a critical framework when proceeding withfeasibility studies of any commodity endowment.
DiscussionAlthough the author is at ease following Studemund’sguidance with regard to selecting a functional form on thebasis of theoretical considerations and the arguments ofMinnitt et al. to adopt a U-shaped cost curve, industrypractioners will likely be convinced only when data-drivenanalysis can be presented to confirm Minnitt et al’shypothesis. While PwC’s empirical evidence may cause somepractitioners to at least pause and consider the relevance ofthe U-shaped cost curve, the more skeptical will likely be
�
1094 VOLUME 115
Figure 16—Influences of commodity price and cost on cut-off grades
Figure 17—3D modelling of present value, cut-off grade, andproduction rate
Figure 18—Cut-off grade response to cost curve hypothesis

convinced only when sufficient data-sets are forthcoming toprove the hypothesis. The author has little doubt that this can be achieved by interrogating the databases of miningcompanies for the period 2003 to 2011, considering thatproduction rates were prioritized and costs have spiralled out of control. It is argued that although macro-economicrationalizations may be relied upon to explain spiralling costsduring the supercycle, to ignore micro-economic phenomenonwill be to repeat the same outcomes in the next supercycle.
While miners await the next commodity boom, a usefulapplication of this integrated methodology is that alternativemining methods can be quickly assessed on the overall valueproposition. Considering that miners are moving into anenvironment where orebody discoveries are larger but atlower grades, understanding how to maximize value bybalancing the trade-offs will distinguish the truly goodmanagement teams from the rest of the pack.
By way of example, understanding the effect of the slope of alternative grade-tonnage curves may dictate that an alternative mining method(s) with alternative cost profilesbe considered to achieve maximum value. For example,Figure 19 illustrates two cumulative grade-tonnage curves.The impact of an increasing cut-off grade on availablemineable tons is clearly illustrated; namely that the reductionin mineable tons on curve CTC1 is significantly less than thatfor curve CTC2.
CTC1 would suggest that mining engineers have theflexibility to consider significantly more miningmethodologies, while CTC2 limits alternative mining methodsas a result of its sensitivity to an increasing cut-off grade.CTC1 can sustain high volume or lower volume or moreselective mining methodologies, whereas it is argued thatCTC2 would only support high-volume mining methods.
In addition to this consideration, it is also worthwhilenoting that since new orebody discoveries typically bearlower grades, understanding how a mineral endowment’s‘DNA’ influences maximum economic utilization is a priority.Typically, lower-grade deposits require higher volume miningmethods, and not considering the cumulative tonnage profilemay lead to significant opportunity cost.
By considering this integrated approach, miningcompanies that find the right balance between optimizingcurrent operations and preserving their flexibility to graspfuture opportunities are better able to develop strategies andarticulate more favourable value propositions to attract equitycapital and return shareholder value on a sustainable basisthrough the commodity cycle. Practically, capital preservation
is primarily achieved as investment on redundant capacity issaved, and profit margins are maximized regardless of thecommodity cycle – thus enabling a mining business togenerate surplus cash flows, giving them a significantcompetitive edge. Those mining businesses that prudentlymanage the cycle through optimal management of theirmineral resource endowments will have the financial muscleto take advantage of cheap assets sales in the downturn andgenerate alpha returns during the up-cycle.
ConclusionPart 1 of this paper explored the prevailing philosophy in themining and investment industry; that increasing output willdeliver continuing economies of scale and therefore chasingvolume at any cost was deliberately prioritized overproductivity considerations. This practice was supported bythe work of Dr. Rudenno, who published ‘power’ curves toestimate capital and operating costs at varying rates ofproduction. The underlying assumption of theses curves wasthat ‘bigger is better’ as larger operations yielded lower unitcosts of production and therefore, by implication, higherprofit margins. Empirical evidence from the world’s top 40mining companies (after PwC) suggests that this practice didnot produce the anticipated bottom line returns. In fact, thedata shows that during the period profitability trends werenegative rather than positive. Schizophrenically, the sameinvestor base that not too long ago was pushing for growthand rewarding those miners with the most attractive growthpipeline is now demanding greater discipline around capitalallocation, cost control, and productivity. Treadgold (2015),writing for the Mining Journal, crows that institutionalinvestors started to blow the whistle two years ago that anover-production crisis was brewing – just two years ago! Yetdespite being scapegoated by institutional investors, minerscontinue to take their cue from the very same quarters thatnow decree that the panacea to the industry’s ills is to incurmassive impairments, retrench staff, curtail or defer long-leadcapital investments, and instill greater cost discipline. PwC’ssober insight, in contrast, is at risk of being drowned by thecacophony: ‘This reaction of headcount reductions andexpenditure curtailment might be effective in reducingcontrollable cash costs in the near term, but long-termsustainable gains depend on strong underlying improvementsin the efficiency of operations and invested capital.Accordingly, productivity has become one of the mostimportant topics as the industry aims to restore and sustainshareholder value.’
Using an integrated model it has been shown thatignoring the concept of the U-shaped costs curve leads toover- capitalization and higher cost operations at the top endof production, ultimately decimating shareholder value.Mining companies need to find the right balance betweenoptimizing current operations while preserving theirflexibility to grasp future opportunities. There is no longerany doubt that prioritizing production is a costly strategy,and the well-documented fallout has shown it to be a deadlyendgame for many miners and investors alike. Minnitt et al’spowerful argument in support of a production optimumshould be a key consideration for any miner looking to revisittheir business strategies and prevent a re-run of recentevents.
The economics of exhaustible mineral resources
VOLUME 115 1095 �
Figure 19—Alternative cumulative grade-tonnage curves

The economics of exhaustible mineral resources
Part 2 of this paper addressed Minnitt’s concerns withrespect to barriers to adoption by practitioners. Given moderndesktop computing and the application of standard single-equation linear regression analysis (SLRA), this technique isnow highly accessible. While this paper represents a first stepto advance Minnitt et al’s thinking, there is no doubt thatwith greater adoption and acceptance, this technique willevolve and develop and become an important part of aminer’s toolkit. Much can still be learned about theapplication of the U-shaped cost curves in designing andoperating mines – and even a portfolio of mines; but toachieve this, further empirical data needs to be acquired andanalysed. Nevertheless, given the institutional backlash, thisis arguably an ideal time to re-introduce Minnitt et al’s workinto the debate.
Minnitt et al’s hypothesis is even more useful ifintegrated with mineral resource modelling. Part 3 of thispaper addresses a significant potential weakness that arises ifmicro-economic modelling ignores mineral resourcemodelling. Focusing only on achieving economies of scalewith respect to ore tons being mined and processed may failto capture economies of scale related to a targetedcommodity, e.g. copper, gold, platinum etc. A keycomplication in mining mineral resources is that the‘commodity’ mined is not the ‘commodity’ sold. Figure 16 hashighlighted the dangers of ignoring the modelling of both oremined and the commodity being targeted for sale.Consequently, the author describes an integrated modellingtechnique that considers both a mineral resources grade-tonnage curve and its micro-economic cost curves asadvocated by Minnitt et al. The optimal rate of production,being the key determinant of the lowest unit cost ofproduction, is shown to be a key determinant of the optimalcut-off grade of a mineral resource, as illustrated in Figure18. The significance of this is that determining the optimalcut-off grade establishes the maximum cash flow that amineral resource can yield. This modelling techniquehighlights that the cost of production is as important aninfluence on the cut-off grade determination as the price ofthe commodity.
In the words of Treadgold (2015), ‘Undeterred by theevidence, the mining industry ploughed ahead withexpansion projects in what has now become a self-destructiverace to the bottom as big low-cost miners chase market shareso they can claim the title of ”last-man-standing”’. So thequestion is this: will management teams continue chasingrainbows, undeterred by the evidence, or will they look attheir business with fresh eyes and challenge traditional ideasand develop strategies that will attract and rewardshareholders with sound business philosophies that aresustainable in the long-term and through the cycles?
ReferencesBALLINGTON, I., BONDI, E., HUDSON, J., LANE, G., and SYMANOWITZ, J. 2004. A
practical application of an economic optimization model in anunderground mining environment. Orebody Modelling and Strategic MinePlanning, Perth, November 2004. Australasian Institute of Mining andMetallurgy, Melbourne.
BHAPPU, R.R. and GUZMAN, J. 1995. Mineral investment decision making.Mineral Economic Management Meeting, Washington, DC.
BREEDT, M.F. and VAN HEERDEN, D. 2015. Post pit optimization strategicalignment. Mining Business Optimisation Conference, 11–12 March 2015.Southern African Institute of Mining and Metallurgy, Johannesburg.
ERNST and YOUNG. 2013. Expensive acquisitions? Cost overruns? Implicationsfor impairment testing. Mining & Metals: Refining IFRS. pp. 1–7.
GOLDSMITH, T. 2013. Mine: A Confidence crisis. Review of Global Trends in theMining Industry 2013. PwC.
JOSEPH, M.F.W. 1933. A discontinuous cost curve and the tendency toincreasing returns. Economic Journal, vol. 43, no. 171. pp. 390–398.
KOHLER, H. 1992. Economics. Heath Publishers, Canada.
KRIGE, D.G. Not dated. Capital Investment and Risk Analysis for a New MiningProject. University of the Witwatersrand, Johannesburg.
LAZENBY, H. 2014. New Focus. http://www.miningweekly.com/article/mining-majors-prioritising-returns-over-production-volumes-as-profits-company-valuations-sag-2014-04-04-1
MARSHALL, A. 1920. Principles of Economics. 9th edn. Macmillan, New York.
MINNITT, R.C.A. 2004. Cut-off grade determination for the maximum value of asmall Wits-type gold mining operation. 31st International Symposium onApplication of Computers and Operations Research in the MineralsIndustries, Cape Town, South Africa, 14–16 May 2003. pp. 415–421.South African Institute of Mining and Metallurgy, Johannesburg.
MINNITT, R.C.A. 2007. Frontiers of usefulness: The economics of exhaustibleresources. Journal of the South African Institute of Mining andMetallurgy, vol. 107, no. 8. pp. 539–555.
MITCHELL, P. 2013. Switching direction. Margin protection and productivityimprovements in mining and metals.http://www.ey.com/Publication/vwLUAssets/EY-Mining-and-Metals-Switching-direction/$FILE/EY-Mining-and-Metals-Switching-direction.pdf.
NAPIER, J.A.L. 1981. Investment criteria and choice of production rate in theplanning of gold-mine production. Journal of the South African Institute ofMining and Metallurgy, vol. 81, no. 7. pp 221–228.
PWC. 2014. Mine 2014. Realigning expectations. Review of Global Trends inthe Mining Industry 2014.
RUNGE, I. 2012, Economics of mine planning and equipment selection – Part 1.Pincock Perspectives, no. 113.
SAMUELSON, P.A. 1972. Jacob Viner, 1892-1970. Journal of Political Economy,vol. 80, no. 1. pp. 5–11.
SAMUELSON, P.A. 1976. The monopolistic competition revolution. MonopolisticCompetition Theory: Studies in Impact, Essays in Honor of Edward H.Chamberlin. Kuenne, R.E. (ed.). Wiley, New York.
SEMPLE, C. 2014. Digging deeper to all in cost disclosure. Mining’s new frontier.PwC.
SILBERBERG, E. 1999. The Viner-Wong envelope theorem. Journal of EconomicEducation, vol. 30, no. 1. pp. 75–79.
STUDEMUND, A.H. 1970, Using Econometrics, a Practical Guide. 2nd edn. HarperCollins, USA.
TISATO P, 1995. Exhaustible resource depletion: a modified graphical approach.Journal of Economic Education, vol. 26, no. 1. pp. 51–57.
TREADGOLD, T. 2015. Mining Journal, February. p. 11.
VAN HEERDEN, D. 2015. Understanding the impact of different cut-offparameters. Newsletter, no. 9, January 2015.
VINER, J. 1931. Cost curves and supply curves. Zeitschrift fürNationalökonomie, vol. 3. pp. 23–46. �
�
1096 VOLUME 115