v115n11a14 rock engineering aspects of a modified mining
TRANSCRIPT

Evolution of deep gold mine layoutsThe deep mining layouts in the gold mines ofSouth Africa evolved gradually over time in anattempt to control the rockburst problem. Inthe early decades of the 20th century, declineshafts were used to gain access to the gold-bearing reef. Scattered mining with mine poleor mat pack supports, often supplemented withpillars and sand fill, was used with
considerable success in shallow mining areas.Rockbursting, mainly caused by remnants atdeeper levels, became a serious problemduring the 1940s. Longwall stoping was firstintroduced at ERPM Mine to reduce theproblems related to mining-induced seismicity.Hill (1942) showed that more than 90% of theseismicity that occurred on ERPM could belinked to the ‘isolated pillars’ left behind bythe scattered mining layouts. He proposed thatthese pillars could be largely avoided byimplementing the ‘longwall’ mining method.This was subsequently implemented at CrownMines and ERPM.
The longwall layouts seemed to be largelysuccessful, except for large damaging seismicevents that still occasionally occurred. Thiswas particularly problematic when miningthrough or in close proximity to geologicalstructures, and became worse as the miningdepths increased. A few years later, stabilitypillars where introduced. The advantages ofthese pillars were described by Cook andSalamon (1966). Studies conducted by Deliacand Gay (1984) and McGarr and Wiebols(1977) showed that the occurrence ofrockbursts was significantly reduced in themining areas protected by the stability pillarscompared with areas where no pillars wereused. Salamon and Wagner (1979) argued thatlarge seismic events are likely to occurinfrequently and that the level of seismicity inareas protected by stability pillars will be lowerthan traditional longwall faces without pillarprotection. Unfortunately, the rockburstproblem in the mining industry did notdisappear with the introduction of the modifiedlayouts. Hagan (1987) noted that therockburst fatality rates escalated tounacceptable levels in the late 1970s atWestern Deep Levels Mine.
Rock engineering aspects of a modifiedmining sequence in a dip pillar layout ata deep gold mineby Y. Jooste* and D.F. Malan†
SynopsisScattered mining was practised on Kusasalethu Mine (previouslyElandsrand Gold Mine) prior to 1998, but at deeper mining levels it was nolonger feasible, since it would have resulted in unacceptably high stresslevels and energy release rates. Longwall mining was not adopted at thesedepths as the mine required a more flexible mining method owing to thehighly variable grade and the presence of geological structures. A miningmethod was developed that consisted of dip stabilizing pillars for regionalsupport, as well as bracket pillars to clamp geological structures. A strictsequence of extraction was followed and this, together with the particularlayout, was called the ‘sequential grid mining method’. This methodaddressed two key problems, namely negotiating adverse geology and theerratic grade of the Ventersdorp Contact Reef (VCR) orebody. However, asignificant drop in production rates resulted in the need for alternativesand improvements to the original mine design. Modifications to the designwere proposed in order to increase production rates, and an investigationto consider the rock engineering implications of these modifications wasconducted. The study indicated that the modified method, called the‘multi-raise mining method’, appears to be feasible and might addresssome of the production problems that were experienced with the originalsequential grid design. An analysis of actual seismic data showed nosignificant differences between the original sequential grid mining and theimplemented multi-raise mining. The numerical modelling of the mininglayouts showed slightly higher interim energy release rates (ERRs) andaverage pillar stress (APS) levels during the extraction process. The finalvalues are nevertheless identical to that of the original sequence. Thestudy also investigated the use of a modelled moment method to analysefuture seismic trends. The study illustrated that the expected seismictrends will be very similar for the multi-raise method compared to theoriginal sequential grid mining method. This study is neverthelessconsidered of a preliminary nature and ongoing monitoring and analysisof seismic data at the mine is required to verify the response of the rockmass to the modified sequence and increased extraction rate. In particular,future work needs to investigate the effect of mining rate (advance ratesin individual panels as well as volume of mining in particular raise lines)on the level of seismicity.
Keywordsdeep mine layout, sequential grid mining, sequence of extraction, miningrate.
* Harmony Gold, South Africa.† Department of Mining Engineering, University of
Pretoria, Pretoria, South Africa.© The Southern African Institute of Mining and
Metallurgy, 2015. ISSN 2225-6253. Paper receivedJul. 2013; revised paper received Apr. 2015.
1097VOLUME 115 �
http://dx.doi.org/10.17159/2411-9717/2015/v115n11a14

Rock engineering aspects of a modified mining sequence in a dip pillar layout
The energy release rate (ERR) concept was introduced inthe 1960s and is essentially a measure of stressconcentration. The expected correlation with seismicity andmining conditions was illustrated by a number of workers(e.g. see Jager and Ryder, 1999). ERR cannot be used toestimate the rockfall hazard, but it is quite useful whenconsidering the situation with regards to rockbursts. Variousstudies conducted in deep longwall mines indicated that therockburst problem is related to the average energy releaserates in the stopes.
� Joughin (1966) reported the first results relating theincidence of rockbursts at Harmony Gold Mine to ERR
� In 1979, Salamon and Wagner reported similar resultsfor the East Rand Proprietary Mines (ERPM)
� At Western Deep Levels, Heunis (1980) conducted adetailed investigation over a period of 4 years. Thisalso showed a strong correlation between ERR and theincidence of rockbursting.
The success obtained at ERPM and Blyvooruitzicht mineswith pillars resulted in a systematic pillar design beingimplemented at Western Deep Levels in 1979 to assist withthe rockburst problem (Tanton, McCarthy, and Hagan, 1984).A series of breast-mining panels made up a so-called‘Christmas tree’ shape longwall. The longwalls were minedboth east- and westwards. Strike-orientated barrier pillarsapproximately 35 m in width were left between the majorlongwalls. The layout attempted to maintain the face stressesas low and as uniform as possible during the extraction ofthe entire working area. The ERR criterion was used as anaid in the assessment of average stress levels at the workingfaces, as well as indicators of possible seismic incidence ingeologically undisturbed mining situations (Hagan, 1987).
The strike stability pillar layout has advantages anddisadvantages when compared to the scattered mine layout.The disadvantages of the longwalls with strike stabilitypillars are as follows (Frusso-Bello and Murphy, 2000):
� Minimal advanced off-reef development results ininadequate information regarding geological structures.Planning of the mine is therefore problematic
� The majority of geological structures are being minedthrough, which results in a large amount of off-reefmining operations
� Geological structures with large throws cannot benegotiated and new development is required to accessthe reef. This increases costs significantly
� The method is development-intensive.
The advantages of the longwalls with the strike stabilitypillars are as follows:
� No remnants or additional pillars will be formed thatneed to be mined in the future
� The access development is protected against highstresses as it is positioned in overstoped ground
� Faster access to reef is possible and revenue cantherefore be generated quicker
� Mining operations can be concentrated, and this makesmanagement and logistics of the mining activitieseasier
� Better ventilation control can be achieved. This isalways a problem in the scattered mining environment.
Migration to sequential grid layoutsIn recent years, deep-level mines situated in the West Randregion of the Witwatersrand goldfields adopted layouts thatincorporate the systematic use of dip stabilizing pillars. Thislayout is largely motivated by its flexibility for mining anorebody that is disrupted by geological structures, situationswhere the reef grade is erratic, and with the occurrence ofdamaging seismic events associated with the geologicalstructures. The other major contributor to the selection of thesequential grid method in preference to the mini-longwallmethod is the stability of the pillars (dip versus strike pillars).Lenhardt and Hagan (1990) showed that strike stabilitypillars on the Carbon Leader Reef (CLR) were prone to failure.The dip pillar stability concept was applied by Murie (1980)to a section of Kusasalethu Mine (70 to 73 level) and hefound that the ERRs were reduced by 50% compared to thescenario where only bracket pillars were used to clampgeological structures. Applegate and Arnold (1990) were thefirst to propose the 30 m wide dip stability pillars spaced 200m (170 m skin-to-skin spacings) apart that would result inapproximately 85% extraction. By early 1990, the design wasimplemented from 76 to 85 level. Part of the initial minedesign was the incorporation of bracketing geologicalstructures to address the seismic hazard associated withthese geological structures. The key principles of the proposalwere that all significant geological structures must bebracketed and dip stabilizing pillars should be located in low-grade areas where possible.
A key aspect is that Applegate (1991) showed that theERR levels can be controlled when following a specificsequence of mining. This is achieved by keeping leads andlags to 10 m or less as far as is practically possible. As theoverall face configuration is bottom panel leading, the 10 mlead / lag rule will assist in maintaining the overall face shaperequired to limit the ERRs associated with the top panels.
The mining sequence of the original sequential gridmethod can be described as follows:
� Overall sequence is mining outwards from the shaft onstrike, moving from raiseline to raiseline to the easternand western boundaries of the mine (dip towards thesouth)
� Deeper levels will be started up later than the shallowersections, resulting in a V-shaped down-dip miningconfiguration
� Mining at each new raiseline proceeds first towards theshaft to form the next pillar
� If the pillar formation is completed, mining commenceson the opposite side of the raiseline, mining away fromthe shaft towards the next pillar position.
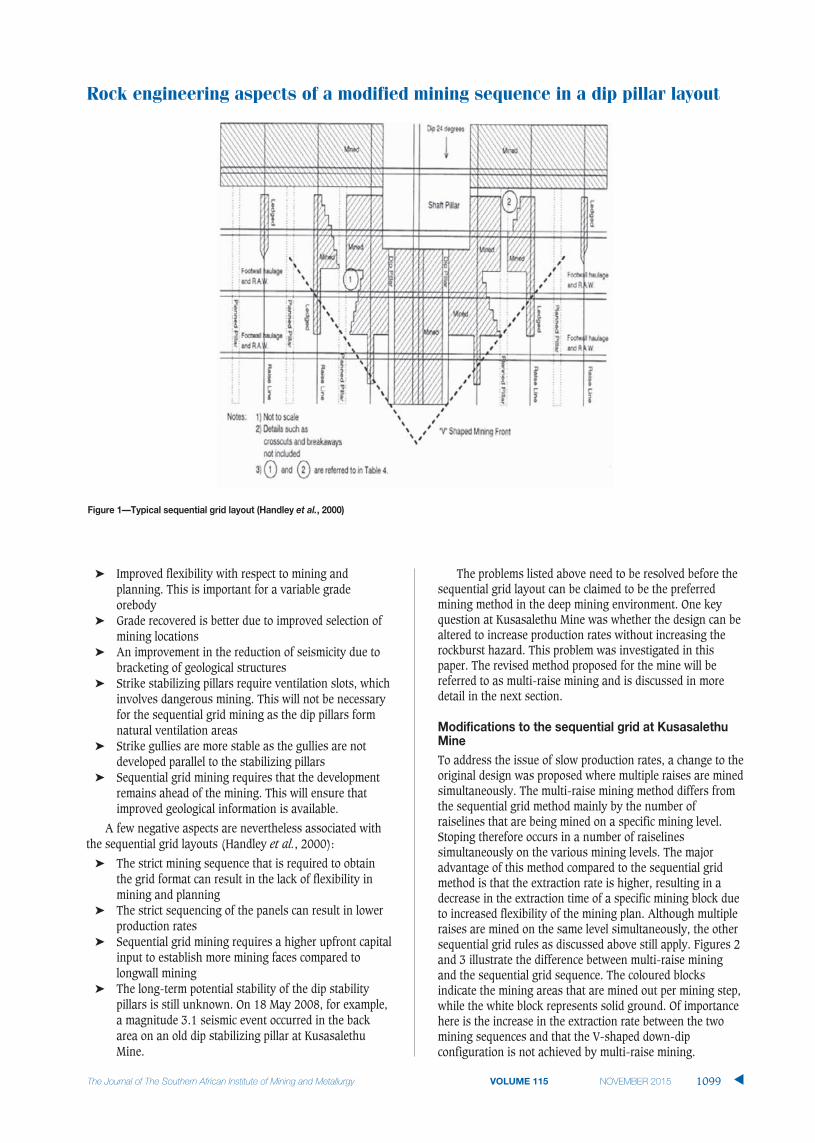
The sequence of the sequential grid mining method isshown in Figure 1. It is during the second mining stage foreach raiseline that stope spans reach their maximum size, butas the mining proceeds in the direction of the solid ground,the effect of the large span is minimized. This, together withthe use of backfill, will assist with a decrease in closure ratesand ERR levels.
The original decision to implement the sequential gridmining method at Kusasalethu Mine was based on thefollowing factors (Handley et al., 2000):� Less off-reef development, thus less capital required
�
1098 VOLUME 115
� Improved flexibility with respect to mining andplanning. This is important for a variable gradeorebody
� Grade recovered is better due to improved selection ofmining locations
� An improvement in the reduction of seismicity due tobracketing of geological structures
� Strike stabilizing pillars require ventilation slots, whichinvolves dangerous mining. This will not be necessaryfor the sequential grid mining as the dip pillars formnatural ventilation areas
� Strike gullies are more stable as the gullies are notdeveloped parallel to the stabilizing pillars
� Sequential grid mining requires that the developmentremains ahead of the mining. This will ensure thatimproved geological information is available.
A few negative aspects are nevertheless associated withthe sequential grid layouts (Handley et al., 2000):
� The strict mining sequence that is required to obtainthe grid format can result in the lack of flexibility inmining and planning
� The strict sequencing of the panels can result in lowerproduction rates
� Sequential grid mining requires a higher upfront capitalinput to establish more mining faces compared tolongwall mining
� The long-term potential stability of the dip stabilitypillars is still unknown. On 18 May 2008, for example,a magnitude 3.1 seismic event occurred in the backarea on an old dip stabilizing pillar at KusasalethuMine.
The problems listed above need to be resolved before thesequential grid layout can be claimed to be the preferredmining method in the deep mining environment. One keyquestion at Kusasalethu Mine was whether the design can bealtered to increase production rates without increasing therockburst hazard. This problem was investigated in thispaper. The revised method proposed for the mine will bereferred to as multi-raise mining and is discussed in moredetail in the next section.
Modifications to the sequential grid at KusasalethuMineTo address the issue of slow production rates, a change to theoriginal design was proposed where multiple raises are minedsimultaneously. The multi-raise mining method differs fromthe sequential grid method mainly by the number ofraiselines that are being mined on a specific mining level.Stoping therefore occurs in a number of raiselinessimultaneously on the various mining levels. The majoradvantage of this method compared to the sequential gridmethod is that the extraction rate is higher, resulting in adecrease in the extraction time of a specific mining block dueto increased flexibility of the mining plan. Although multipleraises are mined on the same level simultaneously, the othersequential grid rules as discussed above still apply. Figures 2and 3 illustrate the difference between multi-raise miningand the sequential grid sequence. The coloured blocksindicate the mining areas that are mined out per mining step,while the white block represents solid ground. Of importancehere is the increase in the extraction rate between the twomining sequences and that the V-shaped down-dipconfiguration is not achieved by multi-raise mining.
Rock engineering aspects of a modified mining sequence in a dip pillar layout
1099VOLUME 115 �
Figure 1—Typical sequential grid layout (Handley et al., 2000)

Rock engineering aspects of a modified mining sequence in a dip pillar layout
Seismic activity at Kusasalethu Mine
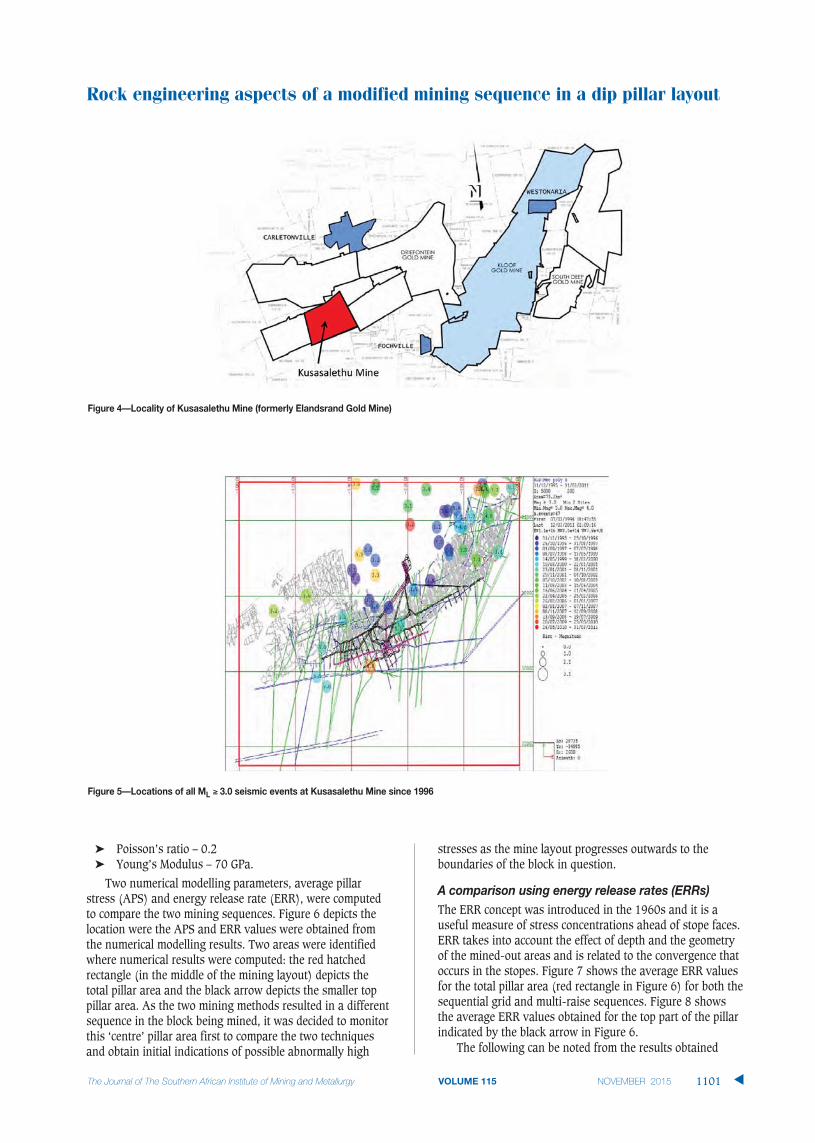
Kusasalethu Mine is situated on the far southern section ofthe West Rand goldfields (Figure 4). It forms part of thecentral portion of the greater Witwatersrand Basin and minesthe Ventersdorp Contact Reef (VCR). The hangingwall isVentersdorp lava, which is characterized by a uniaxialcompressive strength (UCS) of approximately 300 MPa. Thefootwall is competent quartzite, (UCS 180–250 MPa) whichextends to a depth of approximately 430 m below reef on theeastern boundary and about 550 m below reef on the westernboundary. This high-strength zone enables haulages andmost of the other related development to be sited in thefootwall without problems.
As early as 1983, the first seismic network was inoperation at Kusasalethu Mine. A second system, which wasdeveloped by the Western Deep Levels Rockburst PredictionProject, was installed in 1987. The expanded seismic networkcovered approximately 15 km2 of the mine’s lease area. Thenetwork recorded on average 200 seismic events per day. Thecurrent Institute of Mine Seismology (IMS) seismic networkon Kusasalethu Mine consists of 17 operational seismicstations. Expansion of the seismic network is currentlyunderway with the installation of four additional seismicstations between 88 and 105 level. A large number of seismicevents have been recorded since the IMS network becameoperational at the end of 1992. The current database extendsfrom 1996 and consists of 837 024 seismic events withmagnitudes between -3.0 and 4.0 ML. Figure 5 shows the
locations of all seismicity with ML ≥ 3.0 since 1996. Onaverage, approximately 8000 seismic events per month arerecorded.
Comparison of the two mining methodsTo investigate the differences between the two miningmethods, a numerical modelling study was conducted andactual seismic data from the mine was analysed. Of particularinterest was whether the modified method will lead to higherERR levels and whether an increase in seismic activity couldbe detected from the actual seismic data collected at the mine.It should be noted that this preliminary study focused only onan idealized layout with no geological structures to obtain animproved understanding of the modified layout. For actuallayout design, the effect of geological structures needs to beinvestigated in future and ESS modelling will also berequired.
Numerical modellingNumerical modelling was conducted to compare the pillarstress changes and ERR levels between the multi-raisesequence and the original sequential grid sequence. Thenumerical modelling was conducted using MINSIM 2000 andthe following input parameters were used. These are similarto those used by Appelgate (1991) when he investigated theoriginal sequential grid mining layout:
� Grid size – 10 m
�
1100 VOLUME 115
Figure 3—Traditional sequential grid sequence. The coloured blocksindicate the mining areas that are mined out per mining step, while thewhite block represents solid ground
Figure 2—Multi-raise sequence. The coloured blocks indicate themining areas that are mined out per mining step, while the white blockrepresents solid ground. Note that the block is mined out in 18 steps,whereas 20 steps are required for the traditional sequential gridsequence (Figure 3)
� Poisson’s ratio – 0.2� Young’s Modulus – 70 GPa.
Two numerical modelling parameters, average pillarstress (APS) and energy release rate (ERR), were computedto compare the two mining sequences. Figure 6 depicts thelocation were the APS and ERR values were obtained fromthe numerical modelling results. Two areas were identifiedwhere numerical results were computed: the red hatchedrectangle (in the middle of the mining layout) depicts thetotal pillar area and the black arrow depicts the smaller toppillar area. As the two mining methods resulted in a differentsequence in the block being mined, it was decided to monitorthis ‘centre’ pillar area first to compare the two techniquesand obtain initial indications of possible abnormally high
stresses as the mine layout progresses outwards to theboundaries of the block in question.
A comparison using energy release rates (ERRs)The ERR concept was introduced in the 1960s and it is auseful measure of stress concentrations ahead of stope faces.ERR takes into account the effect of depth and the geometryof the mined-out areas and is related to the convergence thatoccurs in the stopes. Figure 7 shows the average ERR valuesfor the total pillar area (red rectangle in Figure 6) for both thesequential grid and multi-raise sequences. Figure 8 showsthe average ERR values obtained for the top part of the pillarindicated by the black arrow in Figure 6.
The following can be noted from the results obtained
Rock engineering aspects of a modified mining sequence in a dip pillar layout
VOLUME 115 1101 �
Figure 4—Locality of Kusasalethu Mine (formerly Elandsrand Gold Mine)
Figure 5—Locations of all ML ≥ 3.0 seismic events at Kusasalethu Mine since 1996

Rock engineering aspects of a modified mining sequence in a dip pillar layout
when computing the average ERR values for the total pillarand top part of the pillar (Figures 7 and 8).
� The two mining sequences result in a similar trend ofrapid increasing ERR values when the mining is still inclose proximity to this pillar. This rate decreasesgradually as the mining moves away from this centralpillar
� The maximum ERR value (58.2 MJ/m2 for the totalpillar and 43.4 MJ/m2 for the top part of the pillar) isobtained during step 12 for the sequential gridsequence and during step 9 for the multi-raisesequence. The value for the top part of the pillar is lessthan that for the entire pillar as the top part is situatednext to the solid abutment which reduces the stress inthis part of the pillar compared to further away fromthe abutment. The maximum values for the twosequences in Figures 7 and 8 are identical as the finalmined geometry is similar. This is to be expected aswith elastic modelling, the final results are path-independent for identical final geometries
� The average ERR value obtained in the initial steps isslightly higher for the multi-raise method compared tothe sequential grid mining. This is not unexpected, asmining is more rapid for the multi-raise method and itresults in higher stresses on the pillars and increasedclosure earlier in the mining sequence. The differencein ERR is nevertheless small. The maximum differencefor the two sequences was obtained during step 5 forthe entire pillar (5.9%) and step 4 when consideringwhen considering only the top part of the pillar (8.1%).
A comparison using average pillar stress (APS)
APS is commonly used as one of the parameters to designand assess the stability and performance of pillars. If themining layout is regular, tributary area theory can be used todetermine the APS value for a specific pillar (Jager and Ryder,1999):
[1]
where qv is the virgin stress and e the extraction ratio. TheAPS as computed by the numerical modelling programMINSIM 2000 is shown in Figures 9 and 10 for the top pillarand the total pillar area respectively (see Figure 6). Napierand Malan (2011) illustrated that care should be exercisedwhen calculating APS values using boundary elementprograms. The APS values computed by these codes aredependent on element size, and for large element sizes theAPS can be significantly underestimated. Ideally, the APSshould be computed for two different element sizes and amore accurate value can then be obtained by extrapolation toa ‘zero’ element size. For the purposes of this study, theabsolute APS values were not required, but only consistentvalues for comparison between the two mining sequences.Only one set of simulations for each mining sequence wastherefore completed using an element size of 10 m.
The following can be noted from the simulated APSresults:
�
1102 VOLUME 115
Figure 6—Locations where APS and ERR values were computed. Thecoloured blocks indicate the mining sequence. Each block is half araiseline between levels and the white areas in between are stabilizingpillars
Figure 8—ERR according to mining step for the sequential grid andmulti-raise design. This plot is for the top part of the pillar
Figure 7—ERR as a function of mining step for the sequential grid andmulti-raise sequences. This plot is for the total pillar

� The difference between the two design methods whencomparing the APS on the centre pillar is minimal. Bothmining sequences result in similar trends of increasingAPS
� The APS value obtained during the early mining stepsis slightly higher for the multi-raise sequence than forthe sequential grid sequence. For the top part of thepillar (Figure 9), a maximum difference for the twosequences was obtained during step 4 (4.5%). For theentire pillar area, the difference was less at 3.0%,which occurred during step 5
� The maximum APS value (335.4 MPa for the top partof the pillar and 386.4 MPa for the entire pillar) wasreached during step 12 for the sequential grid sequenceand during step 9 for the multi-raise sequence. Asexpected, the top part of the pillar had a lower APSvalue as it is adjacent to the solid abutment.
A comparison using modelled moment estimatesFor a given change in mining configuration, various attemptshave been made in the past to estimate seismic hazard using
numerical modelling. A few examples applicable to the SouthAfrican gold mining industry include Ryder (1988), Wiles etal., (2001), Hofmann (2012), and Scheepers et al., (2012).For this current study, a method was used to estimate themoment tensor of the deformation associated with eachmining step. For this method, the mining area is enclosed ina box or sphere which plays the role of the source volume.Assuming all deformation associated with a particular miningstep is associated with one seismic ‘event’, one can estimatethe resulting moment from the changes in the elasticdisplacements and tractions on the elements of the box orsphere. The method was recently described by Malovichko etal. (2012). This technique was also recently further exploredby the IMS numerical modelling unit. In summary the methodinvolves the following steps:
� Define a sphere around the mining volume of interestthat contains all the material subjected to deformationor dislocation associated with a mining step. Thisvolume must be small enough to capture the elasticstress and strain change caused by the mining, butlarge enough to ensure that the material outside can beassumed to be a linear elastic material
� Discretize the sphere surface using small flat elements.The elements must be small enough to ensure theconstant-traction and constant-displacementapproximation for each element gives accurate results,but large enough to ensure practical solution times
� Run the numerical simulation for the state before andafter the mining step and compute the changes intractions and displacements at the centroids of theelements on the sphere
� Calculate the moment tensor as per Malovichko et al.(2012).
The seismic moment that is calculated is referred to as themodelled moment for each mining step. The results of themodelled moment analyses for the Kusasalethu mininglayouts were calibrated using the seismic history of the mineand the IMS in-house numerical modelling program, ISM.Figures 11 and 12 show the location of the eight modelledmoment areas selected to analyse the two different sequencesdescribed above. The same blocks were used to compare thetwo mining methods, so the block selection is considered areasonable first attempt to compare the two sequences.
Figures 13 and 14 illustrate the modelled moment resultsfor each selected area for both of the mining methods. Fromthese results it is deduced that:� The three areas (blocks 2, 3, and 8) with the largest
modelled moment at the end of the mining cycles arethe same for both of the mining methods, withmodelled moments ranging between 2.0 and 2.5
� The three areas with the largest modelled moment arealso the three largest areas that include the mostmining
� The other five areas (blocks 1,4,5,6, and 7) have verysimilar modelled moments at the end of the miningcycle.
� All the blocks follow a similar path to the final step,with the multi-raise method reaching highermagnitudes earlier on. This is due to the shorterextraction time compared with the sequential gridlayout.
Rock engineering aspects of a modified mining sequence in a dip pillar layout
VOLUME 115 1103 �
Figure 10—APS as a function of mining step for the sequential grid andmulti-raise sequences (total pillar area)
Figure 9—APS as a function of mining steps for the sequential grid andmulti-raise sequences. These values are for the top part of the pillar

Rock engineering aspects of a modified mining sequence in a dip pillar layout
In summary, when comparing the results obtained usingthe modelled moment method, little difference can be noticedbetween the two mining sequences. The only difference isthat larger magnitudes can be expected earlier on with themulti-raise method due to the shorter extraction time.
Seismic data and production analysesThe multi-raise mining method was implemented fromraiseline 35 between 98 and 102 levels at the end of 2006.Figure 15 shows the western section of the mine where themulti-raise mining method was implemented together with allseismic events with ML ≥ 2.0 since 2000 until March 2009with the Mmax=3.1. Only two seismic events with ML ≥ 3.0were recorded in the area, the last of these occurring on 31July 2002.
Figure 16 shows the larger magnitude events with ML ≥2.0 that occurred in the area from 2000 until 2009. Themigration of the seismic activity in a southern directioncoincides with the general trend in mining. The coloursrepresenting the seismic activity in this plot are based onannual intervals as portrayed in the legend.
The time series depicting the occurrence of seismicactivity with ML ≥ 0.0 for the period 2000 to March 2009 isshown in Figure 17. The distribution is based on yearlyintervals and the following important features emerge fromthis representation of the seismic activity:
� There has been a general decrease in seismicity since2005, with a peak in 2008. This is closely related to theproduction, which follows a similar trend as can beseen in Figure 18
� The decrease in activity for 2009 is due to the fact thatthe data-set represents only the first three months in2009.
Production dataProduction data dating back to July 2002 was obtained forthe area selected in Figure 16. Production information priorto this is unfortunately not available. The production andassociated seismicity for the 7-year period were analysed todetermine if any changes in the seismic response could beattributed to the subsequent changes in mine design (change
�
1104 VOLUME 115
Figure 12—Modelled moment locations (blocks 5 to 8)
Figure 11—Modelled moment locations (blocks 1 to 4) Figure 13—Sequential grid modelled moment for the eight differentblocks
Figure 14—Multi raise modelled moment for the eight different blocks

from sequential grid to multi-raise sequence). The productionfigures (m2) since July 2002 were firstly compared with thenumber of seismic events recorded with ML ≥ 0.0 i.e. activityrate. The two series are compared in Figure 19. The followingpoints emerge:
� A correlation in the downward trend is visible from theend of 2003 until July 2006
� From July 2006 until March 2009, the production rateis much higher than the associated seismic response,but the two series appear to follow the same trend
� Visual examination of the two series reveals areasonable correlation up to March 2009. Beyond that,the production data and seismicity appears to show astrong negative correlation.
Seismic hazard estimationProbabilistic assessment of the seismic hazard involvesspecifying the likelihood, maximum magnitude, location, andnature of seismic events that might have damaging effects onunderground working areas and attempts to estimate thepeak acceleration of the ground movement close tounderground infrastructure. Seismic hazard is defined as theprobability of occurrence of a seismic event or ground motionexceeding a specified level within a given period of time(Jager and Ryder, 1999). The occurrence of mine tremors isnot strictly a random process. A statistical approach to theanalysis of seismic events provides a reasonable basis forseismic hazard assessment to assist in estimating expectedlosses or assessing different mine designs.
Rock engineering aspects of a modified mining sequence in a dip pillar layout
VOLUME 115 1105 �
Figure 16—Location of all seismic events recorded by seismic system since 2000 with ML ≥ 2.0
Figure 15—Location of all seismic events recorded by seismic system since 2000 with ML ≥ 0.0

Rock engineering aspects of a modified mining sequence in a dip pillar layout
Observations indicate that seismic events induced bymining activities show some of the same characteristics asthose noticeable in crustal seismology. One of the relationsthat are readily applied between both fields of seismology isthe frequency-magnitude relation that was introduced byGutenberg and Richter:
[2]
where n is the number of seismic events with magnitude m,and a and b are intercept and slope parameters for thelogarithmic relationship. Numerous papers have been writtenon this frequency-magnitude relation and they all show thatthe relation holds for virtually all magnitude ranges. Criticismof the relation is centred on its unsatisfactory behaviour forthe larger magnitude seismic events, where it overestimatesthe likelihood of occurrence. The maximum magnitude
capable of occurring in any active mining area can beestimated by either of two methods, namely a deterministic ora probabilistic approach. We used a visualization softwarepackage developed by Hamerkop Scientific Services to portraythe results of maximum magnitude based on a probabilisticapproach.
One of the basic elements in assessing seismic hazard isto recognize seismic sources that could affect the particularlocation at which the hazard is being evaluated. Thesesources are often called seismogenic sources. Defining andunderstanding seismogenic sources is a key component ofseismic hazard analysis and requires knowledge of theregional and local geology as well as past seismicity.Earthquake hazard parameters such as maximum expectedmagnitude (Mmax), activity rate, and b value of theGutenberg-Richter relation are evaluated for eachseismogenic zone.
�
1106 VOLUME 115
Figure 17—Activity per year since 2000 for all seismic events with ML ≥ 0.0 (up to March 2009)
Figure 18—Production per year from 2003 to 2009

In the application of statistical estimations of seismichazard on Harmony Gold mines, several assessments havebeen carried out over a period of time. The followinglimitations of the methodology have been identified (Kijko,1997; Stankiewicz, 1998a, 1998b, 2000; Ebrahim-Trollope,2001):
� Mining has a dynamic nature and changes constantlyin space and time. This method cannot be extrapolatedover very long periods of time without analysing themining direction and volume. These are two of thevariables that can cause differences in the hazardcalculated for a particular mining area
� The method is used comparatively between similargeotechnical areas in which at least one of the areashas previously been mined out. In other words, you can‘forecast’ what might happen for a particular miningarea when a similar area has been mined out in thepast. Method of mining, mining rate, and geology playan important factor when comparing and selectingmining areas for analysis
� The method is applicable to a single source mechanismand therefore all source mechanisms as discussedbeforehand need to be identified for a particulargeotechnical area. There is a distinctive bimodaldistribution for seismic events with different sourcemechanisms. It is therefore important to understandthe different sources of seismicity in a region beforeinterpreting the result obtained from the hazardestimation. The choice and size of the selected areamust be geologically similar to the mining area ofinterest
� The method requires a consistent and reliable database.For example, no changes to software programs shouldbe made that might result in source parameters beingcalculated differently. Loss of periods of seismic datawill influence the results obtained by the seismicanalyses
� The selection of the mining area and the time period forthe seismic hazard estimation can be problematic. Careshould be exercised when the selection of the area isdone to ensure that an acceptable log-lineardistribution is obtained that will not result in the over-or underestimation of the seismic hazard. The lack ofan acceptable log-linear distribution often highlightspossible errors in the choice of mining area or timeperiod
� The hazard estimation results obtained from theanalysis are averaged over the time period of theanalysis and more hazardous time periods, within theperiod selected, cannot be identified.
To identify and determine the seismic hazard associatedwith a specific mine design, the seismicity of the area inquestion needs to be determined prior to the change inmining method, as well as for a significant time period afterthe method was changed. The two analyses can then becompared to determine if the changed mine design resulted inany significant changes to the response in seismicity. Thearea as shown in Figure 20 was used to select the two areaswhere the two mine sequences were implemented.
Seismic analysis of the sequential grid layout
The probabilistic seismic hazard according to the programKorhaan was determined for the top of the west section ofKusasalethu Mine as depicted in Figure 21. Figure 22 showsall seismic events with ML ≥ 2.0 for time period October 2004until December 2006, with the largest event being a ML = 3.1.A relatively good Gutenberg-Richter relation is obtained fromthe seismic data-set available. The data-set is a bit sparse formagnitudes larger than 1.8, and a peak is visible formagnitudes between 2.0 and 2.2. The results obtained fromthe seismic assessment for the original sequential gridsequence are shown in Figures 22, 23, and Table I.
Rock engineering aspects of a modified mining sequence in a dip pillar layout
VOLUME 115 1107 �
Figure 19—Production (m2) compared with the number of seismic events (ML ≥ 0.0) per month since July 2002

Rock engineering aspects of a modified mining sequence in a dip pillar layout
�
1108 VOLUME 115
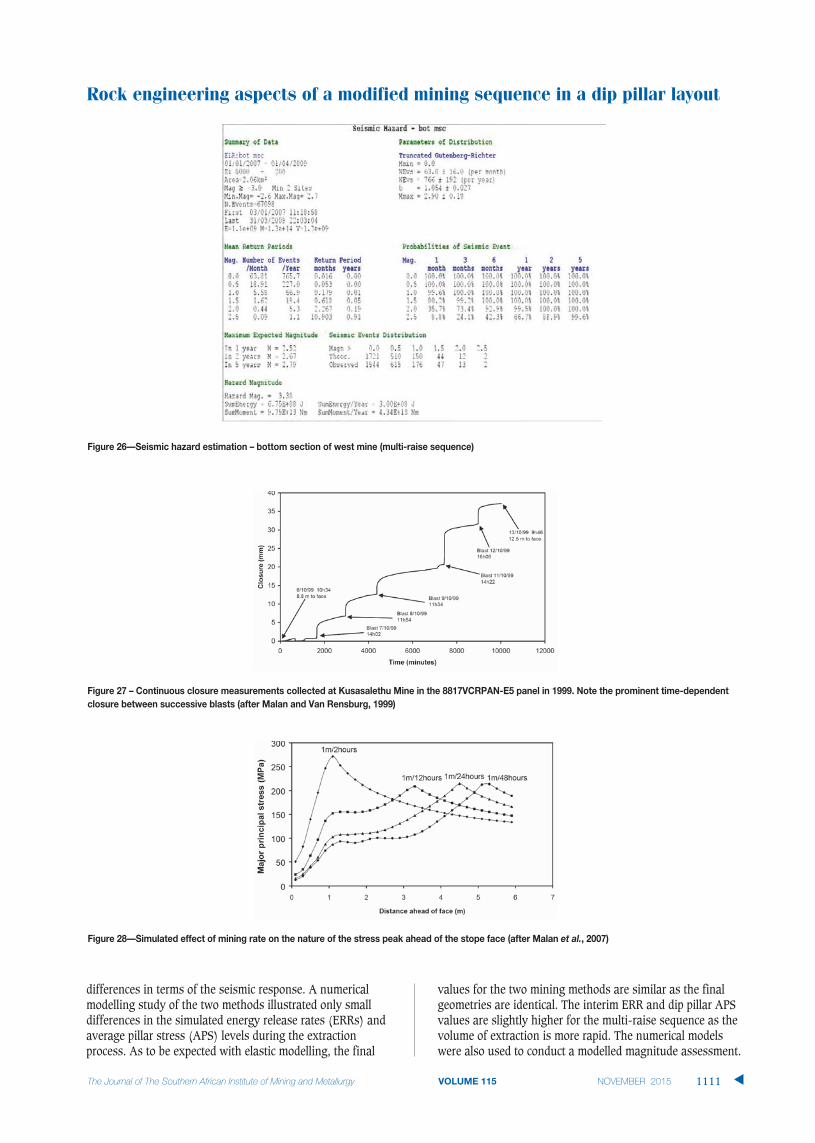
Seismic analysis of the multi-raise sequenceThe probabilistic seismic hazard was determined for thebottom of the west section of Kusasalethu Mine as depicted inFigure 20. Figure 24 shows all seismic events with ML ≥ 2.0for time period January 2007 until March 2009, with thelargest event being a ML = 2.7. The results obtained from theseismic assessment for the change in design (multi-raise) areshown in Figures 25, 26, and Table I. A relatively goodGutenberg-Richter relation is obtained from the seismic data-set available. The data-set has the same trend as for theoriginal design for the larger magnitude events and is a bitsparse from magnitude larger than 2.5. A peak is visible formagnitudes between 2.0 and 2.5.
Table I compares the seismic hazard of the originalsequential mining sequence with the multi-raise minesequence. The results obtained from the current study revealno significant differences between the two mining sequencesin terms of the relevant maximum magnitude and returnperiod for seismic events with ML ≥ 2.5 seismic hazardparameters. The number of seismic events with ML = 1.0shows a 33% increase for the multi-raise mine design whencompared to the sequential grid mine design.
Effect of mining rateFrom the preceding analysis, it appears that the multi-raisemining sequence will not have adverse effects on the mine
Figure 20—Two areas selected for seismic hazard estimation. The ‘modified sequential grid layout’ is referred to as the multi-raise sequence in this paper
Figure 21—Location of all seismic events recorded by the seismic system between October 2004 and December 2006 with ML ≥≥ 2.0 for the top of the westmine

stability when compared to the original sequential gridmethod. A factor not considered, however, is the effect ofmining rate. As the multi-raise mining sequence utilizesmore attack points per level, the overall volume of mining islarger for a similar period. This can be seen in Figures 2 and3, where an area can be mined out in five steps whereas ninesteps are required for the same area if the sequential gridmining rules are followed. Unfortunately, very littleinformation is available in the literature on the effect ofmining rate. Some basic mining rules are often applied in theindustry, such as slow mining rates in remnants andrestricting the number of crews in particular raiselines proneto seismicity. This effect of mining rate has never been
Rock engineering aspects of a modified mining sequence in a dip pillar layout
VOLUME 115 1109 �
Figure 23—Seismic hazard estimation – sequential grid mine design
Figure 22—Gutenber-Richter relationship – sequential grid mine design
Table I
Comparison of seismic hazard between sequentialgrid and multi-raise mine design
Sequential grid Multi-raise
Time period 1/10/2004–1/7/2007 1/7/2007–1/4/2009
Largest event 2.6 2.7
Mmax expected 2.9 2.9
Return period of ML =1.0 4 per month 6 per month
Return period of ML = 2.5 1 per year 1 per year

Rock engineering aspects of a modified mining sequence in a dip pillar layout
properly quantified, however. Malan et al. (2007) describethe time-dependent behaviour of the fractured rock masswhen conducting closure measurements in deep gold minestopes. The presence of this time-dependent behaviourimplies that mining rate will play a role in the response of therock mass. Figure 27 illustrate closure measurementsconducted at Kusasalethu Mine in 1999. Although thebrittleness of the rock mass is clearly illustrated by the largejumps in closure at blasting time, noticeable time-dependentrock movements were recorded between successive blasts.Malan et al. (2007) also conducted inelastic numericalmodelling with a time-dependent constitutive for the failedrock. This illustrated that the position of the stress peak
ahead of the face will be a function of mining rate, and highrates may lead to stress peaks close to the face and a higherrisk of strain-bursting (Figure 28). The effect of differentvolumes of mining over a larger area is not clear, however.
ConclusionsA study was conducted to compare the original sequentialgrid mining sequence with a new multi-raise sequence. Thelayout geometry for these methods is essentially similar, buthigher production rates are possible with the multi-raisesequence as it allows for simultaneous attack points on thesame level. A study of the seismic data for adjacent miningareas where the two methods were used found no significant
�
1110 VOLUME 115
Figure 24—Location of all seismic events recorded by seismic system since 1996 with ML ≥ 2.0 for the bottom of the west mine
Figure 25—Gutenberg-Richter relationship for the bottom section of the west mine (multi-raise sequence)
differences in terms of the seismic response. A numericalmodelling study of the two methods illustrated only smalldifferences in the simulated energy release rates (ERRs) andaverage pillar stress (APS) levels during the extractionprocess. As to be expected with elastic modelling, the final
values for the two mining methods are similar as the finalgeometries are identical. The interim ERR and dip pillar APSvalues are slightly higher for the multi-raise sequence as thevolume of extraction is more rapid. The numerical modelswere also used to conduct a modelled magnitude assessment.
Rock engineering aspects of a modified mining sequence in a dip pillar layout
VOLUME 115 1111 �
Figure 27 – Continuous closure measurements collected at Kusasalethu Mine in the 8817VCRPAN-E5 panel in 1999. Note the prominent time-dependentclosure between successive blasts (after Malan and Van Rensburg, 1999)
Figure 28—Simulated effect of mining rate on the nature of the stress peak ahead of the stope face (after Malan et al., 2007)
Figure 26—Seismic hazard estimation – bottom section of west mine (multi-raise sequence)

Rock engineering aspects of a modified mining sequence in a dip pillar layout
This also showed no significant differences in the anticipatedseismicity for the two mining sequences. Based on the studyand the data available at this stage, it is concluded that themulti-raise mining sequence has no adverse effects on themine stability when compared to the original sequential gridmethod. This work is nevertheless considered as being of apreliminary nature and ongoing monitoring and analysis ofseismic data at the mine is required to verify the response ofthe rock mass to the modified sequence and increasedextraction ratio. In particular, future work needs toinvestigate the effect of mining rate (advance rates inindividual panels as well as volume of mining in particularraiselines) on the level of seismicity.
AcknowledgementsThis work formed part of the MSc study of the first author atthe Department of Mining Engineering, University of Pretoria.Harmony Gold supported the publication of this paper and theauthors wish to express their sincere thanks to management.In addition, Kevin Riemer provided valuable support andencouragement during the compilation and analysis of theseismic data.
ReferencesAPPELGATE, J.D. and ARNOLD, D.A. 1990. Stabilising pillar design – 76 to 85
levels, Internal report, Elandsrand Gold Mine, Anglogold.
APPELGATE, J.D. 1991. Rock mechanics aspects of sequential grid mining. MScdissertation, University of the Witwatersrand.
COOK, N.G.W. and SALAMON, M.D.G. 1966. The use of pillars for stope support.Chamber of Mines of South Africa, Unpublished report.
DELIAC, E.P. and GAY, N.C. 1982. The influence of stabilizing pillars onseismicity and rockbursts at ERPM. Proceedings of the 1st InternationalCongress on Rockburst and Seismicity in Mines, Johannesburg. pp. 257–263.
EBRAHIM-TROLLOPE, R. 2001. Gutenberg-Richter relationship and mine inducedseismicity as observed at the African Rainbow Minerals mines –Klerksdorp. Proceedings of the Fifth International Symposium onRockbursts and Seismicity in Mines. Van Aswegen, G., Durrheim, R.J., andOrtlepp, W.D. (eds.). Symposium Series S27. South African Institute ofMining Metallurgy, Johannesburg. pp. 501–508.
HAGAN. T.O. 1987. An evaluation of systematic stabilizing pillars as a methodof reducing the seismic hazard in deep and ultra-deep mines. PhD thesis,University of the Witwatersrand, Johannesburg.
HANDLEY, M.F, DE LANGE, J.A.J., ESSRICH, F., and BANNING, J.A. 2000. A review ofthe sequential grid mining method employed at Elandsrand Gold Mine.Journal of the South African Institute of Mining and Metallurgy, vol. 91.pp. 145–157.
HEUNIS, R. 1980. The development of rock-burst control strategies for SouthAfrican gold mines. Journal of the South African Institute of Mining andMetallurgy, vol. 80, no. 4. pp. 139–150.
HEUNIS, R. 1980. The development of rockburst control strategies for SouthAfrican gold mines. Journal of the South African Institute of Mining andMetallurgy, vol. 80, no. 4. pp. 139–150.
HILL, F.G. 1942. A system of longwall stoping in a deep level mine with specialreference to its bearing on the pressure burst and ventilation problems.Association. of Mine Managers of the Transvaal. Papers and Discussions,vol. 1. pp. 257–276, Johannesburg.
HOFMANN, G. 2012. Correlating modelled elastic energy release with recordedseismicity in a deep tabular mine. Proceedings of the Second SouthernHemisphere International Rock Mechanics Symposium (SHIRMS 2012),Sun City, South Africa, 14–17 May 2012. Southern African Institute ofMining and Metallurgy. pp. 407–423.
JAGER, A.J. and RYDER, J.A. 1999. A handbook on rock engineering practise fortabular hard rock mines. Safety in Mines Research Advisory Committee,Johannesburg.
JOUGHIN, N.C. 1966. The measurement and analyses of earth motion resultingfrom underground rock failure. Research Report, No. 73/66. Chamber ofMines of South Africa, Johannesburg.
KIJKO, A. 1997. Seismic hazard estimation for the northern part of Shaft No. 5.Consultancy Report for Vaal Reefs Exploration and Mining Company.
LENHARDT, W.A. and HAGAN T.O. 1990. Observations and possible mechanismof pillar-associated seismicity at great depth. Proceedings of the.International Deep Mining Conference, Johannesburg, September 1990.Vol. 2. Technical Challenges in Deep Level Mining. South African Instituteof Mining and Metallurgy, Johannesburg. pp. 1183–1194.
MALAN, D.F. and JANSE VAN RENSBURG, A.L. 2000. Continuous closuremeasurements at Elandsrand Mine (8817VCRPAN-E5/E6), InternalReport.
MALAN, D.F., NAPIER, J.A.L., and JANSE VAN RENSBURG, A.L. 2007. Stopedeformation measurements as a diagnostic measure of rock behaviour: Adecade of research. Journal of the Southern African Institute of Miningand Metallurgy, vol. 91. pp. 145–157.
MALOVICHKO, D., VAN ASWEGEN, D., and CLARK, R. 2012. Mechanisms of largeseismic events in platinum mines of the Bushveld complex (South Africa).Journal of the Southern African Institute of Mining and Metallurgy, vol. 112. pp. 419–429.
MCGARR, A and WIEBOLS, G.A. 1977. Influence of mine geometry and closurevolume on seismicity in a deep level mine, International Journal of Rock.Mechanics and Mining Sciences and Geomechanics Abstracts, vol. 14. pp. 139–145.
MURIE, A. 1980. The regional effect of leaving unpay blocks of ground and/or asystem of regular spaced rib pillars for the scattered mining areas above2238 level. Internal memorandum. Elandsrand Mine.
RUSSO-BELLO, F. and MURPHY, S.K. 2000. Longwalling at great depth in ageologically disturbed environment – the way forward. Journal of theSouth African Institute of Mining and Metallurgy, vol. 100, no. 2. pp. 91–100.
RYDER, J.A. 1988. Excess shear stress in the assessment of geologicalhazardous situations. Journal of the South African Institute of Mining andMetallurgy, vol. 88. pp. 27–39.
SALAMON, M.D.G. and WAGNER, H. 1979. Role of stability pillars in thealleviation of rockburst hazards in deep mine. Proceedings of the 4thCongress of the International Society for Rock Mechanics, Montreux, vol, 2. pp. 561–566.
SCHEEPERS, L.J., HOFMANN, G, and MORKEL, I.G. 2012. The study of seismicresponse to production for a grid mining layout. Proceedings of the SecondSouthern Hemisphere International Rock Mechanics Symposium (SHIRMS2012), Sun City, South Africa, 14–17 May 2012. Southern AfricanInstitute of Mining and Metallurgy, Johannesbrg. pp. 387–406.
STANKIEWICZ, T. 2000. Seismic Hazard Estimations for remnants in the 2K, 2F,2P, 2G blocks Reef. AngloGold Consultancy Reports, GeoHydroSeis.
STANKIEWICZ, T. 1998a. Preliminary estimation of seismic hazard for Vaal ReefsNo. 11 Shaft. Internal Report. Anglogold.
Stankiewicz, T. 1998b. Estimation of seismic hazard associated with reefblocks. Internal Report. Anglogold.
TANTON, J., MCCARTHY, T., and HAGAN, T. 1984. Introduction of stabilizing pillarsto reduce rockbursts at Western Deep Levels. Proceedings of the 1stInternational Congress on Rockbursts and Seismicity in Mines,Johannesburg. pp. 245–252. South African Institute of Mining andMetallurgy, Johannesburg.
WILES, T., LACHENICHT, R., and VAN ASWEGEN, G. 2001. Integration ofdeterministic modelling with seismic monitoring for the assessment of therockmass response to mining: Part 1 Theory. Proceedings of the FifthInternational Symposium on Rockbursts and Seismicity in Mines. VanAswegen, G., Durrheim, R.J., and Ortlepp, W.D. (eds.). Symposium SeriesS27. South African Institute of Mining Metallurgy, Johannesburg. pp. 379–387. �
�
1112 VOLUME 115