vaccine supply: effects of regulation and competition · · 2017-07-12vaccine supply: effects of...
TRANSCRIPT

Vaccine Supply: Effects of Regulation and
Competition
PATRICIA M. DANZON and NUNO SOUSA PEREIRA
ABSTRACT In US vaccine markets, competing producers with high fixed, sunk costsface relatively concentrated demand. The resulting price and quality competition leadsto the exit of all but one or very few producers per vaccine. Our empirical analysis ofexits from US vaccine markets supports the hypothesis that high fixed costs and bothprice and quality competition contribute to vaccine exits. We find no evidence thatgovernment purchasing has significant effects, possibly because government purchasetends to increase volume but lower price, with offsetting effects. Evidence from the fluvaccine market confirms that government purchasing is not a necessary condition forexits and the existence of few suppliers per vaccine in the US.
Key Words: Vaccines; Government; Procurement; Firm Exit; Pharmaceuticals.
JEL classifications: D4, I11, I18, L11.
1. Introduction
Vaccines can provide an extremely cost-effective technology for dealing withinfectious diseases, saving lives and averting millions of dollars of potentialhealth expenditures.1 But the supply of pediatric vaccines in the US appearsprecarious, with a declining number of producers and products. In 1967 therewere 26 licensed manufacturers, but only 12 in 2002. Five firms produce almostall routine childhood vaccines, with a sole supplier for five of the eight recom-mended pediatric vaccines.2 When key suppliers experience manufacturingproblems, supply interruptions and vaccine shortages interrupt immunizationschedules, sometimes leading to children not being immunized. For flu
Patricia M. Danzon, Celia Mah Professor, The Wharton School, University of Pennsylvania, 3641 LocustWalk, Philadelphia, PA 19104, USA; e-mail: [email protected]. Nuno Sousa Pereira, Dean,Business School, University of Porto, Rua de Salazares, 4200-464 Porto, Portugal; e-mail: [email protected].
Int. J. of the Economics of Business,Vol. 18, No. 2, July 2011, pp. 239–271
1357-1516 Print/1466-1829 Online/11/020239–33� 2011 International Journal of the Economics of Business
DOI: 10.1080/13571516.2011.584429

vaccine, supply shortages during the narrow annual window for effectiveadministration have posed risks to vulnerable populations.
Not all is gloom and doom in the vaccine business, however. Historically,entry of firms and products has been rapid when scientific advance createsnew opportunities. Global vaccine sales doubled during the 1990s, from $2.9billion in 1992 to over $6 billion in 2000,3 although global sales of basic vac-cines dropped 40% over the same period.4 Global vaccine sales increased 16%from 2008–09, reaching $22.1 billion.5 This growth reflects new pediatric prod-ucts, including varicella, rotovirus and childhood pneumococcal vaccines, inaddition to travel and adult vaccines, including a cervical cancer vaccine andnew vaccine combinations. Vaccine manufacturers spend about 16% of sales onR&D, a comparable ratio to the pharmaceutical industry. Some large pharma-ceutical companies have recently entered the vaccine industry through acquisi-tion (for example, Pfizer’s $68 billion purchase of Wyeth was partly for itsvaccine business; Novartis acquired Chiron, Abbott purchased Solvay), andseveral biotech firms have entered in the US and other countries. Thus precari-ous supply of existing vaccines co-exists with healthy entry to produce newvaccines.
The industrial organization literature has proposed general models of entryand exit to an industry (Caves, 1998). Entry has been modeled to reflect suchfactors as entry barriers, whether set-up costs are retrievable or “sunk”, poten-tial entry and exit of competitors, the extent of product substitutability etc.Theories of withdrawal from markets include some of the same but also somedifferent explanations, such as intrafirm cannibalization or interfirm competi-tion in multiproduct competition settings (Ruebeck, 2005), declining demand(Ghemawat and Nalebuff, 1985; 1990), age of the firm, firm size, and industry-specific characteristics, such as the extent of scale economies, the dynamics ofthe demand and knowledge conditions. Entry and exit have also been modeledas interrelated phenomena, with authors finding a high correlation betweenaverage entry and exit rates, across time and within industries, supporting theincorporation of entry as a determinant of exit and vice-versa (Carree andThurik, 1996; Disney et al., 2003; Dunne et al., 1988). The dynamic processesgoverning an industry’s structure include learning effects, both by producers(Jovanovic, 1992) and consumers, replacement and displacement effects (Carreeand Thurik, 1996), and the emergence of a dominant design. Studies alsoexamine levels of market concentration and its consequences for welfare. Forexample, industries with a low flow of entry and exit may be have limitedinnovativeness and some form of formal or tacit collusion (Geroski et al., 1985);on the other hand, a continuous change of competitors may be socially ineffi-cient, particularly in activities with significant investment of capital, time andknowledge.
This paper focuses on exit from (and to a lesser extent entry to) the vaccineindustry from 1903 to 2005. We draw on some of the factors considered in thegeneral industrial organization literature but also factors specific to vaccines.Compared to most industries (but similar to other pharmaceuticals), the vac-cine industry is highly R&D intensive and heavily regulated, in the US by theFood and Drug Administration (FDA) and by similar authorities in other coun-tries, with high regulatory costs of entry and continued operations. However,unlike most other pharmaceuticals in the US, vaccines also face government asa significant customer, at least for the pediatric vaccines that are recommended
240 P.M. Danzon and N.S. Pereira

by the US Centers for Disease Control and Prevention (CDC). Previous eco-nomic analyses of the vaccine industry have focused on the role of governmentprocurement in general – and government price setting in particular – in mak-ing vaccine markets less attractive than markets for other pharmaceuticals. Lia-bility risks have also allegedly made vaccines unattractive.
We posit that exogenous advances in basic science create the potential toproduce new and/or improved vaccines against specific diseases such as hepa-titis B, rotovirus etc. Following such a knowledge shock, several firms mayengage in R&D to apply this knowledge to produce a vaccine product. ThisR&D race may result in several, slightly differentiated products that meet regu-latory requirements for safety and efficacy entering the market at differenttimes. Even if one product has been approved, other firms may rationally con-tinue with their clinical trials, given the ex ante risks associated with regula-tory approval and market acceptance and the fact that significant researchcosts may already be sunk. We document but do not model this entry process.
Our model of vaccine exits posits that, for a given technology, the vaccineproduction process is subject to non-increasing costs over a range that maysuffice to serve the entire US market. For public and private purchasers, thecross-price elasticity of demand between substitutable products is high andpurchasing is structured such that firms adopt non-cooperative, Bertrand pric-ing strategies. If multiple firms enter the market with close substitutable prod-ucts and each faces low and non-increasing marginal cost up to the scale of themarket, non-cooperative pricing implies that prices could potentially fall tomarginal cost. This creates pressures for all but one product to eventually exit.Products that have higher marginal costs, shocks to fixed costs (such as theneed to build new plants) or less desirable safety, efficacy or convenience attri-butes for consumers are more likely to exit. Prices for the surviving product(s)may nevertheless be constrained by contestability from foreign or previousentrants and/or monopsony power of purchasers, with the relative importanceof these factors differing across vaccine types.
In this model, new product entry to a vaccine type usually occurs inwaves, following technological or market changes. Exits are triggered by qual-ity and potential price competition, including dynamic entry of superior prod-ucts, and by regulatory or other shocks that raise costs of incumbent firms orreduce demand. In this model, government procurement as practiced by theCDC reduces prices primarily by exacerbating competition by design ofthe bidding process, not because the government imposes price regulation. Onthe other hand, government involvement through vaccine recommendationsand mandates increases quantity demanded, and hence may increase theexpected number of products/firms in a market, cet. par. Given these offsettingeffects of government on price and volume, the net effect of governmentinvolvement on number of suppliers or vaccine exit is theoretically ambiguousand must be determined empirically.
Our empirical analysis tests these hypotheses related to vaccine exit usingdata on vaccine license terminations between 1901 and 2003. The results con-firm that the hazard of exit increases with number of competitors and is morelikely following the entry of new competitors, whereas sole suppliers are lesslikely to exit. We find that over time, the vaccine industry has become muchmore demanding and exit propensities increased after the mid 1960s, whichmay reflect several factors: higher FDA safety, efficacy and manufacturing
Vaccine Supply: Effects of Regulation and Competition 241

quality requirements following the 1962 Amendments to the FDA Act;increased risk of strict tort liability after the 1966 Second Restatement of Torts;and possibly increasing government purchase of some vaccines after the mid1960s. Correlation between these three trends precludes indentifying their sep-arate effects. However, we do not find support for the common assertion thatprice regulation by the CDC or its share of volume purchased has contributedto vaccine exit, plausibly because these effects are offsetting. This finding, thatgovernment purchase on balance has no negative effect on firms’ willingnessto remain in the market, is consistent with the theoretical prediction, that com-petitive markets would likely lead to one or very few suppliers in the longrun, given the cost structure of vaccine supply, the relatively small marketcompared to many pharmaceuticals and limited storability of most vaccines.This finding is also consistent with casual evidence that vaccine producers infact seek out government recommendation and purchase of their vaccines.6
Section 2 of the paper describes previous related literature. Section 3 out-lines our model of vaccine supply and market equilibrium. Section 4 describesthe data and methods. Section 5 provides descriptive evidence on vaccine entryand exits. Section 5 reports hazard model estimates of exit for individual vac-cine products (licenses) and for vaccine producers. Section 6 presents evidenceon vaccine availability in Canada, France, Portugal and the UK, compared tothe US, and section 7 provides a case study of the flu vaccine market in the USthat illustrates the importance of high fixed costs and demand uncertainty.
2. Previous Literature
An extensive previous economic literature describes the institutional structureof vaccine supply and purchase, the economic case of mandatory vaccination,and appropriate subsidies for vaccine demand through reimbursement (seeIOM, 1985, 2003 and papers therein). A more limited number of papers exam-ine the effects of CDC procurement on prices and on vaccine shortages (e.g.Salkever and Frank, 1996). Kauf (1999) uses data from 1997–92 on private cata-log and federal contract prices for three vaccines (DTP, OPV and MMR) and1988–92 for Hib and Hep B to test empirically whether the public discount per-centage is more consistent with price discrimination or bargaining power. Sheconcludes that, while it is not possible to eliminate other factors, results favorthe bargaining power hypothesis. This conclusion is based primarily on findinga positive association between the public discount percent and the public shareof volume. She does not explicitly consider the role of competition and treatsnumber of suppliers as exogenous. She finds that the public discount off pri-vate catalog price is also positively related to number of licenses, which sheinterprets as consistent with the bargaining hypothesis but also with price dis-crimination. Both these studies use data that ignores private sector discountsand predates CDC’s shift away from winner-take-all procurement.
Scherer (2007) takes a more general approach to vaccine shortages. He con-siders high regulatory costs, inadequate profitability and mergers as possiblecauses of vaccine shortages, and argues that economies of scale and scope limitthe number of vaccine producers. Focusing on the influenza vaccine andassuming that shortages entail foregone vaccination, he provides roughestimates of the costs of vaccine shortages and concludes that maintainingadditional production sources with surge capacity would be cost-justified.
242 P.M. Danzon and N.S. Pereira
Scherer’s view of vaccine markets as natural monopolies in some ways resem-bles our hypothesis; however, he does not consider the dynamic competitionprocess whereby multiple firms enter and then most exit, and his empiricalanalysis focuses on simulating welfare costs of shortages for influenza, not thedeterminants of product and firm exit which are the focus of our analysis.
3. Vaccine Market Characteristics
3.1 Demand
Although vaccines are highly effective at disease prevention, their success is awinner’s curse for producers: the longer the treatment efficacy, the smaller isthe annual volume demanded. For pediatric vaccines that have lifetime effi-cacy, potential annual sales volume is limited by the size of the birth cohort.Moreover, idiosyncratic government vaccination policies result in differentpediatric vaccine requirements across countries. The potential annual demandis therefore lower for most vaccine formulations than for many therapeuticdrugs, especially drugs to treat chronic diseases. For adult vaccines and travel-ers vaccines, efficacy lasts for several years, hence booster doses are necessaryto maintain protection, but usage is generally limited to at-risk subpopulations.
Governments in all industrialized countries require and often subsidize vac-cination against major contagious diseases. The rationale is that the social bene-fits of vaccination exceed private benefits, because a person who gets vaccinatedreduces the probability that they themselves get the disease and that they trans-mit it to others. As more individuals in a group receive vaccination, the risk ofcontagion for those who remain unvaccinated declines to negligible levels – so-called herd immunity – which in turn creates an incentive for each individual tofree ride on vaccination of others, unless vaccination is mandatory. In the US,the Advisory Committee on Immunization Practices (ACIP) is an advisory bodycomprised of medical experts who recommend vaccination schedules for spe-cific subpopulations. For some pediatric vaccines, compliance with these recom-mendations may be required for school attendance, which makes therecommendations essentially a mandate. Government recommendations andmandates presumably increase total volume sold for recommended vaccines,compared to unconstrained voluntary market demand. But government recom-mendation or procurement may also concentrate demand on preferred productsand, conversely, reduce demand for competing, non-recommended products.
The effect of government’s role on vaccine prices depends on whether andhow the government actually procures vaccines, and its market share. In theUS, the CDC began purchasing vaccines for low income children in 1966. Dur-ing the 1980s, CDC’s share increased, varying across years and across vaccinesfrom around 30–40% for diphtheria, tetanus and pertussus (DTP) and polio, to40–50% and higher for measles, mumps and rubella (MMR). In 1989–91 a mea-sles epidemic resulted in thousands of cases of measles and hundreds ofdeaths. Following an investigation which showed that over half of childrenwith measles had not been vaccinated, in 1993 Congress established the Vac-cines for Children (VFC) program as an entitlement for children age 18 andbelow who may not otherwise have access to vaccines.7 Consequently thepublic share of childhood vaccines increased to over 50%. Procurementstrategies have varied over time, as purchasers learned about the effects of
Vaccine Supply: Effects of Regulation and Competition 243
their strategies on long term supply. Prior to 1993, the CDC applied awinner-take-all strategy, awarding all sales to the lowest bidder. This resultedin low prices and great volume uncertainty for suppliers. Since 1998, the CDCsolicits bid prices annually, which suppliers can adjust monthly but onlydownward. The CDC posts bid prices of potential suppliers, negotiates broadsupply contracts, usually with a near-zero minimum and a negotiated maxi-mum quantity. State and local recipients of federal funds for vaccines pur-chased under the VFC program choose which approved supplier to use. Statesthat participate in the Universal Purchase program may use their own funds topurchase vaccines for non-VFC-eligible patients at CDC prices.
In the private sector, vaccines are purchased by individual physicians andby hospitals and other institutions that often using group purchasing organiza-tion to negotiate prices with vaccine suppliers. These private purchasers arehighly price sensitive because they usually face a fixed reimbursement per vac-cine type from third party payers. Since they capture any margin, positive ornegative, between the reimbursement and their acquisition cost for the vaccine,their cross-price demand elasticity between competing products is likely to behigh. In such contexts, suppliers generally compete for market share by offer-ing discounts below the reimbursement price.
The global vaccine market similarly consists of large concentrated purchas-ers, each with somewhat specific requirements. In most industrialized coun-tries, national governments play a dominant role in defining vaccinationschedules, vaccine procurement and price setting. Vaccine purchase for LatinAmerica is largely managed by the Pan American Health Organization(PAHO), but each individual country decides which vaccines to purchase. Pro-curement and price negotiations are coordinated through PAHO, using com-petitive bidding. For developing countries, including purchases financedthrough GAVI, UNICEF serves as the procurement agency. For basic pediatricvaccines, UNICEF accounts for 40% of global volume but only 5% of marketvalue. Between 1992 and 2002, the number of manufacturers offering UNICEFits key DTP, BCG (tuberculosis), TT (tetanus) and measles vaccines dwindledto three or four for each vaccine.8 UNICEF has switched from winner-take-allprocurement to spreading its demand across several suppliers, in order to keepthem in the market and protect against supply interruptions. Most of the sup-ply to UNICEF is now from Indian and other emerging market suppliers, withonly small shares from the large multinational companies that supply theindustrialized countries. This partly reflects differentiation of products, as theindustrialized countries, especially the US, have moved towards newer, morecostly combinations of basic vaccines, acellular pertussis, IPV, and thimerosal-free products, whereas UNICEF purchases older, cheaper formulations.9
3.2 Supply
Cost Structure. Bringing a new vaccine to market entails high fixed investmentsin R&D (research, compound formulation and clinical development) and man-ufacturing capacity, each component of which is subject to regulatory require-ments for safety and quality assurance. The batch process required for vaccinesalso entails semi-fixed costs per batch. A batch may take 6–18 months to pro-duce, depending on the type of vaccine and production methods. Thus produc-tion is characterized by very high fixed and semi-fixed sunk costs and low
244 P.M. Danzon and N.S. Pereira

marginal cost per unit within each batch up to the capacity limit defined bythe maximum number of batches for the manufacturing plant.10 Changing pro-duction technology to meet changed regulatory standards or expand scaletakes years and millions of dollars, and requires FDA approval for the newplant. Such costs may be worth incurring only if they can be recouped overseveral years of sales.
Costs related to regulatory compliance have increased over time to meetrising quality standards. In addition, several explicit shocks have necessitatedmajor new investments. In particular, the 1972 requirement that all vaccinesdemonstrate efficacy imposed new costs on pre-1962 vaccines that had beengrandfathered under the 1962 FDA Amendments. The 1999 CDC request thatmanufacturers remove thimerosal required product and plant redesign andreapproval of manufacturing processes and facilities. The removal of thimero-sal, which is a preservative, may have exacerbated the short shelf life problemof vaccines, at least until new technologies could be developed and built intonew plants.
Patents and Generic Entry. Patent barriers to entry of competitors are weak formost vaccines, which often rely on propriety strains of the virus and some-times process patents. These do not preclude other firms from using differentstrains to supply competing products during the life of any patents. However,because vaccines are biologics, generics have not been able to use the abbrevi-ated new drug application (ANDA) process which enables generic equivalentsof chemical drugs to get approval by showing bioequivalence to the originatorproduct. Thus follow-on versions of existing vaccines are treated as originatorsand must undertake de novo clinical trials to demonstrate safety and efficacy.They would not necessarily be viewed by physicians/patients as perfect substi-tutes due to differences in vaccine strain.
Dynamic Competition. Although originator vaccines do not face generic competi-tors, their economic value is continually open to challenge by new, improvedproducts. For example, acellular pertussis replaced whole cell pertussis; inacti-vated polio replaced oral polio; and combination products have replaced singleproduct forms for most pediatric vaccines.11 Anticipation of improved technol-ogies undermines incentives to invest in new variants of older technologies orplants, particularly given the long lead times required by such investments.The tendency for dynamic entry of new, improved technologies to displace oldtechnologies may be exacerbated by government recommendation of the newover the older product, and concentrated public and private purchasing.
Liability Risks. Tort liability has sometimes been a more severe risk for vaccinesthan for most therapeutic drugs, because vaccines treat large numbers of healthyindividuals, usually children, and risks may be correlated.12 Allegations and liti-gation related to the pertussis vaccine in the 1980s were followed by the exit ofthree of the four manufacturers of pertussis vaccine (Offit, 2005). In 1986 Con-gress established the Vaccine Injury Compensation Program (VCIP) to provideno-fault compensation to children injured as a result of pediatric vaccines. Influ-enza vaccine is also covered by the VCIP, and other vaccines may apply. Vac-cine manufacturers may still occasionally face tort claims – for example, recentclaims related to thimerosal argued that this was a preservative, not intrinsic to
Vaccine Supply: Effects of Regulation and Competition 245

the vaccine. Although these claims have generally not succeeded, the legal costsof defending against claims and the risk that some may eventually succeed mayact as a disincentive for vaccine entry. However, this risk is now probably mod-est, at least for pediatric vaccines that are covered by the VCIP.
3.3 Market Equilibrium
High fixed costs of regulation and production are not a barrier to entry if thesecosts can, with reasonable certainty, be recouped over large volume and/orhigh margins. But the interaction of high fixed costs with relatively low, con-centrated and unpredictable demand and perishable supply is likely to resultin a market equilibrium that supports only one or few suppliers in most vac-cine markets at any point in time. If multiple firms initially enter and eachfaces non-increasing cost per unit, the equilibrium non-cooperative price isequal to marginal cost assuming Bertrand strategies13. The intuition is simple:once regulatory, capacity and batch costs are sunk, with few alternative cus-tomers in the current period and limited storage potential for future use, anyexcess of price above marginal cost contributes to covering the sunk costs,whereas if a firm loses a contract to a competitor, the product is likely to go towaste. Moreover, because capacity and batch production entail fixed and semi-fixed costs, respectively, that need to be planned a long time in advance, pro-ducers tend to target for high volumes of production as they cannot adjustlater if demand is higher than anticipated. If such pricing is anticipated, all butone firm will eventually exit and new entry is unlikely, unless the new producthas superior quality or lower cost than the incumbent. The likelihood of a solesupplier equilibrium is greater, the smaller the market relative to minimumefficient scale of production; the shorter the shelf-life of the product; and themore uniform are consumer preferences over product quality. Market domi-nance and survival in vaccines thus tends to be related to product superiorityfor the majority of patients, not to first mover advantage in a class.
Multiple products may coexist if they differ in efficacy or safety for differ-ent patient groups – for example, if some patients cannot tolerate one compo-nent of a combination, a variant that excludes that component may survive, asin the case of DTP and DT.14 Even then, a single firm is likely to dominate insupplying these differentiated products if it has economies of scope from pro-ducing both the combination and the component products. By contrast, inmany on-patent pharmaceutical classes multiple products coexist because eachproduct works best for some patients; markets are generally larger; customersare mostly atomistic purchasers, are price-insensitive due to insurance, and arenot driven by government recommendation; and the greater potential for stor-age enables manufacturers to inventory excess output for future sale.
With a sole supplier of a mandated childhood vaccine, the governmentshare of the market becomes a bilateral monopoly: the government has signifi-cant monopsony power because the manufacturer has incurred significant sunkcosts and has no other purchasers of comparable size, but the government alsohas no alternative suppliers. Given the declining number of producers, it isunsurprising that the CDC discounts decreased over time, from an average of75% off the supplier’s catalog price in 1987 to 50% in 1997, and that discountsare less on the newest, single manufacturer vaccines, such as varicella (9%)and pneumococcal conjugate (22%).15
246 P.M. Danzon and N.S. Pereira
In summary, the role of government purchasing in US vaccine markets hasbeen to define procurement rules for required vaccines that are eligible forgovernment subsidy. Prior to 1998, this involved competitive tendering andcentralized purchasing. Since 1998, the CDC simply solicits bids from willingsuppliers and purchasing is devolved to the states. The only direct price regu-lation is a ceiling on price increases, set at the growth in the consumer priceindex (CPI), for vaccines that had federal contracts in 1993. This regulation cre-ated incentives for suppliers to develop new formulations of the price-con-strained products – such as combinations – which are not subject to the CPIprice cap. Of the 48 vaccine licenses in existence in the US in 2004, 17 wereissued after 1993 (see Danzon et al., 2005, Exhibit 1). Moreover, the fact thatsupplier exit and supply disruptions have occurred for flu vaccine, for whichthe government is a minor purchaser and does not set price, suggests that gov-ernment purchase is not a necessary condition of firm exits (see below).
The conventional wisdom, that government purchase and “price controls”are the major contributors to lack of vaccine profitability, predicts that vaccineexit would be positively related to the quantity purchased by the governmentand inversely related to the government price.16 By contrast, our model pre-dicts that exit is triggered by static and dynamic competition, due to the highfixed costs and concentrated market demand. This model predicts that vaccineexit is positively related to the number of competitors and is more likelyfollowing entry of competitor vaccines that have some clear technological supe-riority, particularly if this superiority is reinforced by government recommen-dations. Similarly, entry of combination products is likely to displace the singlecomponents or smaller combinations.
In addition to withdrawal of vaccine products, the number of vaccine man-ufacturers has also been reduced through exit and mergers, including theacquisition of Connaught Laboratories by the Merieux Institute in 1989 andChiron’s purchase of Sclavo in 1998 and Powderject in 2003. Merger of firmsneed not necessarily lead to exit of products; for example, if the merger ismotivated by economies of scope across vaccine types, the range of combina-tion products offered following a merger might increase. But if being acquiredby another vaccine manufacturer is the least costly way of absorbing the excessproduction capacity for a product that has become obsolete, then an acquiredproduct would be more likely to exit. In that case the merger would be asymptom rather than the underlying cause of the exit of the obsolete product.
4. Data and Methods
4.1 Data
We collected data on the dates of grant and withdrawal of all vaccine licensesauthorized by the FDA for the period 1901 to 2003. For most of our analysis,the unit of observation is a vaccine product license, which authorizes a specificproduct and plant to manufacture that product. For vaccines that are used bothalone and in various combinations, each component vaccine and each combina-tion has a separate license and counts as a separate observation. For example,diphtheria vaccine exists alone and has been used in seven combinations, teta-nus exists alone and has been used in eight combinations. During our timeperiod, 241 licenses were granted, of which 179 were withdrawn and 62survived as of 2003.
Vaccine Supply: Effects of Regulation and Competition 247

We also report analysis of exit of vaccine suppliers at the firm level, usingthe FDA data on the firm holding the license. Thirty nine firms held at leastone license during our time period; of these, 10 firms were acquired and 12exited the vaccine business (measured by having no subsequent vaccinelicenses).
We obtained quantities purchased and prices paid by CDC, by vaccine, forall years for which data were available. Where data were missing for a fewyears, we imputed missing values by extrapolating between adjacent values.
4.2 Methods, Variable Definitions and Hypotheses
Because we have interval censored data, we estimate a hazard model of vac-cine exit, using a complementary log log function with time varying values ofco-variates:
Hjt ¼ hfCj;t�1;Rj;t�1;Zt�1;Xt�1g ð1Þ
In equation (1), Hjt is the hazard of exit of product j in period t, conditional onbeing licensed in period t-1. Explanatory variables include various measures ofcompetition, C; measures of CDC purchase and other regulatory influence, R;other product-specific or firm-specific characteristics, Z; and other factors, X.These variables and related hypotheses are defined below.
Competition. Since many vaccines exist both as single products and in combina-tion with other products (e.g. diphtheria + tetanus + pertussis (DTaP); measles,mumps, rubella (MMR)), there is no unique measure of number of competitorsfor each vaccine. We considered three alternative measures of number of com-petitor products: Direct Competitors is the number of variants of a specific vac-cine (e.g. diphtheria alone) produced by competitor firms (excluding the firmin question), and Indirect Competitors includes all combinations that includethe specific vaccine (e.g. all combinations that include diphtheria); and AllCompetitors is the sum of Direct and Indirect Competitors. Exit is expected tobe positively related to both direct and indirect competition. Greater effects arepredicted for Direct Competitors (same vaccine) if substitutability is the onlyissue; however, if patients prefer combination products over single vaccines(due to the greater convenience, lower time costs and perhaps lower out-of-pocket cost), then Indirect Competitors is expected to have a larger effect onexit hazards than Direct Competitors. We also include an indicator variable,Single, for products that are the sole source of a particular vaccine. Singleproducts are less likely to exit, assuming that sole suppliers face higher meanand lower variance of expected revenue than producers that face competitors.
To test for effects of dynamic quality competition, we include the numberof New Products of exactly the same vaccine type between years t and t+1.New product entry is expected to be increase the likelihood of exit of estab-lished products, if newer entrants on average have superior attributes com-pared to existing products. We also tested measures of entry defined over t�2to t + 2. The measure reported here, based on entrants in t to t + 1, was consis-tently the most significant, suggesting that exit responds to anticipated as wellas actual entry. This variable includes new vaccines introduced by each vac-cine’s parent firm, so it reflects a firm’s own strategy as well as response to
248 P.M. Danzon and N.S. Pereira

competitors (correct, it includes both new licenses by same or other firms). Wealso include a binary variable, Input, that takes the value 1 if a product is alsoan input for combinations produced by the same firm in period t.
Government Procurement and Liability Variables. Universal Recommendation is abinary indicator of whether the vaccine was recommended for universal pur-chase by the ACIP; it is expected to be negatively related to the product exithazard, if ACIP recommendation increases demand for a vaccine.17
Government procurement is predicted to have a negative effect on pricebut possibly a positive effect on volume, with uncertain net effect on exit haz-ards. To test these hypotheses, we tried three possible measures of the quantityof CDC purchase: total doses of each vaccine type that were purchased byCDC in t�1 (CDC Quantity); the expected number of doses purchased by CDCper licensee (CDCQ/licensee) assuming that the total government purchasewere allocated equally among suppliers; and CDC share of doses (ShareCDCq). These proxies for expected volume are expected to be negativelyrelated to exit hazard, if CDC procurement increases expected demand for avaccine. The price per dose paid by CDC for each vaccine type in t�1 (CDC-Price) is expected to be inversely related to the exit hazard.18 All prices wereinflation-adjusted using the CPI price index. A binary variable indicates theyears before 1966, the first year of any CDC procurement (Pre CDC) andanother binary variable indicates if a vaccine type was not purchased by CDCin t�1 (No CDC).19 If the net effect of government procurement is to increasethe likelihood of vaccine exit, the coefficient of No CDC should be negative. Asimilar prediction applies tentatively to Pre-CDC; however, since other factorsalso changed between the pre-1966 and post-1966 environment, includingmany more potential competitors in the market, the interpretation of this vari-able is ambiguous and it is included mainly as a control.
A binary variable, Strict Liability (SL) was created to indicate years after1966, when the Second Restatement of Torts adopted strict product liability.The coefficient is expected to be positive if this increased the liability exposureof vaccine manufacturers in ways that could not be costlessly covered by insur-ance.20 However, because SL is perfectly collinear with the Pre CDC indicator,both cannot be included in regression analysis. A binary variable, VaccineInjury Compensation Program it-1, indicates that the vaccine was covered bythe VICP in year t-1; the coefficient is expected to be negative if, by reducingexpected liability costs, the VICP significantly increased manufacturers’ incen-tives to remain in the market. We also include an indicator Thimerosal, whichindicates vaccines that contained thimerosal in years after 1998; it is expectedto be positive, if the requirement to remove thimerosal imposed in early 1999contributed to vaccine exit. OBRA is an indicator for vaccines that were subjectto the CPI cap on price increases; it is expected to be positive if this constraintwas binding.
Product and Firm-Specific Factors. Age is the number of years since the productlicense was first granted; it is expected to be positive if new products offersuperior quality and hence tend to displace older products. Year of Entry mea-sures the vaccine’s year of launch. Acquired is a binary indicator for vaccinesthat have been acquired from the original licensee; the coefficient is expectedto be positive if acquisition is a means to exit the market and transfer
Vaccine Supply: Effects of Regulation and Competition 249
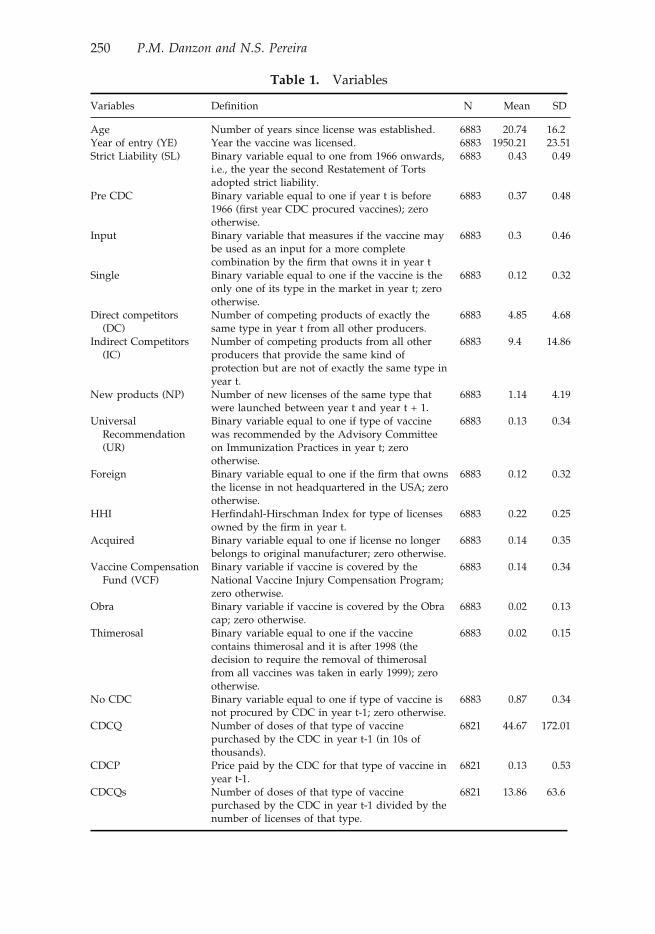
Table 1. Variables
Variables Definition N Mean SD
Age Number of years since license was established. 6883 20.74 16.2Year of entry (YE) Year the vaccine was licensed. 6883 1950.21 23.51Strict Liability (SL) Binary variable equal to one from 1966 onwards,
i.e., the year the second Restatement of Tortsadopted strict liability.
6883 0.43 0.49
Pre CDC Binary variable equal to one if year t is before1966 (first year CDC procured vaccines); zerootherwise.
6883 0.37 0.48
Input Binary variable that measures if the vaccine maybe used as an input for a more completecombination by the firm that owns it in year t
6883 0.3 0.46
Single Binary variable equal to one if the vaccine is theonly one of its type in the market in year t; zerootherwise.
6883 0.12 0.32
Direct competitors(DC)
Number of competing products of exactly thesame type in year t from all other producers.
6883 4.85 4.68
Indirect Competitors(IC)
Number of competing products from all otherproducers that provide the same kind ofprotection but are not of exactly the same type inyear t.
6883 9.4 14.86
New products (NP) Number of new licenses of the same type thatwere launched between year t and year t + 1.
6883 1.14 4.19
UniversalRecommendation(UR)
Binary variable equal to one if type of vaccinewas recommended by the Advisory Committeeon Immunization Practices in year t; zerootherwise.
6883 0.13 0.34
Foreign Binary variable equal to one if the firm that ownsthe license in not headquartered in the USA; zerootherwise.
6883 0.12 0.32
HHI Herfindahl-Hirschman Index for type of licensesowned by the firm in year t.
6883 0.22 0.25
Acquired Binary variable equal to one if license no longerbelongs to original manufacturer; zero otherwise.
6883 0.14 0.35
Vaccine CompensationFund (VCF)
Binary variable if vaccine is covered by theNational Vaccine Injury Compensation Program;zero otherwise.
6883 0.14 0.34
Obra Binary variable if vaccine is covered by the Obracap; zero otherwise.
6883 0.02 0.13
Thimerosal Binary variable equal to one if the vaccinecontains thimerosal and it is after 1998 (thedecision to require the removal of thimerosalfrom all vaccines was taken in early 1999); zerootherwise.
6883 0.02 0.15
No CDC Binary variable equal to one if type of vaccine isnot procured by CDC in year t-1; zero otherwise.
6883 0.87 0.34
CDCQ Number of doses of that type of vaccinepurchased by the CDC in year t-1 (in 10s ofthousands).
6821 44.67 172.01
CDCP Price paid by the CDC for that type of vaccine inyear t-1.
6821 0.13 0.53
CDCQs Number of doses of that type of vaccinepurchased by the CDC in year t-1 divided by thenumber of licenses of that type.
6821 13.86 63.6
250 P.M. Danzon and N.S. Pereira
production capacity to other uses. Foreign is a binary indicator for non-USfirms. To test whether vaccines are less likely to be withdrawn if the manufac-turer has a large or diversified vaccine portfolio across which to spread firm-specific fixed costs, we include a Herfindahl index of concentration of eachmanufacturer’s products over vaccine types.21 If economies of scope across vac-cine types are significant, due to spreading fixed costs of human or physicalcapital, risk diversification or potential for product combination, then exit isless likely for diversified firms. Table 1 lists variable definitions with meansand standard deviations.
5. Descriptive Evidence
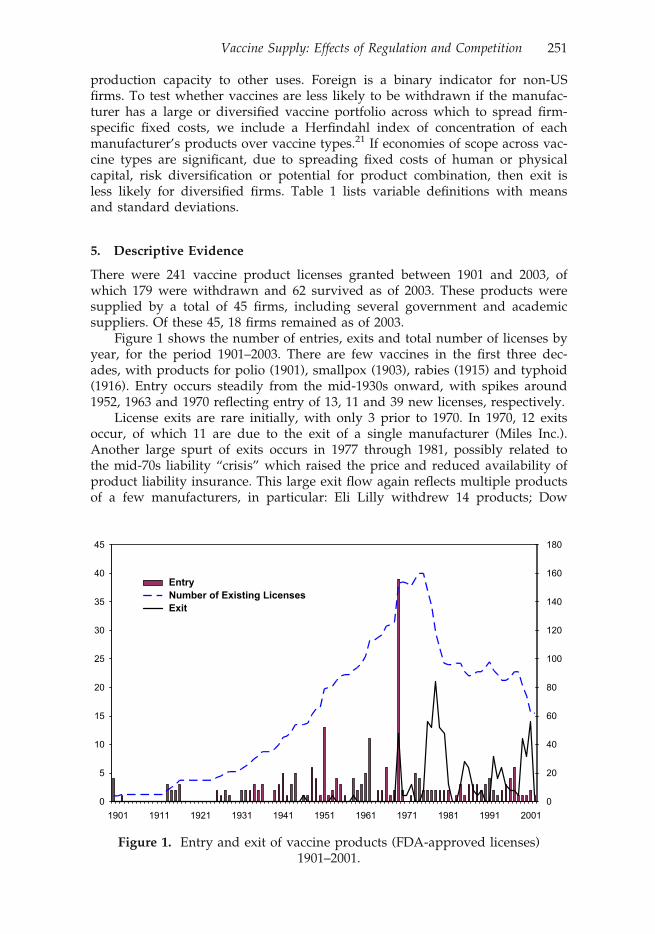
There were 241 vaccine product licenses granted between 1901 and 2003, ofwhich 179 were withdrawn and 62 survived as of 2003. These products weresupplied by a total of 45 firms, including several government and academicsuppliers. Of these 45, 18 firms remained as of 2003.
Figure 1 shows the number of entries, exits and total number of licenses byyear, for the period 1901–2003. There are few vaccines in the first three dec-ades, with products for polio (1901), smallpox (1903), rabies (1915) and typhoid(1916). Entry occurs steadily from the mid-1930s onward, with spikes around1952, 1963 and 1970 reflecting entry of 13, 11 and 39 new licenses, respectively.
License exits are rare initially, with only 3 prior to 1970. In 1970, 12 exitsoccur, of which 11 are due to the exit of a single manufacturer (Miles Inc.).Another large spurt of exits occurs in 1977 through 1981, possibly related tothe mid-70s liability “crisis” which raised the price and reduced availability ofproduct liability insurance. This large exit flow again reflects multiple productsof a few manufacturers, in particular: Eli Lilly withdrew 14 products; Dow
0
5
10
15
20
25
30
35
40
45
1901 1911 1921 1931 1941 1951 1961 1971 1981 1991 20010
20
40
60
80
100
120
140
160
180
EntryNumber of Existing LicensesExit
Figure 1. Entry and exit of vaccine products (FDA-approved licenses)1901–2001.
Vaccine Supply: Effects of Regulation and Competition 251

Chemical withdrew 11 products and exited totally in 1978; the Texas Depart-ment of Health Resources withdrew seven products and exited totally in 1979;Pfizer withdrew four oral polio products and exited totally in 1979; and ParkeDavis withdrew 16 products and exited totally in 1981. These products thatwere withdrawn between 1970 and 1981 represent several different vaccinetypes, but many were variants of diphtheria and tetanus, which had becomevery crowded markets, and three of the four pertussis producers exited. Partlyin response to this exodus of manufacturers from the vaccine market, the Vac-cine Injury Compensation Program was established in 1986. Whether for thisor other reasons, no more manufacturer exits occurred until 1988, when EliLilly withdrew its last product and exited, followed by Wellcome in 1994 andParkedale in 2001. The spike of product exits in 2000–03 includes five by Bio-port, four by Aventis Pasteur and 14 by Wyeth.
To illustrate the life-cycle of competitive entry, Figure 2 plots the meannumber of products of given vaccine type, by year from the date of first launchof that type. The predicting equation is a simple regression of number of com-petitors on an intercept and a quadratic in years since launch, all of which aresignificant at the 1% level. Separate estimates are made for Direct Competitors(same product) and for Indirect Competitors (combinations that include thisproduct).22 Interestingly, entry occurs mainly in Indirect Competitors. The pre-dicted number of Direct Competitors increases slowly from launch to reach amaximum of about four and then declines slowly. By contrast, the predictednumber of Indirect Competitors increases more sharply and peaks at roughly
0
2
4
6
8
10
12
14
16
1 4 7 10 13 16 19 22 25 28 31 34 37 40 43 46 49 52 55 58 61 64 67 70 73 76 79 82 85 88
Direct Competitors
All Competitors
Figure 2. Predicted number of competitors as a function of years of marketexistence.
Notes: Direct Competitors is the number of licensed vaccines of exactly the same type in year t that
are owned by other producers All Competitors is the sum of Direct Competitors plus other
licensed vaccines that include the vaccine in question in year t, including combination vaccines.
252 P.M. Danzon and N.S. Pereira

Table
2.
Impactofcompetition(hazardratios)
(1)
(2)
(3)
(4)
(5)
(6)
(7)
(8)
Age
1.05
3a1.063a
1.067a
1.068a
1.072a
1.085a
1.076a
1.089a
(7.21)
(6.60)
(6.28)
(6.29)
(6.03)
(7.05)
(7.11)
(6.88)
YE
1.03
1a1.041a
1.040a
1.041a
1.047a
1.063a
1.054a
1.067a
(4.71)
(5.00)
(4.74)
(4.81)
(5.01)
(6.09)
(5.71)
(5.94)
SLDV
14.341
a11
.332
a9.790a
9.477a
9.483a
7.903a
9.565a
7.319a
(8.48)
(4.97)
(4.63)
(4.56)
(4.41)
(3.86)
(4.12)
(3.74)
Input
0.39
9a0.322a
0.323a
0.321a
0.251a
0.227a
0.216a
0.223a
(�3.39
)(�
3.48)
(�3.31)
(�3.36)
(�3.91)
(�3.62)
(�3.53)
(�3.67)
Single
0.43
4a0.517b
0.539c
0.522c
0.457b
0.446a
0.473b
0.472b
(�2.71
)(�
2.03)
(�1.89)
(�1.93)
(�2.43)
(�2.56)
(�2.34)
(�2.38)
DC
1.055a
1.030b
1.028b
1.024
1.035c
1.032c
1.036b
(3.37)
(2.007)
(1.98)
(1.34)
(1.95)
(1.85)
(2.09)
IC1.015b
1.013c
1.022a
1.020a
1.019a
1.021a
(2.30)
(1.95)
(2.83)
(2.78)
(2.75)
(2.76)
NP
1.028a
1.026a
1.028a
1.028a
1.028a
(3.84)
(4.04)
(4.16)
(4.08)
(4.24)
UR
0.388a
0.354a
0.337a
0.343a
(�3.52)
(�3.58)
(�3.42)
(�2.95)
Foreign
0.308a
0.310a
0.302a
(�4.43)
(�4.37)
(�4.50)
HHI
0.768
0.772
0.803
(�0.52)
(�0.51)
(�0.44)
Acq
uired
0.869
0.839
0.893
(�0.55)
(�0.68)
(�0.46)
VCF
1.225
(0.65)
Obra
0.947
(�0.13)
Thim
erosal
1.444
(1.25)
(Continued)
Vaccine Supply: Effects of Regulation and Competition 253

Table
2.(C
ontinued)
(1)
(2)
(3)
(4)
(5)
(6)
(7)
(8)
NoCDC
1.05
3(0.13)
CDCPrice
0.86
4(�
0.85
)CDCQ/license
1.00
1(0.69)
Log-Likelihood
�716
.59
�712
.76
�708
.95
�707
.14
�697
.66
�683
.53
�682
.33
�678
.92
Waldch
i211
5.64
106.69
102.27
118.58
111.98
195.30
371.45
258.03
D.o.f.
56
78
912
1515
Licen
ses
241
Even
ts17
9Spells
6883
6883
6883
6883
6883
6883
6883
6821
Note:Figuresin
paren
theses
arez-statistics.Superscripts
a,ban
dcindicatethat
theestimated
coefficien
tsaresignificantat
the1%
,5%
and10
%significance
levels,
resp
ectively.
254 P.M. Danzon and N.S. Pereira

14.23 Note that within the average pattern of life-cycle entry shown in Figure 2,the experience varies across different vaccine types. In particular, some of themandated pediatric vaccines, especially diphtheria, tetanus and pertussis, werein numerous combinations in the 1970s and then were combined with Hib,Hepatitis B and inactivated polio more recently. At the other extreme, vaccinessuch as smallpox, rabies, cholera, lyme disease, have had only one or two sup-pliers throughout their life-cycles and have never been combined with othervaccines. We report the multivariate analysis of product exit based on the fullsample; however, results were essentially the same and significance increasedslightly when we excluded those vaccines that had only a single producer overthe entire period.
6. Hazard Function Analysis of Vaccine Exit
Table 2 reports hazard ratios from the hazard function analysis of vaccine exit,including measures of competition, regulation, product and firm characteris-tics. Table 3 reports alternative specifications to estimate the effects of CDCpurchase, controlling only for product age and year of entry. The coefficientsare hazard ratios, hence values less (greater) than 1 imply reduced (increased)probability of exit.
In Table 2, the first equation includes only basic product characteristicsand a control for the pre-CDC time period which is also the period before for-mal adoption of strict liability. Unfortunately, because both the procurement
Table 3. Market trend and CDC’s role (hazard ratios)
(1) (2) (3) (4) (5) (6) (7)
Age 1.107a 1.103a 1.110a 1.111a 1.111a 1.110a 1.111a
(14.05) (10.22) (10.81) (10.91) (10.80) (10.93) (10.91)YE 1.082a 1.079a 1.086a 1.087a 1.087a 1.086a 1.087a
(10.87) (7.94) (8.58) (8.70) (8.63) (8.69) (8.71)SLDV 4.014a 3.703a 3.813a 3.779a 3.774a 3.773a 3.757a
(8.48) (5.59) (5.99) (6.02) (6.03) (6.05) (6.08)Pre CDC 0.729 0.860 0.869 0.867 0.856 0.864
(�0.46) (�0.22) (�0.21) (�0.21) (�0.23) (�0.22)No CDC 1.202 1.222 1.058 1.044 1.136 1.025
(0.88) (0.70) (0.20) (0.12) (0.52) (0.08)CDCQ 1.000 1.000
(�0.13) (�0.12)CDCPrice 0.821 0.822 0.842
(�1.29) (�1.30) (�1.19)CDCQ/license 0.999 0.999
(�0.65) (�0.37)
Log-Likelihood �726.02 �725.54 �720.22 �719.68 �719.68 �719.99 �719.61Wald chi2 251.91 265.27 274.35 271.26 276.66 271.05 271.49D.o.f. 3 5 6 6 7 6 7Licenses 241Events 179Spells 6883 6883 6821 6821 6821 6821 6821
Note: Figures in parentheses are z-statistics. Superscripts a, b and c indicate that the estimated coef-ficients are significant at the 1%, 5% and 10% significance levels, respectively.
Vaccine Supply: Effects of Regulation and Competition 255

and the legal regime changed in 1966 these two variables are highly correlatedand cannot be included together. Successive specifications then add variousmeasures of competition, firm characteristics and regulation. The hazard rateof exit increases between 5 and 9% for each year the vaccine is on the market.However, this rate also increases around 3 to 6% with year of entry, implyingthat newer vintage vaccines are at higher risk of exit. These estimates arerobust to the addition of measures of competition, regulation and other charac-teristics. The pre-CDC indicator is strongly negative, implying that vaccine exitrisk was much lower in the pre-CDC/pre-Strict liability era. The estimatedeffect of the pre-CDC indicator declines but remains significantly negative inspecifications that control for measures of competition, and CDC prices andquantities.
Controlling for these basic product and time period characteristics, eachadditional Direct Competitor increases the exit hazard rate by roughly 3%, andeach additional Indirect Competitor increases exit hazard rate by 2%. Control-ling for number of competitors in year t, the entry of new competitors in year tto t + 1 increases the exit hazard of established products by 2–3%, consistentwith the dynamic competition hypothesis, that new entrants are typically supe-rior products and therefore tend to accelerate the exit of established products.Vaccines that are monopoly suppliers (Single) have an exit hazard over 50%lower than vaccines that have competitors. This supports the hypothesis thatcompetition contributes to low prices and hence that sole supplier products aremore able to achieve prices necessary to cover long run costs. Vaccines that areinputs to combinations have a rate 70% lower exit hazard than other vaccines,as expected if these core input vaccines tend to complement rather than substi-tute for the combination vaccines to which they contribute.
The effects of policy variables are mixed. Vaccines that are recommendedfor Universal Purchase have a 60% lower exit rate. Controlling for UniversalPurchase, we find no significant effect of whether or not the CDC is a pur-chaser of the vaccine, the volume of units purchased by the CDC or the CDCprice. Similarly, we find no significant effect of eligibility for the Vaccine InjuryCompensation Program or the indicator that a vaccine was subject to theOBRA price control. Following the adverse publicity over thimerosal in 1998and requirement to eliminate it in early 1999, products that contained thimero-sal have an exit hazard that is 44% higher. Although this coefficient is not sig-nificant at conventional levels, this may reflect the very small number ofproducts involved.
Vaccines that have been acquired are less likely to exit than vaccines thatare still owned by their originator firm, but this result is not significant. Thisevidence suggests that merger of firms has not been a major contributor to exitof vaccine products, although it has reduced the number of vaccine suppliers.Rather, the evidence here tentatively supports the theory of merger as a marketfor corporate control, in which vaccines are acquired in order to enhance theirmarket potential, not as a means to eliminate excess capacity. The Herfindahlmeasure of a firm’s vaccine portfolio is not significant. However, vaccines pro-duced by foreign firms are less likely to exit, exhibiting a hazard rate that isclose to 70% lower than US firms. This could suggest that foreign firms facehigher regulatory and other costs of entry, such that foreign firms only launchin the US the subset of their products that have atypically high potential valueand survival potential.
256 P.M. Danzon and N.S. Pereira

Table 3 reports more detailed attempts to estimate the effects of CDC pur-chasing. Controlling for a vaccine’s age and cohort, the indicator for the pre-CDC time period is strongly negative, implying increased exit risk in the post-CDC time period. Given the highly correlated timing of increased governmentpurchasing by CDC, increased tort liability risk following the 1966 SecondRestatement of Torts and increased FDA-related costs after the 1962 FDAAmendments, their marginal contributions cannot be identified and the Pre-CDC variable must be interpreted as reflecting their combined effects. Control-ling for these factors, the coefficient on the indicator for no CDC purchase ispositive but not significant. The measures of CDC quantity are not significant.The CDC price is negative, consistent with the expectation that a lower priceshould increase the exit hazard, but the coefficient is not significant at conven-tional levels. Our CDC price and quantity variables may be measured witherror, which may create bias towards finding no significant effects. We lackdata on private sector prices and hence are unable to normalize the CDC priceby the private sector price. Even if list prices to private purchasers were avail-able, these would not measure transactions prices which are often significantlydiscounted. Overall, these results based on the universe of vaccines for theentire industry lifetime suggest that having a Universal Purchase recommenda-tion significantly reduces the probability of exit, consistent with the predictionthat universal purchase increases demand for a vaccine. However, the volumeand price of CDC purchase do not appear to have significant effects, possiblybecause the negative effect of government purchase on price is offset by thepositive effect on volume, leading to no significant net effect. The probabilityof exit was lower before 1966, but whether this reflects absence of CDC pur-chasing, lower liability threat or other factors cannot be distinguished giventhe correlation between these factors.
Table 4. Exit of firms (hazard ratios)
Events treated jointly Exit Acquired
Age 1.099a 1.074a 1.152a
(6.17) (4.70) (4.26)YE 1.085a 1.068a 1.120a
(5.72) (4.04) (3.42)Single 0.119b 0.230 0.048b
(�2.31) (�1.19) (�2.24)Foreign 0.368c 0.311 0.744
(�1.79) (�1.46) (�0.35)HHI 2.627 10.219 0.789
(1.09) (1.63) (�0.18)Time since last launch 0.966 1.006 0.881a
(�1.15) (0.16) (�2.90)Log-Likelihood �86.44 �52.66 �42.40Wald chi2 66.57 64.18 30.63D.o.f. 6Firms 39Events 22 12 10Spells 1269
Note: Figures in parentheses are z-statistics. Superscripts a, b and c indicate that the estimated coef-ficients are significant at the 1%, 5% and 10% significance levels, respectively.
Vaccine Supply: Effects of Regulation and Competition 257

Table
5.
Valid
license
holdersan
dyearoflicense
bycountryin
2004
Type
USA
Canad
aUK
France
Portugal
DTP&
HBV
&
IPV
&Hib
AVT(200
01,6)GSK(200
01)
AVT(200
06)GSK(200
0)
DTP&
HBV
&
IPV
GSK(20021)
AVT(199
86)GSK(200
0)
DTP&
IPV
&
Hib
AVT(199
71)
AVT(199
81,20
021)
AVT(199
3,19
936,19
981,19
981,6)
GSK(19971)
AVT(199
86,20
006)GSK(199
9)
DTP&
HBV
GSK(1996,
1997)
DTP&
Hib
AVT(199
61)W
YE
(199
3)AVT(199
5)GSK(200
21)
AVT(199
3,19
981)
AVT(200
06)GSK(200
0)
DTP&
IPV
AVT(199
71)
AVT(199
81,20
011)GSK(20041)
AVT(197
56,19
85,19
981,6,20
021,6)
GSK(19961)
AVT(199
86,20
016,20
026)
DTP
AVT(199
21,
2002
1)BXT
(199
81)GSK
(199
71)
AVT(199
61,
1999
1)
AVT(199
3)CHR(199
7)GSK
(199
91,20
011)
AVT(199
7)AVT(199
16)GSK(199
6,19
97,20
00)
RVL(198
0)
DT&
IPV
AVT(198
4,19
95)
AVT(200
3)AVT(197
76,20
006)
AVT(199
96)
DT
AVT(195
52,19
84,
1997)CHR(1997)
MBL(197
02)
AVT(198
02)ID
B(199
1)AVT(199
3,19
932)CHR(199
82)
AVT(198
4,19
96,19
962)
AVT(200
3)GSK(19962)RVL(198
0,19
802)
DSSI(19
98)
RVL(196
9)T
AVT(193
4,19
70)
MBL(197
0)SSI
(199
8)
AVT(198
0)ID
B(199
1)AVT(199
3)CHR(199
8,20
01)
AVT(197
3,19
786)AVT(197
54,6, )
AVT(198
75)
AVT(199
16)GSK(199
6)
PRFM(19921)TKD
(199
11)
MeaM
RMRK(197
1)GSK(1998)
MRK
(197
9)AVT(199
6)GSK(199
7)AVT(198
5,19
936,19
946)GSK(1999)
AVT(199
96)GSK(199
8)RVL(198
9)
MeaM
MRK(197
3)M
eaR
SSB(1996)
AVT(199
4)AVT(198
1)M
ea
MRK(196
3)AVT(198
9)AVT(198
6)GSK(1984)
MMRK(196
7)AVT(199
6)AVT(198
3,20
016)
(Continued)
258 P.M. Danzon and N.S. Pereira
Table
5.(Continued)
Type
USA
Canada
UK
France
Portugal
RMRK(196
9)AVT(198
9,19
92,19
95,19
95)
AVT(198
8)AVT(198
56)
PNC_c
WYE(2000)
WYE(2001)
WYE(2001)
WYE(2001)
PNC_p
MRK(197
7)AVT(1997)
MRK(1978)
AVT(200
0,20
00)
AVT(199
6,20
016,20
016)SLV(198
5)AVT(199
86,20
016)
Polio
AVT(198
73,
1990
3)W
YE
(196
3)
AVT(19873,
1997
3)
AVT(200
43)GSK(1994,
1994)
AVT(198
23)
AVT(200
06)GSK(1984)
Var
MRK(199
5)GSK(1999)
MRK
(200
2)GSK(2002)
AVT(200
3)AVT(200
36)GSK(2003)
AVT(200
36)GSK(2003)
HBV
GSK(1989)
MRK
(198
6)GSK(1991)
MRK
(198
7)AVT(200
1)GSK(2001)
AVT(198
76,20
016)GSK(1994)
AVT(200
16)GSK(1987)
HAV&HBV
GSK(2001)
GSK(1997)
GSK(199
6)GSK(1996,
2002
)HAV
GSK(1995)
MRK
(199
6)AVT(1998)
BBT
(199
9)GSK
(199
5)MRK
(199
6)
AVT(199
6,19
96)GSK(1994)
ISB(1999)
AVT(199
6,19
966,19
976)GSK(1994)
ISB(200
3)AVT(199
76,19
976)GSK(1997)
ISB
(200
0)
HAV&Typ
AVT(200
1,20
01)GSK(1999)
AVT(200
36,20
03)
AVT(200
26)
Hib&HBV&M
en
AVT(199
96)
Hib&HBV
MRK(199
6)GSK(1996)
Hib
AVT(199
3)MRK
(198
9)W
YE
(198
8)
AVT(1992)
MRK(1997)
AVT(199
2)GSK(1999)
WYE
(199
2)AVT(199
2,19
926)GSK(1997)
AVT(199
66,8,19
996)GSK(1998)
WYE(1994)
MenACWY
AVT(198
1)AVT(1983)
AVT(199
7)GSK(1993)
AVT(200
26)
MenA&C
AVT(197
6)AVT(1993)
GSK
(199
2)AVT(199
4)AVT(199
6)AVT(200
06)
MenC
AVT(197
5)CHR(2001)
IDB
(200
1)W
YE
(200
3)
WYE(1999)
BXT(2000)
CHR
(200
0,20
01)
AVT(200
26)BXT(2003)
CHR(200
2)W
YE(2002)
AVT(200
16)BXT(2001)
CHR(200
1)W
YE(2000)
MenA
AVT(197
5)Flu
AVT(194
7)CHR
(198
8)MIN
(200
3)AVT(1981,1996
)ID
B(1991)
AVT(199
8,19
99)CHR(199
8,19
99,20
01)GSK(1998)
ISB
(200
2)SLV(1998,
2000,20
04)
AVT(199
8,19
98,20
016)EVN(199
8)CHR(199
8,19
99,20
01)GSK(1998)
PFM(199
1)SLV(1998,
2000
)
AVT(199
86,19
986,20
006)CHR
(199
9,20
00)EVN(199
6)ISB(2001)
GSK(1998)
SLV(1998,
2001,20
04)
(Continued)
Vaccine Supply: Effects of Regulation and Competition 259

Table
5.(Continued)
Type
USA
Canad
aUK
France
Portugal
BCG
AVT(199
8)ORG
(198
7)AVT(196
1,19
90)
IDB(1991,
1994
)ORG(199
5)
SSI(20
02)
AVT(197
6,19
786,19
87)SSI(20
04)
JMF(200
3)LIB(1992)
Notes:
1–AcellularPertussis
2–Forad
ults
3–IPV
4–Combined
withIPV
5–Combined
withInfluen
za6–In
1994,Merck
VaccineDivisionan
dPasteurMerieuxConnau
ght(now
Aven
tisPasteur)
form
edajointven
ture
tomarket
human
vaccines
inEuropean
dto
col-
laborate
inthedev
elopmen
tofcombinationvaccines
fordistribution.Theeq
ual
shares
jointven
ture
isknownas
Aven
tisPasteurMSD,S.N
.C.
7–Combined
withTetan
usToxoid8–Combined
withMen
CAVT–Aven
tisPasteurB
IK-BIK
EN
-TheResearchFoundationforMicrobialDiseases,
OsakaUniversi-
tyBBT–Berna
Biotech
Ltd.BPT–Bio
Port
CorporationBXT–Bax
ter
HealthcareCHR
–ChironS.R.L.EVN
–Evan
sVaccinesGOV
–United
Kingdom
Dep
artm
entofHealth
GSK
–GlaxoSmithklineInc.ID
B–ID
Biomed
ical
Corporation
ISB–Istituto
SieroterapicoBerna,
S.r.l.
JMF–J.M.FarmacAutica,Lda
LIB
–Lab
oratoriosInibsa,S.A
.MBL–Massach
usettsBiologic
Lab
oratories
MIN
–Med
ImmuneVaccines,IncM
RK
–Merck&Co
IncO
RG
–Organ
onTek
nikaCorporation
PFM
–PierreFab
reMed
icam
entRVL–Rau
lVieira,
Lda
SBL–SBLVaccineABSLV
–Solvay
Pharma
SSB–SwissSerum
andVaccineInstitute
BerneSSI–StatenSerum
Institute
TKD
–Tak
edaChem
ical
Industries,Ltd.
WYE–W
yethLed
erle
Vaccines
SA
260 P.M. Danzon and N.S. Pereira

We also examined the exit of firms (as opposed to individual products)from the vaccine business. Explanatory power is lower, implying that there areunmeasured firm-specific factors underling each firm’s decision to exit the vac-cines market, although some common features may underlie these decisions.Table 4 presents the hazard rates for exit of firms from the vaccine market forany reason.24 Firm exit probability increases around 10% for each year the firmhas been in the market, which is consistent with the hypothesis that increasingcosts of regulatory compliance as technologies become obsolete may contributeto the probability of exit of firms. At the same time, firms that entered the mar-ket later are less likely to stay in the market and are more likely to be acquired,possibly because these are small firms formed to develop newer technologiesthat become desirable to established firms. Although having recently obtaineda new license does not affect the likelihood of firm exit, it decreases the likeli-hood of a firm being acquired.
7. Evidence from Other Industrialized Countries
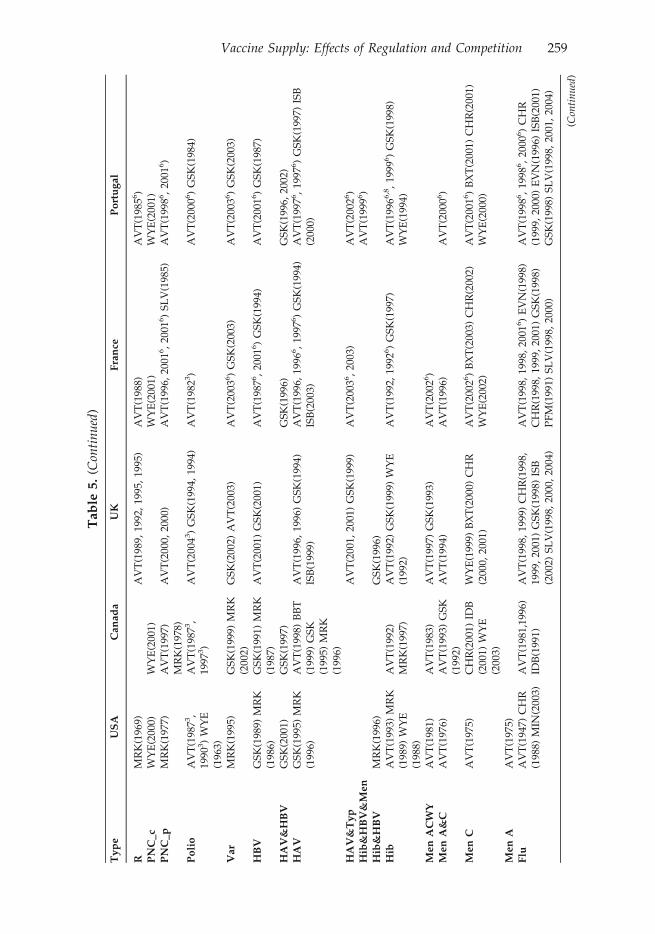
High fixed costs would be most widely spread if each vaccine were distributedglobally. In fact, the diffusion of vaccines appears to be more limited than formany drugs, even across industrialized countries. Table 5 lists the licensed pro-ducers of each of the major pediatric vaccines and several adult vaccines inCanada, France, Portugal, the UK, and the US.
These data are broadly consistent with hypotheses outlined here, that vac-cine production entails high country-specific fixed costs and concentrateddemand, such that each market supports at most a few producers. As pre-dicted, each country has few producers of each vaccine. However, for severalvaccine types, the US has fewer producers than these other countries which allhave smaller potential volumes and more dominant government purchase.25
The fact that several firms have products available in these countries that arenot available in the US suggests that entry into the US is not attractive, giventhe fixed costs of entry combined with price and volume uncertainty of com-peting with established products.
The number of licenses per manufacturer and vaccine is also often higherin Canada and Europe than in the US. This suggests that the cost of compli-ance with more stringent regulatory requirements may contribute to fewerlicensed products being maintained in the US. Note that in Table 5 the USlicenses include some that are inactive and some for further manufacturingonly, hence this count of licenses overstates the number of active producers inthe US. These data also indicate that, although national immunization plansare similar across developed countries, the specific vaccines recommendedwithin each category still vary, for example, in the use of combination vaccines.Country-specific requirements limit the potential for manufacturing economiesof scale and may require the development of country-specific products.
8. Flu Vaccine – A Case Study
A brief history of the supply of flu vaccine in the US illustrates how fixedcosts, dynamic competition and preemptive effects of superior products canlead to few suppliers, despite a limited role for government purchase.
Vaccine Supply: Effects of Regulation and Competition 261

Table
6.
Totaldosesoffluvaccineproducedan
ddistributed,byman
ufacturer:US2000–09
Flu
Season
Total#DosesProduced
Total#DosesDistributed
Supplier
Product
DosesProduced
%ofTotalUSDoses
Distributed
2000–2
001
77.9M
70.4M
Aven
tisPasteur
Fluzo
ne
35M
A45
%W
yeth
Flush
eild
Pnu-Immune
24M
31%
Med
evaB
Fluvirin
20M
26%
Parked
ale
Fluogen
0MC
0%20
01–2
002
87.7M
77.7M
Aven
tisPasteur
Fluzo
ne
50M
57%
Wyeth
Flush
ield
Pnu-Immune
21M
24%
Powderject
Fluvirin
17M
19%
2002–2
003
95.0M
83.0M
Aven
tisPasteur
Fluzo
ne
43M
E45
%W
yeth
Flush
ield
Pnu-Immune
21M
22%
Powderject
DFluvirin
26M
27%
2003–2
004
86.9M
83.1M
Aven
tisPasteur
Fluzo
ne
43M
49%
Chiron
Fluvirin
39M
45%
Med
Immune/
Wyeth
FluMist
5MF
6%2004–2005
61M
G57
.0M
Aven
tisPasteur
Fluzo
ne
58M
H95
%Chiron
Fluvirin
0MI
0%Med
Immune
FluMist
3M5%
2005–2
006
88.5M
81.5M
Chiron
Fluvirin
15M
17%
GlaxoSmithKline
Fluarix
7M8%
Med
Immune
FluMist
3M3%
San
ofi-PasteurJ
Fluzo
ne
63M
71%
2006–2
007
120.9M
102.5M
GlaxoSmithKlineK
Fluarix
FluLav
al41
M34
%Med
Immune
FluMist
3M3%
NovartisVaccines
Fluvirin
25.6M
21%
San
ofi-PasteurJ
Fluzo
ne
51.3M
42%
2007–2
008
140.6M
112.8M
CSL
Afluria
2M1%
GlaxoSmithKlineK
Fluarix
FluLav
al35
M25
%Med
Immune
FluMist
7M5%
NovartisVaccines
Fluvirin
46M
33%
San
ofi-PasteurJ
Fluzo
ne
50M
36% (Continued)
262 P.M. Danzon and N.S. Pereira

Table
6.(C
ontinued)
Flu
Season
Total#DosesProduced
Total#DosesDistributed
Supplier
Product
DosesProduced
%ofTotalUSDoses
Distributed
2008
–2009
135.9M
113M
CSL
Afluria
8.1M
6%GlaxoSmithKlineK
Fluarix
FluLav
al43
.5M
32%
Med
Immune
FluMist
6.8M
5%NovartisVaccines
Fluvirin
27.2M
20%
San
ofi-PasteurJ
Fluzo
ne
50.3M
37%
Notes:
A:Includes
9Mcontractedlaterin
theseasonbytheCDC,ofwhichonly
2Mwereev
erad
ministered
B:Med
evawas
purchased
byCelltechin
January20
00an
din
turn
sold
toPowderject
shortly
after
C:Faced
cGMPviolationsan
dproductionwas
susp
ended
.Parked
alehad
planned
todistribute
12M
doses
D:Powderject
was
purchased
byChironin
July
2003
E:43
Mdoseswerealread
ydistributedas
of31
October
2002.Thereis
nodataav
ailable
foren
tire
season
F:Only
450,00
0dosesofthe5M
wereev
erad
ministered
G:10
0Mdoseswereoriginally
planned
before
Chiron’s
productionwas
susp
ended
H:Only
50M
planned
,butAven
tispledged
8Mad
ditional
dosesto
helpalleviate
shortag
ecausedbyChiron’s
man
ufacturingproblems
I:Productionsu
spen
ded
byUK
regulatory
authorities.Chironhad
planned
todistribute
46M
to48M
doses
J:PreviouslyAven
tisPasteur
K:Thelicense
belongsto
IDBiomed
ical
Corp
ofQueb
ec,whichis
awholly-owned
subsidiary
ofGlaxoSmithKline
⁄Individual
man
ufacturerproductionvalues
may
notad
dupto
totalproductionvalues
dueto
roundingFluvirin0M
I 0%
Vaccine Supply: Effects of Regulation and Competition 263

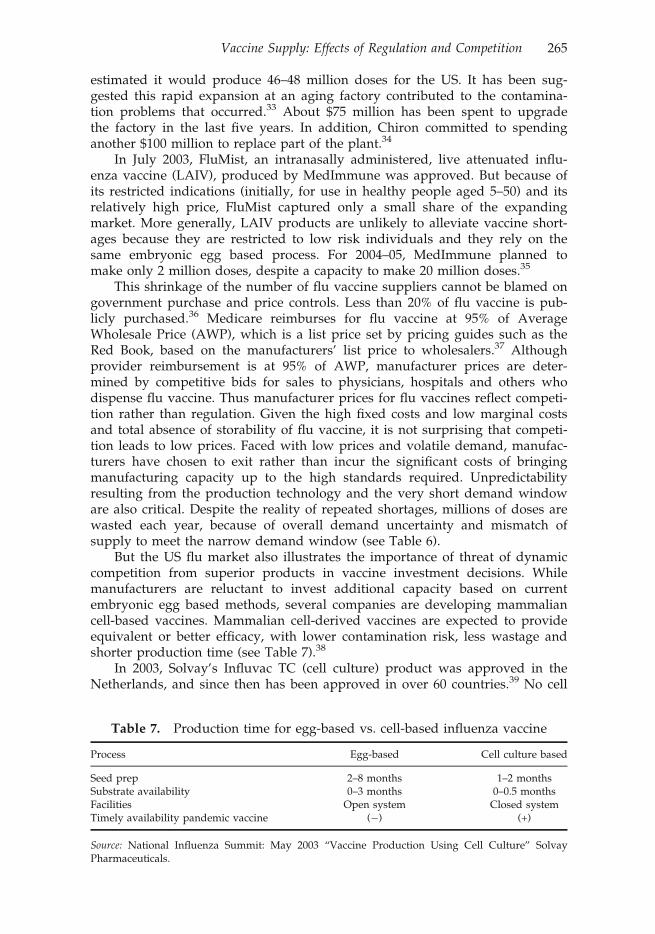
Influenza is an extreme case of limited storability. The influenza virus has twostrains: Type A, which has several subtypes, and Type B. Because these typesundergo antigenic “drift”, the influenza vaccine must be reformulated eachyear to match the circulating strains. Since 1998, the World Health Organiza-tion has issued separate recommendations in February and September for theNorthern and Southern Hemispheres, respectively.26 In the US, the vaccinecomposition for the upcoming flu season is determined between February andMarch. Since the peak flu season is November–March, manufacturers mustsupply the vaccine by October to early November.
The injectable vaccine is traditionally cultured on embryonic eggs and thensterilized. Monovalent concentrates are produced and combined into the multi-valent form, with comprehensive quality control at each step in the process.This time consuming process requires that supply be estimated almost a yearin advance, and quick ramp up of production is impossible. A newer methodof culturing the viruses using mammalian cells is not yet approved in the US.
There has been a significant increase in flu vaccine production above theapproximately 20 million doses distributed annually in the mid-1980s.27 In1993, flu vaccine was covered under Medicaid and Medicare Part B. Prior to2000, the ACIP recommended vaccination primarily of seniors and other highrisk individuals. In 2000, the ACIP recommendation was extended to peopleaged 50 to 65 and to infants aged 6–23 months in 2002. In 2003, pediatric vacci-nation was approved for use of VFC funds. By 2009, the number of doses peryear had increased to 113 million (Table 6). Actual uptake has increased butremains unpredictable at less than 50% of the recommended population. In2001, only 87.7 million of the recommended 152 million people were vacci-nated.28 In 2003, although recommended recipients increased to 182 million,manufacturers distributed only 83 million doses.29
In 1999, there were four manufacturers in the US producing a total of 77.9million doses: Aventis Pasteur, Wyeth, Parkedale (owned by King Pharmaceu-ticals), and Powderject (acquired by Chiron, now part of Novartis). In October1999, Parkedale was cited by the FDA for violations of manufacturing stan-dards. Six months later, Parkedale was ordered to halt production and distri-bution because it remained out of compliance. On 27 September 2000 the FDAagain ordered operations halted, giving the company 30 days to implementchanges. But given the short window for effective vaccination, it was unlikelythat the necessary changes could be completed for that year’s season. Instead,Parkedale announced its withdrawal from flu vaccine production, writing offsome $45 million rather than incurring the costs of upgrading. Wyeth had pro-duced influenza vaccine for the US market for over two decades. In October of2000, Wyeth was fined $30 million for the violations and an additional $15,000per day out of compliance (capped at $5 million).30 In November 2002, Wyethannounced that it would exit, which left only two manufacturers of injectibleinfluenza vaccine.31
In December 2002, shortly after Wyeth’s exit, Aventis pledged $80 millioninvestment to increase filling and formulation capacity, in addition to signifi-cant capital investments in 2001 to increase its capacity by 20%.32 In early 2003,Chiron acquired its Liverpool plant from Powderject and began aggressiveexpansion to serve the expected growth in US demand. Chiron produced 25.6million doses in 2002, and 35.6 million in 2003. Before being shut down by theUK regulatory authorities just weeks before the 2004 influenza season, Chiron
264 P.M. Danzon and N.S. Pereira
estimated it would produce 46–48 million doses for the US. It has been sug-gested this rapid expansion at an aging factory contributed to the contamina-tion problems that occurred.33 About $75 million has been spent to upgradethe factory in the last five years. In addition, Chiron committed to spendinganother $100 million to replace part of the plant.34
In July 2003, FluMist, an intranasally administered, live attenuated influ-enza vaccine (LAIV), produced by MedImmune was approved. But because ofits restricted indications (initially, for use in healthy people aged 5–50) and itsrelatively high price, FluMist captured only a small share of the expandingmarket. More generally, LAIV products are unlikely to alleviate vaccine short-ages because they are restricted to low risk individuals and they rely on thesame embryonic egg based process. For 2004–05, MedImmune planned tomake only 2 million doses, despite a capacity to make 20 million doses.35
This shrinkage of the number of flu vaccine suppliers cannot be blamed ongovernment purchase and price controls. Less than 20% of flu vaccine is pub-licly purchased.36 Medicare reimburses for flu vaccine at 95% of AverageWholesale Price (AWP), which is a list price set by pricing guides such as theRed Book, based on the manufacturers’ list price to wholesalers.37 Althoughprovider reimbursement is at 95% of AWP, manufacturer prices are deter-mined by competitive bids for sales to physicians, hospitals and others whodispense flu vaccine. Thus manufacturer prices for flu vaccines reflect competi-tion rather than regulation. Given the high fixed costs and low marginal costsand total absence of storability of flu vaccine, it is not surprising that competi-tion leads to low prices. Faced with low prices and volatile demand, manufac-turers have chosen to exit rather than incur the significant costs of bringingmanufacturing capacity up to the high standards required. Unpredictabilityresulting from the production technology and the very short demand windoware also critical. Despite the reality of repeated shortages, millions of doses arewasted each year, because of overall demand uncertainty and mismatch ofsupply to meet the narrow demand window (see Table 6).
But the US flu market also illustrates the importance of threat of dynamiccompetition from superior products in vaccine investment decisions. Whilemanufacturers are reluctant to invest additional capacity based on currentembryonic egg based methods, several companies are developing mammaliancell-based vaccines. Mammalian cell-derived vaccines are expected to provideequivalent or better efficacy, with lower contamination risk, less wastage andshorter production time (see Table 7).38
In 2003, Solvay’s Influvac TC (cell culture) product was approved in theNetherlands, and since then has been approved in over 60 countries.39 No cell
Table 7. Production time for egg-based vs. cell-based influenza vaccine
Process Egg-based Cell culture based
Seed prep 2–8 months 1–2 monthsSubstrate availability 0–3 months 0–0.5 monthsFacilities Open system Closed systemTimely availability pandemic vaccine (�) (+)
Source: National Influenza Summit: May 2003 “Vaccine Production Using Cell Culture” SolvayPharmaceuticals.
Vaccine Supply: Effects of Regulation and Competition 265

Table 8. Major WHO approved global manufacturers of inactivated influenzavaccine
Producer Country Brand name
Medimmune-Avirion USA FluMistBaxter– Immuno AG Austria Czech
RepublicCSL Australia FluvaxGSK Belgium FluarixNH Fluarix SHButantan (Filler) Brazil Gripe VaccineSanofi Pasteur France Mutagrip Vaxigrip Tetagrip
USA FluozoneNovartis Germany Fluad
Italy Antigripal S1UK Fluvirin Evagrip
Denka Seiken Co, Ltd Japan Influenza Seiken HAChemo-Sero-Therapeutic Research
InstituteJapan Influenza Kaketsuken HA
Kitasato Institute Japan Influenza HABiken Japan Influenza BikenDong Shin Pharmaceuticals (Filler) Korea Dong Shin Influenza HAKorea Vaccine Co. Ltd (Filler) Korea Influ-kovaxKorea Green Cross (Filler) Korea Inflexal VSolvay Healthcare Netherlands InfluvacCantacuzino Institute Romania VACCIN GRIPAL TRIVALENT,
PURIFICAT ªI INACTIVATImmunopreparat Research
productive association, UfaRussia Influenza Vaccine
Products Immunologicals andDrugs. Irkustk
Influenza Vaccine
RIVS, Saint Petersburg Influenza VaccineBerna -Crucell Switzerland Inflexal V, Vitagrip, FluviralID Biomedical Canada FluInsureWyeth Lederle USA FlushieldTorlak Institute Serbia&Montenegro Vaccinum InfluenzaeZhejiang Tianyuan -
BioPharmaceutical Co. LtdChina Influenza
Sinovac Kexing Biological ProductCo., Ltd
AnFlu TM
Beijing Institute of BiologicalProducts (BIBP)
Influenza
Shanghai Institute of BiologicalProducts (SIBP)
Influenza
Changchun Institute of BiologicalProducts (CCIBP)
Influenza
Changchun Changsheng LifeSciences Ltd
Influenza
Lanzhou Institute of BiologicalProducts (LIBP)
Influenza
Shenzhen-Sanofi Pasteur (Filler) InfluenzaChangzhou Yanshen BiotechnologyCo., Ltd InfluenzaLiaoning Tiancheng Bio-pharmacy
Insitute Co. LtdInfluenza
Omninvest Ltd. Hungary Influenza
Sources: World Health Organization: “Influenza Vaccine Manufacturers”, http://www.who.int/csr/disease/influenza/Influenza_vaccine_manufacturers2009_05.pdf
266 P.M. Danzon and N.S. Pereira

culture influenza vaccine is yet approved in the US but several are in clinicaltrials.40 Given the potential superiority of cell-based products, egg-based prod-ucts are likely to become obsolete, hence further investment in egg-basedcapacity is not worthwhile without government subsidy. In November 2009,Novartis inaugurated the US’s first large scale flu cell culture vaccine manufac-turing facility, which is planned to be running at full scale commercial produc-tion in 2013.41 At the same time, an FDA advisory panel rejected approval ofthe US’s first cell-based influenza vaccine developed by Protein Sciences Cor-poration.42
The global supply of flu vaccines (Table 8) shows a lack of global diffusionsimilar to other vaccines in Table 5. There are over 30 manufacturers of flu vac-cine worldwide but many operate in a limited number of countries.43 Solvay(now part of Abbott Laboratories), one of the EU’s largest suppliers and theleader in the new cell-based methods, does not have a product approved inthe US as of December 2010. Despite potential for growth in the US marketand lack of government price controls, there was little incentive for other com-panies to enter or expand using the old technology, although entry was antici-pated and is now occurring with newer technologies that will likely eventuallyrender the old technology obsolete. The 2004–05 Influenza Vaccine Shortage,together with the need to develop resources to address a potential pandemicoutbreak, including the avian influenza in 2005 and the H1N1 swine flu in2009, therefore led the US government to award grants to help companiesexpand their influenza vaccine capacity and develop faster and more reliableprocesses to manufacture the vaccine than the traditional egg culture vaccines.Furthermore, the recommendation for the annual influenza vaccination by theCDC’s Advisory Committee on Immunization Practices has been enlarged tocover around 300 million people compared to 200 million in 2004.44 Thesechanges stimulated an increase in the number of producers from three in 2004to five in 2010.
Nevertheless, and even though the market for seasonal influenza vaccinesacross the seven major markets (United States, Japan, France, Germany, Italy,Spain and UK), has had a strong compound annual growth rate of 12.6% since2005, in fact the US market is still dominated by a small number of firms, withSanofi-Pasteur, GSK and Novartis (formerly Chiron) producing more than 90%of the vaccines.45 Since this demand growth will likely flatten off, further con-solidation of this market may be likely.
Conclusions
This analysis suggests that US vaccine markets are likely to reach equilibriumwith only one or at most a few suppliers of each vaccine type. This reflects theinteraction of high fixed costs with concentrated, price-sensitive demand anddynamic quality competition in which product superiority is reinforced bygovernment recommendation. In such conditions, there is no incentive to intro-duce “me-too” vaccines, which could not plausibly compete with establishedfirms unless they offer some clear quality or cost advantage. Consequently,new vaccine R&D targets improved technologies for existing vaccines or newvaccine categories. Entry of superior products in turn leads to exit of the nowobsolete inferior products. Many vaccines that are approved in other industri-alized markets have not applied to enter the US, presumably due in part to
Vaccine Supply: Effects of Regulation and Competition 267

high costs of regulatory approval and manufacturing compliance, combinedwith limited and risky demand, with both price and volume uncertainty ifmultiple firms are competing for the business. The flu vaccine illustrates thecontribution to supply problems of high regulatory hurdles, fixed costs,demand uncertainty and the threat of dynamic competition. Pediatric vaccinesface similar regulatory, cost and dynamic competitive conditions; pricing maybe more controlled, due to the large market share purchased by the CDC, butvolume is more predictable, provided that there are only one or two suppliersin the market.
These economic realities pose difficult policy challenges. Harmonization ofcountry-specific regulatory requirements might increase the diffusion of prod-ucts across the industrialized markets, particularly between the EU, Canadaand the US. However, given the importance of vaccine policy to public health,national health authorities are unlikely to delegate autonomy on vaccine rec-ommendations and schedules. Perhaps the best hope comes from scientificadvances that may improve the storability of vaccines or reduce the lead timerequired for production. Such improvements would mitigate temporary supplydisruptions. Although stockpiles would not protect against withdrawal of asole supplier, both theory and our empirical evidence show that a sole supplieris much less likely to exit, unless a superior product enters the market. Butwhile new technologies are our best hope in the long run, in the short run newtechnologies may exacerbate supply shortages, by undermining incentives toinvest in older plants that are destined to become obsolete.
Notes
1. This is true particularly for traditional pediatric vaccines against highly infectious diseases,such as polio, measles, etc. In general, the cost-effectiveness of any specific vaccine dependson the price, the target population and the measure of effectiveness. This analysis does not dis-tinguish between pediatric and adult vaccines, because the analysis applies to all types.
2. Institute of Medicine (2003).3. Jarrett, 2002.4. Mercer Management Consulting (2002). Basic pediatric vaccines include measles, mumps,
rubella, diptheria, TB, pertussis, polio, tetanus, typhoid etc. These older vaccines are part ofpediatric vaccination schedules in most countries, with financing for the poorest countriesthrough the Global Alliance for Vaccines and Immunization (GAVI).
5. USAToday, 13 August 2010.6. Government recommendation may increase coverage by private insurance as well as public
programs.7. States handle enrolment of eligible patients and eligible doctors, who receive free vaccine for
these patients. http://www.cdc.gov/vaccines/programs/vfc/parents/default.htm#history.8. Jarrett, 2002.9. Thimerosal is a mercury-containing preservative that was used in multi-dose vaccine vials that
has been alleged to be associated with autism.10. R&D cost for vaccines is estimated to be comparable to other drugs (Grabowski, 2005). Vaccine
production requires unusually high investments in quality assurance, as a condition of gettingand maintaining the plant license. Fixed costs have been estimated at 60% of total productioncosts and semi-fixed batch costs at an additional 25% (Mercer, 2002).
11. Combinations are usually produced by the producer(s) of the component parts.12. If a vaccine produces adverse effects, many patients are likely to be affected. The risks associ-
ated with individual vaccine doses are therefore correlated, not independent, as required fordiversification and insurability.
268 P.M. Danzon and N.S. Pereira

13. The assumption that each firm sets its price and customers choose quantities characterizes theCDC procurement process. It is also a plausible model of private purchasing in which buyersnegotiate price discounts from competing suppliers.
14. The pertussis component is usually not given to adults because whooping cough is less severein older people while the vaccine side effects may be more severe. Patients also receive diph-theria and tetanus boosters every ten years. Nidus Information Services Inc., 2004.
15. Institute of Medicine (2003). In fact, the catalog price may overstate transactions prices paid byprivate customers due to confidential discounting.
16. This argument implicitly assumes that producers underestimate the extent of government reg-ulation prior to entry.
17. We also tested for effects of partial recommendation, but it was not significant.18. Our absolute price is an imperfect proxy for the theoretically preferred mark-up of price over
marginal cost, which is not feasible because data on marginal cost are unavailable. Absoluteprice should be correlated with the price-marginal cost mark-up if marginal cost is similaracross vaccines in a given year, which is plausible for most of the vaccines, However, giventhe potential measurement error in our price variable, conclusions on effects of CDC price aretentative.
19. The correlation between Pre CDC and No CDC is only 0.3, because many vaccines were notpurchased by CDC, even after 1966.
20. Manning (1994) reports large price increases related to liability, especially for the pertussis vac-cine. Offit (2005) shows that the liability of vaccine manufacturers was established in the 1955Cutter incident, in which patients were infected with live polio vaccine, leading 70,000 tobecome ill, 200 became permanently paralyzed and 10 died. We nevertheless use 1966 as thestart date for strict liability because this formalized the law.
21. We also considered a measure of the number of vaccines licenses held by that manufacturer int�1. This was highly correlated with the Herfindahl, and was therefore dropped.
22. For example, if there were two single diphtheria vaccines and one combination vaccine, DPT,which includes diphtheria, each single diphtheria has one Direct Competitor and one IndirectCompetitor.
23. The predicted median survival of these products is thirty years, with 25th and 75th percentilesat 17 and 49 years, respectively, and a mean of 33.8 years. These predicted values are from aKaplan-Meier survival estimator applied to the censored observations.
24. We also ran separate regressions for exits due to closing vs. acquisition of the firm.25. Although we were unable to obtain reliable price data, the limited data available to us indicate
that foreign prices are no higher and usually lower than in the US.26. Lavanchy, 2001.27. US Food and Drug Administration, 2004.28. Bridges, 2004.29. Orenstein Walter A., 2002.30. “Weakened Immunity: How the Food and Drug Administration Caused Recent Vaccine-Sup-
ply Problems,” The Lighthouse 9, no. 1 (Summer 2004).31. Brown, 2004.32. Aventis Pasteur, 2002.33. “The problem was they really stressed the system this year to get to that 50, 52 million doses,”
said Geoffrey C. Porges, an analyst at Sanford C. Bernstein & Company who formerly workedin the vaccines business at Merck.
34. Frankel Glenn. & Glenda, 2004.35. US Centers for Disease Control, 2003.36. Hosbach, 2004.37. Although Medicare reimbursement for other Part B drugs changed in 2004 to average selling
price (ASP) plus 6%, reimbursement for flu, pneumococcal and Hepatitis B vaccines remainsat 95% of AWP.
38. “Comparison of large-scale mammalian cell culture systems with egg culture for the produc-tion of influenza virus A vaccine strains” Vaccines 19, no. 25–26 (14 May 2001): 3444–50.
39. Solvay Pharmaceuticals was acquired by Abbott in September 2009 http://www.abbott.com/global/url/pressRelease/en_US/60.5:5/Press_Release_0781.htm
40. These include small new entrants to the flu vaccine business, such as Protein Sciences, Bio-Diem, and Vaxin Technology, some with funding from NIH, as well as Sanofi-Aventis and
Vaccine Supply: Effects of Regulation and Competition 269

GlaxoSmithKline. Chiron’s influenza cell-culture research program has completed Phase IIclinical trials in Europe.
41. http://www.novartis.com/newsroom/media-releases/en/2009/1356789.shtm.42. http://www.medpagetoday.com/InfectiousDisease/URItheFlu/17128.43. World Health Organization, 2004.44. http://www.cdc.gov/flu/professionals/vaccination/pdf/influenza_vaccine_target_popula-
tions.pdf.45. http://www.tradingmarkets.com/news/stock-alert/abt_abbott-calls-off-sale-of-flu-vaccine-
business-in-europe-1149378.html
ReferencesArnould, Richard, and De Brock, Larry (1996) The application of economic theory to the vaccine Mar-
ket, in: Mark Pauly, Chester Robinson, Stephen Sepe, Merrile Sing and Mary Kay Williams (Eds),Supplying Vaccines: An Economic Analysis of Critical Issues (Amsterdam: IOS Press).
Aventis Pasteur (2002) Aventis Pasteur Announces Plans to Meet US Demand for Influenza Vac-cine. Press Release, 2 December. Available at: www.us.aventispasteur.com.
Bridges, Carolyn B. (2004) General Influenza. Current Issues in Immunization, Net Conference, 8 July.Available at: http://www.cdc.gov/nip/ed/ciinc/nc_July_08.htm (15 November).
Brown, David (2004) How US got down to two makers of flu vaccine. Washington Post, 17 October,A01.
Carree, Martin, and Thurik, A. Roy (1996) Entry and exit in retailing: incentives, barriers, displace-ment and replacement, Review of Industrial, 11, pp. 155–72.
Caves, Richard E. (1998) Industrial organization and new findings on turnover and mobility offirms, Journal of Economic Literature, 36, pp. 1947–82.
Danzon, Patricia M., Pereira, Nuno Sousa, and Tejwani, Sapna (2005) Vaccine supply: a cross-national perspective, Health Affairs, 24, pp. 706–17.
Disney, Richard, Haskel, Jonathan, and Heden, Ylda (2003) Entry, exit and establishment survivalin UK manufacturing, The Journal of Industrial Economics, 51, pp. 91–112.
Dunne, Timothy, Roberts, Mark J., and Samuelson, Larry (1988) Patterns of firm entry and exit inUS manufacturing industries, RAND Journal of Economics, 19, pp. 495–515.
Frankel, Glenn, and Cooper, Glenda (2004) Britain: US told of vaccine shortage: Flu shot recordscontradict FDA. Washington Post Foreign Service, 9 October, A01.
Geroski, Paul A., Jacquemin, Alexis, Vickers, John, and Venables, Anthony (1985) Industrial change,barriers to mobility, and European industrial policy, Economic Policy, 1, pp. 169–218.
Ghemawat, Pankaj, and Nalebuff, Barry (1985) Exit, RAND Journal of Economics, 16, pp. 184–94.Ghemawat, Pankaj, and Nalebuff, Barry (1990) The devolution of declining industries, Quarterly
Journal of Economics, 105, pp. 167–86.Grabowski, Henry (2005) Encouraging the development of new vaccines, Health Affairs, 24, pp. 697–
700.Hosbach, Philip (2004) Aventis Pasteur perspective, National Influenza Summit (20–22 May 2003).
Available at: http://www.ama-assn.org (15 November 2004).Institute of Medicine (2003) Financing Vaccines in the 21st Century: Assuring Access and Availability
(Washington, DC: IOM).Jarrett, Steve (2002) Procurement strategies for drugs and vaccines. Wharton Impact Conference on
Pharmaceutical Innovation in a Global Economy. Philadelphia: 4–5 October.Jovanovic, Boyan (1992) Selection and the evolution of industry, Econometrica, 50, pp. 649–70.Kauf, Teresa L. (1999) Price discrimination and bargaining power in the US vaccine market: impli-
cations for childhood immunization policy, Quarterly Review of Economics and Finance, 39, pp.249–65.
Klepper, Steven (1996) Entry, exit, growth, and innovation over the product life cycle, American Eco-nomic Review, 86, pp. 562–83.
Klepper, Steven, and Miller, John H. (1995) Entry, exit, and shakeouts in the United States in newmanufactures products, International Journal of Industrial Organization, 12, pp. 567–91.
Lavanchy, Daniel (2001) WHO Influenza Surveillance. Geneva, Switzerland (5 January).Manning, Richard L. (1994) Changing rules in Tort Law and the market for childhood vaccines,
Journal of Law and Economics, 37, pp. 247–75.Mercer Management Consulting (2002) Lessons Learned: New Procurement Strategies for Vaccines.
Final Report to the GAVI Board. Available at: http://www.vaccinealliance.org/Support_to_Coun-try/vpp/index.php.
270 P.M. Danzon and N.S. Pereira

Nidus Information Services Inc. (2004) What are the Vaccines for Diphtheria, Tetanus, and Pertussis?Available at: http://www.nym.org/healthinfo/docs/090/doc90diphtheria.html (15 November).
Orenstein Walter A. (2002) Background/Overview/Meeting Objectives (Conference Presentation).National Influenza Summit, 22–23 May. Available at: http://www.ama-assn.org (15 November2004).
Offit, Paul A. (2005) The Cutter Incident (New Haven: Yale University Press).Ruebeck, Christopher S. (2005) Model exit in a vertically differentiated market: interfirm competi-
tion versus intrafirm cannibalization in the computer hard disk drive industry, Review of Indus-trial Organization, 26, pp. 27–59.
Salkever, David S., and Frank, Richard G. (1996) Economic issues in vaccine purchase arrange-ments, in: Mark Pauly, Chester Robinson, Stephen Sepe, Merrile Sing and Mary Kay Williams(Eds), Supplying Vaccines: An Economic Analysis of Critical Issues (Amsterdam: IOS Press).
Scherer, Frederic M. (2007) An industrial organization perspective on the influenza vaccine short-age, Managerial and Decision Economics, 28, pp. 393–405.
US Centers for Disease Control and Prevention (2003) Using Live, Attenuated Influenza Vaccine forPrevention and Control of Influenza: Supplemental Recommendations of the Advisory Com-mittee on Immunization Practices (ACIP). 52(RR13) (26 September): 1–8. Available at: http://www.cdc.gov/mmwr/preview/mmwrhtml/Table%201.
US Food and Drug Administration, Center for Biologics Evaluation and Research (2004) Availabilityof Influenza Virus Vaccine 1999. Available at: http://www.fda.gov/cber/infosheets/flu092999.htm (15 November).
World Health Organization (2004) Influenza Vaccine Manufacturers. Available at: http://www.who.int/csr/disease/influenza/manulist/en/ (15 November).
Vaccine Supply: Effects of Regulation and Competition 271

Copyright of International Journal of the Economics of Business is the property of Routledge and its content
may not be copied or emailed to multiple sites or posted to a listserv without the copyright holder's express
written permission. However, users may print, download, or email articles for individual use.