vaibhav global limited - buy
TRANSCRIPT
Vaibhav Global Limited (VGL) -‐ Strong business in the making
Arun Gopalan MBA Candidate @ Oxford
Indian Equity Strategist | Investor
Cell -‐ +44 7546 883 484
Email – [email protected] Linkedin -‐ hLps://www.linkedin.com/in/gopalanarun
* Disclosure – I am invested in VGL

VGL – Investment Case A smiling host awaits you – neatly trimmed, sharply dressed and very a?racAve too. She has something to show you in front her – well cut, sparkling, colored tanzanite. As you start guessing “What in this world is a Tanzanite?”, she narrates you a story of Tanzanite’s history, exclusivity and rarity that would want you to own one. And as the host conAnues to entertain you by sharing some of her personal experiences of Tanzanite and providing you with ideas of how you can giL your daughter for the Thanksgiving, the prices conAnue to roll down, someAme to the extent of -‐90%. With only 5 minutes into the narraAve, the Final price is shown and you see orders start pouring in. Now, aLer witnessing an a?racAve host, wonderful narraAve, eye catching product, falling prices, the reminder for Thanksgiving and stocks running out, would you want to wait? No! You feel your adrenaline flowing and you pick your phone. Welcome to the world of Vaibhav Global Limited (VGL), Welcome to the world of Home Shopping !. VGL is an electronic retailer of fashion jewelry, fashion accessories and lifestyle products. They are verAcally integrated and they source their inventories from India, Thailand, China and Indonesia. VGL predominantly focuses on the US and UK consumer markets through their exclusive cable, satellite and broadcast television networks, extremely well supported and integrated with a e-‐commerce pla]orm. They are available in the US through LiquidaAon Channel (TV broadcast) and liquidaAonchannel.com (Web) and in the UK through Jewellery Channel (TV broadcast) and thejewellerychannel.tv. In FY 14, VGL reported revenues of INR 12,983 mn (growth of 45%) and PAT of INR 1,526 mn (growth of 94%) with a Basic EPS of INR 47.4. It generated an ROE of 66%, ROCE of 53% with an EBITDA margin of 11%.
Current Market Price – INR 587.85 Bloomberg Code – VGM:IN BSE / NSE Code – 532156 / VAIBHAVGBL Shares Outstanding (mn) – 32.1 Mkt Cap (INR mn / USD mn) – 19030/ 314 FY 14 Revenue (INR Mn) – 12,983 EBITDA Margin (%) – 11 PAT Margin (%) – 11.8 FY 14 EPS (INR) – 47.4 ROE / ROCE (%) – 66 / 53 P/E (TTM) – 16.34 1 Year Price Target – INR 926.1 (57.5% upside) 3 Year Price Target – INR 2216 (276.9% upside)
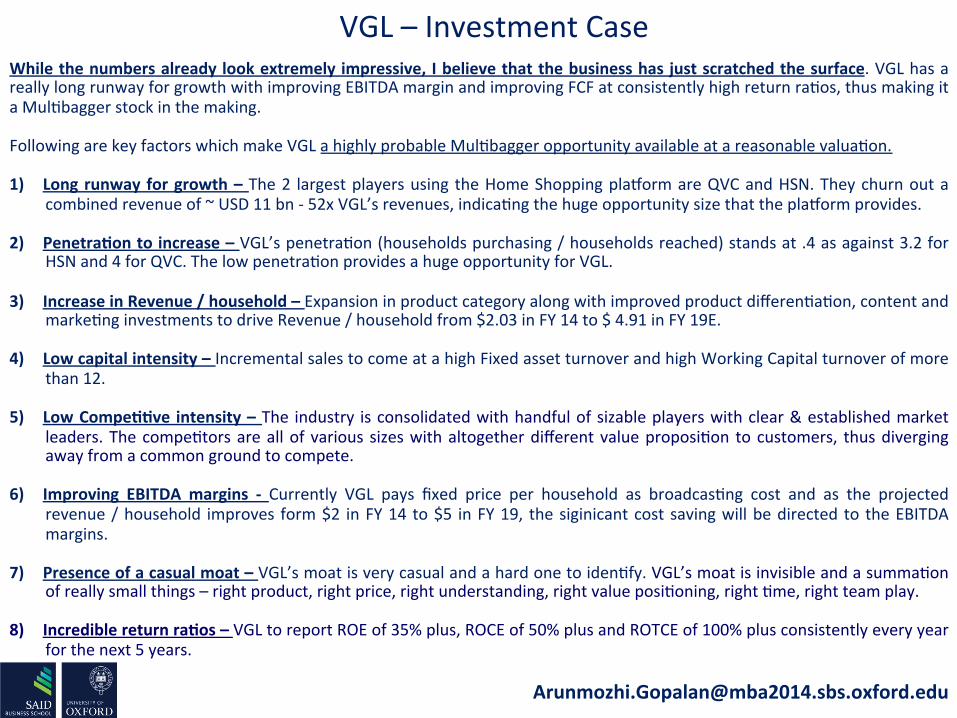
While the numbers already look extremely impressive, I believe that the business has just scratched the surface. VGL has a really long runway for growth with improving EBITDA margin and improving FCF at consistently high return raAos, thus making it a MulAbagger stock in the making. Following are key factors which make VGL a highly probable MulAbagger opportunity available at a reasonable valuaAon. 1) Long runway for growth – The 2 largest players using the Home Shopping pla]orm are QVC and HSN. They churn out a
combined revenue of ~ USD 11 bn -‐ 52x VGL’s revenues, indicaAng the huge opportunity size that the pla]orm provides.
2) Penetraaon to increase – VGL’s penetraAon (households purchasing / households reached) stands at .4 as against 3.2 for HSN and 4 for QVC. The low penetraAon provides a huge opportunity for VGL.
3) Increase in Revenue / household – Expansion in product category along with improved product differenAaAon, content and
markeAng investments to drive Revenue / household from $2.03 in FY 14 to $ 4.91 in FY 19E.
4) Low capital intensity – Incremental sales to come at a high Fixed asset turnover and high Working Capital turnover of more than 12.
5) Low Compeaave intensity – The industry is consolidated with handful of sizable players with clear & established market leaders. The compeAtors are all of various sizes with altogether different value proposiAon to customers, thus diverging away from a common ground to compete.
6) Improving EBITDA margins -‐ Currently VGL pays fixed price per household as broadcasAng cost and as the projected
revenue / household improves form $2 in FY 14 to $5 in FY 19, the siginicant cost saving will be directed to the EBITDA margins.
7) Presence of a casual moat – VGL’s moat is very casual and a hard one to idenAfy. VGL’s moat is invisible and a summaAon of really small things – right product, right price, right understanding, right value posiAoning, right Ame, right team play.
8) Incredible return raaos – VGL to report ROE of 35% plus, ROCE of 50% plus and ROTCE of 100% plus consistently every year for the next 5 years.
VGL – Investment Case

Business Overview

VerAcally integrated business model
Aggressive trend spobng – More than 200 employees across key fashion centers aggressively spot the recent trends and contribute to the product design and development
Direct Sourcing – Direct sourcing from vendors based out of Indonesia, China and Thailand contributes to 50% of volumes. Sourcing capacity stands at close to 10 million pieces per year.
Own Manufacturing – Own manufacturing plant at Jaipur, India with a capacity of around 6 million pieces annually. This contributes to roughly 50% of volumes.
Warehousing and Distribuaon faciliaes – Robust warehousing and distribuAon faciliAes based out of AusAn, Texas and London, UK.
Sales Channels
B2C -‐ Web B2C -‐ TV B2B


DistribuAon channel – TV (the higher ASP pla]orm)
TV channel contributes to 70% of the company’s revenue. Excluding the B2B business, TV contributes to 80% of B2C revenue and to 68% of B2C volumes. Though the Web channel is increasingly churning out higher revenue growth numbers, TV will conAnue to be the major sales contributor for the current decade. VGL has access to 95 million households across US and UK. It is accessible through liquidaAon channel across 70 million households (Total – 116 million households) in US and through Jewellery channel across 25 million households (100% availability) in UK. TV channel revenues have growth at a CAGR of 23.5% over the past 3 years and I expect them to grow at a CAGR of 13.1% over the next 5 year period. While TV channel revenues will conAnue to post lower growth compared to Web, Average Selling Prices (ASP) is expected to be significantly higher through TV Sales than Web Sales. In FY 14, TV recorded an ASP of USD 24 compared to USD 13 for the Web. The higher ASP on the TV channel can be a?ributed to the high probability of impulse purchase that a TV viewer undergoes as against a Web customer who browses through the catalog and takes his/her Ame to make the buying decision.

DistribuAon channel – Web (the higher margin pla]orm)
The Web channel contributes to 17% of the company’s revenue. Excluding the B2B business, Web contributes to 20% of B2C revenue and to 32% of B2C volumes. VGL’s e-‐commerce pla]orm includes liquidaAonchannel.com in the US and jewellerychannel.tv in the UK. The Web revenues have grown at a CAGR of 45% over the last 3 year period and I expect them to grow at a CAGR of 38% over the next 5 year Ame period. While the ASPs are lower compared to the TV channel, the web margins are significantly higher, since the real estate cost of hosAng the web pla]orm is insignificant compared to the TV carriage costs. Also, the markeAng costs are very minimal and a significant part of the Web traffic is driven from the TV channel. While the TV channel sales follow a reverse aucAon model (prices drop from the iniAal price to final price), the Web sales happen on rising aucAon model and Catalogue model. In the rising aucAon model, the starAng price of the items listed start at either 1$ or 1 GBP and the customers conAnue to bid up the prices. While the rising aucAon model in itself has a lot of potenAal, it is to be noted that VGL currently uses this model to sell only the leL-‐over items from TV sales.

The Presenter / Host – Story-‐telling at its best
The hosts play a vital role on the TV channel sales pla]orm. They are experienced, talented and trained marketers who connect with the audience through narraAve story telling revolving around the product being sold. Every product gets a predetermined air-‐Ame following a daily schedule of broadcast content and the hosts play a major role in selling the maximum number of pieces in the airAme possible. They are one of the major reasons to drive the impulse buying on the TV and hence result in higher Average selling prices through the TV channel than the Web. They usually do a 3-‐hour LIVE coverage a day for around 4 to 5 days a week. It would be no exaggeraAon to say that the hosts have a strong customer following, who would even stop buying from a channel if the hosts moves out.

CompeAtors VGL QVC HSN Shop HQ
Product profile
Fashion Jewelry, Fashion Accessories, Lifestyle products
Jewelry, Personal care, Home Care, Electronics, Lifestyle products, Kitchen & Food, Toys, Décor items, Lifestyle products
Jewelry, Personal care, Home Care, Electronics, Lifestyle products, Kitchen & Food, Toys, Décor items, Lifestyle products
Jewelry, Personal care, Home Care, Electronics, Lifestyle products, Kitchen & Food, Décor items, Lifestyle products
Yearly Sales USD 215 Million USD 8.6 Billion USD 2.3 Billion USD 640 Million
Reach (millions of household)
95 195 96 87
Unique Sales ProposiAon
Deep discount value products
Proprietary or Excusive line of products that are not available at the department stores.
Proprietary or Excusive line of products that are not available at the department stores.
Upscale, luxury and naAonal third party brands
EBITDA Margin (%)
12 21 11 3
Average Selling price
USD 23 USD 51 USD 58 USD 81

Investment Raaonale

Large opportunity size of the pla]orm
The two largest players that use the home shopping pla]orm are QVC and HSN. They churn out a combined revenue of close to USD 11 billion -‐ 52 ames larger than VGL. While QVC and HSN are not exact comparables due to their wide array of product lineup, much larger revenue base and enArely different ASPs & value proposiAon, they stand to indicate the opportunity size of the Home shopping pla]orm. Home shopping pla]orm built through a TV channel and enhanced by E-‐commerce is an established and profitable business model in the developed countries. In fact, as witnessed during the recent economic downturn in 2008, they are highly resilient to the economic shiLs – QVC US posted almost a flat sales growth in comparison to the department stores that posted an average two-‐year same-‐store sales decline of 12%. Even the largest player -‐ QVC conAnues to grow (constant currency revenue growth of 4% CAGR -‐ 2008 to 2013), constantly taking market share from the tradiAonal retailers and through geographic expansion. Moreover, the industry has been highly nimble and has integrated into the Web and mobile pla]orm over the last decade, enabling them to engage with the younger audience. The average age of shoppers at these companies are on a constant decline and in fact the largest players today get close to 40% of their revenues from Web / mobile pla]orms.
0 1000 2000 3000 4000 5000 6000 7000 8000 9000
10000
VGL Shop HQ HSN QVC
Sales (USD Mn)
VGL
Shop HQ
HSN
QVC

PenetraAon – Case comparison of VGL Vs. HSN
Globally, QVC has the largest reach measured in millions of households carrying it’s TV channel. QVC has access to 195 mn households and inclusive of their China JV, the reach is closer to 300 million households. However, HSN and VGL reach out to more or less the same number of households -‐ ~ 95 million, but with HSN having 8X more number of households purchasing from them compared to VGL. This has a lot to do with the fact that HSN has been at the forefront of the Home Shopping industry since 1985 (a year prior to QVC) and has even led the dynamic change into web and mobile pla]orms. Also, HSN is present across several product cateogires and carries more than 100,000 SKUs compared to VGL which carries 65,000 SKUs highly concentrated around the Jewelry segment. I believe that the low penetraAon provides a huge opportunity for VGL. Having got the pricing, the value proposiAon and the sales channels right, I believe that VGL will successfully transcend across related product categories over the next 5 years. The product category expansion will be the primary driver to bringing new households that will purchase from VGL.
0
0.1
0.2
0.3
0.4
0.5
0.6
0.7
0.8
2013 A 2014 A 2015 E 2016 E 2017 E 2018 E 2019 E
Penetraaon (%)
PenetraAon (%)
0.4
3.2
4
0 0.5 1
1.5 2
2.5 3
3.5 4
4.5
VGL HSN QVC
Households purchasing / Households reached (%)

Revenue/Household – Case comparison of VGL Vs. Shop HQ
Revenue per household is a funcAon of households reached, product categories carried, penetraAon and ASP. VGL has posiAoned itself as a discount & value retailer and has found a sweet spot at a price range of $20 – $25. VGL would be very interested in maintaining it’s unique posiAoning and hence I do not expect the ASPs to change over the years. And as menAoned in the previous slide, product cateogory expansion will be the key driver to increase revenue from households. This will be aided by improved content, improved programming and investment into markeAng. Currently VGL generates $2.03 / household compared to $7 for Shop HQ. Speaking about Shop HQ, it was recently at the center of mismanagmeent allegaAons, which eventually ended up in a management ouster by acAvist investors led by Clinton group. If ShopHQ with a bloated management, lack of proprietory brands, skewed & unfavorable product mix, strained vendor relaaons, repeaave programming schedule and lack of innovaaon can churn out $7 per household reached, this gives me a lot of confidence with the upside and scalability prospects for an efficient and nimble orgaizaaon like VGL.
0
1
2
3
4
5
FY 13A FY 14A FY 15E FY 16E FY 17E FY 18E FY 19E
1.48 2.03 2.17
2.67 3.27
4.01
4.91
VGL -‐ Revenue / Household reached (USD)
2.03 7
24
57
0
10
20
30
40
50
60
VGL Shop HQ HSN QVC
Revenue / Household reached (USD)

Increasing product por]olio and reach Increase in product por]olio to get new customers -‐ Currently, VGL’s product por]olio is highly concentrated on the Fashion Jewelry segment which makes up close to 90% of the total revenues, while the same would be 11% for HSN and 12% for QVC. This under-‐penetrated product por]olio leaves a huge scope for VGL to transcend across related product categories which will bring more new customers into its hold. VGL over the last year has started improving its por]olio of fashion accessories and Home care products and has introduced products like handbags, scarfs and more recently bedding collecAons. Increase in reach an easier opAon but not preferred – In US alone, VGL has another 46 million households (paid) to reach out to and globally, the upside is even higher. VGL always has the opAon of expanding geographically into newer and mature markets like Japan or Germany. However, I believe that the prudent and conservaAve management at VGL will not be keen on geographic expansion for the next 3 to 5 years. I believe that the reach of 95 mn households that VGL has in itself provides a long runway for growth and the management understands this extremely well. I do not expect VGL to aggressively expand even with in the US by adding households significantly.
0.65
1.1
2.5
0
0.5
1
1.5
2
2.5
3
VGL HSN QVC
SKUs (millions)
VGL HSN QVC
US US US
UK UK
Canada Japan
Germany
Austria
Italy
China
95 mn 96 mn 305 mn

Low Capital intensity
VGL’s business model is asset light and it requires li?le capital for operaAons and for expasion. Working Capital -‐ Almost all of VGL’s B2C clients (87% of revenues) make their payments using registered credit cards and the payments are usually realized by VGL in 2 to 3 days Ame period. While inventory is held by the company at various levels, predominantly this is made of gemstones and the iniAal input materials that go into the final produce. I believe that VGL’s entry into newer product categories will increase third-‐party sourcing, thus impacAng the working capAal requirement favorably. Tangilbe Assets – The Fixed asset investments includes capital spent on program producAon studion, warehouses, logisAcs, machineries and computers. I expect VGL’s incremental sales to come at a mulAple of more than 12X on the incremental Fixed asset investments required.
16
12 12 12 13
14
0
2
4
6
8
10
12
14
16
18
FY 14A FY 15E FY 16E FY 17E FY 18E FY 19E
Working Capital turnover
6.7
14 13
15
12
0
2
4
6
8
10
12
14
16
FY 15E FY 16E FY 17E FY 18E FY 19E
Incremental Sales / Incremental Fixed Assets

OperaAng Leverage to kick in – EBITDA margins to expand
Currently, the cost structure of VGL looks like (in % of Sales) – COGS (33%), TV Carriage (25%), Employee (16%), SG&A (9%) and Manufacturing (6%). COGS and Manufacturing expenses are variable and are expected to grow with sales. At the other end, Employee expense, SG&A expense and TV Carriage expense are Fixed costs to variable intensity. As VGL expands its product por]olio and revenue / household keeps improving, TV channel expense will be the key driver to kick in the operaAng leverage. Currently VGL pays fixed price per household as broadcasAng cost and as the projected revenue / household improved form $2 in FY 14 to $5 in FY 19, the siginicant cost saving will be directed to the EBITDA margins. TV Channel expense (25%) contains Carriage cost (18%) and Content cost (7%) and I expect carriage cost to fall more sharply than the content cost. Current core carriage cost for QVC is just more than 3%. While SG&A expense and employee expense can be credited as Fixed costs to an extent, I expect VGL to maintain the expense raAo and to improve customer saAsfacAon. While these costs are likely to have a posiAve impact on EBITDA margins, they will be insignificant (probably a 2% savings over a 5 year period).
7.2
11 12.6
14.3 15.5
17.2 18.4
0 2 4 6 8
10 12 14 16 18 20
FY 13A FY 14A FY 15E FY 16E FY 17E FY 18E FY 19E
EBITDA Margin (%)
0
5
10
15
20
25
30
FY 13A FY 14A FY 15E FY 16E FY 17E FY 18E FY 19E
TV Channel Expense / Sales (%)
Low CompeAAve intensity – Challenger likely to be a new player
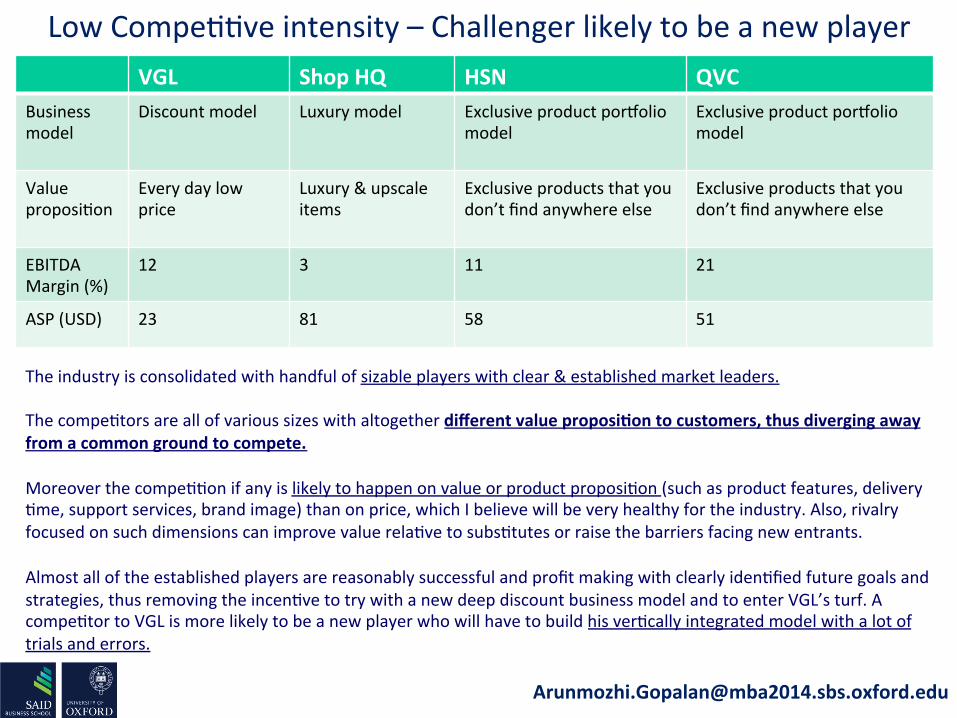
The industry is consolidated with handful of sizable players with clear & established market leaders. The compeAtors are all of various sizes with altogether different value proposiaon to customers, thus diverging away from a common ground to compete. Moreover the compeAAon if any is likely to happen on value or product proposiAon (such as product features, delivery Ame, support services, brand image) than on price, which I believe will be very healthy for the industry. Also, rivalry focused on such dimensions can improve value relaAve to subsAtutes or raise the barriers facing new entrants. Almost all of the established players are reasonably successful and profit making with clearly idenAfied future goals and strategies, thus removing the incenAve to try with a new deep discount business model and to enter VGL’s turf. A compeAtor to VGL is more likely to be a new player who will have to build his verAcally integrated model with a lot of trials and errors.
VGL Shop HQ HSN QVC Business model
Discount model Luxury model Exclusive product por]olio model
Exclusive product por]olio model
Value proposiAon
Every day low price
Luxury & upscale items
Exclusive products that you don’t find anywhere else
Exclusive products that you don’t find anywhere else
EBITDA Margin (%)
12 3 11 21
ASP (USD) 23 81 58 51

Where is the Moat? The opportunity size is large, the business needs very li?le capital to operate & expand and whatever capital that you throw in are employed at high return raAos and even be?er, the returns are thrown as hard cash every year. So, Where is the moat? I think the moat around VGL is an emerging moat which is very casual and hard to idenAfy. PotenAal compeAtors may not have a clue as to where the valuable resource in the company resides and what really it is. I think that these capabiliAes are more organizaAonal in nature and it depends on several factors. And as the scale of operaAons improves every year, the emerging moat becomes more stronger. VGL as an organizaAon and VGL’s management in parAcular has a very strong understanding of their products and their business values. This helps them to come out with unique product at a great value proposiAon and to conAnuosly innovate into newer product categories. Customer engagement could be a differenAaAng factor which cannot be taught or replicated. For instance, the company does seepstakes few Ames a year when the winner will get the item deliver personally by ThePresident of the channel. VGL has free giLs for their top 40,000 to 50,000 customers, four Ame a year and this is something that not many of the others do. VGL moAvates its execuAve and top level employees through Stock opAon plans. I firmly believe that VGL’s moat is emerging, casual, grows with scale and a summaaon of really small things – right product, right price, right understanding, right value posiaoning, right ame, right team play.

Internet not a threat but an enhancing factor
A criAcal and commendable element of the Home Shopping industry has been it’s ability to embrace the technology changes rather than fight with them. The industry has been very nimble in incorporaAng internet and then the mobile pla]orms as part of it’s sales strategies, transforming themselves into an an Omni-‐channel retailer. The customers who do not have access to TV are able to watch the LIVE streaming online and in case, a show was aired at an inconvenient Ame, they can access the online video libraries. The convergence of television, internet and smartphones is something that these players understand very well. And when the cable boxes and the browsers in your phone and laptop become one, they feed each other. Television channels currently drive tremendous traffic to online shopping. There are customers who watch the shows on TV and place their orders on internet and there are customers who do it the other way. In short, the conAnued success of home shopping pla]orm and the industry players are examples of how you can manage to survive in the Amazon era – by developing deeper relaAonships with your customers, by differenAaAon your product mix, focusing on areas such as product demos and by creaAng a community around the company.
17
44
38
0 5
10 15 20 25 30 35 40 45 50
VGL HSN QVC
Web % of Revenues
11 13
17 19
24
29
34 38
0
5
10
15
20
25
30
35
40
FY 12A FY 13A FY 14A FY 15E FY 16E FY 17E FY 18E FY 19E
VGL's Web % of Revenues

Financials

ROE, ROCE and ROTCE = Extra-‐ordinary return capabiliAes
49
65
37 36 35 38 37
0 10 20 30 40 50 60 70
FY 13A FY 14A FY 15E FY 16E FY 17E FY 18E FY 19E
ROE (%) *
27
53 48 51 51 52 51
0
10
20
30
40
50
60
FY 13A FY 14A FY 15E FY 16E FY 17E FY 18E FY 19E
ROCE (%)
46
112 99 102 110
122 130
0
50
100
150
FY 13A FY 14A FY 15E FY 16E FY 17E FY 18E FY 19E
ROTCE (%)
VGL has high cash generaAng abiliAes coupled with li?le need for incremental working capital and incremental Capex. Hence ROE or ROCE may not provide the true picture of the business quality, but Return on Tangible Capital (ROTCE) will. ROTCE is calculated as OperaAng income / (Net Current Assets + Net Fixed Assets). The denominator takes into account only the core operaAng capital that is Aed to the business. ROTCE of 100% or more is just unheard anywhere in the retail industry globally. QVC’s ROTCE stands at ~80% and HSN’s ROTCE at 40%. * -‐ Fall in ROE aLer FY 14 is due to change in tax rate. EffecAve tax rate for FY 15E is 27% as against 1.4% in FY 14.
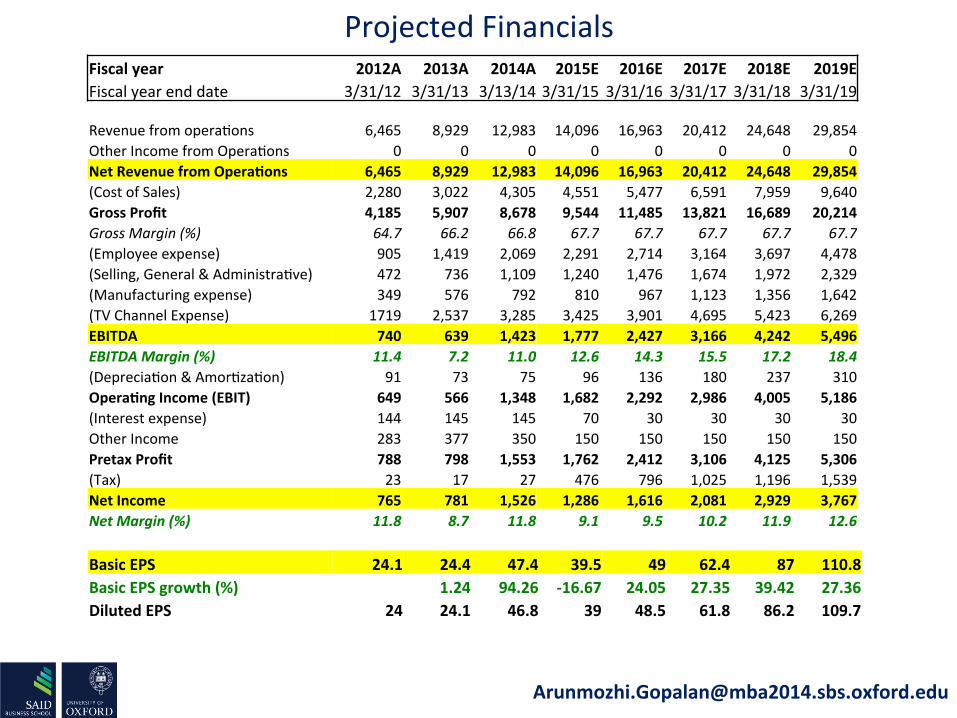
Projected Financials Fiscal year 2012A 2013A 2014A 2015E 2016E 2017E 2018E 2019E Fiscal year end date 3/31/12 3/31/13 3/13/14 3/31/15 3/31/16 3/31/17 3/31/18 3/31/19
Revenue from operaAons 6,465 8,929 12,983 14,096 16,963 20,412 24,648 29,854 Other Income from OperaAons 0 0 0 0 0 0 0 0 Net Revenue from Operaaons 6,465 8,929 12,983 14,096 16,963 20,412 24,648 29,854 (Cost of Sales) 2,280 3,022 4,305 4,551 5,477 6,591 7,959 9,640 Gross Profit 4,185 5,907 8,678 9,544 11,485 13,821 16,689 20,214 Gross Margin (%) 64.7 66.2 66.8 67.7 67.7 67.7 67.7 67.7 (Employee expense) 905 1,419 2,069 2,291 2,714 3,164 3,697 4,478 (Selling, General & AdministraAve) 472 736 1,109 1,240 1,476 1,674 1,972 2,329 (Manufacturing expense) 349 576 792 810 967 1,123 1,356 1,642 (TV Channel Expense) 1719 2,537 3,285 3,425 3,901 4,695 5,423 6,269 EBITDA 740 639 1,423 1,777 2,427 3,166 4,242 5,496 EBITDA Margin (%) 11.4 7.2 11.0 12.6 14.3 15.5 17.2 18.4 (DepreciaAon & AmorAzaAon) 91 73 75 96 136 180 237 310 Operaang Income (EBIT) 649 566 1,348 1,682 2,292 2,986 4,005 5,186 (Interest expense) 144 145 145 70 30 30 30 30 Other Income 283 377 350 150 150 150 150 150 Pretax Profit 788 798 1,553 1,762 2,412 3,106 4,125 5,306 (Tax) 23 17 27 476 796 1,025 1,196 1,539 Net Income 765 781 1,526 1,286 1,616 2,081 2,929 3,767 Net Margin (%) 11.8 8.7 11.8 9.1 9.5 10.2 11.9 12.6
Basic EPS 24.1 24.4 47.4 39.5 49 62.4 87 110.8 Basic EPS growth (%) 1.24 94.26 -‐16.67 24.05 27.35 39.42 27.36 Diluted EPS 24 24.1 46.8 39 48.5 61.8 86.2 109.7

Risks & Valuaaon

Risks Changing television distribuaon landscape • If current bundled distribuAon model changes or if customers are allowed to unbundle at their preference, VGL
could suffer from a decline in new member addiAon and hence the cost of acquiring a new member may rise.
• If the recently announced consolidaAon in US pay television industry takes shape, the carriers will have more pricing power and can push the carriage costs higher.
E-‐commerce is extremely compeaave • E-‐commerce compeAtors namely Amazon and eBay are willing to spend huge sums on sales and markeAng and are
ready to maintain extremely lower prices to a?ract new customers.
• VGL has the burden of developing interesAng content and consistently engaging its viewers in addiAon to providing its retail offerings.
Changes in TV viewing habits • Changes in TV viewing habits such as usage of recording facility, shiL towards internet tv can have long term impact
on addiAon of new customers.
Currency Risk

ValuaAon & Conclusion
Among its sizable peers, while VGL is the smallest in terms of revenues, VGL has the most promising growth story among them. From the above comparison, it is very evident that the peers usually trade in a narrow valuaAon band, making the comparison more reliable. Shop HQ, though thrice the size of VGL in revenues, has not churned out a dime in profits for almost a decade. It has been grossly mismanaged for several years now and the damage is deep on many dimensions. SAll, investors are ready to bet on a quick turnaround and Shop HQ is trading at a 1 Yr Forward PE of 22 compared to VGL which trades at a 1 Yr Forward PE of 11.9. Had VGL been listed on NASDAQ and had VGL been closely noAced among its peers, I believe that the comparaAve return capabiliAes, unique business posiAoning and superior growth prospects will fetch a 1 Yr Forward PE that is be?er than that of its peers. I value VGL based on a 1 Yr Forward PE of 18.9 (15% discount valuaAon to Shop HQ) and arrive at a price target of INR 926.1 (57.5% upside) in 12 months. Long term investors with a 3 year perspecAve are likely to be more rewarded since the a?racAveness of the business mulAplies with scale and Ame. Based on a 1 Yr Forward mulAple of 20, I arrive at a price target of INR 2216 (276.9% upside) in the next 3 year ame period. A reasonable and probably a significant dividend payout policy aLer 2 years can amplify the real stock returns.
VGL Shop HQ HSN QVC
Market Cap (USD Bn) 0.39 0.32 3.7 16.1
Sales (USN Bn) 0.21 0.64 2.3 8.6
EBITDA Margin (%) 12 3 11 21
Last 3 Year Sales growth CAGR(%) 26.19 4.68 3.5 2.34
ROTCE (%) 112 0 47.3 81
TTM PE 16.34 0 23 24
1 Year Forward PE 11.9 22 20 21