vale’s performance in 2016 · 4q14 1q15 2q15 3q15 4q15 1q16 2q16 3q16 4q16 1 2014 and 2015...
TRANSCRIPT

1
Vale’s Performance in 2016
Ricardo Teles / Agência Vale
Rio de Janeiro, February 23rd, 2017
2 Ag
en
da“This presentation may include statements that present Vale's expectations about
future events or results. All statements, when based upon expectations about the
future and not on historical facts, involve various risks and uncertainties. Vale
cannot guarantee that such statements will prove correct. These risks and
uncertainties include factors related to the following: (a) the countries where we
operate, especially Brazil and Canada; (b) the global economy; (c) the capital
markets; (d) the mining and metals prices and their dependence on global
industrial production, which is cyclical by nature; and (e) global competition in the
markets in which Vale operates. To obtain further information on factors that may
lead to results different from those forecast by Vale, please consult the reports
Vale files with the U.S. Securities and Exchange Commission (SEC), the
Brazilian Comissão de Valores Mobiliários (CVM), the French Autorité des
Marchés Financiers (AMF) and in particular the factors discussed under
“Forward-Looking Statements” and “Risk Factors” in Vale’s annual report on Form
20-F.”
“Cautionary Note to U.S. Investors - The SEC permits mining companies, in their
filings with the SEC, to disclose only those mineral deposits that a company can
economically and legally extract or produce. We present certain information in
this presentation, including ‘measured resources,’ ‘indicated resources,’ ‘inferred
resources,’ ‘geologic resources’, which would not be permitted in an SEC filing.
These materials are not proven or probable reserves, as defined by the SEC, and
we cannot assure you that these materials will be converted into proven or
probable reserves, as defined by the SEC. U.S. Investors should consider closely
the disclosure in our Annual Report on Form 20-K, which may be obtained from
us, from our website or at http://http://us.sec.gov/edgar.shtml.” Dis
clai
mer

3 Ag
en
da
1. Vale’s performance in 2016
2. Capital expenditures
3. Capital structure
4. Business segment performance
Agen
da

4
Vale’s performance in
2016

5
Fe Pellets Ni Cu Coal
Another year of sound operational
performance
Production highlights 2016
Total: 348.8 Mt
Carajás: 148.1 Mt
Total: 46.2 Mt
Tubarão 8: 7.2 Mt
Total: 311.0 kt
VNC: 34.3 kt
Total: 453.1 kt
Salobo: 175.9 kt
Au by-product:
483,000 oz
Total: 7.2 Mt
Moatize: 5.5 Mt% % %
Annual record%
%
%
%
%
%
%
5
6
46%
15%
17%
8%
8%
China Other AsiaEurope BrazilNorth America Middle EastRest of the World
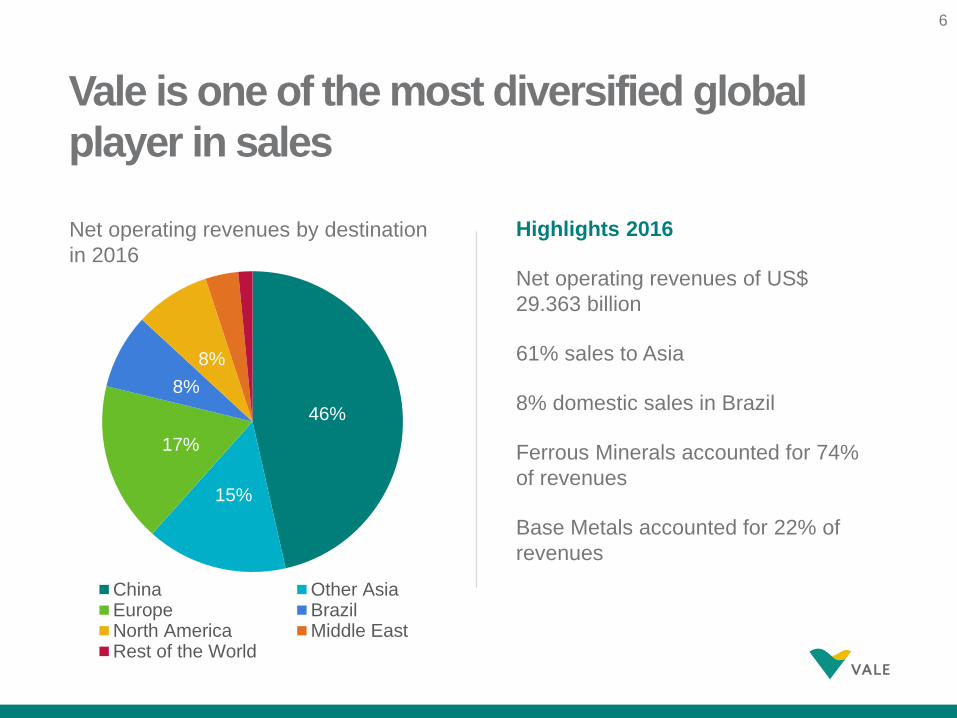
Vale is one of the most diversified global
player in sales
Highlights 2016
Net operating revenues of US$
29.363 billion
61% sales to Asia
8% domestic sales in Brazil
Ferrous Minerals accounted for 74%
of revenues
Base Metals accounted for 22% of
revenues
Net operating revenues by destination
in 2016
6

7
Focus on cost controls and operational
efficiency is delivering results
Highlights
Total costs and expenses reduced by
US$ 1.841 billion in 2016
A leaner and simpler structure set to
reduce overlaps among departments
and businesses
Cost and expenses reduction
initiatives amounted to US$ 2.010
billion in 2016
Cost cutting in iron ore has been driven
by operational efficiency, with iron ore
C1 Cash Cost + Expenses per ton
decreasing from BRL 60.1/t in 2015 to
BRL 54.7/t in 2016
19,2
17,4
2,0
0,4
0,9 0,4
2015 Cost and expenses reduction initiatives
FX Higher sales
volumes
Others 2016
Costs and expenses 2016 X 2015
US$ billion
7

8
1,391
3,022
4,770
4Q15 3Q16 4Q16
Significant EBITDA increase due to overall
strong performance
Highlights 4Q16
EBITDA increased 243% vs. 4Q15 and
58% vs. 3Q16
Ferrous Minerals increased US$ 1.616
billion vs. 3Q16
Base Metals increased US$ 93 million
vs. 3Q161
Coal increased US$ 163 million vs.
3Q16
EBITDA, q-o-q
58%
243%
US$ billion
8
1 Excluding the effect of the goldstream transaction in 3Q16.
9
Capital expenditures

10
Vale investment cycle: new projects coming
on line; capex going down
Highlights 4Q16
Total capex was US$ 1.408 billion in 4Q16,
decreasing US$ 785 million vs. 4Q15
S11D loaded 11 vessels up to January
2017, of which 2 Valemax
Sustaining capex per ton of production is
lower than our main competitors’ average
There are no other planned iron ore
projects in the pipeline for the next 6
years
Reaping the fruits of our investment cycle:
increased quality, production and
productivity
Project and sustaining capex
US$ million
1.366
741614
827
516794
4Q15 3Q16 4Q16
Growth projects Sustaining
2,193
1,2571,408
10

11
With S11D, we will achieve unprecedented
levels of competitiveness and price realization
Highlights
High-grade hematite
ore type with iron ore
grade of more than
66% on average
90 Mt per year of
nominal capacity
76% of physical
progress at the
logistics infrastructure
sitesRicardo Teles / Agência Vale
11
12
14,4
7,7
CurrentVale²
ExpectedS11D³
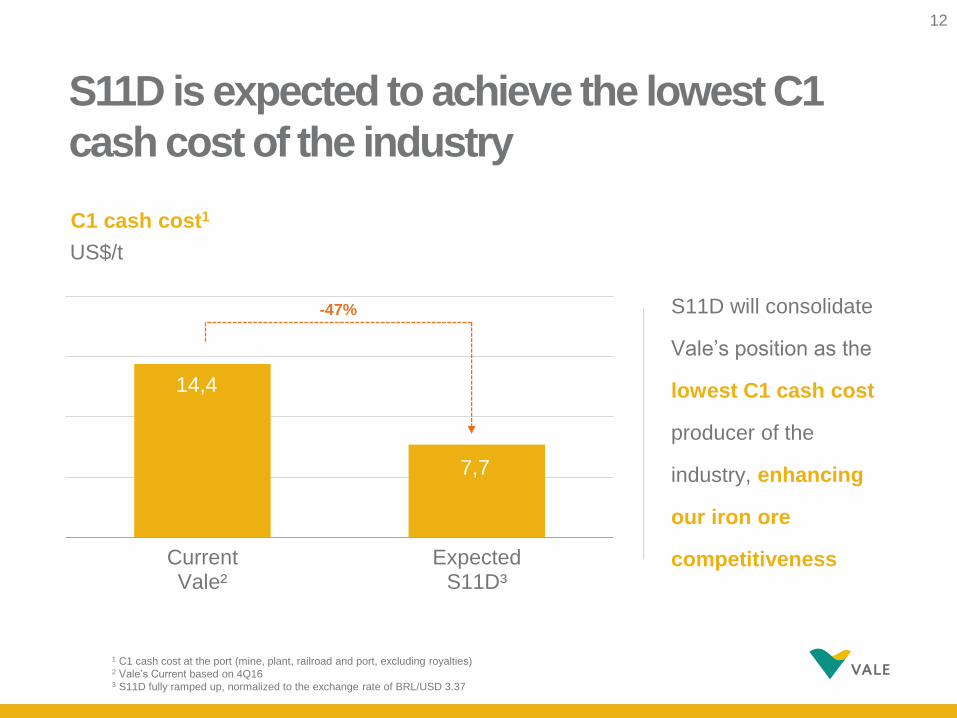
S11D is expected to achieve the lowest C1
cash cost of the industry
C1 cash cost1
S11D will consolidate
Vale’s position as the
lowest C1 cash cost
producer of the
industry, enhancing
our iron ore
competitiveness
1 C1 cash cost at the port (mine, plant, railroad and port, excluding royalties)2 Vale’s Current based on 4Q163 S11D fully ramped up, normalized to the exchange rate of BRL/USD 3.37
-47%
US$/t
12

13
3,2
1,81,1
0,3
2,3
2,5
2,5
2,52,5 2,3
0,20,9
1,2
0,70,6
5,5
4,5 4,54,0
3,22,9
2016 2017E 2018E 2019E 2020E 2021E
Growth approved
Sustaining
Replacement
Future CAPEX to remain low
US$ billion
Note: BRL/USD exchange rate of BRL/USD 3.37 from 2017 onwards
13

14
Capital structure
15
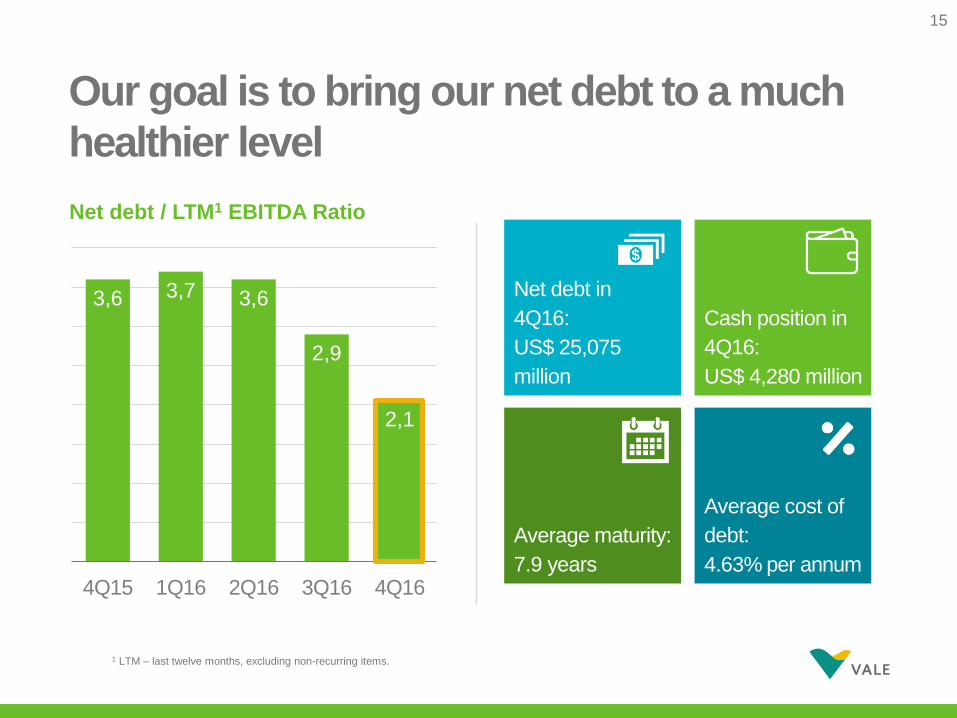
3,6 3,7 3,6
2,9
2,1
4Q15 1Q16 2Q16 3Q16 4Q16
Our goal is to bring our net debt to a much
healthier level
Net debt / LTM1 EBITDA Ratio
1 LTM – last twelve months, excluding non-recurring items.
Net debt in
4Q16:
US$ 25,075
million
Cash position in
4Q16:
US$ 4,280 million
Average maturity:
7.9 years
Average cost of
debt:
4.63% per annum
15
16
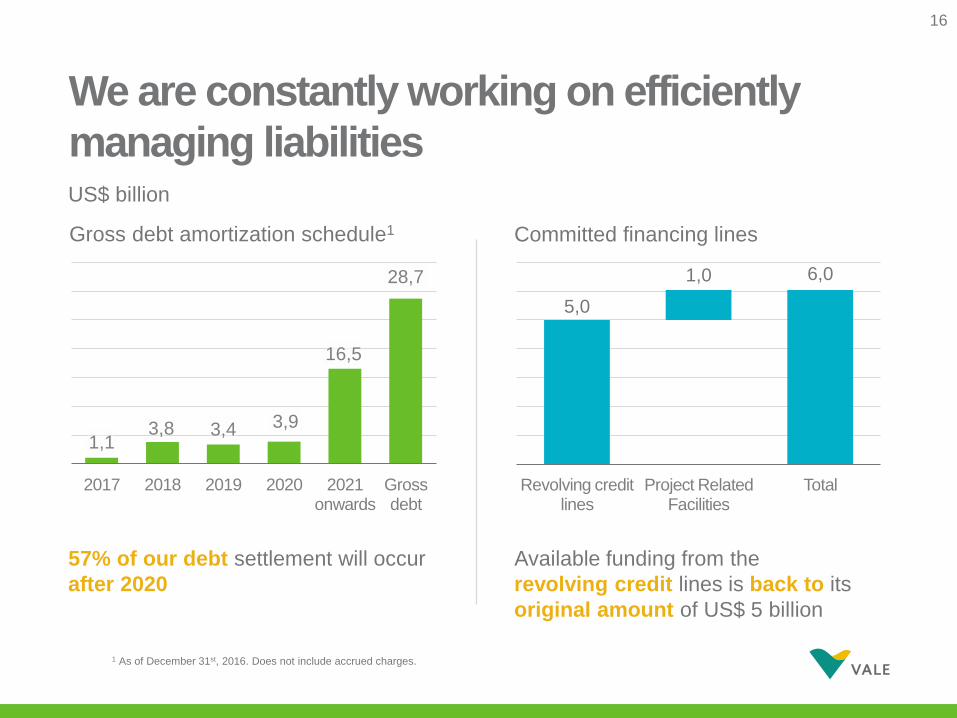
1,13,8 3,4 3,9
16,5
28,7
2017 2018 2019 2020 2021onwards
Gross debt
We are constantly working on efficiently
managing liabilities
Gross debt amortization schedule1
1 As of December 31st, 2016. Does not include accrued charges.
US$ billion
5,0
1,0 6,0
Revolving credit lines
Project Related Facilities
Total
Committed financing lines
Available funding from the
revolving credit lines is back to its
original amount of US$ 5 billion
57% of our debt settlement will occur
after 2020
16

17
Business segment
performance

18
Ferrous minerals EBITDA increased by our
efforts to reduce costs and improve pricing
5.899
2.727
244 347 357
421 212 607
86
10,476
EBITDA 2015
Price FX Bunker Commercial initiatives
Volume CFR Freight Sales
Cost saving &
productivity initiatives
Others EBITDA 2016
US$ million, 2016 vs. 2015
US$ 1,259 M
18
1
1 The negative impact of US$ 212 million in CRF freight sales was due to the higher CFR sales volumes, which increased from 189.2 Mt in 2015 to 202.4
Mt in 2016.

191 Ex-ROM
Annual cash break-even cost landed in
China for iron ore and pellets
13,3
12,2
3,6
0,5 2,6
1,7
30,5
1,5
28,9
2,6 31,5
C1 Cash Cost¹
Freight Royalties & Expenses
Distribuition Moisture Quality EBITDA Breakeven
Iron Ore fines
Pellet Adjustment
EBITDA Breakeven (pellets &
fines)
Sustaining Iron Ore & Pellets Cash Breakeven
Cost landed in China
US$/t, 2016
19

20
The right strategy – cash cost in BRL1 remains
at low levels despite inflationary pressure
55,2 54,6
50,0
46,9 46,347,5
46,1
42,2
44,8
0,73,0
4Q14 1Q15 2Q15 3Q15 4Q15 1Q16 2Q16 3Q16 4Q16
1 2014 and 2015 figures were adjusted to the new allocation criteria, as reported in the 4Q15, and include acquisition costs of third party purchased ore
-13.4%
R$/tNon-recurring costs
20

21
Iron ore price realization continued to
improve in 4Q16
70,8
79,1
69,4
1,7
0,4
4,8 1,3 1,0 1,7 3,8
5,9
AveragePlatts
4Q16 (dmt)
Quality Premium/Discount and commercial
conditions
Provisionalprices in
prior quarter¹
Laggedprices
Current Provisionalprices
in currentquarter²
CFR reference price (dmt)
Adjustmentfor
FOB Sales
Moisture Vale CFR/FOB price
(wmt)³
Impact of pricing system adjustments
1 Adjustment as a result of provisional prices booked in 3Q16 at US$ 54.4/t.2 Difference between the weighted average of the prices provisionally set at the end of 4Q16 at US$ 74.6/t based on forward curves and US$ 70.8/t from the 4Q16 IODEX.3 Vale price is net of taxes.
US$/t, 4Q16
+ 8.3 US$/t
21

22
Rising contribution of higher quality new
mines and infrastructure
Price indexIron ore production from Northern System
Date IODEX 62%
(A)
Metal
Bulletin 65%
(B)
(B-A)
09/15/2016 56.3 65.5 9.2
10/31/2016 64.7 75.5 10.8
12/15/2016 81.8 94.6 12.8
01/31/2017 83.5 97.0 13.5
02/21/2017 95.1 106.2 11.1
US$/dmt¹as % of total production
1 Dmt = dry metric ton
37,5%
42,5%
2015 2016
22

23
We are as competitive as our Australian peers
despite the geographical distance
49,6
24,0
18,0 17,5
24,3
36,0
67,9
45,2
32,1
24,6 24,7
35,9
62,7
45,0
31,9
24,5 25,4
35,935,1
17,8
13,215,7
22,2
30,7
18,321,2
13,9
7,0
1,1 -0,1
-35
-25
-15
-5
5
15
0,0
10,0
20,0
30,0
40,0
50,0
60,0
70,0
80,0
1H14 2H14 1H15 2H15 1H16 2H16
Vale
Peer 1
Peer 2
Peer 3
Gap to most competitive peer, US$/t
EBITDA per ton, US$/t
23

24
450
543123
21 17 1313
3Q16 Price realization
Costs FX Expenses Volume & others
4Q16
Base Metals EBITDA up 21% q-o-q
Highlights 4Q16
Base Metals EBITDA increased US$ 93 million q-o-q1
Nickel and copper pricerealization improvedwhile LME prices increased in the same period
Nickel and copper sales volumes increased, while PGMs as a by-product decreased
Quarterly EBITDA comparison
US$ million
24
1 3Q16 net of the one-off positive effect of the goldstream transaction (US$ 150 million)

25
-7
156
-43
200
6
3Q16 Costs & expenses
Realized price FX & others 4Q16
Coal EBITDA turned around with a
significant q-o-q increase
Highlights 4Q16
EBITDA increased US$
163 million in 4Q16
The hike in coal prices
was captured in the 4Q16
due to provisional pricing
Sales of metallurgical coal
increased 19.6% as a
result of the ramp-up of
Moatize II
Moatize production costs
FOB Nacala decreased
US$ 21/t to US$ 76.8/t in
January 2017
Quarterly EBITDA comparison
US$ million
25
1
1 Costs increased due to constraints on the supply of explosives affecting the blasting process and resulting in a lower production figure compared to 3Q16.

26
Additional
information

27
Evolution of iron ore fines cash cost, freight
and expenses
12,012,8 13,2
0,1
0,5
2H15 1H16 2H16
C1 Cash Cost FOB Port1 Freight
US$/t
15,2
11,612,6
2H15 1H16 2H16
Expenses2 & Royalties
3,74,0
3,4
2H15 1H16 2H164
1 Ex-ROM and ex-royalties; all figures as per new managerial allocation changes reported in 4Q15 and including acquisition costs of third party ore.2 Net of depreciation.3 US$ 0.5/t equates to the non-recurring events of 4Q16 (US$ 0.9/t) diluted in 2H16.4 Ex bunker oil hedge.
+13.2% -17.1% -8.1%
3
Non-recurring costs
27

28
11% 10%
61%
45%
28%
45%
3Q16 4Q16
Lagged
Current
Provisional
Iron ore pricing systems
Provisional - prior quarter Lagged
Current Provisional - current quarter
1,6
4,8
3Q16 4Q16-0,4
-1,3
3Q16 4Q16
-0,8
1,0
3Q16 4Q16
-1,2
1,7
3Q16 4Q16
Pricing system breakdown Impact of pricing mechanisms
US$/t
28

29
Price realization nickel
10,810 10,803
283 290
Average LME nickel price
Price premium on refined products
Price discount on intermediate products
Average nickel realized price
29
US$/t, 4Q16

30
Price realization copper
5.277
5.063
5.497
5.093
214
434 403
Average LME copper price
Current period price adjustments
Copper gross realized price
Prior period price adjustments
Copper realized price before discounts
TC/RCs, penalties, premiums and
discounts
Average copper realized price
US$/t, 4Q16
30
31
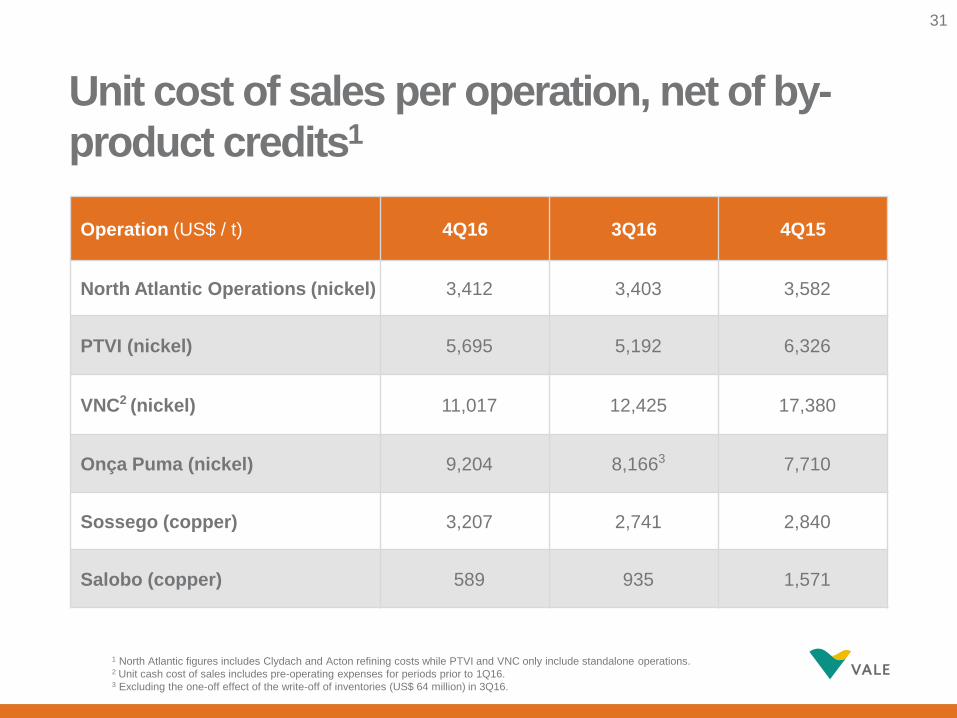
Unit cost of sales per operation, net of by-
product credits1
Operation (US$ / t) 4Q16 3Q16 4Q15
North Atlantic Operations (nickel) 3,412 3,403 3,582
PTVI (nickel) 5,695 5,192 6,326
VNC2 (nickel) 11,017 12,425 17,380
Onça Puma (nickel) 9,204 8,1663 7,710
Sossego (copper) 3,207 2,741 2,840
Salobo (copper) 589 935 1,571
1 North Atlantic figures includes Clydach and Acton refining costs while PTVI and VNC only include standalone operations.2 Unit cash cost of sales includes pre-operating expenses for periods prior to 1Q16.3 Excluding the one-off effect of the write-off of inventories (US$ 64 million) in 3Q16.
31

32
Price realization Moatize metallurgical coal
266,2
232,4
7,4
14,9 10,3 0,1 1,1
Averagereference price
4Q16
Quality Lagged priceindex
Lagged pricequarterly
benchmark
Freightdifferential
Others Valeprice
US$/t, 4Q16
32

33
Price realization Moatize thermal coal
85,4
67,9
9,4 3,5
4,6
- 5,0
10,0 15,0 20,0 25,0 30,0 35,0 40,0 45,0 50,0 55,0 60,0 65,0 70,0 75,0 80,0 85,0 90,0
Averagereference price
4Q16
Quality Index and fixed lagged price index
Commercial discount and others
Vale realizedprice
US$/t, 4Q16
33

34