valet safety mer 0.56% - s3.amazonaws.com · internal use only - this is a hypothetical...
TRANSCRIPT

Internal use only - This is a hypothetical illustration of performance based on the current portfolio’s holdings and weights as described, going back to inception, being rebalanced daily and denominated in Canadian dollars. All returns are time weighted and include the underlying funds’ management expense ratio (MER); however, do not include WealthBar’s management fee or taxes. Clients do not pay any trading or custody fees. Rates of return are annualized for all periods greater than one year. The performance provided is for informational purposes only and is not to be considered as investment advice. Portfolios’ performance is not guaranteed; the value can go up and down and change frequently. Past performance is not indicative of future returns. There may be significant differences between the investment portfolios that are not discussed here, including different investment objectives and risk factors. Investing involves risks and you should consult your portfolio manager or other financial professional. Source: MorningStar Direct. WealthBar Financial Services Inc. (WealthBar), a subsidiary of CI Financial Corp. and affiliate of CI Investments Inc., is a registered portfolio manager in all provinces and territories across Canada.
Performance as of June 30, 2019
26102.19.08.06
Valet Safety MER 0.56%
67.0% NWM Primary Mortgage Fund (NWM154) 33.0% Purpose High-Interest Savings ETF (PSA)
Holdings
Period Annualized Returns
CumulativeReturns
YTD 1.84%1 Month 0.28%3 Month 0.94%6 Month 1.84%1 Year 3.76% 3.76%2 Year 3.62% 7.37%3 Year 3.47% 10.76%Since Inception* 3.53% 18.34%
Risk Metrics Sortino Ratio Standard Deviation Sharpe Ratio
Valet Safety -0.27 0.13 -0.20
1 Year GIC -0.61 0.07 -0.48
33.0% Cash (High Interest Savings) 67.0% Fixed Income (Mortgages)
Calendar Year Returns 2018 2017 2016 2015Valet Safety 3.65% 3.35% 3.22% 3.49%1 Year GIC 0.91% 0.73% 0.82% 0.82%
Asset Allocation
*August 20, 2014

Internal use only - This is a hypothetical illustration of performance based on the current portfolio’s holdings and weights as described, going back to inception, being rebalanced daily and denominated in Canadian dollars. All returns are time weighted and include the underlying funds’ management expense ratio (MER); however, do not include WealthBar’s management fee or taxes. Clients do not pay any trading or custody fees. Rates of return are annualized for all periods greater than one year. The performance provided is for informational purposes only and is not to be considered as investment advice. Portfolios’ performance is not guaranteed; the value can go up and down and change frequently. Past performance is not indicative of future returns. There may be significant differences between the investment portfolios that are not discussed here, including different investment objectives and risk factors. Investing involves risks and you should consult your portfolio manager or other financial professional. Source: MorningStar Direct. WealthBar Financial Services Inc. (WealthBar), a subsidiary of CI Financial Corp. and affiliate of CI Investments Inc., is a registered portfolio manager in all provinces and territories across Canada.
Performance as of June 30, 2019
26102.19.08.06
Valet Conservative MER 0.36%
35.0% Vanguard Canadian Short-Term Bond ETF (VSB) 15.0% NWM Primary Mortgage Fund (NWM154) 12.5% Horizons S&P 500 ETF (HXS) 10.0% iShares Core MSCI EAFE IMI ETF (XEF) 7.5% Horizons Laddered CDN Preferred Share ETF (HLPR) 7.5% Horizons S&P/TSX 60 ETF (HXT) 7.5% NWM Real Estate Fund (NWM144) 5.0% NWM Balanced Mortgage Fund (NWM164)
Holdings
Period Annualized Returns
CumulativeReturns
YTD 5.11%1 Month 0.89%3 Month 0.86%6 Month 5.11%1 Year 3.30% 3.30%2 Year 4.42% 9.03%3 Year 5.64% 17.88%Since Inception* 4.82% 25.72%
35.0% Government Bonds 7.5% Canada Equity 10.0% International Equity 20.0% Fixed Income 7.5% Income Strategies 7.5% Real Estate 12.5% US Equity
Calendar Year Returns 2018 2017 2016 2015Valet Conservative 0.58% 6.29% 5.09% 4.52%
Canada Fund Global Fixed Income Balanced -1.77% 4.06% 4.16% 4.23%
Risk Metrics Sortino Ratio Standard Deviation Sharpe Ratio
Valet Conservative -0.07 3.66 -0.05
Canada Fund Global Fixed Income Balanced -0.24 4.04 -0.17
Asset Allocation
*August 20, 2014

Internal use only - This is a hypothetical illustration of performance based on the current portfolio’s holdings and weights as described, going back to inception, being rebalanced daily and denominated in Canadian dollars. All returns are time weighted and include the underlying funds’ management expense ratio (MER); however, do not include WealthBar’s management fee or taxes. Clients do not pay any trading or custody fees. Rates of return are annualized for all periods greater than one year. The performance provided is for informational purposes only and is not to be considered as investment advice. Portfolios’ performance is not guaranteed; the value can go up and down and change frequently. Past performance is not indicative of future returns. There may be significant differences between the investment portfolios that are not discussed here, including different investment objectives and risk factors. Investing involves risks and you should consult your portfolio manager or other financial professional. Source: MorningStar Direct. WealthBar Financial Services Inc. (WealthBar), a subsidiary of CI Financial Corp. and affiliate of CI Investments Inc., is a registered portfolio manager in all provinces and territories across Canada.
Performance as of June 30, 2019
26102.19.08.06
Valet Balanced MER 0.42%
22.5% Vanguard Canadian Short-Term Bond ETF (VSB) 15.0% Horizons S&P 500 ETF (HXS) 12.5% iShares Core MSCI EAFE IMI ETF (XEF)12.5% NWM Real Estate Fund (NWM144) 10.0% Horizons S&P/TSX 60 ETF (HXT) 10.0% NWM Primary Mortgage Fund (NWM154) 7.5% Horizons Laddered CDN Preferred Share ETF (HLPR) 5.0% NWM Balanced Mortgage Fund (NWM164) 5.0% BMO High Yld US Corp BD Hdgd to CAD ETF (ZHY)
Holdings
Period Annualized Returns
CumulativeReturns
YTD 6.24%1 Month 1.18%3 Month 0.98%6 Month 6.24%1 Year 3.66% 3.66%2 Year 5.05% 10.35%3 Year 6.73% 21.56%Since Inception* 5.65% 30.63%
22.5% Government Bonds 7.5% Income Strategies 10.0% Canada Equity 15.0% US Equity 12.5% International Equity 15.0% Fixed Income 12.5% Real Estate 5.0% High Yield Bonds
Calendar Year Returns 2018 2017 2016 2015Valet Balanced 0.12% 7.67% 6.68% 5.09%Canada Fund Global Neutral Balanced -3.14% 7.12% 4.65% 5.40%
Risk Metrics Sortino Ratio Standard Deviation Sharpe Ratio
Valet Balanced 0.06 4.52 0.04
Canada Fund Global Neutral Balanced -0.05 5.59 -0.03
Asset Allocation
*August 20, 2014

Internal use only - This is a hypothetical illustration of performance based on the current portfolio’s holdings and weights as described, going back to inception, being rebalanced daily and denominated in Canadian dollars. All returns are time weighted and include the underlying funds’ management expense ratio (MER); however, do not include WealthBar’s management fee or taxes. Clients do not pay any trading or custody fees. Rates of return are annualized for all periods greater than one year. The performance provided is for informational purposes only and is not to be considered as investment advice. Portfolios’ performance is not guaranteed; the value can go up and down and change frequently. Past performance is not indicative of future returns. There may be significant differences between the investment portfolios that are not discussed here, including different investment objectives and risk factors. Investing involves risks and you should consult your portfolio manager or other financial professional. Source: MorningStar Direct. WealthBar Financial Services Inc. (WealthBar), a subsidiary of CI Financial Corp. and affiliate of CI Investments Inc., is a registered portfolio manager in all provinces and territories across Canada.
Performance as of June 30, 2019
26102.19.08.06
Valet Growth MER 0.47%
27.5% Horizons S&P 500 ETF (HXS)20.0% NWM Real Estate Fund (NWM144) 17.5% iShares Core MSCI EAFE IMI ETF (XEF)10.0% Horizons S&P/TSX 60 ETF (HXT) 10.0% NWM Primary Mortgage Fund (NWM154) 10.0% Vanguard Canadian Short-Term Corp BD ETF (VSC) 5.0% BMO High Yld US Corp BD Hdgd to CAD ETF (ZHY)
Holdings
10.0% Canada Equity 10.0% Corporate Bonds 5.0% High Yield Bonds 17.5% International Equity 10.0% Mortgages 20.0% Real Estate 27.5% US Equity
Period Annualized Returns
CumulativeReturns
YTD 8.36%1 Month 1.61%3 Month 1.36%6 Month 8.36%1 Year 5.62% 5.62%2 Year 7.11% 14.70%3 Year 8.76% 28.64%Since Inception* 8.25% 47.02%
Risk Metrics Sortino Ratio Standard Deviation Sharpe Ratio
Valet Growth 0.47 6.13 0.31
Canada Fund Global Equity Balanced 0.03 6.90 0.02
Calendar Year Returns 2018 2017 2016 2015Valet Growth 1.09% 9.47% 7.60% 10.63%Canada Fund Global Equity Balanced -4.63% 8.98% 4.94% 6.56%
Asset Allocation
*August 20, 2014

Internal use only - This is a hypothetical illustration of performance based on the current portfolio’s holdings and weights as described, going back to inception, being rebalanced daily and denominated in Canadian dollars. All returns are time weighted and include the underlying funds’ management expense ratio (MER); however, do not include WealthBar’s management fee or taxes. Clients do not pay any trading or custody fees. Rates of return are annualized for all periods greater than one year. The performance provided is for informational purposes only and is not to be considered as investment advice. Portfolios’ performance is not guaranteed; the value can go up and down and change frequently. Past performance is not indicative of future returns. There may be significant differences between the investment portfolios that are not discussed here, including different investment objectives and risk factors. Investing involves risks and you should consult your portfolio manager or other financial professional. Source: MorningStar Direct. WealthBar Financial Services Inc. (WealthBar), a subsidiary of CI Financial Corp. and affiliate of CI Investments Inc., is a registered portfolio manager in all provinces and territories across Canada.
Performance as of June 30, 2019
26102.19.08.06
Asset Allocation
Private Pool Safety MER 1.00%
50.0% NWM Core Portfolio (NWM254) 25.0% NWM Primary Mortgage (NWM154)12.5% Vanguard CAN Short-Term Bonds ETF (VSB)12.5% Vanguard CAN Short-Term Corp. Bonds ETF (VSC)
Holdings
Period Annualized Returns
CumulativeReturns
YTD 4.22%1 Month 0.65%3 Month 1.31%6 Month 4.22%1 Year 4.53% 4.53%2 Year 4.64% 9.49%3 Year 5.28% 16.69%Since Inception* 5.12% 27.29%
Risk Metrics Sortino Ratio Standard Deviation Sharpe Ratio
Private Pool Safety -0.03 2.03 -0.02
Canada Fund Global Fixed Income Balanced -0.24 4.04 -0.17
*September 1, 2014
32.5% Income Strategies 12.5% Government Bonds 12.5% Corporate Bonds 10.0% Blended Fixed Income 10.0% Real Estate
7.5% US Equities6.0% Canadian Equities3.0% International Equities2.5% Alternative Strategies2.0% Private Equity1.5% Commodities
Calendar Year Returns 2018 2017 2016 2015Private Pool Safety 2.58% 4.89% 5.90% 5.34%Canada Fund Global Fixed Income Balanced -1.77% 4.06% 4.16% 4.23%

Internal use only - This is a hypothetical illustration of performance based on the current portfolio’s holdings and weights as described, going back to inception, being rebalanced daily and denominated in Canadian dollars. All returns are time weighted and include the underlying funds’ management expense ratio (MER); however, do not include WealthBar’s management fee or taxes. Clients do not pay any trading or custody fees. Rates of return are annualized for all periods greater than one year. The performance provided is for informational purposes only and is not to be considered as investment advice. Portfolios’ performance is not guaranteed; the value can go up and down and change frequently. Past performance is not indicative of future returns. There may be significant differences between the investment portfolios that are not discussed here, including different investment objectives and risk factors. Investing involves risks and you should consult your portfolio manager or other financial professional. Source: MorningStar Direct. WealthBar Financial Services Inc. (WealthBar), a subsidiary of CI Financial Corp. and affiliate of CI Investments Inc., is a registered portfolio manager in all provinces and territories across Canada.
Performance as of June 30, 2019
26102.19.08.06
Private Pool Balanced MER 1.56%
100% NWM Core Portfolio (NWM254)Holdings
Period Annualized Returns
CumulativeReturns
YTD 5.86%1 Month 1.04%3 Month 1.60%6 Month 5.86%1 Year 4.91% 4.91%2 Year 6.07% 12.51%3 Year 7.79% 25.22%Since Inception* 7.29% 40.54%
Risk Metrics Sortino Ratio Standard Deviation Sharpe Ratio
Private Pool Balanced 0.34 3.56 0.22
Canada Fund Global Neutral Balanced -0.05 5.59 -0.03
20.0% Real Estate 20.0% Blended Fixed Income 15.0% Income Strategies 15.0% US Equities 12.0% Canadian Equities 6.0% International Equities 5.0% Alternative Strategies 4.0% Private Equity 3.0% Commodities
Calendar Year Returns 2018 2017 2016 2015Private Pool Balanced 2.37% 7.74% 9.17% 7.69%Canada Fund Global Neutral Balanced -3.14% 7.12% 4.65% 5.40%
Asset Allocation
*September 1, 2014

Internal use only - This is a hypothetical illustration of performance based on the current portfolio’s holdings and weights as described, going back to inception, being rebalanced daily and denominated in Canadian dollars. All returns are time weighted and include the underlying funds’ management expense ratio (MER); however, do not include WealthBar’s management fee or taxes. Clients do not pay any trading or custody fees. Rates of return are annualized for all periods greater than one year. The performance provided is for informational purposes only and is not to be considered as investment advice. Portfolios’ performance is not guaranteed; the value can go up and down and change frequently. Past performance is not indicative of future returns. There may be significant differences between the investment portfolios that are not discussed here, including different investment objectives and risk factors. Investing involves risks and you should consult your portfolio manager or other financial professional. Source: MorningStar Direct. WealthBar Financial Services Inc. (WealthBar), a subsidiary of CI Financial Corp. and affiliate of CI Investments Inc., is a registered portfolio manager in all provinces and territories across Canada.
Performance as of June 30, 2019
26102.19.08.06
Private Pool Aggressive MER 1.37%
50.0% NWM Core Portfolio (NWM254) 25.0% NWM Real Estate Fund (NWM144) 25.0% NWM U.S. Tactical High-Income Equities (CAD) (NWM234)
Holdings
35.0% Real Estate 32.5% Income Strategies 10.0% Blended Fixed Income 7.5% US Equities 6.0% Canadian Equities 3.0% International Equities 2.5% Alternative Strategies 2.0% Private Equity 1.5% Commodities
Period Annualized Returns
CumulativeReturns
YTD 6.05%1 Month 0.92%3 Month 0.84%6 Month 6.05%1 Year 4.86% 4.86%2 Year 5.87% 12.09%3 Year 7.63% 24.69%Since Inception* 8.22% 46.52%
Risk Metrics Sortino Ratio Standard Deviation Sharpe Ratio
Private Pool Aggressive 0.58 4.75 0.36
Canada Fund Global Equity Balanced 0.03 6.90 0.02
Calendar Year Returns 2018 2017 2016 2015Private Pool Aggressive 2.71% 6.25% 9.53% 11.80%Canada Fund Global Equity Balanced -4.63% 8.98% 4.94% 6.56%
Asset Allocation
*September 1, 2014

Internal use only - This is a hypothetical illustration of performance based on the current portfolio’s holdings and weights as described, going back to inception, being rebalanced daily and denominated in Canadian dollars. All returns are time weighted and include the underlying funds’ management expense ratio (MER); however, do not include WealthBar’s management fee or taxes. Clients do not pay any trading or custody fees. Rates of return are annualized for all periods greater than one year. The performance provided is for informational purposes only and is not to be considered as investment advice. Portfolios’ performance is not guaranteed; the value can go up and down and change frequently. Past performance is not indicative of future returns. There may be significant differences between the investment portfolios that are not discussed here, including different investment objectives and risk factors. Investing involves risks and you should consult your portfolio manager or other financial professional. Source: MorningStar Direct. WealthBar Financial Services Inc. (WealthBar), a subsidiary of CI Financial Corp. and affiliate of CI Investments Inc., is a registered portfolio manager in all provinces and territories across Canada.
Performance as of June 30, 2019
26102.19.08.06
Essential Safety MER 0.22%
100% Vanguard Conservative ETF Portfolio (VCIP)Holdings
47.4% Canadian Aggregate Bond Index ETF 18.2% Global ex-US Aggregate Bond Index ETF CAD-hedged 15.0% US Aggregate Bond Index ETF CAD-hedged 7.6% US Total Market Index ETF 5.9% FTSE Canada All Cap Index ETF 4.5% FTSE Developed All Cap ex-North America Index ETF 1.4% FTSE Emerging Markets All Cap Index ETF
Period Annualized Returns
CumulativeReturns
YTD 6.27%1 Month 1.37%3 Month 2.28%6 Month 6.27%1 Year 5.41% 5.41%2 Year 4.15% 8.46%3 Year 3.61% 11.23%Since Inception* 4.47% 23.67%
Risk Metrics Sortino Ratio Standard Deviation Sharpe Ratio
Essential Safety -0.17 3.58 -0.12
Canada Fund Global Fixed Income Balanced -0.24 4.04 -0.17
Calendar Year Returns 2018 2017 2016 2015Essential Safety 0.10% 4.44% 3.64% 3.98%Canada Fund Global Fixed Income Balanced -1.77% 4.06% 4.16% 4.23%
Asset Allocation
*August 31, 2014

Internal use only - This is a hypothetical illustration of performance based on the current portfolio’s holdings and weights as described, going back to inception, being rebalanced daily and denominated in Canadian dollars. All returns are time weighted and include the underlying funds’ management expense ratio (MER); however, do not include WealthBar’s management fee or taxes. Clients do not pay any trading or custody fees. Rates of return are annualized for all periods greater than one year. The performance provided is for informational purposes only and is not to be considered as investment advice. Portfolios’ performance is not guaranteed; the value can go up and down and change frequently. Past performance is not indicative of future returns. There may be significant differences between the investment portfolios that are not discussed here, including different investment objectives and risk factors. Investing involves risks and you should consult your portfolio manager or other financial professional. Source: MorningStar Direct. WealthBar Financial Services Inc. (WealthBar), a subsidiary of CI Financial Corp. and affiliate of CI Investments Inc., is a registered portfolio manager in all provinces and territories across Canada.
Performance as of June 30, 2019
26102.19.08.06
Essential Conservative MER 0.22%
100% Vanguard Conservative ETF Portfolio (VCNS)Holdings
34.9% Canadian Aggregate Bond Index ETF 16.1% US Total Market Index ETF 14.0% Global ex-US Aggregate Bond Index ETF CAD-hedged 12.1% FTSE Canada All Cap Index ETF 10.7% US Aggregate Bond Index ETF CAD-hedged 9.5% FTSE Developed All Cap ex-North America Index ETF 2.7% FTSE Emerging Markets All Cap Index ETF
Period Annualized Returns
CumulativeReturns
YTD 7.96%1 Month 1.62%3 Month 1.94%6 Month 7.96%1 Year 5.14% 5.14%2 Year 5.24% 10.74%3 Year 5.49% 17.38%Since Inception* 5.68% 30.81%
Risk Metrics Sortino Ratio Standard Deviation Sharpe Ratio
Essential Conservative 0.02 4.57 0.02
Canada Fund Global Fixed Income Balanced -0.24 4.04 -0.17
Calendar Year Returns 2018 2017 2016 2015Essential Conservative -0.73% 6.68% 5.08% 5.41%Canada Fund Global Fixed Income Balanced -1.77% 4.06% 4.16% 4.23%
Asset Allocation
*August 31, 2014

Internal use only - This is a hypothetical illustration of performance based on the current portfolio’s holdings and weights as described, going back to inception, being rebalanced daily and denominated in Canadian dollars. All returns are time weighted and include the underlying funds’ management expense ratio (MER); however, do not include WealthBar’s management fee or taxes. Clients do not pay any trading or custody fees. Rates of return are annualized for all periods greater than one year. The performance provided is for informational purposes only and is not to be considered as investment advice. Portfolios’ performance is not guaranteed; the value can go up and down and change frequently. Past performance is not indicative of future returns. There may be significant differences between the investment portfolios that are not discussed here, including different investment objectives and risk factors. Investing involves risks and you should consult your portfolio manager or other financial professional. Source: MorningStar Direct. WealthBar Financial Services Inc. (WealthBar), a subsidiary of CI Financial Corp. and affiliate of CI Investments Inc., is a registered portfolio manager in all provinces and territories across Canada.
Performance as of June 30, 2019
26102.19.08.06
Essential Balanced MER 0.22%
100% Vanguard Balanced ETF Portfolio (VBAL)Holdings
24.1% US Total Market Index ETF 23.2% Canadian Aggregate Bond Index ETF 18.1% FTSE Canada All Cap Index ETF 14.2% FTSE Developed All Cap ex-North America Index ETF 9.3% Global ex-US Aggregate Bond Index ETF CAD-hedged 7.1% US Aggregate Bond Index ETF CAD-hedged 4.0% FTSE Emerging Markets All Cap Index ETF
Period Annualized Returns
CumulativeReturns
YTD 9.31%1 Month 2.12%3 Month 1.88%6 Month 9.31%1 Year 4.56% 4.56%2 Year 6.04% 12.44%3 Year 7.18% 23.11%Since Inception* 6.76% 37.45%
Risk Metrics Sortino Ratio Standard Deviation Sharpe Ratio
Essential Balanced 0.18 5.98 0.12
Canada Fund Global Neutral Balanced -0.05 5.59 -0.03
Calendar Year Returns 2018 2017 2016 2015Essential Balanced -1.77% 8.92% 6.53% 6.78%Canada Fund Global Neutral Balanced -3.14% 7.12% 4.65% 5.40%
Asset Allocation
*August 31, 2014

Internal use only - This is a hypothetical illustration of performance based on the current portfolio’s holdings and weights as described, going back to inception, being rebalanced daily and denominated in Canadian dollars. All returns are time weighted and include the underlying funds’ management expense ratio (MER); however, do not include WealthBar’s management fee or taxes. Clients do not pay any trading or custody fees. Rates of return are annualized for all periods greater than one year. The performance provided is for informational purposes only and is not to be considered as investment advice. Portfolios’ performance is not guaranteed; the value can go up and down and change frequently. Past performance is not indicative of future returns. There may be significant differences between the investment portfolios that are not discussed here, including different investment objectives and risk factors. Investing involves risks and you should consult your portfolio manager or other financial professional. Source: MorningStar Direct. WealthBar Financial Services Inc. (WealthBar), a subsidiary of CI Financial Corp. and affiliate of CI Investments Inc., is a registered portfolio manager in all provinces and territories across Canada.
Performance as of June 30, 2019
26102.19.08.06
Essential Growth MER 0.22%
100% Vanguard Growth ETF Portfolio (VGRO)Holdings
32.2% US Total Market Index ETF 24.0% FTSE Canada All Cap Index ETF 18.8% FTSE Developed All Cap ex-North America Index ETF 11.5% Canadian Aggregate Bond Index ETF 5.4% FTSE Emerging Markets All Cap Index ETF 4.6% Global ex-US Aggregate Bond Index ETF CAD-hedged 3.5% US Aggregate Bond Index ETF CAD-hedged
Period Annualized Returns
CumulativeReturns
YTD 11.18%1 Month 2.54%3 Month 1.76%6 Month 11.18%1 Year 4.42% 4.42%2 Year 7.07% 14.63%3 Year 9.05% 29.65%Since Inception* 7.94% 44.97%
Risk Metrics Sortino Ratio Standard Deviation Sharpe Ratio
Essential Growth 0.32 7.57 0.22
Canada Fund Global Equity Balanced 0.03 6.90 0.02
Calendar Year Returns 2018 2017 2016 2015Essential Growth -2.83% 11.20% 7.98% 8.15%Canada Fund Global Equity Balanced -4.63 8.89 4.94 6.56
Asset Allocation
*August 31, 2014
Internal use only - This is a hypothetical illustration of performance based on the current portfolio’s holdings and weights as described, going back to inception, being rebalanced daily and denominated in Canadian dollars. All returns are time weighted and include the underlying funds’ management expense ratio (MER); however, do not include WealthBar’s management fee or taxes. Clients do not pay any trading or custody fees. Rates of return are annualized for all periods greater than one year. The performance provided is for informational purposes only and is not to be considered as investment advice. Portfolios’ performance is not guaranteed; the value can go up and down and change frequently. Past performance is not indicative of future returns. There may be significant differences between the investment portfolios that are not discussed here, including different investment objectives and risk factors. Investing involves risks and you should consult your portfolio manager or other financial professional. Source: MorningStar Direct. WealthBar Financial Services Inc. (WealthBar), a subsidiary of CI Financial Corp. and affiliate of CI Investments Inc., is a registered portfolio manager in all provinces and territories across Canada.
Performance as of June 30, 2019
26102.19.08.06
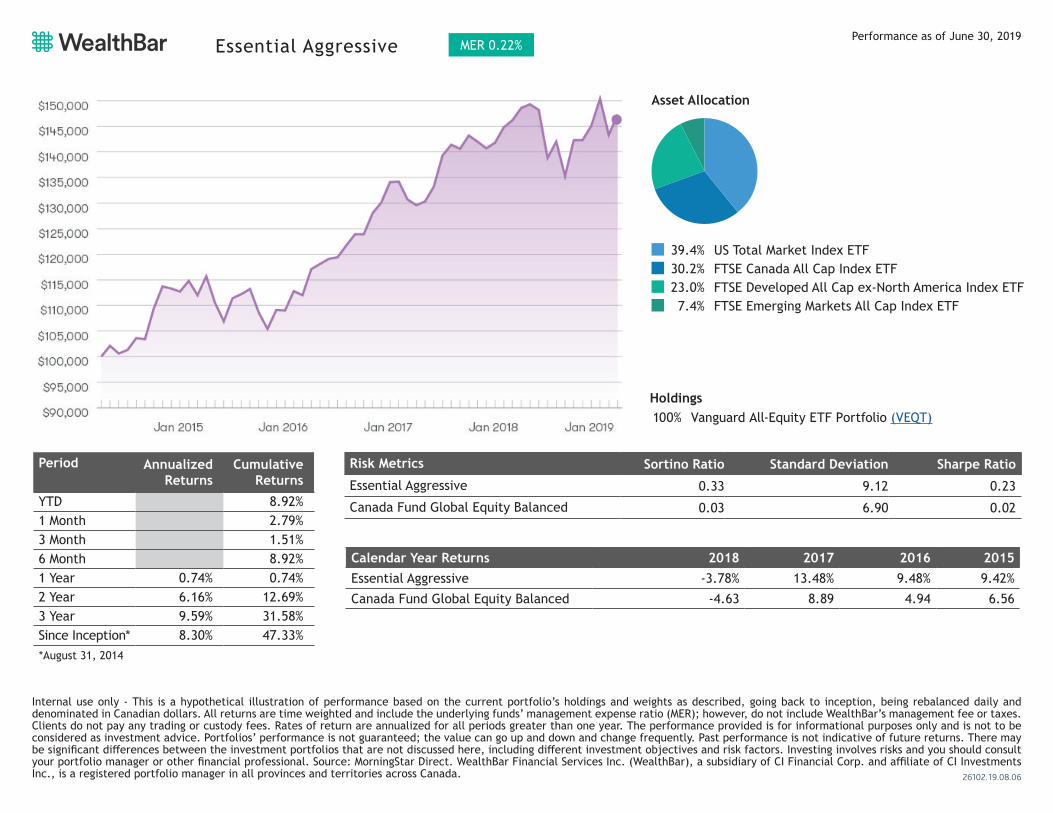
Essential Aggressive MER 0.22%
100% Vanguard All-Equity ETF Portfolio (VEQT)Holdings
39.4% US Total Market Index ETF 30.2% FTSE Canada All Cap Index ETF 23.0% FTSE Developed All Cap ex-North America Index ETF 7.4% FTSE Emerging Markets All Cap Index ETF
Period Annualized Returns
CumulativeReturns
YTD 8.92%1 Month 2.79%3 Month 1.51%6 Month 8.92%1 Year 0.74% 0.74%2 Year 6.16% 12.69%3 Year 9.59% 31.58%Since Inception* 8.30% 47.33%
Risk Metrics Sortino Ratio Standard Deviation Sharpe Ratio
Essential Aggressive 0.33 9.12 0.23
Canada Fund Global Equity Balanced 0.03 6.90 0.02
Calendar Year Returns 2018 2017 2016 2015Essential Aggressive -3.78% 13.48% 9.48% 9.42%Canada Fund Global Equity Balanced -4.63 8.89 4.94 6.56
Asset Allocation
*August 31, 2014