validating patient outcomes using an ipad-based software platform for language & cognitive...
TRANSCRIPT
ASHA 2013 1
VALIDATING PATIENT OUTCOMES USING AN IPAD-BASED SOFTWARE
PLATFORM FOR LANGUAGE & COGNITIVE REHABILITATIONSwathi Kiran, Carrie Des Roches, Isabel Balachandran,
*Stephanie Keffer, Elsa Ascenso, *Anna KasdanSpeech and Hearing Sciences, Boston University
Department of Neurology, Massachusetts General Hospital
Funding from Wallace H. Coulter Foundation: BU-Coulter Translational Partnership Program

ASHA 2013 2
Disclosure-Swathi Kiran
Has significant financial Interest• Chief Scientist for Constant Therapy• Ownership stock in Constant Therapy

ASHA 2013 3
Other Authors: Carrie Des Roches, Isabel Balachandran, Elsa Ascenso- Nothing to disclose
Significant contributors- Stephanie Keffer, Anna Kasdan- Nothing to disclose
Disclosure
ASHA 2013 4
Introduction• About 795,000 Americans each year suffer a new or
recurrent stroke (NIDCD.gov). Also, about 1.7 million individuals suffer from traumatic brain injury each year (CDC.gov).
• Individuals with language and cognitive deficits following brain damage likely require long-term rehabilitation.
• Consequently, it is a huge practical problem to provide the continued communication therapy that these individuals require.
ASHA 2013 5
Using technology to improve treatment delivery
• Recent studies have examined the efficacy of rehabilitation techniques, such as videoconferencing, for individuals with hearing, stuttering and motor speech issues
• Other studies have provided aphasia therapy over the internet to individual patients
• More recently, there have several computerized brain-training software designed for normal adults.

ASHA 2013 6
What is the evidence behind using technology to deliver treatment?
• CogMed• A software targeted at improving working memory abilities in
individuals with brain injury (Johansson & Tornmalm M, 2012; Lundqvist et al. 2012). These studies found improvements in working memory skills on the trained CogMed software as well as on other working memory tasks and functional settings.
• . Posit Science• Barnes et al (2009) examined the effectiveness of the software
Posit Science in improving auditory processing speed in individuals with mild cognitive impairment (MCI).
• Although differences between the experimental and control group were not statistically significant, verbal learning and memory measures were higher in the experimental group than the control group.

ASHA 2013 7
What is the evidence behind using technology to deliver treatment? • Lumosity
• Finn and McDonald (2011) used Lumosity software to target attention, processing speed, visual memory in experimental and waitlisted controls. Results showed experimental participants improved on the training exercises more than the controls.
• There are other software programs- that function more like AAC- devices.
• Therefore, there an increased awareness and momentum for applying computer technology in the rehabilitation of aphasia
ASHA 2013 8
Rationale• Additionally, there is increased patient demand to transition
from traditional but outdated flashcard based therapy in order to keep up with the evolution of technology.
• Nonetheless, the burden of evidence for technology-based treatment applications is no different than traditional treatment approach for rehabilitation after brain damage
• Q1. Can we provide a technologically based rehabilitation program that meets the same benchmarks for clinical efficacy?
• Q2. How do we individualize treatment for patients with brain damage as no two patients are alike?

ASHA 2013 9
StudyQuestion: Does a structured therapy program that includes homework practice delivered through an IPAD result in significant gains in overall communication?
Goal: Compare patients who receive a structured IPAD delivered therapy program that is practiced up to 7 days a week with patients who receive standard one-on-one individualized therapy that is provided 1 or 2 days per week by a therapist.

ASHA 2013 10
Study• Because of the flexibility that ipads provide to patients and
the accessibility to free/paid apps that provide variable levels of exercises, it is important to standardize the nature and form of treatment that is provided to patients using ipads.
• Since patients have access to ipads at home, it provides a unique opportunity to examine the extent of compliance when patients are provided with a homework regimen

ASHA 2013 11
Participants
Experiment (N = 40) Control (N= 9)
Ave Age 63 years (SD = 11) 68 years (SD = 10)
Ave Months post Onset 54 months (SD = 47) 98 months (SD = 132)
WAB – AQ (western aphasia battery)
68.5 (SD = 26.52) 68.1 (SD = 31.35)
CLQT Composite Severity (cognitive linguistic quick test)
64% (SD = 25) 54% (SD = 28)
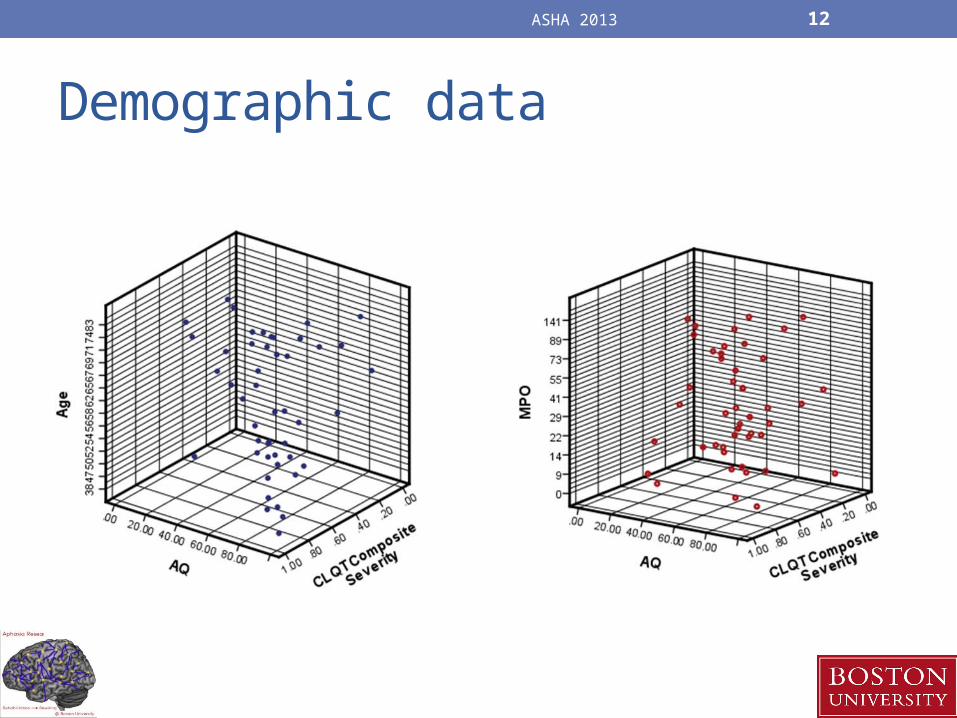
ASHA 2013 12
Demographic data

ASHA 2013 13
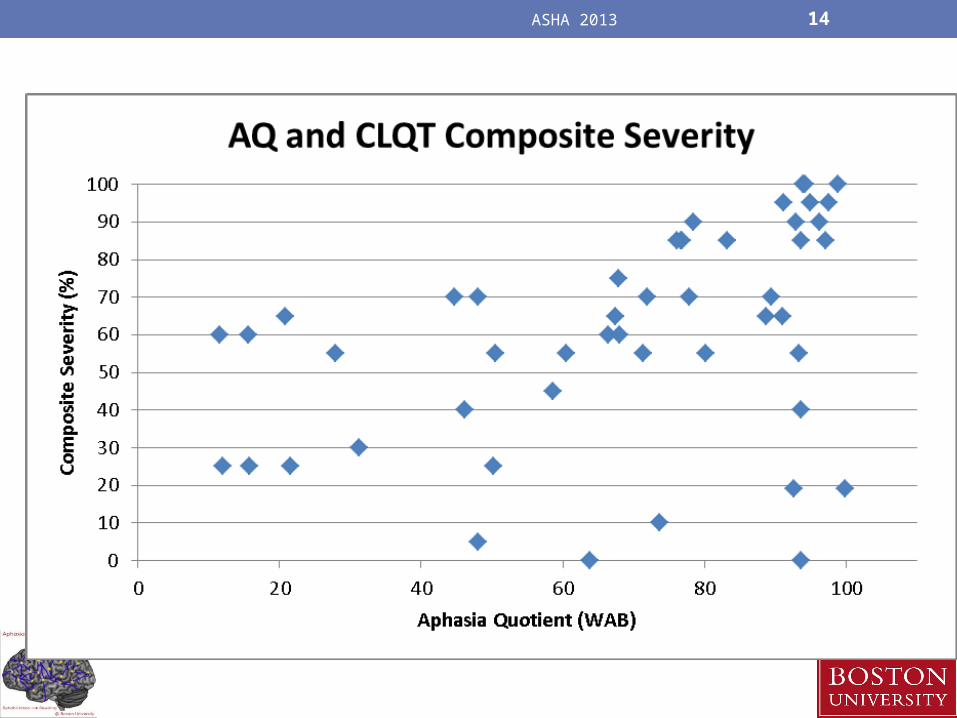
ASHA 2013 14

ASHA 2013 15
Experimental Design
Pre-Tx Assessment
Pre-Tx Assessment
Post -TxAssessment
Weeks
Post -TxAssessment
EXPERIMENTAL PATIENTS (N = 40)
CONTROL PATIENTS (N = 10)

ASHA 2013 16

ASHA 2013 17
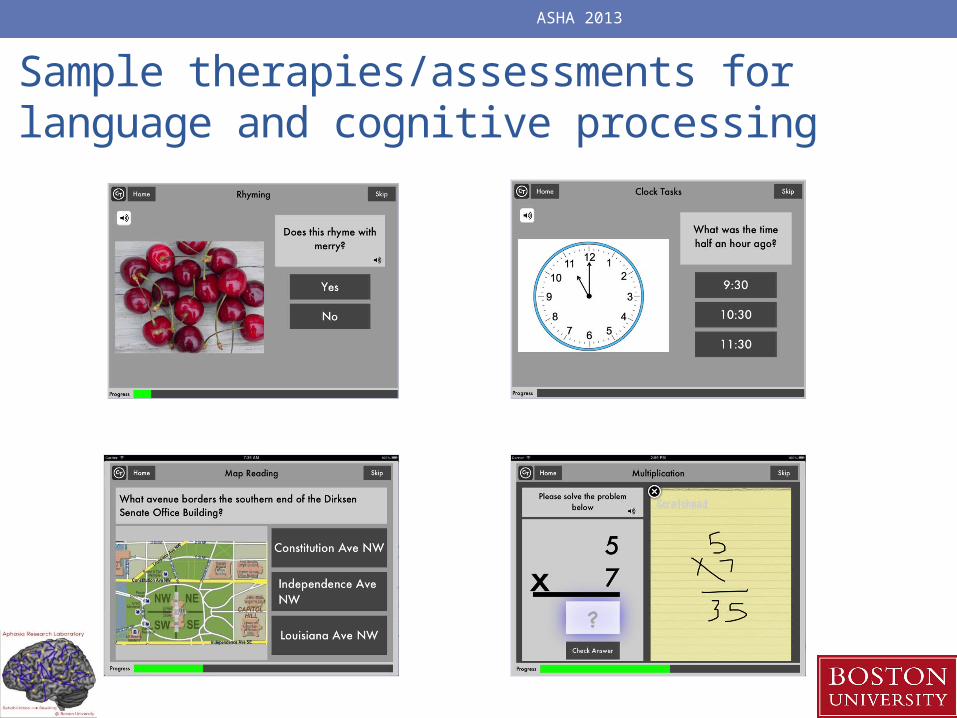
Sample therapies/assessments for language and cognitive processing
ASHA 2013

ASHA 2013 19
Structure of the tasks- Language

ASHA 2013 20
Structure of the tasks- Cognitive

ASHA 2013 21

ASHA 2013 22
Individualized therapy assignment based on initial performance

ASHA 2013 23
Reading Passages (Level 3)
Picture Ordering Tasks (5 items)Map Tasks (10 items, Level 2)
Syllable Identification (10 items)Picture Spelling (Level 3)
Word Identification
Word Copy (10 items)
Category Matching
Sound Identification (10 items)
Clock Tasks (10 items)
Week1 Week2 Week3 Week4 Week5 Week6 Week 7 Week 8 Week 9 Week 10Picture Spelling (Level 2)
Addition (Level 3)
Addition (Level 4)
Addition (Level 4)
Addition (Level 4)
Addition (Level 5)
Syllable Identification
Syllable Identification
Syllable Identification
Multiplication (Level 4)
Reading Passage (Level 2)
Picture Spelling (Level 3)
Picture Spelling (Level 3)
Picture Spelling (Level 3)
Picture Spelling (Level 4)
Picture Spelling (Level 5)
Multiplication (Level 2)
Multiplication (Level 3)
Multiplication (Level 3)
Picture Ordering Tasks (Level 4, 10 items)
Word Ordering (Level 2)
Subtraction (Level 3, 5 items)
Subtraction (Level 3)
Subtraction (Level 3)
Subtraction (Level 4)
Subtraction (Level 5)
Picture Ordering Tasks
Picture Ordering Tasks (Level 2)
Picture Ordering Tasks (Level 3) Division (Level 3)
Reading Passage (Level 3)
Reading Passage (Level 3)
Reading Passage (Level 3)
Syllable Identification
Syllable Identification Division
Division (Level 2)
Clock Math (Level 2)
Word Ordering (Level 3)
Word Ordering (Level 3)
Word Ordering (Level 3)
Multiplication (10 items)
Multiplication (Level 2, 5 items)
Word Matching (10 items)
Map Tasks (Level 2)
Map Tasks (Level 3)
Map Tasks (Level 3)
Word Ordering Task (Level 4)
Word Ordering Task (Level 5)
# 29 during week 6 homework # 25 during week 4 homework
# 44 for all 10 weeks
ASHA 2013 24
Based on WAB, CLQT

ASHA 2013 25
Low Language profile- Low cognitive profile
High Language profile- low cognitive profile
Low language profile- high cognitive profile
High language profile- high cognitive profile
86 year old male 75 year old male 77 year old male 56 year old male
• category matching• feature matching• picture naming • rhyming• sound
identification• word identification• sound to letter
matching • word copy • picture matching• symbol
cancellation
• picture spelling• naming picture• clock reading • instruction
sequencing• picture ordering • sound matching• symbol matching• voicemail
• category identification
• category matching • feature matching• letter to sound
matching • reading passage• sound
identification• sound to letter
matching • word copy• word spelling• word ordering
• category matching• feature matching• letter to sound
matching • sound to letter
matching • map reading• picture spelling• reading passage• rhyming • Sound• identification• syllable
identification• word spelling• word problems

ASHA 2013 26
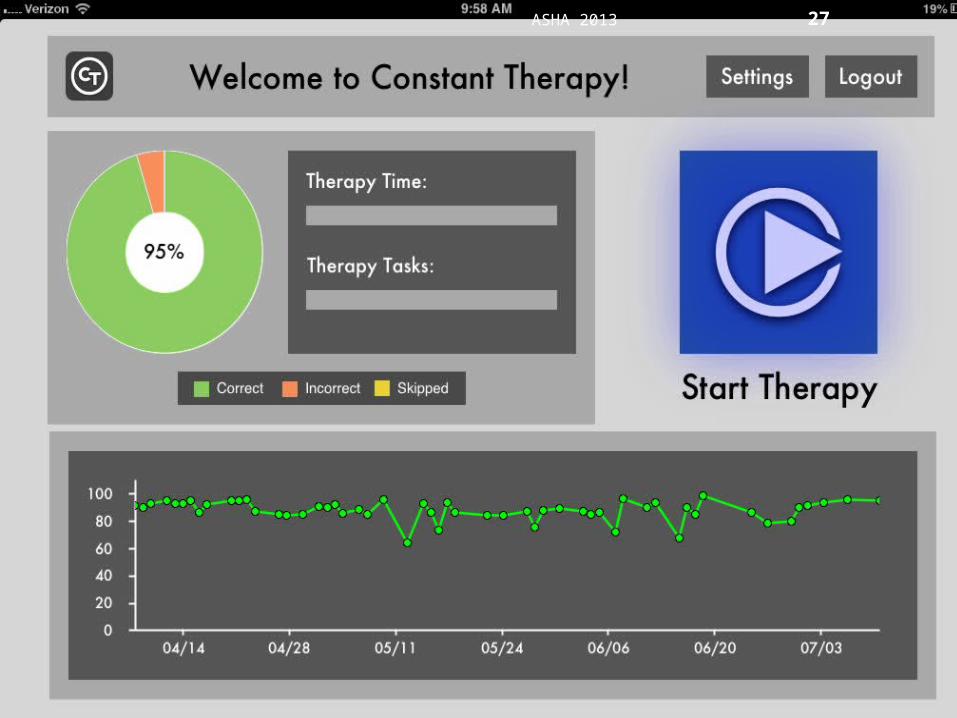
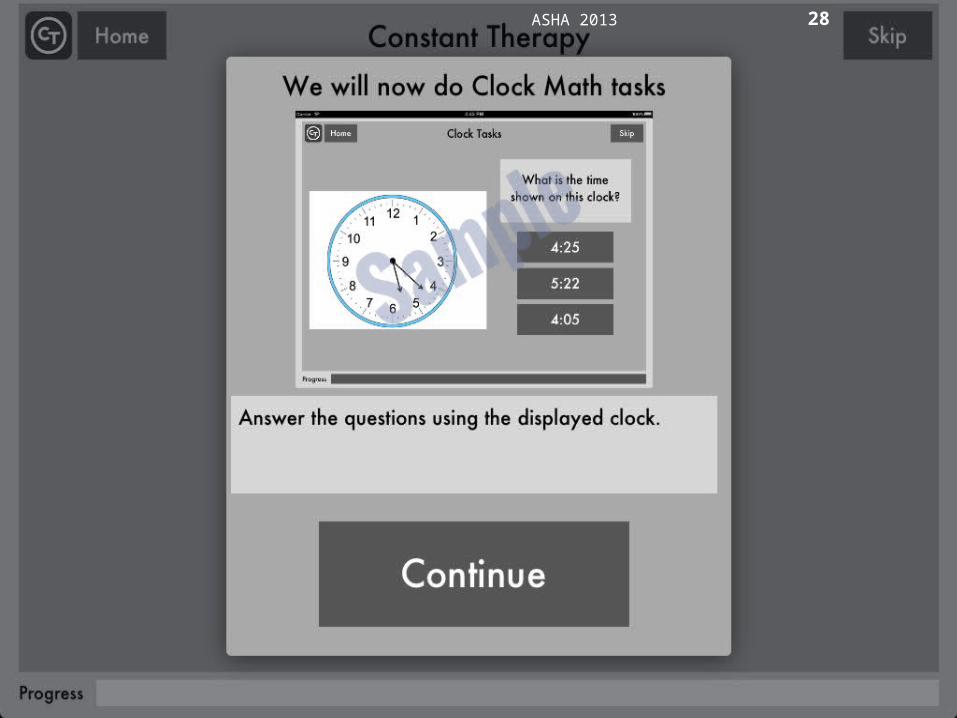
ASHA 2013 27
Carrie/• Please insert snapshots of the patient dashboard- that
shows start therapy, we will now do…
ASHA 2013 28
ASHA 2013 29
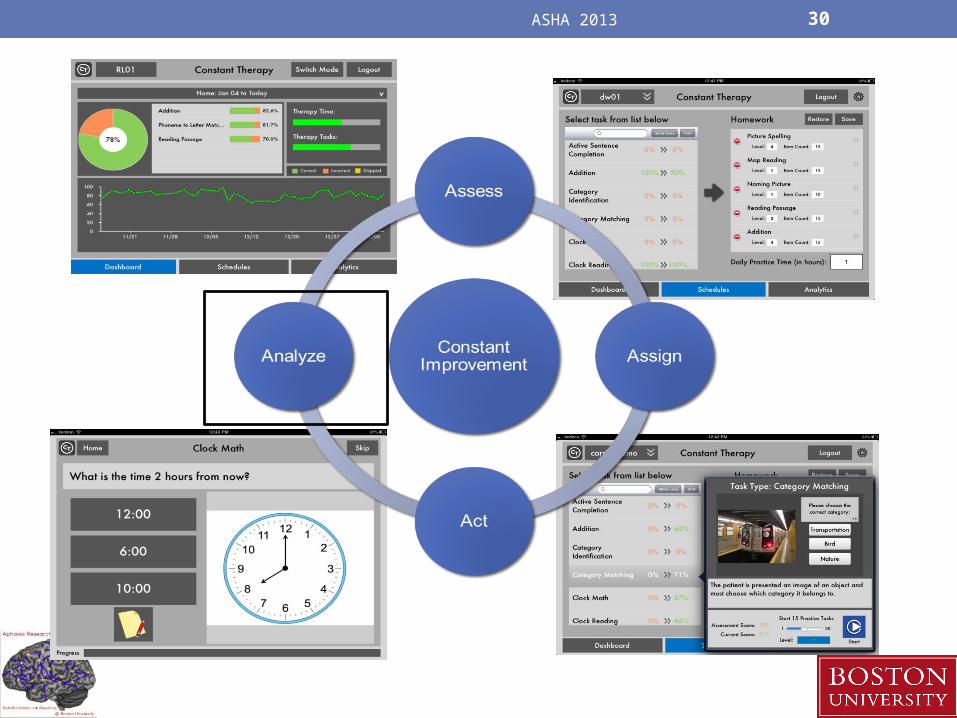
Methods• During the weekly clinic sessions, the clinician would
decide to continue the participant on the same task or to modify the treatment plan based on his/her performance.
• If the participant achieved 95% or higher accuracy two times in succession,• The clinician would either progress the next level of difficulty (e.g.,
Addition Level 1 to Addition Level 2) • Would progress to a different task (e.g., assign category
identification after category matching).
• If participants performed at low accuracies or no change over several sessions, that therapy task was replaced with another task from the task list.
ASHA 2013 30

ASHA 2013 31
Overview of data analysis1. Total therapy duration in weeks
2. Compliance- weekly log in times
3. Individual patient level analysis1. Analyze by week
2. Analyze by task
3. Analyze by item
4. Overall patient performance over time
5. Patient performance over time relative to population mean
6. Group level analysis: Analysis of tasks by patients
7. Group level analysis: Analysis of task by items, co-factors
8. Changes on standardized measures

ASHA 2013 32
The average therapy period for controls was 12.964 weeks Average therapy period for experimental patients was 12.567 weeks
1 2 3 4 5 6 70
2
4
6
8
10
12
14
16
18
Weeks of iPad therapy: experimental vs. control
Controls (n=7)
Experimental (n=36)
Patient
Th
erap
y T
ime
(wee
ks)
1. Total therapy duration in weeks

ASHA 2013 33
2. Compliance- Rates of log in to therapy
1/14/13
1/25/13
2/5/13
2/16/13
2/27/13
3/10/13
3/21/13
4/1/13
4/12/13
4/23/13
5/4/13
5/15/13
5/26/13
6/6/13
6/17/13
6/28/13
7/9/13
0
1
2
3
4
5
6
Control patients Experimental patients
ASHA 2013 34
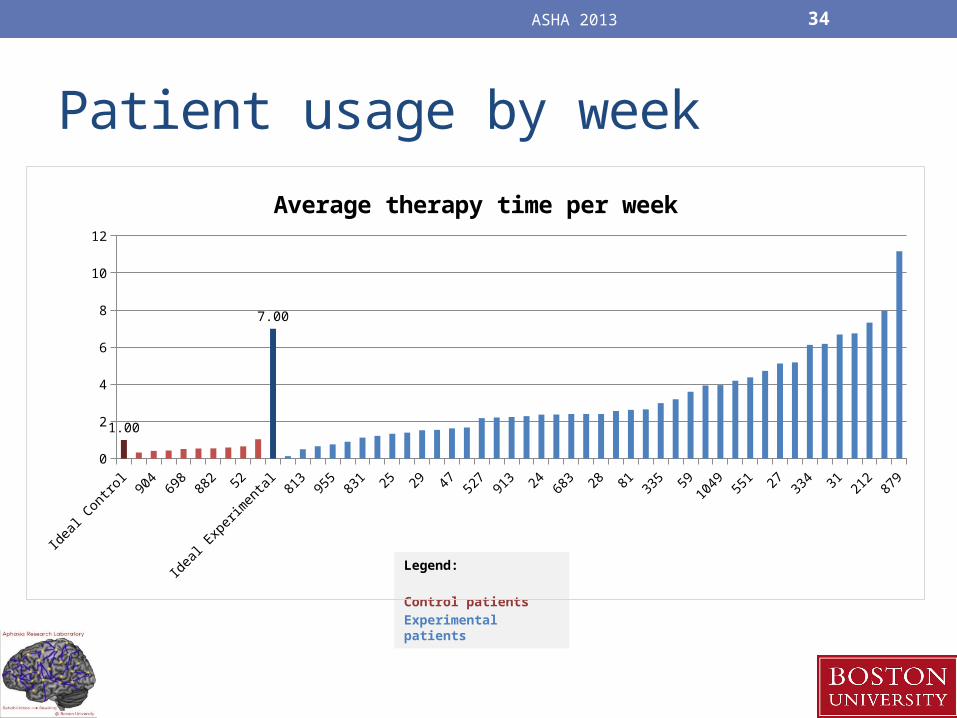
Patient usage by week
Legend:
Control patients
Experimental patients
Idea
l Con
trol
904
698
882 52
Idea
l Exp
erim
enta
l81
395
583
1 25 29 47 527
913 24 68
3 28 81 335 59
1049 55
1 27 334 31 21
287
90
2
4
6
8
10
12
1.00
7.00
Average therapy time per week

ASHA 2013 35
3. Individual patient level analysis: By week
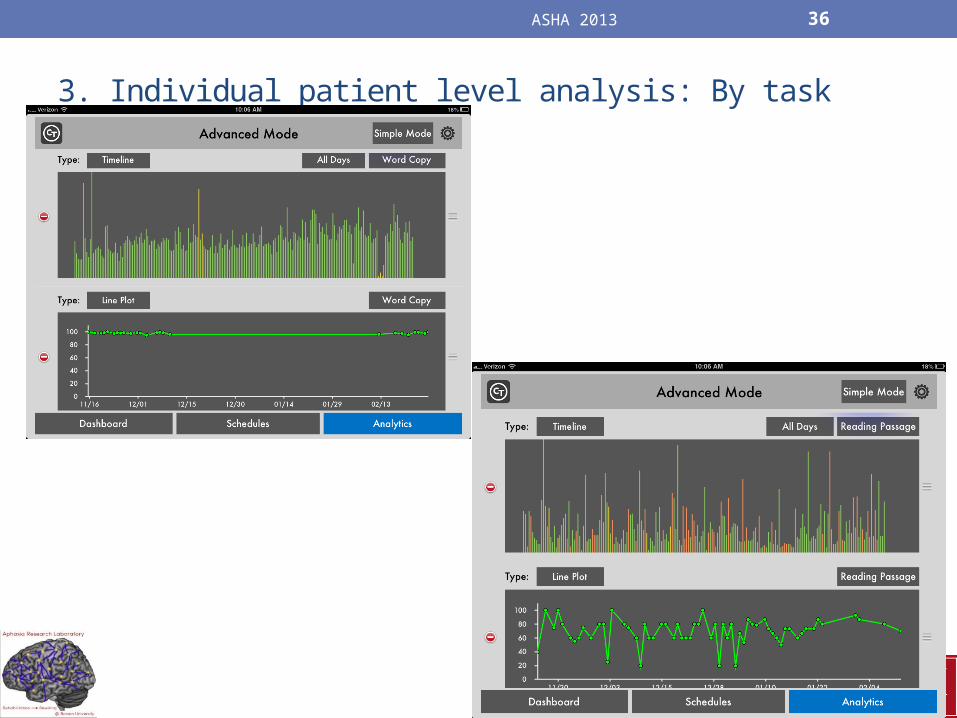
ASHA 2013 36
3. Individual patient level analysis: By task
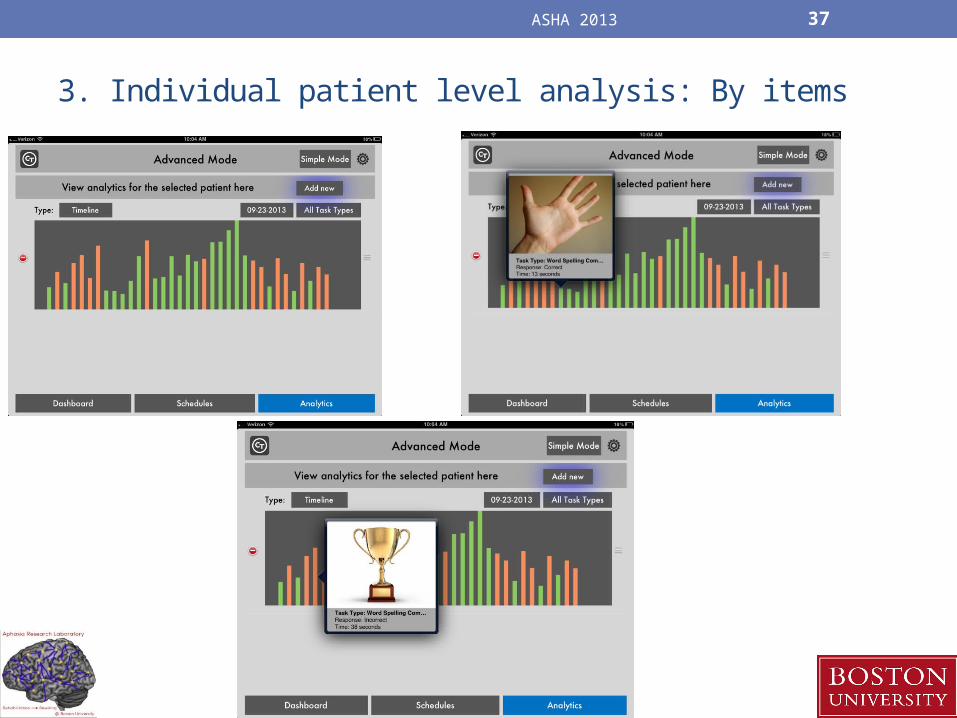
ASHA 2013 37
3. Individual patient level analysis: By items
ASHA 2013 38
0
0.1
0.2
0.3
0.4
0.5
0.6
0.7
0.8
0.9
1
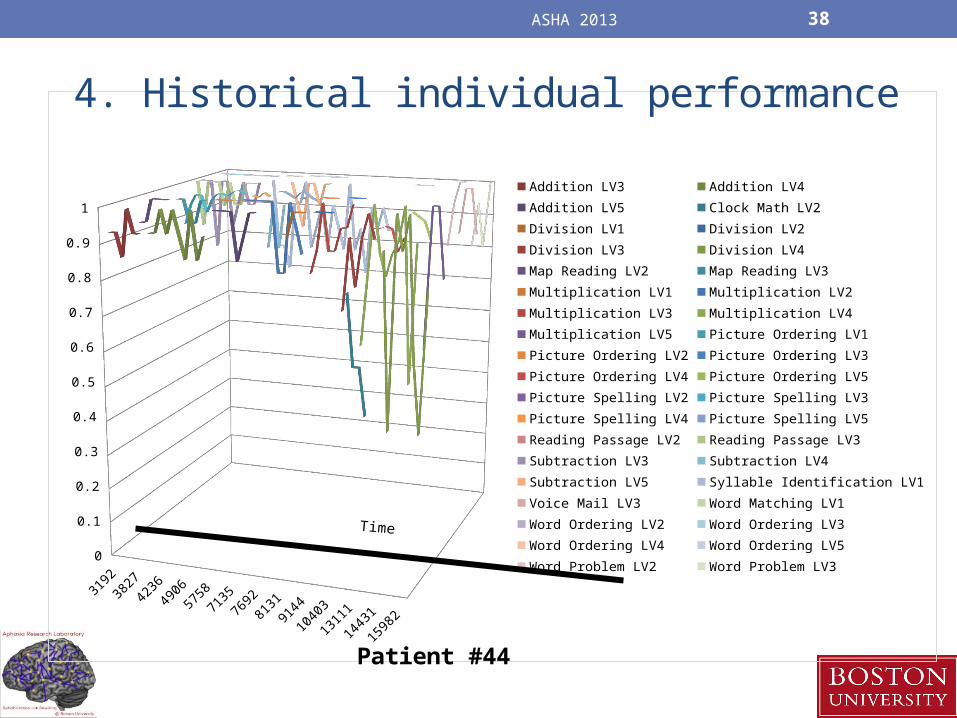
Patient #44
Addition LV3 Addition LV4
Addition LV5 Clock Math LV2
Division LV1 Division LV2
Division LV3 Division LV4
Map Reading LV2 Map Reading LV3
Multiplication LV1 Multiplication LV2
Multiplication LV3 Multiplication LV4
Multiplication LV5 Picture Ordering LV1
Picture Ordering LV2 Picture Ordering LV3
Picture Ordering LV4 Picture Ordering LV5
Picture Spelling LV2 Picture Spelling LV3
Picture Spelling LV4 Picture Spelling LV5
Reading Passage LV2 Reading Passage LV3
Subtraction LV3 Subtraction LV4
Subtraction LV5 Syllable Identification LV1
Voice Mail LV3 Word Matching LV1
Word Ordering LV2 Word Ordering LV3
Word Ordering LV4 Word Ordering LV5
Word Problem LV2 Word Problem LV3
4. Historical individual performance

ASHA 2013 39
Time
0
0.1
0.2
0.3
0.4
0.5
0.6
0.7
0.8
0.9
1
Patient #913
Addition LV4Clock Math LV2Clock Math LV3Division LV1Division LV2Long Reading Comprehension LV3Map Reading LV1Map Reading LV2Map Reading LV3Multiplication LV1Multiplication LV2Multiplication LV3Multiplication LV4Naming Picture LV1Picture Matching LV2Picture Matching LV3Picture Matching LV4Picture Ordering LV1Picture Ordering LV2Picture Ordering LV3Picture Ordering LV4Picture Ordering LV5Picture Spelling LV4Picture Spelling LV5Reading Passage LV3Rhyming LV1Subtraction LV2Subtraction LV3Subtraction LV4Word Problem LV1Word Problem LV2
4. Historical individual performance

ASHA 2013 40
5. Patient performance over time relative to population mean
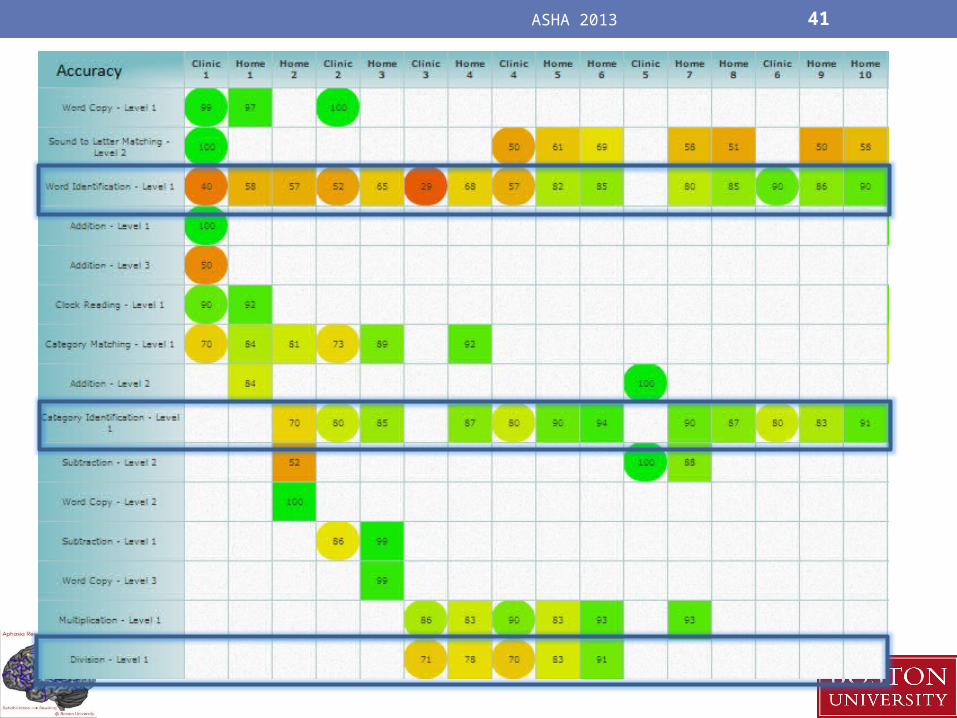
ASHA 2013 41
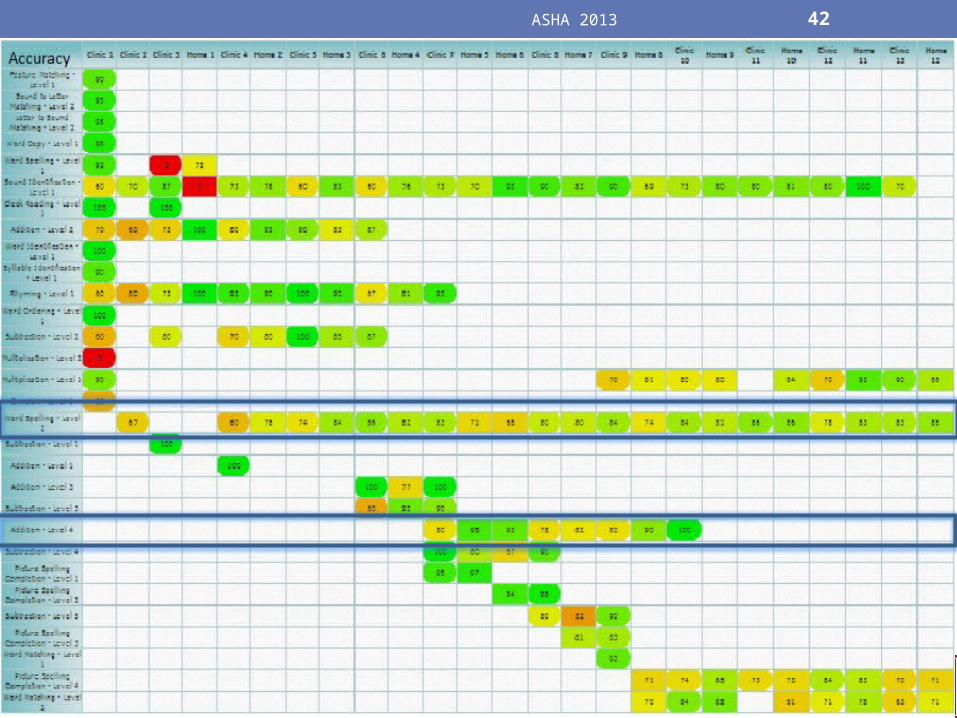
ASHA 2013 42

ASHA 2013 43
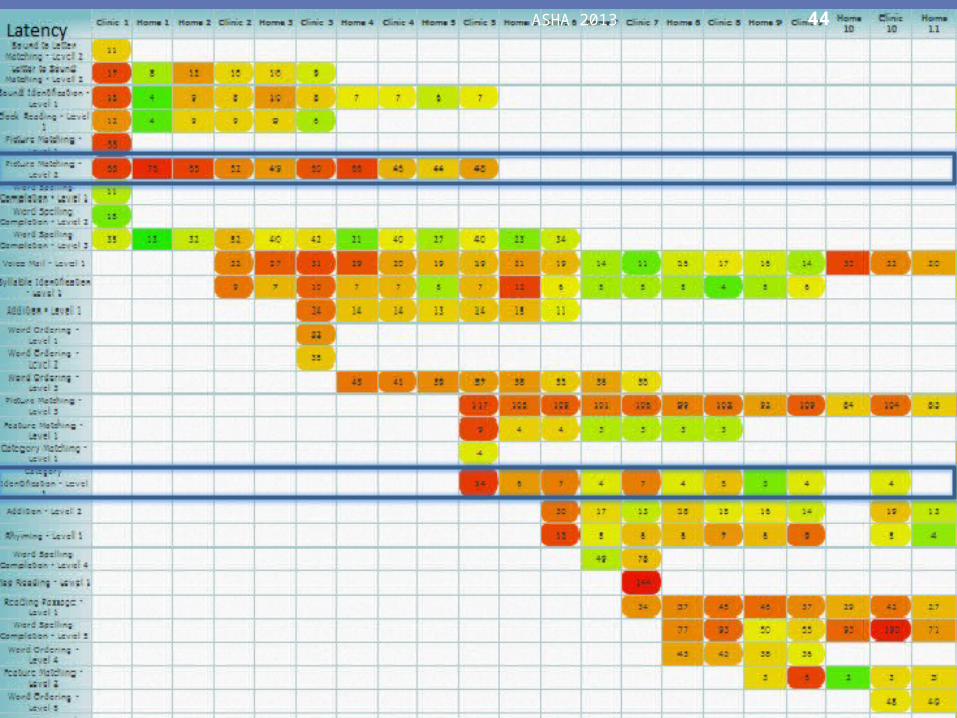
ASHA 2013 44

6. Group level analysis: Analysis of tasks by patients- Individual Analysis Quantifying Change
1 2 3 4 5 6 7 8 9 10 11 12 13 14 15 16 17 18 19 20 210
0.2
0.4
0.6
0.8
1
1.2
0
2
4
6
8
10
12
14
f(x) = 0.00497816883116883 x + 0.778570619047619R² = 0.0466686384257462
f(x) = − 0.236876103896104 x + 8.66886380952381R² = 0.476925453249178
Rhyming
Accuracy
Linear (Accuracy)
Latency
Linear (Latency)

Individual analysis: Quantifying Change
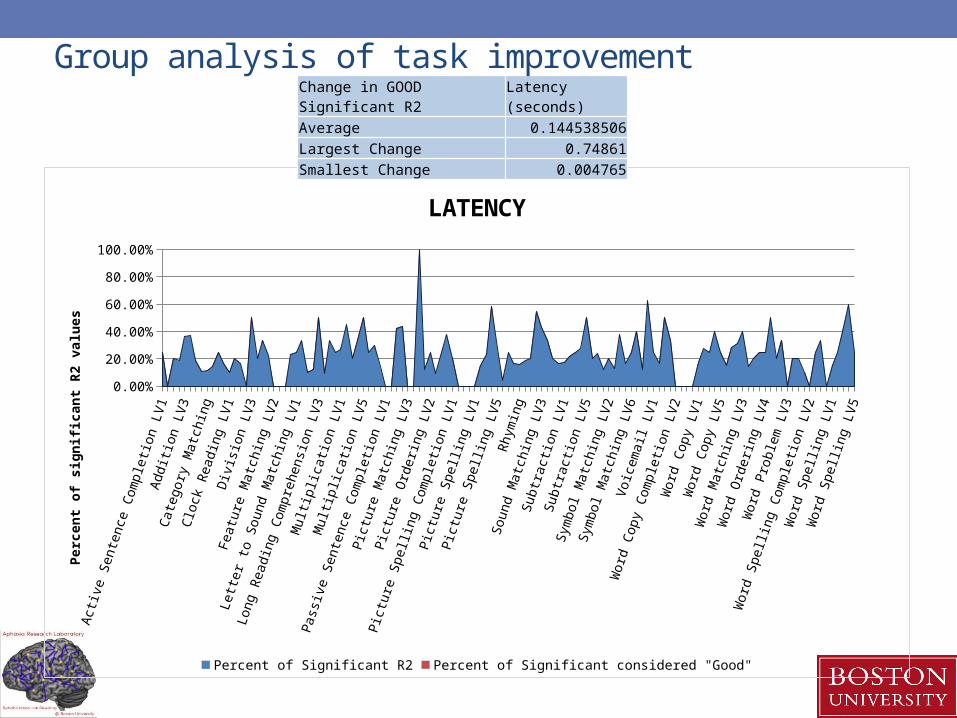
• With tasks that had an R2 value of above 0.25, the average of the first two sessions was subtracted from the average of the last two sessions
• Then each of those values was determined to be a “good” or a “bad” change• A “good” change in accuracy was any value above 0• A “good” change in latency was any value below 0

ASHA 2013 47
Individual subject analysis by task Low Language profile- Low cognitive profile
High Language profile- low cognitive profile
Low language profile- high cognitive profileHigh language profile- high cognitive profile

ASHA 2013 48
Group analysis of task improvementAverage % Significant (Overall) 19.63%% of 19.63% considered to be "Good" 79.62%
Act
ive
Sen
tenc
e C
ompl
etio
n LV
1A
dditi
on L
V2
Add
ition
LV
5C
lock
Mat
h LV
1C
lock
Rea
ding
LV
1D
ivis
ion
LV2
Div
isio
n LV
5F
eatu
re M
atch
ing
LV3
Lett
er t
o S
ound
Mat
chin
g LV
1Lo
ng R
eadi
ng C
ompr
ehen
sion
LV
2M
ap R
eadi
ng L
V2
Mul
tiplic
atio
n LV
2M
ultip
licat
ion
LV5
Nam
ing
Pic
ture
LV
3P
ictu
re M
atch
ing
LV1
Pic
ture
Mat
chin
g LV
4P
ictu
re O
rder
ing
LV2
Pic
ture
Ord
erin
g LV
5P
ictu
re S
pelli
ng C
ompl
etio
n LV
3P
ictu
re S
pelli
ng L
V2
Pic
ture
Spe
lling
LV
5R
eadi
ng P
assa
ge L
V3
Sou
nd M
atch
ing
LV1
Sou
nd M
atch
ing
LV4
Sub
trac
tion
LV1
Sub
trac
tion
LV4
Sym
bol M
atch
ing
LV1
Sym
bol M
atch
ing
LV3
Sym
bol M
atch
ing
LV6
Sym
bol M
atch
ing
LV9
Voi
cem
ail L
V3
Wor
d C
opy
Com
plet
ion
LV3
Wor
d C
opy
LV1
Wor
d C
opy
LV4
Wor
d M
atch
ing
LV1
Wor
d O
rder
ing
LV1
Wor
d O
rder
ing
LV4
Wor
d P
robl
em L
V2
Wor
d P
robl
em L
V5
Wor
d S
pelli
ng C
ompl
etio
n LV
3W
ord
Spe
lling
LV
1W
ord
Spe
lling
LV
4
0.00%10.00%20.00%30.00%40.00%50.00%60.00%70.00%80.00%90.00%
100.00%
Percent of patients with significant R2 values by task for accuracy and latency
Percent of Significant R2 Percent of Significant considered "Good"
Act
ive
Sen
tenc
e C
ompl
etio
n LV
1A
dditi
on L
V2
Add
ition
LV
5C
lock
Mat
h LV
1C
lock
Rea
ding
LV
1D
ivis
ion
LV2
Div
isio
n LV
5
Fea
ture
Mat
chin
g LV
3
Lett
er t
o S
ound
Mat
chin
g LV
1
Long
Rea
ding
Com
preh
ensi
on L
V2
Map
Rea
ding
LV
2M
ultip
licat
ion
LV2
Mul
tiplic
atio
n LV
5N
amin
g P
ictu
re L
V3
Pic
ture
Mat
chin
g LV
1
Pic
ture
Mat
chin
g LV
4
Pic
ture
Ord
erin
g LV
2
Pic
ture
Ord
erin
g LV
5
Pic
ture
Spe
lling
Com
plet
ion
LV3
Pic
ture
Spe
lling
LV
2
Pic
ture
Spe
lling
LV
5
Rea
ding
Pas
sage
LV
3
Sou
nd M
atch
ing
LV1
Sou
nd M
atch
ing
LV4
Sub
trac
tion
LV1
Sub
trac
tion
LV4
Sym
bol M
atch
ing
LV1
Sym
bol M
atch
ing
LV3
Sym
bol M
atch
ing
LV6
Sym
bol M
atch
ing
LV9
Voi
cem
ail L
V3
Wor
d C
opy
Com
plet
ion
LV3
Wor
d C
opy
LV1
Wor
d C
opy
LV4
Wor
d M
atch
ing
LV1
Wor
d O
rder
ing
LV1
Wor
d O
rder
ing
LV4
Wor
d P
robl
em L
V2
Wor
d P
robl
em L
V5
Wor
d S
pelli
ng C
ompl
etio
n LV
3W
ord
Spe
lling
LV
1W
ord
Spe
lling
LV
4
0.00%
10.00%
20.00%
30.00%
40.00%
50.00%
60.00%
70.00%
80.00%
90.00%
100.00%
ACCURACY
Percent of Significant R2 Percent of Significant considered "Good"
Per
cen
t o
f si
gn
ific
ant
R2
valu
e
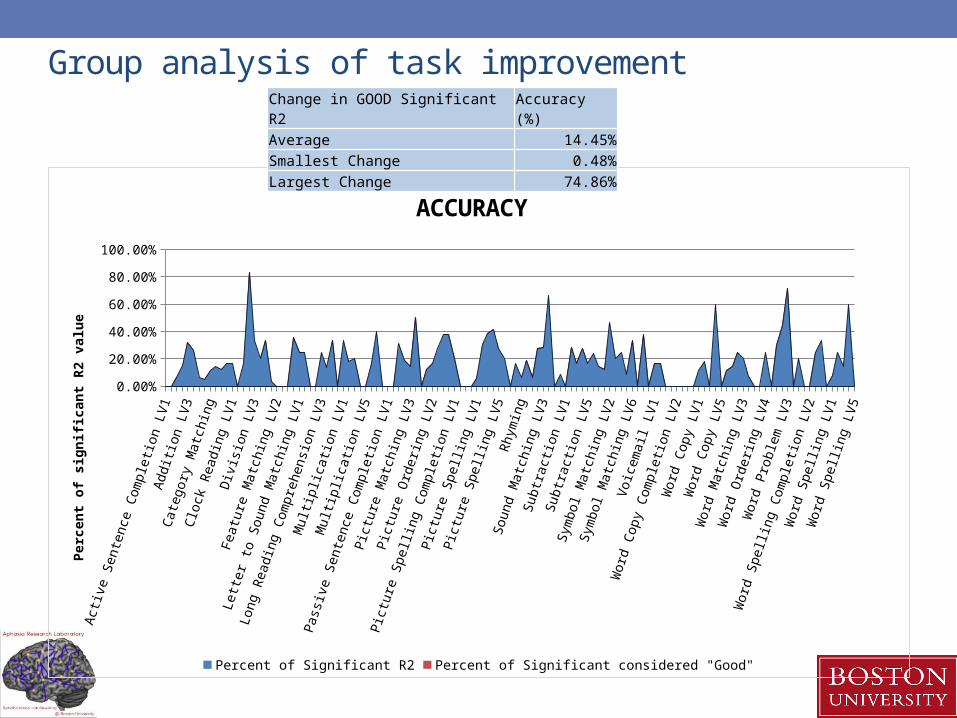
Change in GOOD Significant R2 Accuracy (%)Average 14.45%Smallest Change 0.48%Largest Change 74.86%
Group analysis of task improvement
Act
ive
Sen
tenc
e C
ompl
etio
n LV
1A
dditi
on L
V2
Add
ition
LV
5C
lock
Mat
h LV
1C
lock
Rea
ding
LV
1D
ivis
ion
LV2
Div
isio
n LV
5
Fea
ture
Mat
chin
g LV
3
Lett
er t
o S
ound
Mat
chin
g LV
1
Long
Rea
ding
Com
preh
ensi
on L
V2
Map
Rea
ding
LV
2M
ultip
licat
ion
LV2
Mul
tiplic
atio
n LV
5N
amin
g P
ictu
re L
V3
Pic
ture
Mat
chin
g LV
1
Pic
ture
Mat
chin
g LV
4
Pic
ture
Ord
erin
g LV
2
Pic
ture
Ord
erin
g LV
5
Pic
ture
Spe
lling
Com
plet
ion
LV3
Pic
ture
Spe
lling
LV
2
Pic
ture
Spe
lling
LV
5
Rea
ding
Pas
sage
LV
3
Sou
nd M
atch
ing
LV1
Sou
nd M
atch
ing
LV4
Sub
trac
tion
LV1
Sub
trac
tion
LV4
Sym
bol M
atch
ing
LV1
Sym
bol M
atch
ing
LV3
Sym
bol M
atch
ing
LV6
Sym
bol M
atch
ing
LV9
Voi
cem
ail L
V3
Wor
d C
opy
Com
plet
ion
LV3
Wor
d C
opy
LV1
Wor
d C
opy
LV4
Wor
d M
atch
ing
LV1
Wor
d O
rder
ing
LV1
Wor
d O
rder
ing
LV4
Wor
d P
robl
em L
V2
Wor
d P
robl
em L
V5
Wor
d S
pelli
ng C
ompl
etio
n LV
3W
ord
Spe
lling
LV
1W
ord
Spe
lling
LV
4
0.00%
10.00%
20.00%
30.00%
40.00%
50.00%
60.00%
70.00%
80.00%
90.00%
100.00%
LATENCY
Percent of Significant R2 Percent of Significant considered "Good"
Per
cen
t o
f si
gn
ific
ant
R2
valu
esChange in GOOD Significant R2 Latency (seconds)Average 0.144538506Largest Change 0.74861Smallest Change 0.004765
Group analysis of task improvement

ASHA 2013 52
7. Group level analysis- co-factors
• Mixed regression models for each treatment task
• For e.g., for word identification
Overall effect of treatment is significant
Estimates for Accuracy Label Estimate SE DF t value Pr > |t|Conditional improvement 0.01961 0.0091 294 2.15 0.0325
Effect of WABAQ on improvement
-0.00066 0.0001 294 -4.88 <.0001
Effect of Composite Severity on improvement
0.01820 0.0137 294 1.32 0.1874
Task Accuracy LatencyEstimate p value Estimate P value
Category Identification -0.00633 0.5397 0.1135 0.569Category Matching -0.00019 0.9641 -0.05835 0.2064Feature Matching 0.02356 0.0034 -0.1878 0.0109Letter to sound matching Level 2 0.01018 0.294 -0.5329 0.0002Rhyming 0.01521 0.0032 -0.0223 0.6982Word spelling completion LV 1 0.01456 0.0187 -0.09176 0.3882Word Identification 0.01961 0.0325 0.1173 0.0183Addition Level 1 0.122 0.3455 -5.9979 0.0847Addition LV2 -0.05748 0.0307 2.8665 0.0093Addition LV3 -0.1141 0.1456 1.6905 0.1655Addition LV4 -0.1361 0.1438 -3.1877 0.0719Addition LV5 0.02881 0.1826 0.1198 0.8927Clock Reading Level 1 0.000816 0.9405 -0.4324 0.0016Clock Math Lv 2 -0.03675 0.9272 33.3335 0.0458Clock Math LV3 0.01032 0.9718Division LV1 0.05175 0.6368 -0.7804 0.7296Division LV4 0.48 0.9587 618.69 0.3172Instruction sequencing 0.03433 0.6964 4.6205 0.0971Map Reading LV1 0.2592 0.0014 0.09436 0.9073Map Reading LV2 -0.1268 0.1432 16.2842<.0001

ASHA 2013 53
7. Can treatment outcome be predicted for each patient?
Solution for Random Effects
PatientId Estimate Std Err Pred DF t Value Pr > |t|23 -0.07216 0.2081 589 -0.35 0.728924 -0.5612 0.1757 589 -3.19 0.0015 903 0.4057 0.2544 589 1.59 0.1113913 0.3272 0.3258 589 1.00 0.3157955 0.08395 0.2471 589 0.34 0.7342978 1.0518 0.2442 589 4.31 <.00011049 -0.9511 0.1953 589 -4.87 <.00011079 -0.02336 0.2463 589 -0.09 0.92451091 -0.3460 0.2881 589 -1.20 0.23031339 0.4617 0.2044 589 2.26 0.0243
This patient show significantly less
improvement than the average improvement
This patient show significantly more improvement than
the average improvement

ASHA 2013 54
8. Mean Changes on standardized test performance
LQ CQ AQ
Attent
ion
Mem
ory
Execu
tive
Funct
ions
Lang
uage
Visuos
patia
l Skil
ls
Compo
site
Sever
ity
Clock
Drawing BNT
-4
-2
0
2
4
6
8
10
12
14
Changes in standardized testing scores: experiemtnal vs. control
Average Control Change (n=9)Average TX Change (n=40)
Ave
rag
e C
han
ge
in S
core
(P
ost
-Pre
)
WAB CLQT BNT
ASHA 2013 55
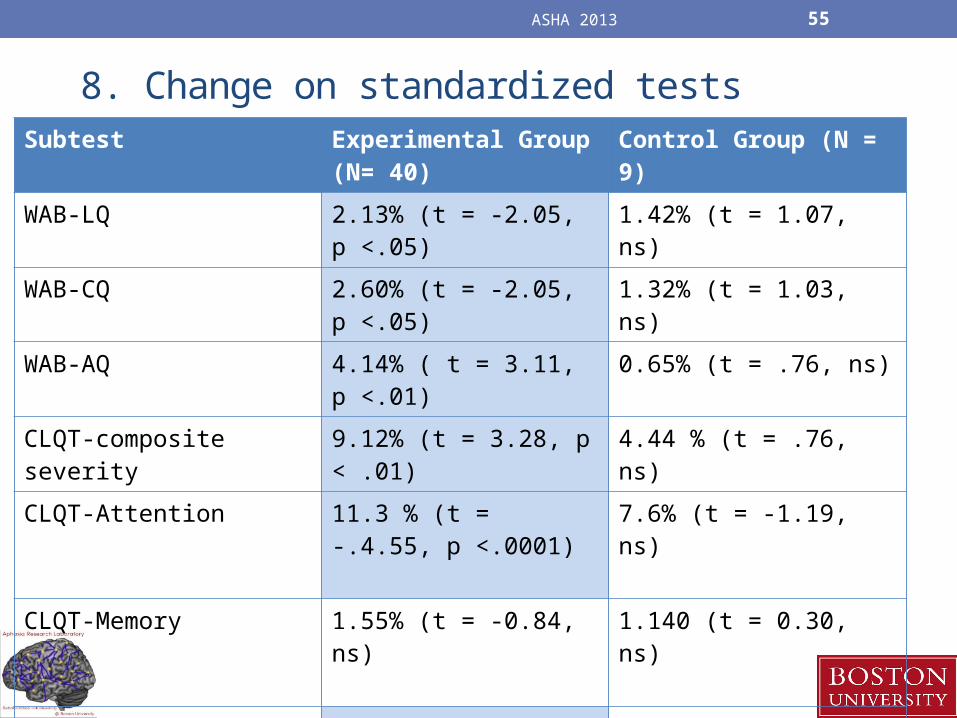
8. Change on standardized testsSubtest Experimental Group
(N= 40)Control Group (N = 9)
WAB-LQ 2.13% (t = -2.05, p <.05) 1.42% (t = 1.07, ns)
WAB-CQ 2.60% (t = -2.05, p <.05) 1.32% (t = 1.03, ns)
WAB-AQ 4.14% ( t = 3.11, p <.01) 0.65% (t = .76, ns)
CLQT-composite severity 9.12% (t = 3.28, p < .01) 4.44 % (t = .76, ns)
CLQT-Attention 11.3 % (t = -.4.55, p <.0001)
7.6% (t = -1.19, ns)
CLQT-Memory 1.55% (t = -0.84, ns) 1.140 (t = 0.30, ns)
CLQT-Executive Function 6.41% (t = 3.15, p < .01) 1.66 (t = 0.52, ns)
CLQT- Language 1.42% (t = 1.15, ns) 1.65 (t = 1.26, ns)
CLQT- Visuospatial skills 7.81 (t = 3.43, p < .001) 2.96 (t = 0.61, ns)

ASHA 2013 56
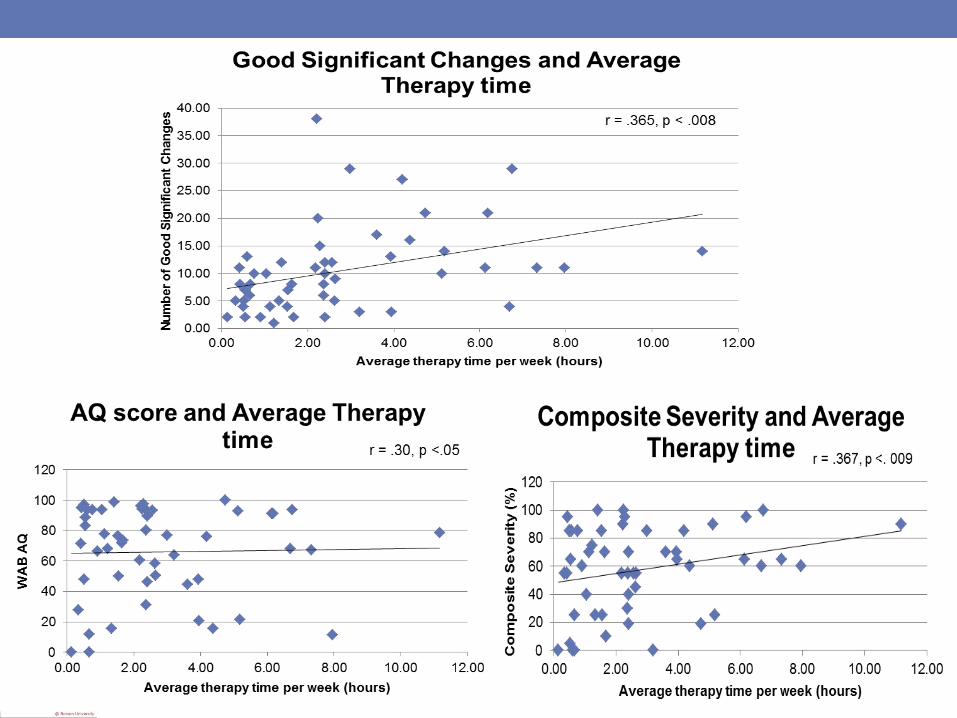
Summary of results• Experimental and control patients completed 11 weeks of
treatment• Patient compliance was high-ranged from 1 time/week to 11
times/week• Patients who logged in more often showed more changes on
tasks assigned• Individual patient analysis by items, task, weekly- gives
insight into how patients perform• Changes in accuracy and latency are across tasks • Changes seen on standardized tests for experimental
patients, less for control patients

ASHA 2013 57
THANK YOU ! Questions?

ASHA 2013 58
References• Barnes D, Yaffe K, Belfor N, Jagust W, DeCarli C, Reed B, Kramer J.
Computer-Based Cognitive Training for Mild Cognitive Impairment: Results from a Pilot Randomized, Controlled Trial. Alzheimer Disease and Associated Disorders 2009; 23(3), 205-210.
• Finn M, McDonald S. Computerised cognitive training for older persons with mild cognitive impairment: A pilot study using a randomised controlled trial design. Brain Impairment 2011; 12(3), 187–199.
• Johansson B, Tornmalm M. Working memory training for patients with acquired brain injury: Effects in daily life. Scandanavian Journal of Occupational Therapy 2012; 19(2), 176-83. doi:10.3109/11038128.2011.603352.
• Lundqvist A, Grundström K, Samuelsson K, Rönnberg J Computerized training of working memory in a group of patients suffering from acquired brain injury. Brain Injury 2010; 24, 1173-1183. doi:10.3109/02699052.2010.498007