validating the ace model for evaluating student performance … · 1 programa de pós-graduação...
TRANSCRIPT
Informatics in Education, 2014, Vol. 13, No. 1, 73–85 © 2014 Vilnius University
73
Validating the ACE Model for Evaluating Student Performance Using a Teaching-Learning Process Based on Computational Modeling Systems
Alexandre Neves LOUZADA1, Marcos da Fonseca ELIA2, Fábio Ferrentini SAMPAIO2, Andre Luiz Pestana VIDAL3
1 Programa de Pós-Graduação em Informática, Federal University of Rio de Janeiro Fundação de Apoio à Escola Técnica do Estado do Rio de Janeiro Universidade do Grande Rio Rio de Janeiro, Brazil2 Instituto Tércio Pacitti de Aplicações e Pesquisas Computacionais, Federal University of Rio de Janeiro (NCE/UFRJ) Programa de Pós-Graduação em Informática, Federal University of Rio de Janeiro Rio de Janeiro, Brazil3 Fundação de Apoio à Escola Técnica do Estado do Rio de Janeiro Rio de Janeiro, Brazile-mail: [email protected], {melia, ffs}@nce.ufrj.br, [email protected]
Received: May 2013
Abstract. The aim of this work is to adapt and test, in a Brazilian public school, the ACE model proposed by Borkulo for evaluating student performance as a teaching-learning process based on computational modeling systems. The ACE model is based on different types of reasoning involv-ing three dimensions. In addition to adapting the model and introducing innovative methodologi-cal procedures and instruments for collecting and analyzing data, our main results showed that the ACE model is superior than written tests for discriminating students on the top and bottom of the scale of scientific reasoning abilities, while both instruments are equivalent for evaluating students in the middle of the scale.
Keywords: secondary education, simulations, evaluation methodologies, teaching/learning strate-gies, improving classroom teaching.
1. Introduction
Different researchers in Brazil and throughout the world have shown the importance of using computer modeling environments in education (Oliveira, 2010; Borkulo, 2009; de Jong and van Joolingen, 2007). These environments allow the construction of a model and the observation of its behavior by simulating its operation.
A.N. Louzada, M.F. Elia, F.F. Sampaio, A.L.P. Vidal74
These characteristics of computational modeling systems are useful to help students to develop abilities such as presenting hypothesis, accepting or refuting arguments, un-derstanding natural processes, and making qualitative and quantitative evaluations. The importance of these abilities can be exemplified in science teaching, where students frequently use them to understand real-world phenomena.
However, for such environments to be utilized to their potential it is necessary to take into account factors such as the proper way to use them as well as the evaluation of results, in the sense that the use of a modeling environment has to be associated with strategies that not only encourage but also consistently evaluate the learning process.
Based on these considerations, this paper aims to apply an evaluation model devel-oped by Borkulo (2009) specifically for the didactic use of dynamic modeling and then try to answer the question of “how to validate an evaluation process based on computa-tional modeling in an institutionalized learning environment?”
2. Literature Review
The use of computer models and simulations in education has been the focus of different researchers since the emergence of the first microcomputers in the late 1960s (Papert, 1980; Riley, 2002). Different curricular proposals in countries known for their tradi-tion in research and science education, such as England (Nuffield National Curriculum, 2010) and the USA (NSF, 2010; STEM, 2008), have given special attention to the inclu-sion of these tools in teaching.
Different approaches related to the cognitive and technological aspects of modeling in education have been tested in different scenarios with students of different back-grounds. For instance, the work of van Joolingen and Ton de Jong at the University of Twente (Rutten et al., 2012; Bravo et al., 2009; van Joolingen et al., 2007) explores the System Dynamics approach (Forrester, 1968) and computer modeling tools such as Co-Lab (van Joolingen et al., 2005) to investigate different aspects of cognitive change with students taking science classes. Uri Wilensky and his research group from Northwestern University use a different computer modeling approach called Agent Based Modelling (Bonabeau, 2002) and NetLogo (Wilensky, 1999) to research and develop pedagogi-cal material for science environments (Trouille et al., 2013, Levy and Wilensky, 2011; Gobert et al., 2011).
Teaching-learning processes based on modeling require different procedures and in-struments to assess students’ performance. However, there is insufficient literature re-garding this subject, especially in developing countries where these procedures are still based on the measurement paradigm (Guba and Lincoln, 1989).
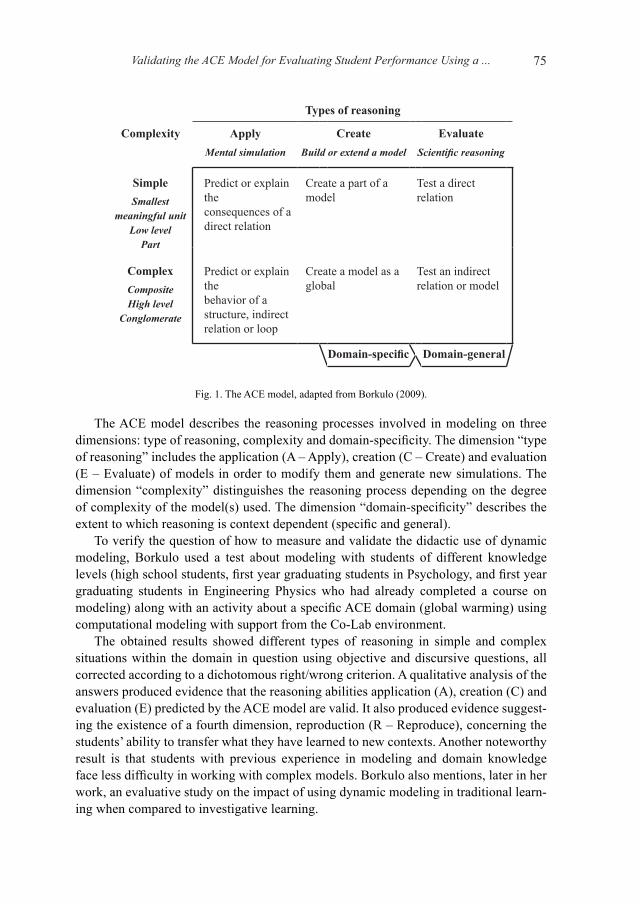
One interesting example we found in the literature regarding the learning results that can be obtained through computational modeling came from Borkulo (2009). She made a bibliographic review of the reasoning processes involved in computational modeling and she proposed, developed and tested the “ACE” model (Fig. 1) as part of her doctor-ate research.
Validating the ACE Model for Evaluating Student Performance Using a ... 75
The ACE model describes the reasoning processes involved in modeling on three dimensions: type of reasoning, complexity and domain-specificity. The dimension “type of reasoning” includes the application (A – Apply), creation (C – Create) and evaluation (E – Evaluate) of models in order to modify them and generate new simulations. The dimension “complexity” distinguishes the reasoning process depending on the degree of complexity of the model(s) used. The dimension “domain-specificity” describes the extent to which reasoning is context dependent (specific and general).
To verify the question of how to measure and validate the didactic use of dynamic modeling, Borkulo used a test about modeling with students of different knowledge levels (high school students, first year graduating students in Psychology, and first year graduating students in Engineering Physics who had already completed a course on modeling) along with an activity about a specific ACE domain (global warming) using computational modeling with support from the Co-Lab environment.
The obtained results showed different types of reasoning in simple and complex situations within the domain in question using objective and discursive questions, all corrected according to a dichotomous right/wrong criterion. A qualitative analysis of the answers produced evidence that the reasoning abilities application (A), creation (C) and evaluation (E) predicted by the ACE model are valid. It also produced evidence suggest-ing the existence of a fourth dimension, reproduction (R – Reproduce), concerning the students’ ability to transfer what they have learned to new contexts. Another noteworthy result is that students with previous experience in modeling and domain knowledge face less difficulty in working with complex models. Borkulo also mentions, later in her work, an evaluative study on the impact of using dynamic modeling in traditional learn-ing when compared to investigative learning.
Types of reasoning
Complexity Apply Create EvaluateMental simulation Build or extend a model Scientific reasoning
SimpleSmallest
meaningful unitLow level
Part
Predict or explain theconsequences of adirect relation
Create a part of amodel
Test a direct relation
ComplexCompositeHigh level
Conglomerate
Predict or explain thebehavior of astructure, indirectrelation or loop
Create a model as a global
Test an indirectrelation or model
Domain-specific Domain-general
Fig. 1. The ACE model, adapted from Borkulo (2009).
A.N. Louzada, M.F. Elia, F.F. Sampaio, A.L.P. Vidal76
3. Research Methodology
3.1. Aims
The primary aim of this research is to reproduce Borkulo’s work, described in section 2, in terms of using computational modeling in teaching-learning environments and evaluat-ing the ACE model for assessing student performance. However, some adaptations were necessary to adjust it to the reality of Brazilian schools.
The second aim is to compare the ACE model with traditional written test results us-ing as a true criterion the changes observed, along the school year, in students’ scientific misconceptions to conceptions regarding the course subject (temperature and heat) (Yeo and Zadnik, 2001).
3.2. Design
Our experimental design involves all 151 students in the second grade of a senior high school (public) studying Thermal Physics, allowing us to compare the ACE evaluation model with the traditional instruments of evaluation. It is worth noting that the experi-mental situation originally proposed by Borkulo (2009) is quite different, since for her field of experimental research she used samples of students attending different school levels, which forced her to use the item response theory (IRT), among other procedures, to make comparisons.
A proposal involving an entire institution does not allow the use of random sam-ples or control groups. Thus, our study was organized as a quasi-experimental design (Stanley and Campbell, 1966) using a model known in the literature as “a single case ABAB” (Kazdin, 1982), which consists of alternately applying (situation A) and not-applying (situation B) a new experimental situation with the same group of students, creating an experimental sequence ABAB. In the present study, experimental situa-tions A and B each lasts approximately 4 weeks, where situation A uses computational modeling as a teaching resource while situation B uses resources that have been tradi-tionally used by the school. Furthermore, the course began with the traditional didactic situation (B).
3.3. Testing
The evaluation system of the school in this study provides six evaluations in the form of written tests (P1, P2, P3, P4, P5 and P6), always applied after completion of the content syllabus for the 4-week schedule of the experimental situation (A or B), creating a se-quence of “BP1AP2BP3AP4BP5AP6” for the school year.
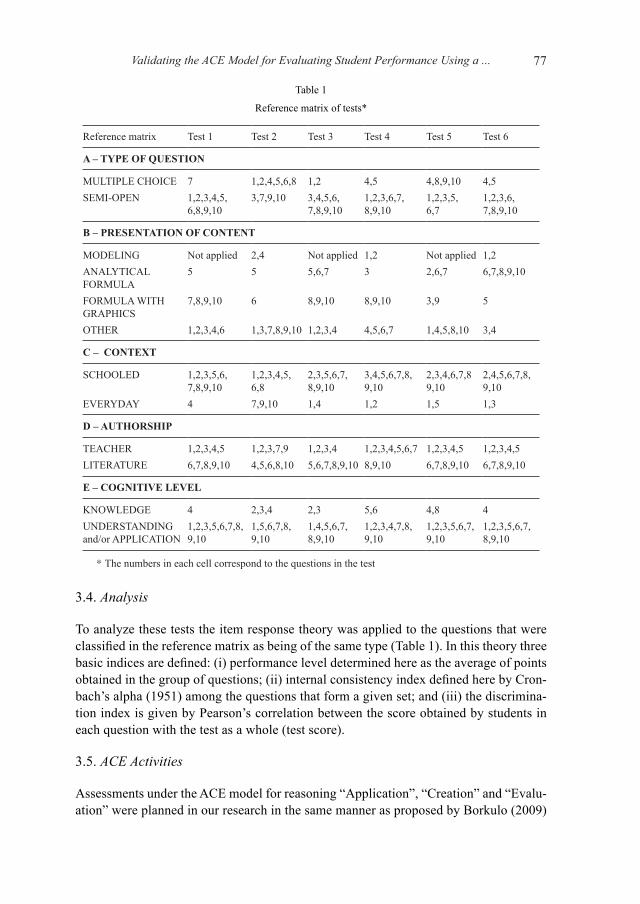
These written tests were prepared by external researchers and classroom teachers acting as participant researchers. All six tests were planned according to the same refer-ence matrix (Table 1) in order to allow for comparisons.
Validating the ACE Model for Evaluating Student Performance Using a ... 77
3.4. Analysis
To analyze these tests the item response theory was applied to the questions that were classified in the reference matrix as being of the same type (Table 1). In this theory three basic indices are defined: (i) performance level determined here as the average of points obtained in the group of questions; (ii) internal consistency index defined here by Cron-bach’s alpha (1951) among the questions that form a given set; and (iii) the discrimina-tion index is given by Pearson’s correlation between the score obtained by students in each question with the test as a whole (test score).
3.5. ACE Activities
Assessments under the ACE model for reasoning “Application”, “Creation” and “Evalu-ation” were planned in our research in the same manner as proposed by Borkulo (2009)
Table 1
Reference matrix of tests*
Reference matrix Test 1 Test 2 Test 3 Test 4 Test 5 Test 6
A – TYPE OF QUESTION
MULTIPLE CHOICE 7 1,2,4,5,6,8 1,2 4,5 4,8,9,10 4,5SEMI-OPEN 1,2,3,4,5,
6,8,9,103,7,9,10 3,4,5,6,
7,8,9,101,2,3,6,7, 8,9,10
1,2,3,5, 6,7
1,2,3,6, 7,8,9,10
B – PRESENTATION OF CONTENT
MODELING Not applied 2,4 Not applied 1,2 Not applied 1,2ANALYTICAL FORMULA
5 5 5,6,7 3 2,6,7 6,7,8,9,10
FORMULA WITH GRAPHICS
7,8,9,10 6 8,9,10 8,9,10 3,9 5
OTHER 1,2,3,4,6 1,3,7,8,9,10 1,2,3,4 4,5,6,7 1,4,5,8,10 3,4
C – CONTEXT
SCHOOLED 1,2,3,5,6, 7,8,9,10
1,2,3,4,5, 6,8
2,3,5,6,7, 8,9,10
3,4,5,6,7,8, 9,10
2,3,4,6,7,8 9,10
2,4,5,6,7,8, 9,10
EVERYDAY 4 7,9,10 1,4 1,2 1,5 1,3
D – AUTHORSHIP
TEACHER 1,2,3,4,5 1,2,3,7,9 1,2,3,4 1,2,3,4,5,6,7 1,2,3,4,5 1,2,3,4,5LITERATURE 6,7,8,9,10 4,5,6,8,10 5,6,7,8,9,10 8,9,10 6,7,8,9,10 6,7,8,9,10
E – COGNITIVE LEVEL
KNOWLEDGE 4 2,3,4 2,3 5,6 4,8 4UNDERSTANDING and/or APPLICATION
1,2,3,5,6,7,8, 9,10
1,5,6,7,8, 9,10
1,4,5,6,7, 8,9,10
1,2,3,4,7,8, 9,10
1,2,3,5,6,7, 9,10
1,2,3,5,6,7, 8,9,10
* The numbers in each cell correspond to the questions in the test
A.N. Louzada, M.F. Elia, F.F. Sampaio, A.L.P. Vidal78
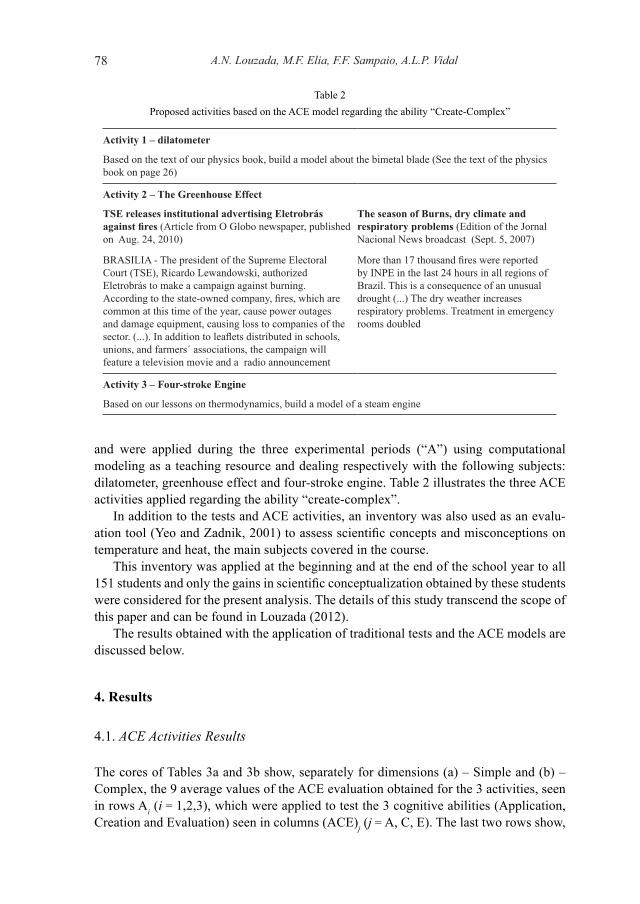
and were applied during the three experimental periods (“A”) using computational modeling as a teaching resource and dealing respectively with the following subjects: dilatometer, greenhouse effect and four-stroke engine. Table 2 illustrates the three ACE activities applied regarding the ability “create-complex”.
In addition to the tests and ACE activities, an inventory was also used as an evalu-ation tool (Yeo and Zadnik, 2001) to assess scientific concepts and misconceptions on temperature and heat, the main subjects covered in the course.
This inventory was applied at the beginning and at the end of the school year to all 151 students and only the gains in scientific conceptualization obtained by these students were considered for the present analysis. The details of this study transcend the scope of this paper and can be found in Louzada (2012).
The results obtained with the application of traditional tests and the ACE models are discussed below.
4. Results
4.1. ACE Activities Results
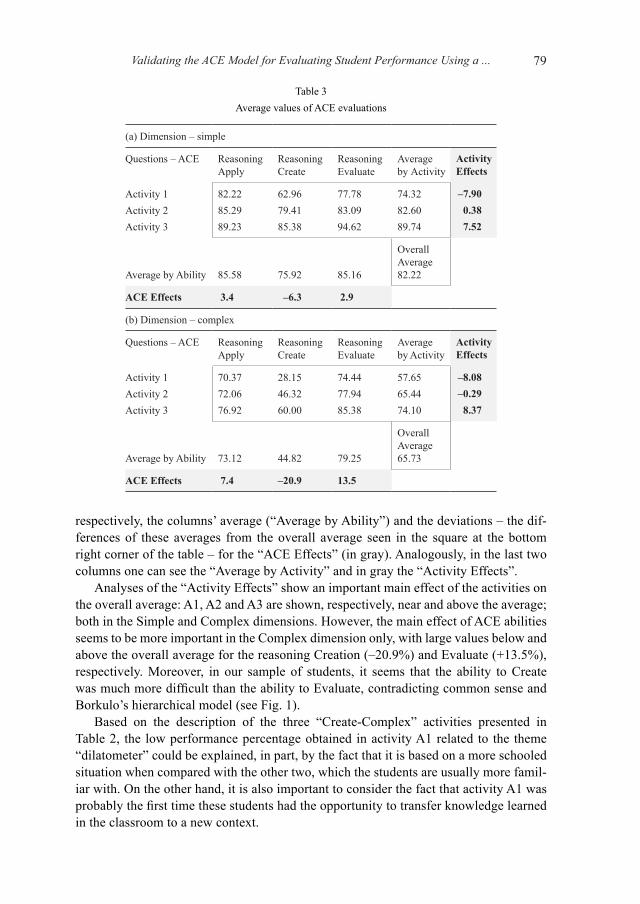
The cores of Tables 3a and 3b show, separately for dimensions (a) – Simple and (b) – Complex, the 9 average values of the ACE evaluation obtained for the 3 activities, seen in rows Ai (i = 1,2,3), which were applied to test the 3 cognitive abilities (Application, Creation and Evaluation) seen in columns (ACE)j (j = A, C, E). The last two rows show,
Table 2Proposed activities based on the ACE model regarding the ability “Create-Complex”
Activity 1 – dilatometer
Based on the text of our physics book, build a model about the bimetal blade (See the text of the physics book on page 26)
Activity 2 – The Greenhouse Effect
TSE releases institutional advertising Eletrobrás against fires (Article from O Globo newspaper, published on Aug. 24, 2010)
BRASILIA - The president of the Supreme Electoral Court (TSE), Ricardo Lewandowski, authorized Eletrobrás to make a campaign against burning. According to the state-owned company, fires, which are common at this time of the year, cause power outages and damage equipment, causing loss to companies of the sector. (...). In addition to leaflets distributed in schools, unions, and farmers´ associations, the campaign will feature a television movie and a radio announcement
The season of Burns, dry climate and respiratory problems (Edition of the Jornal Nacional News broadcast (Sept. 5, 2007)
More than 17 thousand fires were reported by INPE in the last 24 hours in all regions of Brazil. This is a consequence of an unusual drought (...) The dry weather increases respiratory problems. Treatment in emergency rooms doubled
Activity 3 – Four-stroke Engine
Based on our lessons on thermodynamics, build a model of a steam engine
Validating the ACE Model for Evaluating Student Performance Using a ... 79
respectively, the columns’ average (“Average by Ability”) and the deviations – the dif-ferences of these averages from the overall average seen in the square at the bottom right corner of the table – for the “ACE Effects” (in gray). Analogously, in the last two columns one can see the “Average by Activity” and in gray the “Activity Effects”.
Analyses of the “Activity Effects” show an important main effect of the activities on the overall average: A1, A2 and A3 are shown, respectively, near and above the average; both in the Simple and Complex dimensions. However, the main effect of ACE abilities seems to be more important in the Complex dimension only, with large values below and above the overall average for the reasoning Creation (–20.9%) and Evaluate (+13.5%), respectively. Moreover, in our sample of students, it seems that the ability to Create was much more difficult than the ability to Evaluate, contradicting common sense and Borkulo’s hierarchical model (see Fig. 1).
Based on the description of the three “Create-Complex” activities presented in Table 2, the low performance percentage obtained in activity A1 related to the theme “dilatometer” could be explained, in part, by the fact that it is based on a more schooled situation when compared with the other two, which the students are usually more famil-iar with. On the other hand, it is also important to consider the fact that activity A1 was probably the first time these students had the opportunity to transfer knowledge learned in the classroom to a new context.
Table 3Average values of ACE evaluations
(a) Dimension – simple
Questions – ACE Reasoning Apply
Reasoning Create
Reasoning Evaluate
Average by Activity
Activity Effects
Activity 1 82.22 62.96 77.78 74.32 –7.90Activity 2 85.29 79.41 83.09 82.60 0.38Activity 3 89.23 85.38 94.62 89.74 7.52
Average by Ability
85.58
75.92
85.16
Overall Average82.22
ACE Effects 3.4 –6.3 2.9
(b) Dimension – complex
Questions – ACE Reasoning Apply
Reasoning Create
Reasoning Evaluate
Average by Activity
Activity Effects
Activity 1 70.37 28.15 74.44 57.65 –8.08Activity 2 72.06 46.32 77.94 65.44 –0.29Activity 3 76.92 60.00 85.38 74.10 8.37
Average by Ability
73.12
44.82
79.25
Overall Average 65.73
ACE Effects 7.4 –20.9 13.5
A.N. Louzada, M.F. Elia, F.F. Sampaio, A.L.P. Vidal80
4.2. Traditional Tests Results
When examining the reference matrix in Table 1 for the more frequently asked questions in the six tests, the following general profile is observed according to the five dimensions in the table: A – TYPE OF QUESTION (semi-open); B – PRESENTATION OF CON-TENT (Formulas with graphics and undefined type/“other”; C – CONTEXT (Schooled); D – AUTHORSHIP (prepared by the teacher or obtained from didactic books); E – COGNITIVE LEVEL (requiring the abilities of comprehension and application).
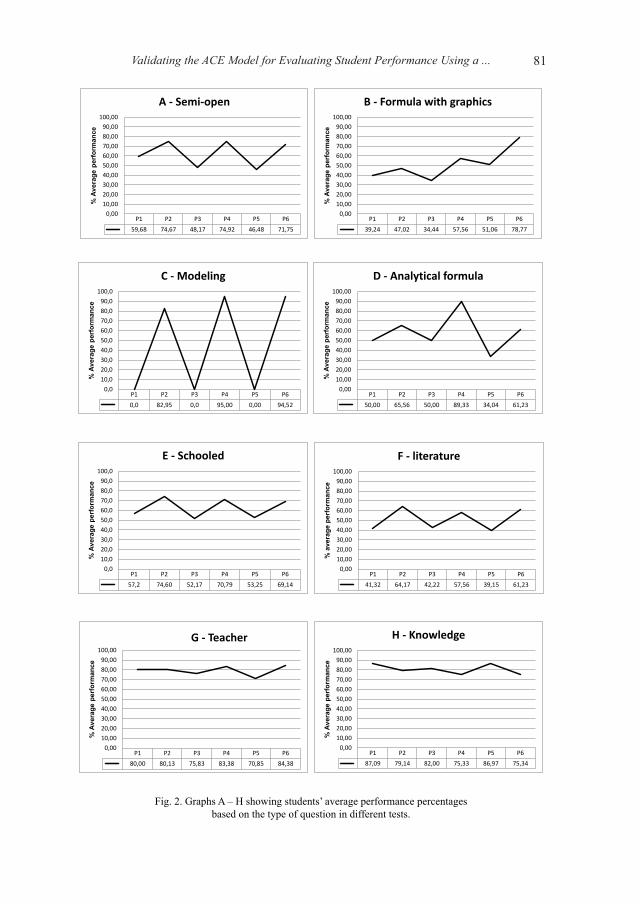
Fig. 2 shows, in tabular and graphical form, the relationship between the % average performance and the six tests applied in sequence “BP1AP2BP3AP4BP5AP6”, sepa-rated by some sets of questions obtained from the reference matrix in Table 1.
The figure also indicates that students’ performance, in general, was good in every test. However, these values oscillate, with the positive peak usually coinciding modeling in “a single case ABAB” teaching design (Kazdin, 1982).
Also noteworthy is how the eight graphs (A to H) in Fig. 2 indicate that some types of questions are more sensitive than others to changes in the teaching-learning method (A = ACE activities; B = Traditional teaching). This same pattern occurs with ques-tions involving modeling and those involving graphical representation, while some other types of questions fluctuate with no tendency, such as semi-open questions and those presented with formulas or even in a schooled context. There are other questions that do not oscillate, i.e., they are not sensitive to the change of method, as in the case of ques-tions involving knowledge or those prepared by the teacher.
These results suggest that, from the viewpoint of the average performance level of the six traditional tests applied, when taken separately, these tests were able to detect a change of teaching method between traditional and computational modeling; therefore, they could be taken as appropriate evaluation instruments for a learning situation fo-cused on computational modeling, if carefully planned, constructed and analyzed by the teachers, as in this research.
When taken together, the six tests did not reflect an adequate one-dimensional scale, since the internal consistency between them is very low, with a value for Cronbach’s alpha standardized at α = 0.53. Furthermore, each test shows a very low discrimination index considering all six tests as a whole. At the very least, this reflects how the com-mon practice of representing students’ performance, with one final grade calculated by averaging the tests taken during a school year, is unfair.
4.3. Tests × ACE: Comparative Analysis of Ability Gains in Scientific Concepts
The previous analysis involving the performance of students in traditional tests and in the ACE evaluation activities, respectively, showed that both instruments have the de-sired reliable technical and operational characteristics for an instrument to evaluate the performance of students studying thermal physics.
However, reliability measurements by themselves are not a sufficient condition to accept an evaluation instrument. The instrument must also be valid (i.e., it needs to evaluate what we want to be evaluated).
Validating the ACE Model for Evaluating Student Performance Using a ... 81
Fig. 2. Graphs A – H showing students’ average performance percentages based on the type of question in different tests.
A.N. Louzada, M.F. Elia, F.F. Sampaio, A.L.P. Vidal82
Specifically, the validation criterion in the present work is to verify the research hypothesis of whether the ACE evaluation model proposed by Borkulo (2009) is more appropriate than traditional written tests to evaluate the performance of students in a class that uses computational modeling.
First, this hypothesis was indirectly tested in the present study assuming that the learn-ing of scientific concepts is a criterion of truth. Second, by comparing the gains occurred, during the school year, in the students’ learning of scientific concepts using the measures of performance obtained through traditional tests and the ACE model, respectively.
In order to accomplish this objective, the relative gain GScC% in scientific conceptual-ization over the school year was defined as the difference between the result of the post-test (PosT) and pre-test (PreT) inventory applied to students, as described in Louzada et. al. (2011), in relation to pre-test results, expressing this value as a percentage:
Then, the values of the gain GScC% were divided into two groups: lower (L) and up-per (U); using three different cut points (40%, 60% and 80%) to determine whether any association would depend on the level of gain.
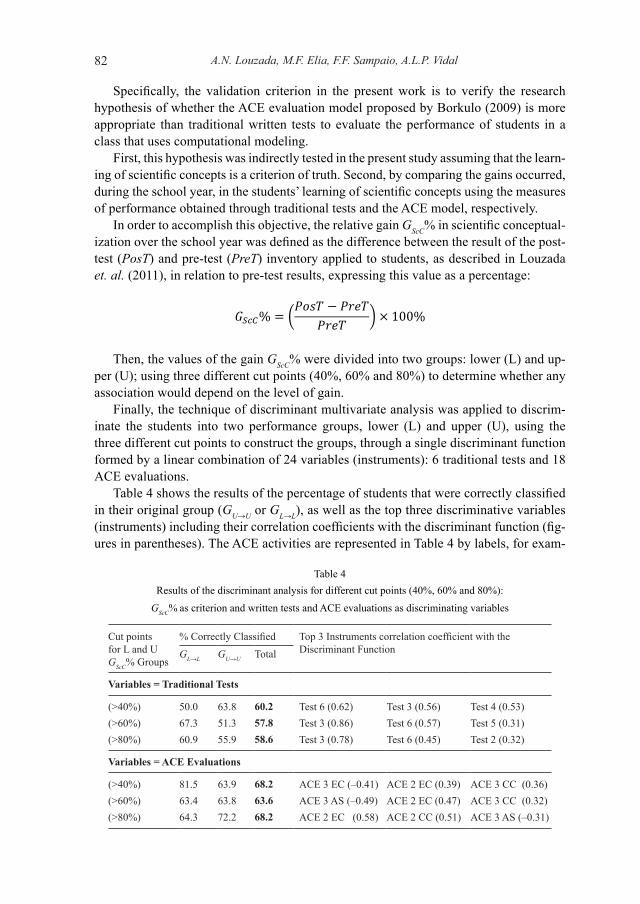
Finally, the technique of discriminant multivariate analysis was applied to discrim-inate the students into two performance groups, lower (L) and upper (U), using the three different cut points to construct the groups, through a single discriminant function formed by a linear combination of 24 variables (instruments): 6 traditional tests and 18 ACE evaluations.
Table 4 shows the results of the percentage of students that were correctly classified in their original group (GU→U or GL→L), as well as the top three discriminative variables (instruments) including their correlation coefficients with the discriminant function (fig-ures in parentheses). The ACE activities are represented in Table 4 by labels, for exam-
Table 4Results of the discriminant analysis for different cut points (40%, 60% and 80%):
GScC% as criterion and written tests and ACE evaluations as discriminating variables
Cut points for L and U GScC% Groups
% Correctly Classified Top 3 Instruments correlation coefficient with the Discriminant FunctionGL→L GU→U Total
Variables = Traditional Tests
(>40%) 50.0 63.8 60.2 Test 6 (0.62) Test 3 (0.56) Test 4 (0.53)(>60%) 67.3 51.3 57.8 Test 3 (0.86) Test 6 (0.57) Test 5 (0.31)(>80%) 60.9 55.9 58.6 Test 3 (0.78) Test 6 (0.45) Test 2 (0.32)
Variables = ACE Evaluations
(>40%) 81.5 63.9 68.2 ACE 3 EC (–0.41) ACE 2 EC (0.39) ACE 3 CC (0.36)(>60%) 63.4 63.8 63.6 ACE 3 AS (–0.49) ACE 2 EC (0.47) ACE 3 CC (0.32)(>80%) 64.3 72.2 68.2 ACE 2 EC (0.58) ACE 2 CC (0.51) ACE 3 AS (–0.31)
Validating the ACE Model for Evaluating Student Performance Using a ... 83
ple, the ACE 3 EC stands for: ACE activity 3 about testing the evaluating (E) cognitive ability on a complex (C) dimension, etc.
The percentage of correct classifications in Table 4 suggests that the set formed by the ACE evaluations is more effective than all the traditional tests for discriminating the gain in scientific conceptualization among students either in the upper performance GU→U group (72.2% against 55.9%), when the level of requirement is very high (cut point > 80%), or in the lower performance GL→L group (81.5% against 50.0%), when the requirement level is very low (cut point > 40%). It is worth noticing that by using a median cut point (> 60%) the two evaluation systems seem to be equally effective to evaluate students. That is, the ACE instruments seem to be better to discriminate stu-dents either on the top or at the bottom of the performance scale.
When examining the correlation coefficients of written tests and ACE activities with the discriminant function, it is important to notice that test1 or activity 1 did not help in discriminating students’ performance, probably indicating some problems related to the beginning of the school year. Looking at the written tests only, one can see that test 3 and test 6 were the most discriminative, appearing 6 out of 9 times. Similarly, looking at activities only, one can see that activity 3 was the most discriminative (5 out of 9). Among the different types of reasoning, the “E-evaluation” was the most discriminative (4 out of 9) and between the two dimensions the “C-complex” was the most discrimi-native (7 out of 9). Finally, looking at the 2-way interaction (reasoning vs. dimension) it can be observed that E-reasoning in a complex dimension is the most discriminative (6 out of 9).
5. Conclusions
This study, which focused on evaluation, is part of a major research project aiming to in-troduce computational modeling systems as a didactic resource for the teaching-learning process of physics at the high school level.
The study compared an evaluation of the ACE model – proposed by Borkulo (2009) to evaluate teaching strategies based on the use of computational modeling – and tradi-tional models of evaluation based on benchmark tests, taking as a criterion the students´ gains in the abilities of scientific conceptualization.
The results of this comparison show that the ACE model is more effective to identify students in the upper and lower part of this scale of ability, while both models seem to be equally effective in the middle of the scale. They also indicated strong evidences (summarized in Fig. 2) that educational measures obtained from traditional benchmark tests are appropriate, provided the questions are constructed so as to fulfill the necessary technical and operational requirements.
Acknowledgements
We would like to thank the director of the Escola Técnica Estadual Oscar Tenório, in Rio de Janeiro, for her support in this research.
A.N. Louzada, M.F. Elia, F.F. Sampaio, A.L.P. Vidal84
References
Bonabeau, E. (2002). Agent-based modeling: methods and techniques for simulating human systems. In: Pro-ceedings of the National Academy of Sciences of the United States of America, 99(Suppl 3).
Borkulo, S.P. van (2009). The Assessment of Learning Outcomes of Computer Modeling in Secondary Science Education. D.Sc. Thesis, University of Twente, Enschede.
Bravo, C., Joolingen, W.R. van, Jong, T. de (2009). Using Co-Lab to build System Dynamics models: students’ actions and on-line tutorial advice. Computers & Education, 53(2), 243–251.
Cohen, L., Manion, L., Morrison, K. (2000). Research Methods in Education. London and New York: Taylor & Francis Group.
Cronbach, L.J. (1951). Coefficient alpha and the internal structure of test. Psychometrika, 16, 297–334.Forrester, J.M. (1968). Principles of Systems. Cambridge, MA: Wright-Allen Press Inc. Gobert, J., O’Dwyer, L., Horwitz, P., Buckley, B., Levy, S.T., Wilensky, U. (2011). Examining the relationship
between students’ epistemologies of models and conceptual learning in three science domains: Biology, Physics, & Chemistry. International Journal of Science Education, 33(5), 653–684.
Guba, E.G., Lincoln Y.S. (1989). Fourth Generation Evaluation. Sage Publications.Jong, T. de, Joolingen, W.R. van (2007). Model-facilitated learning. In: J.M. Spector, M.D. Merrill, J.J.G.
van Merriënboer, M.P. Driscoll, Handbook of Research on Educational Communication and Technology.Lawrence Erlbaum Associates Pub., 3rd ed., 457–468.
Joolingen, W.R. van, Jong, T. de, Lazonder, A.W., Manlove, S. (2005). Co-Lab: research and development of an on-line learning environment for collaborative scientific discovery learning. Computers in Human Behavior, 21(4), 671–688.
Joolingen, W.R. van, Jong, T. de, Dimitrakopoulou, A. (2007). Issues in computer supported inquiry learning in science. Journal of Computer Assisted Learning, 23, 111–119.
Kazdin, A.E. (1982). Single-case research designs. New York, Oxford University PressLevy, S.T., Wilensky, U. (2011). Mining students inquiry actions for understanding of complex systems. Com-
puters & Education, 56(3), 556–573.Louzada A.N., Elia M.F., Sampaio, F.F., Vidal A.P. (2011). Validação de um modelo de avaliação no uso
da modelagem computacional em atividades educacionais. In: Anais do XXII Simpósio Brasileiro de In-formática na Educação. Aracaju, Brazil.
Louzada A.N. (2012). Uso da Modelagem Computacional Como Proposta de Inovação Curricular Para o En-sino de Física no Ensino Médio. M.Sc. Dissertation. Programa de Pós Graduação em Informática – Federal University of Rio de Janeiro (UFRJ), Brazil
NSF (2010). National Science Foundation. http://www.nsf.govNuffield (2010). Nuffield Program. http://www.nuffieldcurriculumcentre.orgOliveira, C.B.P. de, Sampaio, F.F., Elia, M.F. (2010). Utilização da ferramenta de modelagem dinâmica jlinkit
no processo de ensino-aprendizado de física no ensino médio. Revista Brasileira de Informática na Edu-cação, 18, 55–69.
Papert, S. (1980). Mindstorms: Children, Computers and Powerful Ideas. Basic Books.Riley, D. (2002). Simulation modelling: educational development roles for learning technologists. Association
for Learning Technology Journal, 10(3), 54–69.Rutten, N., van Joolingen, W.R., van der Veen, J.T. (2012). The learning effects of computer simulations in
science education. Computers & Education, 58(1), 136–153.Stanley, J.C., Campbell, D.T. (1966). Experimental and quasi-experimental designs for research. Rand Mc-
Nally College Publishing CompanySTEM (2008). CRS Report Program – Science, Technology, Engineering, and Mathematics Education.
http://www.fas.org/sgp/crs/misc/RL33434.pdfTrouille, L., Beheshti, E., Horn, M., Jona, K., Kalogera, V., Weintrop, D., Wilensky, U. (2013). Bringing
computational thinking into the high school science and math classroom. American Astronomical Society, AAS Meeting. 221.
Wilensky, U. (1999). NetLogo. Center for Connected Learning and Computer-Based Modeling, Northwestern University, Evanston, IL. http://ccl.northwestern.edu/netlogo/
Yeo, S., Zadnik, M. (2001). Introductory thermal concept evaluation: assessing student’s understanding. Phys-ics Teacher, 39, 496–504.
Validating the ACE Model for Evaluating Student Performance Using a ... 85
A.N. Louzada. M.Sc. in Informatics. Computer Science teacher (secondary and under-graduate education).
M.F. Elia. Ph.D. in Science Education. Professor of Science Education and researcher in IT in Science Education at Federal University of Rio de Janeiro, Brazil.
F.F. Sampaio. Ph.D. in Computers in Education. System Analyst and researcher in IT in Education at Federal University of Rio de Janeiro, Brazil.
A.L.P. Vidal. Physics teacher (secondary education).
ACE modelio, skirto mokinių mokymuisi vertinti, validavimas, kai mokymo ir mokymosi procesas vyksta taikant kompiuterines mode-liavimo sistemasAlexandre Neves LOUZADA, Marcos da Fonseca ELIA, Fábio Ferrentini SAMPAIO, Andre Luiz Pestana VIDAL
Straipsnio tikslas yra adaptuoti ir Brazilijos mokyklose ištestuoti Borkulo pasiūlytojo ACE mo-delio tinkamumą mokinių mokymuisi vertinti, kai mokymo ir mokymosi procesas vyksta taikant kompiuterines modeliavimo sistemas. ACE modelis grindžiamas skirtingais mąstymo tipais ir ap-ima tris dimensijas. Modelio adaptavimo metu pristatant inovatyvias metodologines procedūras ir duomenų rinkimo bei analizavimo instrumentus, gauti rezultatai rodo, kad ACE modelis yra efektyvesnis lyginant su testais raštu tiems mokiniams, kurių loginio mąstymo gebėjimai yra apa-tinėje ir viršutinėje skalės dalyse, tačiau abu modeliai vienodai tinka mokiniams, esantiems skalės viduryje.
