validation
DESCRIPTION
validationTRANSCRIPT

International Journal of ChemTech Research CODEN (USA): IJCRGG ISSN : 0974-4290
Vol.1, No.3 , pp 677-689, July-Sept 2009
DEVELOPMENT AND VALIDATION OF TWOCHROMATOGRAPHIC STABILITY-INDICATING METHODS FOR
DETERMINATION OF ROSUVASTATININ PURE FORM AND PHARMACEUTICAL PREPARATION
Hasumati A. Raj*1, Sadhana J. Rajput2, Jayant B. Dave1 and Chaggan N. Patel11Shri Sarvajanik Pharmacy College, Near Arvind baug, Mehsana 384001, Gujarat, India.
2M. S. University, Faculty of Technology and Engineering, Pharmacy Department,Kalabhavan, Baroda 390001, Gujarat, India.
*E-mail: [email protected]. No.: 09327770619
Abstract: Two new, simple, sensitive and accurate stability-indication methods were developed for quantitativedetermination of rosuvastain in the presence of its degradation products in raw material. The first is a High-PerformanceLiquid Chromatography (HPLC) method in which separation was achieved on Phenomenex C18 column (250 mm, i.d. 4.6 mm,5 µm) using acetonitrile: 0.5 % formic acid (50 + 50, v/v) as the mobile phase at a flow rate of 1.0 mL/min at ambienttemperature (22 – 27 °C) with ultraviolet detection at 248 nm over a concentration range of 5 – 300 µg/ml with mean recoveryof 99.51 – 100.66 %. The second method is High-Performance Thin Layer Chromatography (HPTLC) in which the drug isseparated form its acidic degradation products on silica gel 60F254 plates using ethylacetate: toluene: acetonitrile: formicacid (6 + 3.5 + 0.5 + 0.2 v/v/v/v) as the mobile phase with ultraviolet detection of the separated bands at 243 nm over aconcentration range of 318 - 3816 ng/spot for rosuvastain with mean recovery 99.77-101.94 %. Both methods can analysisRosuvastatin in bulk drug with intraday and interday precision of 0.23 – 0.87% and 0.29 – 0.84%, respectively for HPLCmethod and 0.48-0.93 % and 0.24-0.77 %, respectively for HPTLC method. Developed methods can apply for the estimationof three strength of NOVASTAT tablet manufacture by Lupin pharmaceuticals.Key Words: Rosuvastatin, stability indicating, HPLC, HPTLC.
Introduction:Rosuvastain (ROSU), new member of a class ofcholesterol-lowering drugs commonly referred to as“statins”, was approved in the U.S. in August 2003 forthe treatment of dyslipidemia1-3. ROSU is chemically bis[(E)-7-[4-(4-fluorophenyl)-6-isopropyl-2- [methyl-(methyl-sulfonyl) amino] pyrimidin-5-yl](3R, 5S)-3,5-dihydroxyhept- 6-enoicacid] calcium salt. ROSU, asynthetic lipid-lowering agent, is a selective andcompetitive inhibitor of 3-hydroxy-3-methylglutaryl-coenzyne A (HMG-CoA) reducates, the key rate-limitingenzyme of cholesterol biosynthesis in liver. Comparedwith several other HMG-CoA reducates inhibitors,ROSU does not appear to be metabolized significantly bycytochrome P450 3A42 and, therefore, may not possessthe same potential for drug interactions as seen for someother statins e.g. lovastatin3 and simvastatin4.
A literature survey revealed that different analyticalmethods involving high-performance liquidchromatography5 (HPLC) for determination of ROSU inpharmaceutical formulations and in vitro metabolismstudy. High-performance thin layer chromatography6
(HPTLC) for separation and quantitation of simvastatin,Pravastatin sodium and rosuvastatin calcium. HPLC-MS/MS7 and HPLC-MS8 for Pharmacokinetics andpharmacogenetics study of ROSU. HPLC9 method fordetermination of ROSU. Microbore HPLC-MS10 fordetection of ROSU (CrestorTM) in human plasma wasinvestigated. Spectrophotometric11 method for estimationin tablet formulation. LC-MS/MS12 method incombination with Fenofibric acid for estimation in humanplasma. HPLC-MS13 method for estimation of ROSU inhuman plasma using atorvastatin as internal standard.International patent 027530 describe impurity profile

Hasumati A. Raj et al /Int.J. ChemTech Res.2009,1(3) 678
determination of ROSU by testing HPLC14. US patent7244844 provides detatiled description how to synthesizedegradation product and their use as reference standard15.Capillary Zone Elecrophoresis16 method published fordetermination of ROSU in formulation. HPLC methodsdescribed for estimation of ROSU in reference haveammonia and phosphate as buffer in mobile phasepreparation while in developed method have advantage ofsimple composition of mobile phase which can separateROSU and its degraded product with in 15 min with goodresolution. Only one HPTLC method was reported whichcan separated ROSU form other statin while developedHPTLC method have advantage it can separated ROSUfrom its acidic degraded product and estimated ROSUform its formulation. Also developed methods areprecise, accurate, specific and sensitive stabilityindicating methods for estimation of ROSU in presenceof its degradation products.
ExperimentalApparatusA Shimadzu HPLC, Model: LC-10ATvp (Shimadzu)with rheodyne injector, UV-Visible detector, Model:SPD-10 AVP (Shimadzu) and class VP software. HPLCColumn, C18 (size-250 x 4.60 mm, I.D-5 µ)(Phenomenex). Nylon filter 0.45 μm. PH meter (Thermoelectro corporation). For HPTLC, Pre-coated silica gelaluminum Plate 60F–254 (20 × 10 cm with 250 µmthickness) (E. Merck). Desaga – 25 µl Dosing syringe(Hamilton Co., Reno, Nevada). Desaga – 100 µlApplicator syringe, GASTIGHT, Model 1701 (Hamilton,Bonaduz, Schweiz). Desaga Applicator with AS30winsoftware. Desaga – Twin trough chamber (100 ´ 100)with stainless steel Lid. Desaga TLC scanner withProquant software. Desaga Photo chamber with Providocsoftware with Canon power shot G5 digital camera. UVcabinet with dual wavelength UV lamp (254 nm and 366nm). Drug was weighed on balance, Model ALC 210.4(Acculab). Sonicator used was Ultra Sonicator (FastClean Ultrasonic Cleaner).Reagents and MaterialsPharmaceutical grade of Rosuvastatin calcium (ROSU)reference standards were kindly supplied as gift samplesby Torrent Research Center, Ahmadabad, India. HPLCgrade Acetonitrile was purchased form S.D. FineChemicals Ltd. (Mumbai). The water for HPLC wasprepared by triple glass distillation and filtered through anylon 0.45 μm – 47 mm membrane filter (GelmanLaboratory, Mumbia, India). Sodium hydroxide,hydrochloric acid and 30 % Hydrogen peroxide waspurchased from Qualigens Fine Chemicals (Glaxo Ltd.).AR grade Acetonitrile was purchase form ACS chemicals(Ahmedabad). Toluene, Ethlylacetate and formic acidwere purchased form S. D. fine Chemicals Ltd. (Mumbai)and were of analytical grade.Chromatographic conditions(a) HPLC method. – A phenomenex C18 column wasused at ambient temperature (22 – 27 °C). The mobile
phase consisted of acetonitrile: 0.5 % formic acid (50 +50, v/v) and was pumped at a flow rate of 1 mL/min. themobile phase was filtered through a nylon 0.45 μm – 47mm membrane filter and degassed before use. Theelution was monitored by peak area at 248 nm, and theinjection volume was 20 μL.
(b) HPTLC method. – Solution of ROSU was applied tosilica gel aluminum Plate 60F–254 (20 × 10 cm with 250µm thickness) by means of Desaga automatic applicatorequipped with a 25 µL syringe and operated with settingsof band length, 3 mm; distance between bands, 5 mm;distance from the plate edge, 10 mm; and distance fromthe bottom of the plate, 15 mm. The plate was developedin a twin trough chamber previously saturated for 30 minwith the mobile phase, ethylacetate: toluene: acetonitrile:formic acid (6 + 3.5 + 0.5 + 0.2 v/v/v/v). The spots onthe air-dried plate were scanned with a Desaga TLCscanner and peak area was detected at 243 nm using thedeuterium source.
Preparation of ROSU standard stock solutions(a) HPLC method. - ROSU (100 mg) was weighedaccurately and transferred to 100ml volumetric flask. Itwas dissolved in 50 ml acetonitrile properly and dilutedup to mark with acetonitrile to obtain final concentrationof 1000 µg/ml.
(b) HPTLC method. – ROSU (100 mg) was weighedaccurately and transferred to 100ml volumetric flask. Itwas dissolved in 50 ml methanol properly and diluted upto mark with methanol to obtain final concentration of1000 µg/ml.System Suitability TestSystem suitability test of the chromatographic systemwas performed before each validation run using fivereplicate injections of a standard solution. Theoreticalplates, tailing factor and resolution were determined.Method validation(a) Calibration curve (linearity of the HPLCmethod). – From the stock solution (1000 µg/ml),aliquots of 0.1, 0.5, 1, 1.5, 2, 2.5, and 3 ml weretransferred to a series of 10 ml volumetric flasks. Thevolume was adjusted up to the mark with ACN to getfinal concentrations of 10, 50, 100, 150, 200, 250, and300 µg/ml of solution. 20 µl of all these solutions wereinjected separately into HPLC column and the peak areaof each solution was measured at selected wavelength.(b) Calibration curve (linearity of the HPTLCmethod). –From the stock solution (1000 µg/ml)aliquots of 0.3, 0.6, 0.9, 1.8, 2.7 and 3.6 µl were spottedon the TLC plate under nitrogen stream using DesagaApplicator, AS30win. The calibration curves wereplotted over a concentration range of 300 - 3600 ng/spotby plotting peak areas vs concentration. Each reading wasthe average of 5 determinations.Accuracy (% Recovery)The accuracy of the methods was determined bycalculating recoveries by the standard addition method.
Hasumati A. Raj et al /Int.J. ChemTech Res.2009,1(3) 679
100 µg/ml of tablet solutions of ROSU was spiked by 50,100 and 150 µg/ml of standard solutions for the HPLCmethod. 1000 µg/ml of tablet solutions of ROSU wasspiked by 250, 500 and 1000 µg/ml of standard solutionsfrom this 1 µl was spotted on TLC plate for the HPTLCmethod. The amounts were estimated by the regressionequation of the calibration curve.PrecisionRepeatabilityThe intraday precision of the proposed methods weredetermined by estimating the corresponding responses 5times on the same day for 3 different concentrations of60, 120 and 240 µg/ml for the HPLC method and 500,1500 and 2000 ng/spot for the HPTLC method. Theresults are reported in terms of percentage coefficient ofvariation (% C.V).Intermediate PrecisionThe interday precision of the proposed methods weredetermined by estimating the corresponding responses on5 different day for 3 different concentrations of 60, 120and 240 µg/ml for the HPLC method and 500, 1500 and2000 ng/spot for the HPTLC method. The results arereported in terms of percentage coefficient of variation(% C.V).RobustnessThe robustness of the method was checked by repeatedlyinjecting (n = 5) standard solutions of 150 µg/ml in twoC18 column one was made by phenomenex and one byhypersil for the HPLC method and by repeated scanningof the same spot (n = 5) of 400 ng/spot on aluminumbased and class based silica gel plate without changingthe position of plate for the HPTLC method.Limit of Detection and Limit of QuantificationThe limit of detection (LOD) and the limit ofquantification (LOQ) of the drug were calculated usingthe following equations as per International Conferenceon Harmonization (ICH) guideline17.LOD = 3.3 x (X/ S)LOQ=10 x (X/S)Where X = the standard deviation of the response and S =the standard deviation of y-intercept of regression lines.Procedure for Stress studies(a) HPLC method. – Stress studies were carried out underthe conditions of dry heat, hydrolysis, oxidation andphotolysis, as mentioned in ICH Q1A (R2)17. Theapproach suggested by Singh and Bakshi was adopted forthese studies18. The blank solution subjected to samestress conditions same manner as the drugs. Hydrolyticdecomposition of ROSU was carried out in water atneutral pH 7 at room temperature and reflux at 80 °C, 0.5N HCl at room temperature and 1 N HCl for reflux at 80°C and 1 N NaOH at room temperature and reflux at 80°C. Oxidation stress studies was performed in 30% H2O2at room temperature and reflux at 80 °C. Photolyticstudies was done in phtostability chamber by exposingthe solid drug for 48 hrs. Studies were also conducted onsolid drug, which was heated at 80ºC temperature instability oven. Approximate 25 mg drug was weighed
and transferred to 25 ml volumetric flask and dissolvedwith 5 ml of ACN and then the volume was made up tothe mark with the solvent used for degradation. Putting25 mg of drug to direct exposure to 80ºC temperature instability oven and photo stability chamber. Samples werecolleted at various stages from 0 min (as soon as samplewas prepared) to 48 hrs of exposure to degradationcondition.(b) HPTLC method. – Forced degradation study byHPTLC method was done in acidic condition only. 25 mgdrug was accurately weighed and transferred to 25 mlvolumetric flask. The drug was dissolved in 5 ml ofmethanol then diluted with concentrated HCl. Thedegradation was allowed to done at room temperature.Samples were colleted for analysis at three stages, at 0min (as soon as sample was prepared), after 1 hrs andafter 4 hrs of exposure to degradation condition for roomtemperature. Sample was applied by direct spotting of 1μl on prewashed TLC plate.Analysis of ROSU in tablet dosage formTablet containing 5, 10 and 20 mg of ROSU of brandNOVASTAT (manufactured by Lupin pharmaceutical, L-0548, label claim: Each uncoated tablet contain 5 mg ofRosuvastatin, Mfg. 8/2006, Exp. 08/2008, L-0738, labelclaim: Each uncoated tablet contain 10 mg ofrosuvastatin, Mfg. 6/2006, Exp. 06/2008, L-0184, labelclaim: Each uncoated tablet contain 20 mg ofrosuvastatin, Mfg. 07/2006, Exp. 07/2008) were selectedfor the study. Twenty tablets were taken of each dose andaverage weight found. Powder was making by triturated20 Tablets. The Tablet powder equivalent one Tabletcontent was transferred into a 100 ml volumetric flaskcontaining 50 ml ACN, sonicated for 15 min and furtherdiluted to 100 ml with ACN. The resulting solution wassonicated for 10 min and supernatant was filtered throughwhatman filter paper no.41. 20 µl of this solution wasinjected into HPLC column for two times and peak areawas measured at 248 nm and average was considered forHPLC method. Same procedure for preparation ofHPTLC test sample but in place of ACN methanol wasused. 0.5 µl from this solution was spotted on the TLCplate in for three times under nitrogen stream usingApplicator. The plate was dried in air, and then the platewas developed in Twin trough developing chamber (100´ 100) with stainless steel Lid, previously saturated withthe mobile phase for 30 min. The plate was removedfrom the chamber, dried in air and was scanned andmeasure peak area at 243 nm in Reemission/Excitationmode with Desaga TLC scanner and average was takenfor HPTLC method.The amount of ROSU in sample solution was determinedby fitting the responses into the regression equation ofHPLC and HPTLC, respectively.
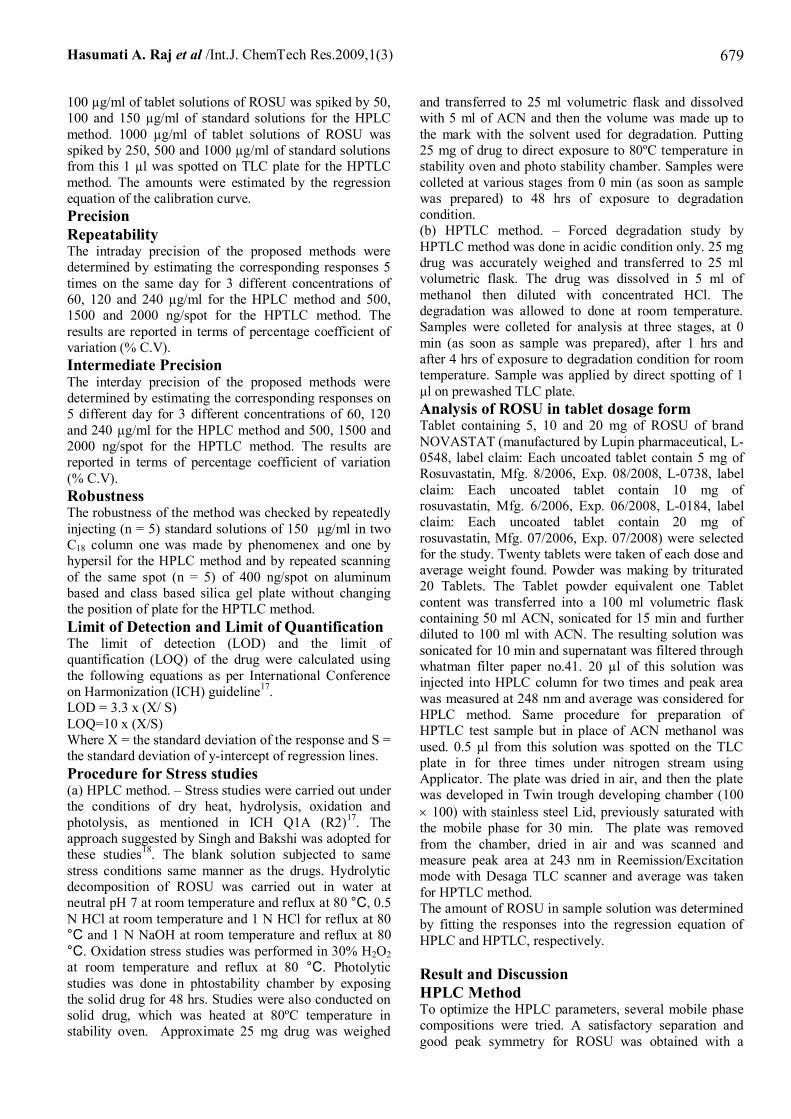
Result and DiscussionHPLC MethodTo optimize the HPLC parameters, several mobile phasecompositions were tried. A satisfactory separation andgood peak symmetry for ROSU was obtained with a

Hasumati A. Raj et al /Int.J. ChemTech Res.2009,1(3) 680
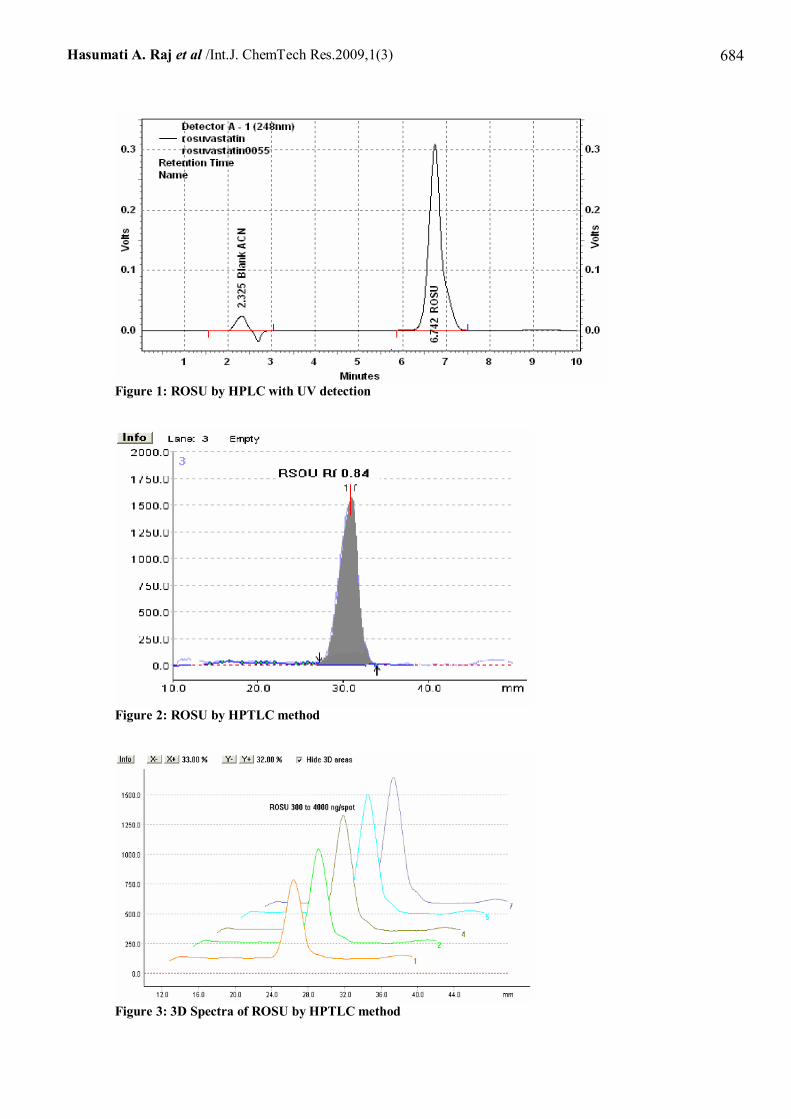
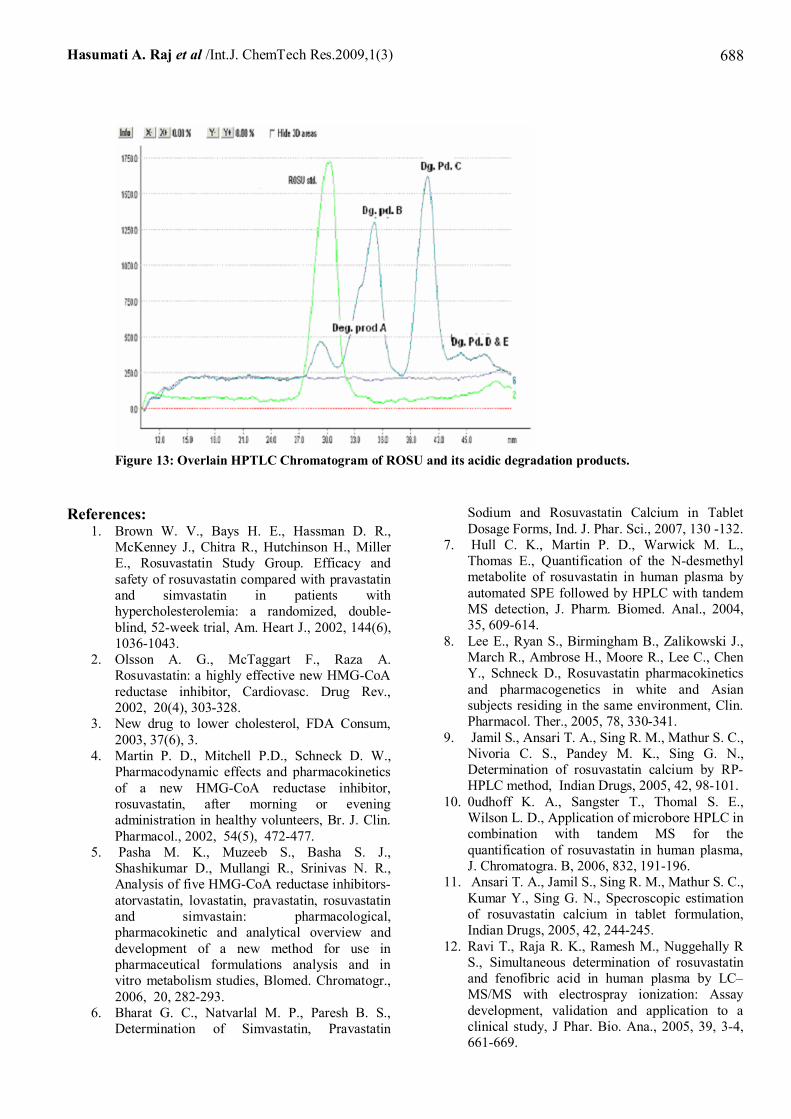
mobile phase consisting of acetonitrile: 0.5 % formicacid (50 + 50, v/v) to obtain better reproducibility andrepeatability. Quantification was achieved with UVdetection at 248 nm based on peak area. A completeresolution of the peaks with clear baseline separation wasobtained (Figure 1).HPTLC MethodsSeveral mobile phases were tried to accomplish goodseparation of ROSU and its degradation products. Usingthe mobile phase ethylacetate: toluene: acetonitrile:formic acid (6 + 3.5 + 0.5 + 0.2 v/v/v/v) and 20x20 cmHPTLC silica gel 60F254 aluminu backed plates; betterseparation was attained with 0.84 Rf values of for ROSU.A wavelength of 243 nm was used for the quantificationof the drugs. Resolution of the peaks with clear baselineseparation was found (Figure 2,3,4).System Suitability TestThe system suitability test of the chromatographic systemwas performed before validation run. The systemsuitability test is an integrated part of the analyticalmethod and it ascertains the suitability and effectivenessof the operating system. The approximate results werereported in Table 1. The values for these parameters weresatisfactory in accordance with the literature 17-22. Thetests ensure that the chromatographic system generatessafe results. Thus, it was established that the LC systemand procedure are capable of providing acceptable qualitydata.Validation of the Proposed MethodLinearity. – Linear correlation was obtained betweenpeak areas and concetraitons of ROUS in the rang of 5 –300 μg/ml and 318 - 3816 ng/spot, respectively, forHPLC and HPTLC methods. The linearity of thecalibration curves was validated by the high value ofcorrelation coefficients of regression (Table 2).Accuracy. – The recovery experiments were carried outby the standard addition method. The recoveries obtainedwere 99.51 – 100.66 % and 99.77 - 101.94 %,respectively, by HPLC and HPTLC (Table 2, 7, 10). Thevalues of % assay range 99-102 indicated their is no anyinterference form excipient present in tablet formulationboth HPLC and HPTLC methods are accurate andselective. Figure 5-1 shows that ROSU can well separateform its all type of degradation products so developedHPLC method is specific and selective for ROSU. Figure2,4 and 12 indicated that ROSU can be well resolve bydeveloped HPTLC method and can be separated form itacidic degradation product which indicated thatdeveloped HPTLC method is also selective and specific.Precision.Repeatability – The % C.V. values for intraday werefound to be 0.23 – 0.87 % using HPLC method and 0.48-0.93 % using HPTLC method (Table 2, 5, 8). The low %C.V. values indicate the proposed methods arerepeatable.Intermediate precision. – The % C.V. values for interdaywere found to be 0.29 – 0.84 % using HPLC method and0.24-0.77 % using HPTLC method (Table 2, 5, 8). The
low % C.V. values indicate the proposed methods areprecise.Robustness. - The % C.V. values were found to be 0.059% and 0.44 % using HPLC and HPTLC methods (Table2, 6, 9) reveal that the proposed methods are robust.LOD and LOQ. – LOD and LOQ were found to be0.0905µg/ml and 0.318µg/ml and 0.986 ng/spot and2.682 ng/spot, respectively, using HPLC and HPTLCmethods (Table 2). These data show that both methodsare sensitive for the determination of ROSU.Assay of the Tablet Dosage Form (ROSU 5, 10 and 20mg)The proposed validated methods were successfullyapplied to determine ROSU in their Tablet dosage form(NOVASTAT (Lupin)). The results obtained for ROUSwere comparable with the corresponding labeled amounts(Table 3).Standard sample and test sample can be stored inrefrigerator and used for 7 day.Degradation BehaviorHPLC studies on the stressed solutionsSeven degradation products were identified duringdegradation study of ROSU. The retention times (Rt),system suitability parameters and percentage degradationof ROSU were reported in Table 1. The degradationproducts carry the notations A, B, C, D, E, F and G inaccordance with the sequence of degradation studies.HPLC studies of the stressed samples showed thefollowing degradation behavior:Hydrolytic conditionsThe drug showed 32 % degradation in 0.5N HCl at roomtemperature at 72 hrs and form three degradationproducts peak (Figure 5) at Rt 8.925, 11.825 and 11.667with respect to A, B and C. The drug showed 52 %degradation in 1 N HCL for reflux for 5 hrs and fourpeaks were appeared at Rt 11.825, 11.667, 4.933 and7.665 with respect to peaks B,C,E and F(Figure 6). Butthere is no hydrolysis of ROSU in alkaline and neutralconditions (Figure 7, 8).Oxidative studiesIn oxidative condition drug was exposure to 30 % H2O2for room temperature it was converted in two degradationproducts and peak appeared at Rt of 8.925 and 10.200with respect to peaks A and D (Figure 9(a)). Oxidation byreflux at 80°C drug was converted in to tow degradationproducts and peaks appeared at Rt 10.200 and 4.933 withrespect to peaks D and E (Figure 9(b)). The drug showedvery susceptible behavior towards oxidative stress andwas completely converted in two products after exposesfor oxidation by reflux for 5 hrs.Photolytic studiesUnder light ROSU degrade in two peaks at Rt 8.925 and10.200 (peaks A and D). As expose time increasedegraded peaks area also increase so after long exposedrug completely converted in degradation peaks A and D(Figure 10). When rosuvastatin calcium was exposed tovisible light irradiation two degradation products wereform which are diastereomeric cyclic products A and D

Hasumati A. Raj et al /Int.J. ChemTech Res.2009,1(3) 681
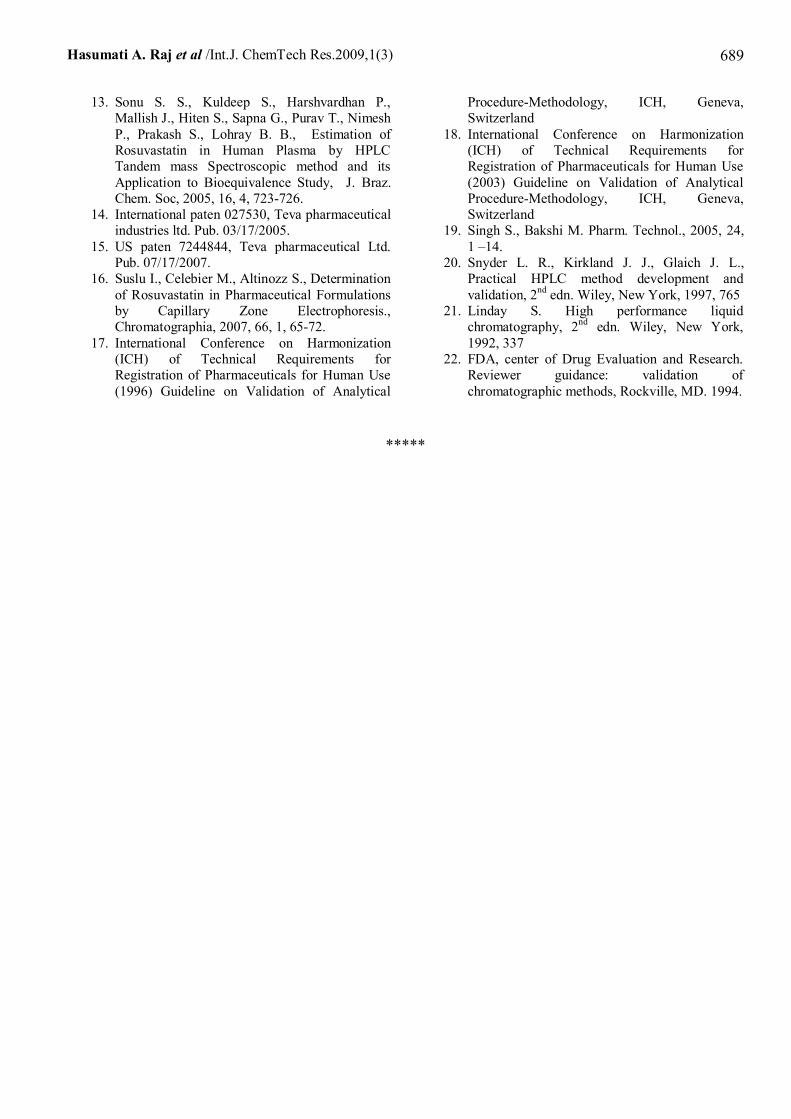
with the creation of an additional asysmmetric center inposition 615.Solid – state studiesThere was no significant degradation of solid ROSU onexposure to drug heat at 80 C for 72 hrs, but one minordegradation form at peak A (Rt 8.925), which indicatedthat the drug was susceptible to thermal stress (Figure11).HPTLC studies on the stressed solutionsAn HPTLC study was carried out only for acidicconditions. When acidic hydrolysis products were spottedon TLC plate. ROSU was degraded in five minorproducts (Figure 12) out of five three main degradationproducts seen in Figure which also carry the notations A,B, C, D and E. Form this A, B and C is major degradationproducts. Around 88 % degradation was appeared inacidic hydrolysis. In which B and C is major product andafter prolong exposer (Figure 13).Comparison of the Proposed MethodsThe assay result for ROSU in their dosage form obtainedusing HPLC and HPTLC methods were compared byapplying the paired t-test. The calculated t-value of 0.79is less than the tabulated t-value (4.60) at the 95%confidence interval. Therefore, there is no significantdifference in a determined content of ROUS by theHPLC and HPTLC methods.
ConclusionsIn this study, it was possible to develop a selective andvalidated stability indicating HPLC assay method for
ROSU on a C18 column, which could separate the drugand its degradation products formed under a variety ofstress conditions. ROSU was found to be unstable inacidic, thermal and oxidative and photolytic condition,whereas it was comparatively much stable in neutral andalkaline hydrolysis. Percentage degradation of ROSU byvarious stress conditions was reported in Table 4. HPTLCmethod can selectively separated ROSU form its acidicdegradation products.The results of the analysis of pharmaceutical dosageforms by the proposed methods are highly reproducibleand reliable and are in good agreement with the labelclaim of the drug. The additives usually present in thepharmaceutical formulations of the assayed samples didnot interfere with determination of ROSU by HPLC andHPTLC methods. The methods can be used for routineanalysis of ROUS in pharmaceutical preparation and alsoit is hoped that this report on stability indicating methodand degradation of ROSU would be helpful for themultiple generic manufacturers of the drug around theglobe by saving them for unnecessary repetition of thesame studies.Acknowledgements:The authors are thankful to Torrent Research Center,Ahmadabad, India, for providing standards sample ofdrug and also the Shri Sarvajanik Pharmacy CollegeMehsana for providing facilities to carry out work.
Table 1: System suitability parameters of ROSU.
Degradation productsSr.No
Systemsuitability
parameters
ROSUA B C D E F G
1 Retentiontime(minutes)
6.742 8.925 11.825 11.667 10.200 4.933 7.675 8.025
2 Theoretical plates
2778.41 3392.23 4571.56 4822.53 3454.23 2678.30 2710.74 3984.84
3 Resolution 7.28 3.90 4.92 2.31 8.77 7.58 2.34 1.704 Asymmetry 1.08 1.09 1.43 1.21 1.13 1.31 1.02 1.125 USP width 1.32 3.06 4.38 1.11 3.64 1.24 0.49 0.716 Tailing
Factor0.91 1.10 1.38 1.20 1.15 1.30 0.93 1.07
7 CapacityFactor
1.96 0.77 1.63 4.30 1.16 0.81 3.15 3.15

Hasumati A. Raj et al /Int.J. ChemTech Res.2009,1(3) 682
Table 2: Summary of Validation parameters by HPLC with UV detectionSr.No
Parameters HPLC HPTLC
1 Analytical wavelengths (nm) 248 243
2 Linearity range 5 - 300µg/ml 318 - 3816 ng/spot
3 Regression equation Y = 74552xcon.+133679
Y = 0.2392 x conc.+ 137
4 Correlation coefficient (r2) 0.9999 0.9993
5 Intercept 133679 137
6 Slope 74552 0.2392
7 % Assay 100.18 – 100.45% 102.93%
8 Precision
Intra day % CV (n = 5) 0.23 – 0.87% 0.48-0.93 %
Inter day % CV (n = 5) 0.29 – 0.84% 0.24-0.77 %
Reproducibilityof measurements%CV
0.059 0.44
% Recovery 99.51 – 100.66 % 99.77-101.94 %
9 Limit of detection 0.0905µg/ml 0.986 ng/spot
10 Limit of quantification 0.318µg/ml 2.682 ng/spot
%C.V. calculated form five replication of readings
Table 3: Estimation of ROSU in tablet by HPLC with UV detectionHPLC HPTLC
TabletFormulation
LabeledClaim
(mg/tablet)AmountFound*
(mg/tablet)
% Assay± S.D
Amount found*(mg/tablet)
% Assay ±S.D
5 5.09 100.18 ± 0.77 - -
10 10.02 100.21 ± 0.67 10.29 102.93 ±0.38
NOVASTAT(Lupin)
20 20.09 100.45 ± 0.23 - -*Average of five readingsSD = Standard deviation.
Table 4: Percentage degradation of ROSU by force degradation
Degradation productsSr. No Parameters (Stress condition
/duration/state)ROSU
A B C D E F G
Total%
Deg.Neutral/H2Oat pH 7/48 h/ sol./RT 100 No degradation found1Neutral/H2Oat pH 7/3 h/ sol./Ref. 100 No degradation found
Acidic/0.5 N HCl/72 h/ sol./RT 68 2 12 17 - - - - 322Acidic/ 1 N HCl/5 h/ sol./Ref. 48 - 15 17 - 8 12 52Alkali/ 1N NaOH/48 h/ sol./RT 100 No degradation found3
Alkali/ 1N NaOH/4 h/ sol./Ref. 100 No degradation foundOxidative/30% H2O2/48 h/ sol./RT 70 15 - - 15 - - - 304
Oxidative/30% H2O2/5 h/ sol./Ref. - - - - 53 47 - - 1005 Thermal/80 C/48 h/solid/RT 86 14 - - - - - - 146 Photo/uv254 and Vis/366 nm/48
h/solid/RT69 12 - 4 13 - - 2 31
RT is room temperature and Ref. is reflux at 80C temperature. h is hours for degradations

Hasumati A. Raj et al /Int.J. ChemTech Res.2009,1(3) 683
Table 5: Intraday and interday precision data of ROSU by HPLCIntraday InterdaySr.
No.Concentration(µg/ml) Peak area* %CV RT* Peak area* %CV RT*
1 60 4660782 0.38 6.733 4653026 0.48 6.7332 120 9314584 0.87 6.715 9316911 0.29 6.7333 240 18544624 0.23 6.7495 18618309 0.84 6.715
*Average of five readings
T able 6: Robustness data of ROSU (150 µg/ml) by HPLCHypersile PhenomenexC18
Column Peak Area* RT Peak Area* RT11634504 6.817 11643812 6.71511624421 6.733 11636055 6.7495
150µg/ml
11636831 6.733 11635125 6.7495%CV 0.059 0.58 0.67 0.15
Table 7: Accuracy data of ROSU by HPLC with UV detectionPeak Area
Initial conc.(µg/ml)(A)
Quantity of std. Added (µg/ml)(B) TotalAmount(A + B)
Total quantityFound*± S.D.
%Recovery ± S.D
100 50 150 149.67 ± 0.48 99.78 ± 0.38100 100 200 201.32 ± 0.39 100.66 ± 0.54100 150 250 248.78 ± 0.29 99.512 ± 0.57
*Average of five readings
Table 8: Intraday and interday precision data of ROSU by HPTLC with UV detectionIntraday InterdaySr.
No.Concentration
(ng/ml) Peak area* ±S.D.
%CV Rf* Peak area* ±S.D.
%CV Rf*
1 500 267 ± 0.39 0.93 0.38 267 ± 0.56 0.24 0.372 1500 763 ± 0.28 0.56 0.37 763 ± 0.67 0.77 0.383 2000 1057 ± 0.47 0.48 0.38 1055 ± 0.36 0.17 0.38
*Average of five readings
Table 9: Robustness data of ROSU by HPTLC with UV detection (400 ng/spot)Time Peak Area Rf
192.64 0.37192.72 0.38
Aluminum TLCplate
193.05 0.38192.14 0.37194.00 0.37
Glass TLC plate
192.91 0.38S.D. 0.69 0.12
%CV 0.44 (<1%) 0.89 (>1%)*Average of five readings
Table 10: Accuracy data of ROSU by HPTLC with UV detection
SpottAmount
Total quantityFoundMean ± S.D.
%Assay± S.D
750 749.98 ± 0.84 99.77 ± 0.331000 1023.84 ± 0.47 101.94 ± 0.341500 1503.08 ± 0.38 100.20 ± 0.35
*Average of five readings
Hasumati A. Raj et al /Int.J. ChemTech Res.2009,1(3) 684
Figure 1: ROSU by HPLC with UV detection
Figure 2: ROSU by HPTLC method
Figure 3: 3D Spectra of ROSU by HPTLC method

Hasumati A. Raj et al /Int.J. ChemTech Res.2009,1(3) 685
Figure: 4: TLC plate of ROSU method (After detection)
Figure 5: Chromatograms of ROSU in 0.5 N HCl at room temperature
Figure 6: Chromatograms of ROSU in 1 N HCl at 0 min, 30 min,1hr, 2 hr, 3 hr, 4 hr and after 5 hrs reflux at 80°C

Hasumati A. Raj et al /Int.J. ChemTech Res.2009,1(3) 686
Figure 7: Chromatograms of base hydrolysis in 1 N NaOH (a) at room temperature (b) reflux at 80°C
Figure 8: Chromatograms of neutral (H2O) (a) at room temperature and (b) reflux at 80°C
Figure 9: Chromatograms of oxidative in 30% H2O2 (a) room temperature and (b) reflux at 80°C

Hasumati A. Raj et al /Int.J. ChemTech Res.2009,1(3) 687
Figure 10: Chromatograms of Thermal-degraded ROSU
Figure 11: Chromatograms of photlolytic degradation of ROSU
Figure 12: HPTLC Chromatogram of ROSU and its acidic degradation in UV detection.
Hasumati A. Raj et al /Int.J. ChemTech Res.2009,1(3) 688
Figure 13: Overlain HPTLC Chromatogram of ROSU and its acidic degradation products.
References:1. Brown W. V., Bays H. E., Hassman D. R.,
McKenney J., Chitra R., Hutchinson H., MillerE., Rosuvastatin Study Group. Efficacy andsafety of rosuvastatin compared with pravastatinand simvastatin in patients withhypercholesterolemia: a randomized, double-blind, 52-week trial, Am. Heart J., 2002, 144(6),1036-1043.
2. Olsson A. G., McTaggart F., Raza A.Rosuvastatin: a highly effective new HMG-CoAreductase inhibitor, Cardiovasc. Drug Rev.,2002, 20(4), 303-328.
3. New drug to lower cholesterol, FDA Consum,2003, 37(6), 3.
4. Martin P. D., Mitchell P.D., Schneck D. W.,Pharmacodynamic effects and pharmacokineticsof a new HMG-CoA reductase inhibitor,rosuvastatin, after morning or eveningadministration in healthy volunteers, Br. J. Clin.Pharmacol., 2002, 54(5), 472-477.
5. Pasha M. K., Muzeeb S., Basha S. J.,Shashikumar D., Mullangi R., Srinivas N. R.,Analysis of five HMG-CoA reductase inhibitors-atorvastatin, lovastatin, pravastatin, rosuvastatinand simvastain: pharmacological,pharmacokinetic and analytical overview anddevelopment of a new method for use inpharmaceutical formulations analysis and invitro metabolism studies, Blomed. Chromatogr.,2006, 20, 282-293.
6. Bharat G. C., Natvarlal M. P., Paresh B. S.,Determination of Simvastatin, Pravastatin
Sodium and Rosuvastatin Calcium in TabletDosage Forms, Ind. J. Phar. Sci., 2007, 130 -132.
7. Hull C. K., Martin P. D., Warwick M. L.,Thomas E., Quantification of the N-desmethylmetabolite of rosuvastatin in human plasma byautomated SPE followed by HPLC with tandemMS detection, J. Pharm. Biomed. Anal., 2004,35, 609-614.
8. Lee E., Ryan S., Birmingham B., Zalikowski J.,March R., Ambrose H., Moore R., Lee C., ChenY., Schneck D., Rosuvastatin pharmacokineticsand pharmacogenetics in white and Asiansubjects residing in the same environment, Clin.Pharmacol. Ther., 2005, 78, 330-341.
9. Jamil S., Ansari T. A., Sing R. M., Mathur S. C.,Nivoria C. S., Pandey M. K., Sing G. N.,Determination of rosuvastatin calcium by RP-HPLC method, Indian Drugs, 2005, 42, 98-101.
10. 0udhoff K. A., Sangster T., Thomal S. E.,Wilson L. D., Application of microbore HPLC incombination with tandem MS for thequantification of rosuvastatin in human plasma,J. Chromatogra. B, 2006, 832, 191-196.
11. Ansari T. A., Jamil S., Sing R. M., Mathur S. C.,Kumar Y., Sing G. N., Specroscopic estimationof rosuvastatin calcium in tablet formulation,Indian Drugs, 2005, 42, 244-245.
12. Ravi T., Raja R. K., Ramesh M., Nuggehally RS., Simultaneous determination of rosuvastatinand fenofibric acid in human plasma by LC–MS/MS with electrospray ionization: Assaydevelopment, validation and application to aclinical study, J Phar. Bio. Ana., 2005, 39, 3-4,661-669.
Hasumati A. Raj et al /Int.J. ChemTech Res.2009,1(3) 689
13. Sonu S. S., Kuldeep S., Harshvardhan P.,Mallish J., Hiten S., Sapna G., Purav T., NimeshP., Prakash S., Lohray B. B., Estimation ofRosuvastatin in Human Plasma by HPLCTandem mass Spectroscopic method and itsApplication to Bioequivalence Study, J. Braz.Chem. Soc, 2005, 16, 4, 723-726.
14. International paten 027530, Teva pharmaceuticalindustries ltd. Pub. 03/17/2005.
15. US paten 7244844, Teva pharmaceutical Ltd.Pub. 07/17/2007.
16. Suslu I., Celebier M., Altinozz S., Determinationof Rosuvastatin in Pharmaceutical Formulationsby Capillary Zone Electrophoresis.,Chromatographia, 2007, 66, 1, 65-72.
17. International Conference on Harmonization(ICH) of Technical Requirements forRegistration of Pharmaceuticals for Human Use(1996) Guideline on Validation of Analytical
Procedure-Methodology, ICH, Geneva,Switzerland
18. International Conference on Harmonization(ICH) of Technical Requirements forRegistration of Pharmaceuticals for Human Use(2003) Guideline on Validation of AnalyticalProcedure-Methodology, ICH, Geneva,Switzerland
19. Singh S., Bakshi M. Pharm. Technol., 2005, 24,1 –14.
20. Snyder L. R., Kirkland J. J., Glaich J. L.,Practical HPLC method development andvalidation, 2nd edn. Wiley, New York, 1997, 765
21. Linday S. High performance liquidchromatography, 2nd edn. Wiley, New York,1992, 337
22. FDA, center of Drug Evaluation and Research.Reviewer guidance: validation ofchromatographic methods, Rockville, MD. 1994.
*****