validation of a modified parallel compressor model for
TRANSCRIPT

University of Tennessee, Knoxville University of Tennessee, Knoxville
TRACE: Tennessee Research and Creative TRACE: Tennessee Research and Creative
Exchange Exchange
Masters Theses Graduate School
12-2014
Validation of a Modified Parallel Compressor Model for Prediction Validation of a Modified Parallel Compressor Model for Prediction
of the Effects of Inlet Swirl on Compressor Performance and of the Effects of Inlet Swirl on Compressor Performance and
Operability Operability
Reggie Floyd University of Tennessee - Knoxville, [email protected]
Follow this and additional works at: https://trace.tennessee.edu/utk_gradthes
Part of the Mechanical Engineering Commons
Recommended Citation Recommended Citation Floyd, Reggie, "Validation of a Modified Parallel Compressor Model for Prediction of the Effects of Inlet Swirl on Compressor Performance and Operability. " Master's Thesis, University of Tennessee, 2014. https://trace.tennessee.edu/utk_gradthes/3149
This Thesis is brought to you for free and open access by the Graduate School at TRACE: Tennessee Research and Creative Exchange. It has been accepted for inclusion in Masters Theses by an authorized administrator of TRACE: Tennessee Research and Creative Exchange. For more information, please contact [email protected].
To the Graduate Council:
I am submitting herewith a thesis written by Reggie Floyd entitled "Validation of a Modified
Parallel Compressor Model for Prediction of the Effects of Inlet Swirl on Compressor
Performance and Operability." I have examined the final electronic copy of this thesis for form
and content and recommend that it be accepted in partial fulfillment of the requirements for the
degree of Master of Science, with a major in Mechanical Engineering.
Trevor Moeller, Major Professor
We have read this thesis and recommend its acceptance:
Milt Davis, James Simonton
Accepted for the Council:
Carolyn R. Hodges
Vice Provost and Dean of the Graduate School
(Original signatures are on file with official student records.)

Validation of a Modified Parallel Compressor
Model for Prediction of the Effects of Inlet Swirl
on Compressor Performance and Operability
A Thesis Presented for the
Master of Science
Degree
The University of Tennessee, Knoxville
Reggie Floyd
December 2014

ii
DEDICATION
I would like to dedicate this work to my parents, Reginald and Leona Floyd, for
without their constant support and emphasis on continued learning, this would
not have been possible.

iii
ACKNOWLEDGEMENTS
I would like to thank all those that helped and provided their support during the
preparation of this thesis. First and foremost, I would like to thank Dr. Milt Davis
for providing the thesis topic as well as the continuous guidance and assistance
during the preparation. His immense knowledge on the subject at hand was
invaluable to the process. I would also like to thank Chris Davis for providing
countless hours of technical support. His knowledge of the code used in this
thesis was a great help to me. I would also like to thank the Major Professor of
my thesis committee, Dr. Trevor Moeller, and thesis committee member, Dr.
James Simonton. Their support during the preparation of this thesis was vital. I
would also like to thank Arnold Air Force Base for providing time and resources
to complete this thesis.

iv
ABSTRACT
Engine inlet distortion complications have plagued the turbine engine
development community for decades, and engineers have developed countless
methods to identify and combat the harmful effects of inlet distortion. One such
type of distortion that has gained much attention in recent years is known as inlet
swirl, which results in a significant flow angularity at the face of the engine. This
flow angularity can affect the pressure rise and flow capacity of the fan or
compressor, and subsequently affect compressor and engine performance.
Previous modeling and simulation efforts to predict the effect inlet swirl
can have on fan and compressor performance have made great strides, yet still
leave a lot to be desired. In particular, a one-dimensional parallel compressor
model called DYNTECC (Dynamic Turbine Engine Compressor Code) has been
used to analyze the effects of inlet swirl on fan and performance operability of the
Honeywell F109 turbofan engine. However, when compared to experimental
swirl data gathered at the United States Air Force Academy (USAFA), the model
predictions were found to be inaccurate.
This thesis documents work done to compare the initial predictions
generated by DYNTECC to the latest set of experimental swirl data, analyze the
potential shortcomings of the initial model, and modify the existing model to more
accurately reflect test data. Extensive work was completed to create a
methodology that can calibrate the model to existing clean inlet fan map data. In
addition, an in depth study of fan/compressor stalling criteria was conducted, and
the model was modified to use an alternate stalling criteria that more accurately

v
predicted the point of stall for various swirl inlet conditions. The prediction of the
fan stall pressure ratio for all inlet swirl conditions tested is within 2% of the
ground test stall point at the same referred fan speed and referred mass flow.
vi
TABLE OF CONTENTS
1.0 Introduction .................................................................................................... 1
1.1 Turbine Engine Modeling ............................................................................ 1
1.2 Inlet Swirl ..................................................................................................... 2
1.3 Presentation Of Results .............................................................................. 6
2.0 Literature Review ............................................................................................ 8
2.1 Effects Of Swirl On Engine Performance And Operability ........................... 8
2.2 Investigation Of Stall Criteria For Swirl ...................................................... 10
2.2.1 Diffusion Factor ................................................................................... 10
2.2.2 Diffusion Ratio .................................................................................... 13
2.2.3 Static Pressure Rise Coefficient ......................................................... 15
2.2.4 De Haller Number ............................................................................... 16
2.3 Conclusions From Literature Review ......................................................... 17
2.4 Problem Statement .................................................................................... 17
3.0 Background ................................................................................................... 19
3.1 Dyntecc/Parallel Compressor Theory ........................................................ 19
3.2 Mean Line Theory ..................................................................................... 23
3.3 Previous M&S Investigation....................................................................... 26
3.4 F109 Turbofan Engine ............................................................................... 37
3.4.1 Engine History .................................................................................... 37
3.4.2 USAFA Swirl Investigations ................................................................ 38
4.0 Approach ...................................................................................................... 41
4.1 Outline Of Approach .................................................................................. 41

vii
4.2 Implementation Of Graphical User Interface ............................................. 42
4.3 USAFA Test Data Comparison .................................................................. 43
4.4 Model Calibration To Test Data ................................................................. 49
4.5 Stall Criteria Investigation .......................................................................... 53
5.0 Results .......................................................................................................... 59
5.1 Bulk Swirl................................................................................................... 60
5.2 Paired Swirl ............................................................................................... 63
6.0 Conclusions And Recommendations ............................................................ 66
List Of References .............................................................................................. 68
Vita ...................................................................................................................... 73

viii
LIST OF TABLES
Table 1. USAFA Test Configurations .................................................................. 39
Table 2. Alternate Diffusion Ratio Comparison…………………………………….54

ix
LIST OF FIGURES
Figure 1. Definition of Swirl Angle ......................................................................... 3
Figure 2. Swirl Pattern Definitions ......................................................................... 4
Figure 3. Sample Compressor Map ...................................................................... 7
Figure 4. Diffusion Factor/Loss Relationship [8] ................................................. 11
Figure 5. Diffusion Ratio/Momentum Thickness Relationship [8] ........................ 14
Figure 6. Parallel Compressor Theory ................................................................ 19
Figure 7. DYNTECC Control Volume Concept [15] ............................................. 20
Figure 8. Axial Compressor Velocity Triangle [11] .............................................. 25
Figure 9. Modified DYNTECC Approach ............................................................ 27
Figure 10. Average Stalling Diffusion Factor [11] ................................................ 28
Figure 11. F109 Normalized Fan Map [11] ......................................................... 29
Figure 12. F109 Loss and Deviation Maps [11] .................................................. 30
Figure 13. Cycle Deck Clean Inlet Model Validation, Normalized [11] ................ 31
Figure 14. USAFA Data Clean Inlet Model Validation, Normalized [11] .............. 32
Figure 15. Normalized Co-Swirl Initial Predictions [11] ....................................... 33
Figure 16. Normalized Counter-Swirl Initial Predictions [11] ............................... 34
Figure 17. Normalized 53% Twin Swirl Initial Predictions [11] ............................ 35
Figure 18. Normalized 71% Twin Swirl Initial Predictions [11] ............................ 36
Figure 19. F109 Turbofan Engine [6] .................................................................. 37
Figure 20. F109 Nozzle Flow Plug ..................................................................... 39
Figure 21. AEDC-Supplied Swirl Generators ..................................................... 40
Figure 22. Updated DYNTECC/MLC GUI ........................................................... 43

x
Figure 23. Normalized Clean Inlet Pre-Test Prediction ....................................... 44
Figure 24. Normalized Bulk Swirl (+10deg) Pre-Test Prediction ......................... 45
Figure 25. Normalized Bulk Swirl (+14deg) Pre-Test Prediction ......................... 45
Figure 26. Normalized Bulk Swirl (-14deg) Pre-Test Prediction .......................... 46
Figure 27. Normalized Twin Swirl (5deg) Pre-Test Prediction ............................ 46
Figure 28. Normalized Twin Swirl (9deg) Pre-Test Prediction ............................ 47
Figure 29. Rotor Loss and Deviation Effect on Pre-Test Predictions .................. 48
Figure 30. Normalized Clean Inlet Model Calibration .......................................... 50
Figure 31. Normalized Bulk Swirl (+10deg) Model Calibration ............................ 51
Figure 32. Normalized Bulk Swirl (+14deg) Model Calibration ............................ 51
Figure 33. Normalized Bulk Swirl (-14deg) Model Calibration ............................. 52
Figure 34. Normalized Twin Swirl (5deg) Model Calibration ............................... 52
Figure 35. Normalized Twin Swirl (9deg) Model Calibration ............................... 53
Figure 36. Alternate Diffusion Ratio Method ....................................................... 55
Figure 37. Stall Criteria Comparison, Normalized ............................................... 57
Figure 38. Stall Criteria Precision ........................................................................ 58
Figure 39. Normalized Clean Inlet Final Prediction ............................................. 60
Figure 40. Normalized Bulk Swirl (+10deg) Final Prediction ............................... 61
Figure 41. Normalized Bulk Swirl (+14deg) Final Prediction ............................... 62
Figure 42. Normalized Bulk Swirl (-14deg) Final Prediction ................................ 63
Figure 43. Normalized Twin Swirl (5deg) Final Prediction .................................. 64
Figure 44. Normalized Twin Swirl (9deg) Final Prediction .................................. 65
xi
NOMENCLATURE
α Swirl angle
β1 Inlet relative flow angle
β2 Blade exit relative velocity flow angle
β1op Inlet relative flow angle at operating line (minimum loss condition)
β2op Blade exit relative velocity flow angle (minimum loss condition)
β2’ Blade exit metal angle
γ Ratio of specific heats
δ Blade exit angle deviation
ΔPRS Loss in stability pressure ratio
v 1 Blade inlet absolute tangential velocity
v 1R Blade inlet relative tangential velocity
v 2 Blade exit absolute tangential velocity
v2R Blade exit relative tangential velocity
ρ Density
σ Blade solidity
ω Blade relative total pressure loss
Φ Pressure loss coefficient
A Area
AEDC Arnold Engineering Development Complex
AIP Aerodynamic interface plane
CFD Computational fluid dynamics
cp Specific heat at constant pressure

xii
Cp Static pressure rise coefficient
DF Rotor diffusion factor
DFm Rotor diffusion factor (compressibility effect)
DR Rotor diffusion ratio (stalled condition)
DRop Rotor diffusion factor (minimum loss condition)
DH De Haller number
DYNTECC Dynamic Turbine Engine Compressor Code
E Energy function
e Internal energy
Fb Blade force
Fx Axial force distribution acting on the control volume
HB Total enthalpy of the bleed flow
i Incidence angle
iop Incidence angle at operating line (minimum loss condition)
IGV Inlet guide vanes
IMP Impulse Function
M1R Inlet relative Mach Number
MFF Mass flow function
MLC 1-D Mean Line Code
PR Stage pressure ratio
PR1 Undistorted stability pressure ratio
PRDS Distorted stability pressure ratio
Ps Static pressure

xiii
P1 Blade inlet total pressure
P2 Blade exit total pressure
Q Rate of heat addition to the control volume
SW Rate of shaft work
TR Stage temperature ratio
T1 Inlet total temperature
U Axial velocity vector
Ux Velocity vector normal to AIP
Uθ Circumferential velocity vector
U1 Blade entrance wheel speed
U2 Blade exit wheel speed
USAFA United States Air Force Academy
V1 Blade inlet absolute velocity
V1R Blade inlet relative velocity
V2 Blade exit absolute velocity
V2R Blade exit relative velocity
VA1 Blade inlet axial velocity
VA2 Blade exit axial velocity
W Mass flow rate
WB Inter-stage bleed mass flow per distributed length

1
1.0 INTRODUCTION
1.1 TURBINE ENGINE MODELING
Modeling and simulation is an integral part of the test and evaluation
process currently found throughout the aerospace and turbine engine industry.
Modeling and simulation can act as a perfect complement to testing; it can
predict outcomes from the test beforehand while also validating and verifying
results from the test. A model is a physical, mathematical, or logical
representation of a system, entity, or process. The model implemented over
some axis of change is known as a simulation. Together, they can provide a
powerful tool for learning and decision making in any realm. There are two types
of models, empirical and theoretical. Empirical models are based on data or
observations of the phenomena under investigation and are probabilistic in
nature. Theoretical models are physics-based, derived from an understanding of
the theory behind the process under investigation, and are deterministic in
nature. DYNTECC, the modeling and simulation tool at the heart of this work is a
hybrid of these two model types, coupling empirical elements with the theoretical
base to add precision. DYNTECC can be used for investigating a host of
performance and operability issues plaguing turbine engines of today.
Turbine engines in aerospace applications generate thrust by
compressing incoming air in the engine inlet and compressor, mixing the
compressed air with fuel and igniting the mixture in the combustor, then
expanding the high pressure/temperature air through a turbine and nozzle at the
2
exit of the engine. Axial flow compressors are the most common type of
compressor found in today’s larger commercial and military aerospace turbine
engines [1]. Axial flow compressors compress the air by passing it through a
series of rotating airfoils called rotor blades and stationary airfoils called stator
vanes. Rotor blades have an angle of attack called the incidence angle. The
incidence angle is the angle between the velocity of the flow relative to the rotor
blade and the camber line of the rotor blade [1]. Performance and operability of
the compressor is highly dependent on changes in the flow entering the
compressor, such as pressure and temperature distortion and flow angularity. If
the pressure across the compressor is increased substantially, or if the incidence
angle of the rotor blades becomes too great, flow over the rotor blades will
separate from the surface to initiate blade stall, which can permeate throughout
the compression system and cause damage to the engine.
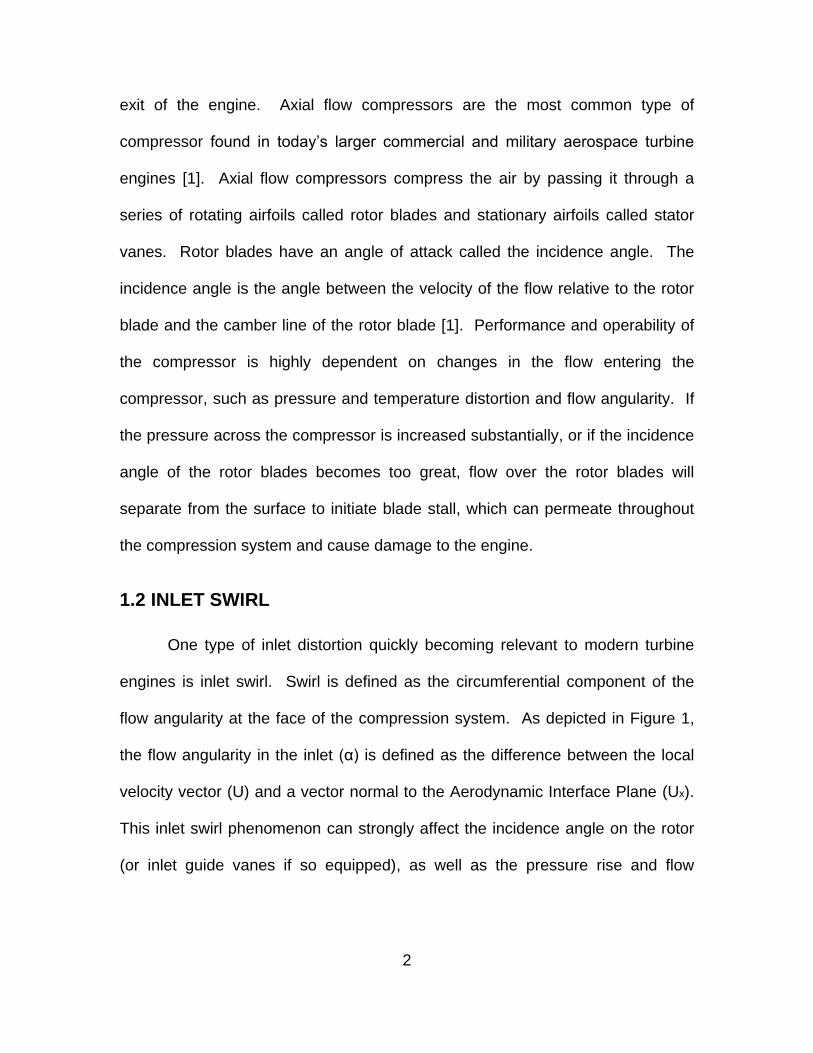
1.2 INLET SWIRL
One type of inlet distortion quickly becoming relevant to modern turbine
engines is inlet swirl. Swirl is defined as the circumferential component of the
flow angularity at the face of the compression system. As depicted in Figure 1,
the flow angularity in the inlet (α) is defined as the difference between the local
velocity vector (U) and a vector normal to the Aerodynamic Interface Plane (Ux).
This inlet swirl phenomenon can strongly affect the incidence angle on the rotor
(or inlet guide vanes if so equipped), as well as the pressure rise and flow

3
capacity of the fan or compressor. Swirl has been known to have a strong effect
on compressor performance, and can materialize in several forms.
Figure 1. Definition of Swirl Angle
The first type of swirl is known as bulk swirl. Bulk swirl is made up of a
singular swirl pattern relative to the AIP, and can come in two forms, co-rotating
and counter-rotating [2]. If the incoming flow to the engine is rotating in the same
direction as the compressor rotation, it is called a co-rotating swirl, where
aerodynamic loading is decreased and the aerodynamic stability margin is
increased. If the flow approaching the compressor is rotating in the opposite
direction to the compressor rotation, then it is referred to as counter-rotating
swirl, where aerodynamic loading increases and the margin of aerodynamic
stability is reduced. Paired swirl is the confluence of two bulk swirl patterns
(counter-rotating and co-rotating) and is found in two forms, offset and twin [2].
Twin swirl consists of symmetric and opposing swirl patterns, while offset swirl
features non-symmetric and opposing swirl patterns. Both cause an increase in
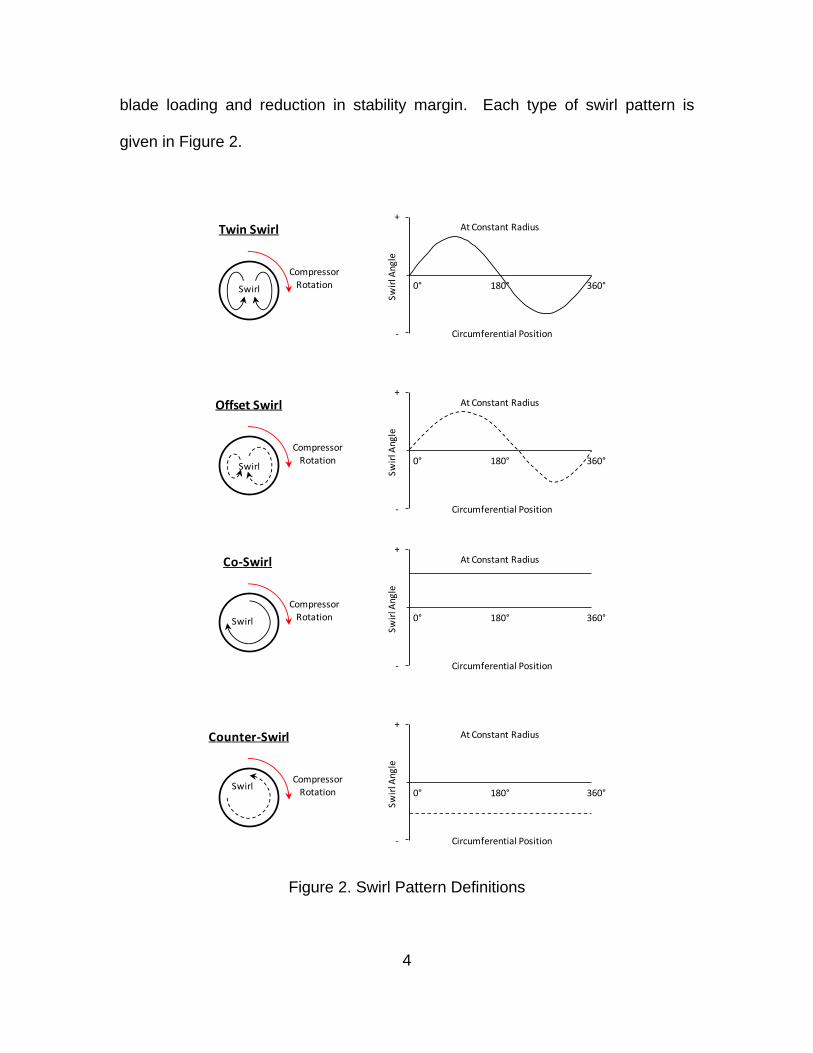
4
blade loading and reduction in stability margin. Each type of swirl pattern is
given in Figure 2.
Figure 2. Swirl Pattern Definitions
Swirl
Compressor Rotation
Twin Swirl
0° 360°180°
+
-
Swir
l Ang
le
Circumferential Position
At Constant Radius
Swirl
Compressor Rotation
Offset Swirl
0° 360°180°
+
-
Sw
irl A
ng
le
Circumferential Position
At Constant Radius
Swirl
Compressor Rotation
Co-Swirl
0° 360°180°
+
-
Swir
l Ang
le
Circumferential Position
At Constant Radius
Compressor Rotation
Swirl
Counter-Swirl
0° 360°180°
+
-
Swir
l Ang
le
Circumferential Position
At Constant Radius

5
One way to combat the effects of inlet swirl is the use of inlet guide vanes.
Inlet guide vanes (IGVs) are used in many modern-day turbine engines to
change the angle of the flow entering the compressor at the AIP. They are placed
directly in front of the first rotor blade stage. IGVs are designed to add co-
rotating swirl (swirl angle greater than zero) to the flow impinging on the rotor,
which theoretically will move the compressor away from stall [3]. In the not-too-
distant past it was not deemed necessary to simulate inlet swirl effects on turbine
engines because of the relatively straight inlet systems found on most aircraft.
Also, the development of IGVs for turbine engine designs was thought to negate
the effects of swirl. However, many current and future military aircraft designs
utilize S-shaped inlet ducts with sharp bends into the engine inlet systems for the
sake of low observance and other stealth initiatives permeating the defense
community. The S-shaped inlet ducts can produce swirl.
Investigations have been performed to characterize the effects that S-
shaped ducts may have on the flow properties at the AIP of turbine engines [3].
It has been found that the swirl generated by the S-shaped duct can be severe
enough to cause flow separation on the IGVs, which can cause an additional loss
in engine stability margin. Although engines without IGVs are more sensitive to
swirl at the AIP than those with IGVs, these studies showed that no engine is
perfectly immune to the effects of inlet swirl. Several methods for simulating inlet
swirl in turbine engine ground tests are currently under development at the
Arnold Engineering Development Complex (AEDC) [4]. Evaluating the effect of
inlet swirl on turbine engine compressor performance during ground tests,

6
coupled with targeted modeling and simulation techniques, would reveal engine
performance and operability issues before initial flight testing.
1.3 PRESENTATION OF RESULTS
All results will be presented using a figure known as a fan/compressor
map. Its use in the turbine engine community is widespread, and allows for a
fairly simple depiction of fan/compressor performance and operability. A sample
compressor map is given in Figure 3. The vertical axis is in terms of the total
pressure ratio across the fan or compressor, while the horizontal axis is in terms
of corrected (referred) mass flow. Lines of constant fan speed are plotted across
the map, originating from a diagonal line known as the Operating Line, and
terminating at the Stall/Surge Line. It is also common to display lines of
efficiency on the same plot, but for the purpose of this investigation, that
information is omitted.
All F109 technical data and related model predictions presented in
this report have been normalized to protect the proprietary nature of the
F109 engine and its performance characteristics. Fan map axis values are
given as a percentage of an arbitrarily chosen value that is not reported in
this document.

7
Figure 3. Sample Compressor Map

8
2.0 LITERATURE REVIEW
2.1 EFFECTS OF SWIRL ON ENGINE PERFORMANCE AND
OPERABILITY
Modern military fighter aircraft are becoming more and more susceptible
to the effects of inlet swirl due to the gravitation towards the use of S-shaped inlet
ducting, however the problem is not entirely new. Legacy platforms such as the
General Dynamics F-111 and Panavia Tornado experienced flight test
interruptions due to complications from inlet swirl at extreme flight maneuvers.
The Tornado encountered stall in both engines at several different flight
conditions during developmental flight testing attributed to swirl introduced by the
inlet duct [5]. As a result, extensive research was conducted to not only mitigate
the effects of swirl, but to also produce ways to simulate the inlet swirl patterns
more accurately during ground test. Aulehla offers, in Reference 5, a compilation
of the main findings of these investigations, and was able to draw conclusions
from those results. It was found that the inlets on most conventional supersonic
fighter aircraft generate some sort of swirl. It was also found that bulk swirl
created by the engine inlet could be eliminated by using intake fences. However,
researchers noticed that the intake fences were less effective against paired swirl
because of the unstable nature of paired swirl [5]. The Tornado experience
proved that means for generating and predicting swirl during ground test were
necessary for military engines both with and without inlet guide vanes.

9
Much work has been conducted at AEDC to address some of the
problems magnified by the Tornado experience. As a premier turbine engine
ground test facility, the need for quality swirl generation techniques has been
realized. Beale, et. al. [6] detailed two types of swirl generators currently under
development at AEDC. Concepts employing turning vanes are under
investigation for generating bulk swirl and twin swirl, while a swirl chamber is
under investigation for the generation of twin swirl [6]. Turning vanes resemble a
set of inlet guide vanes and feature variable blade incidence angle and twist
angle in order to provide remotely variable swirl angles at the face of the engine
[6]. The swirl chamber operates in place of a bellmouth and forces the flow to
enter the inlet duct tangentially so that an internal circumferential flow is
established [6]. The swirl angle is changed by varying the entrance openings of
the swirl chamber. Both concepts have been analyzed using computational fluid
dynamics and functional prototypes are under development. The bulk and twin
swirl generators used to produce the test data contained in this report are
described briefly in Section 3.4.2.
Simultaneous to the development of the swirl generator concepts, a
parallel effort to predict the effects of swirl computationally has been sought.
Beale, et. al. [6] have used several numerical methods to predict the effects of
inlet swirl on fan performance of an F109 turbofan engine. The three methods
used were one-dimensional mean line analysis, parallel compressor analysis,
and three-dimensional Euler analysis. The authors used the one-dimensional
mean line analysis and the three-dimensional Euler analysis to predict the effects

10
of co- and counter- bulk swirl on fan performance. The authors used the results
from the mean line analysis to develop scaling factors that were used in the
parallel compressor analysis. The parallel compressor analysis was then used to
evaluate the effects of co- and counter- bulk swirl as well as twin swirl on parallel
compressor performance [6]. An extension of this work was provided by Fredrick
[11], where the one-dimensional mean line code was integrated with the parallel
compressor code to more efficiently predict inlet swirl.
2.2 INVESTIGATION OF STALL CRITERIA FOR SWIRL
An extensive search was conducted to find the most suitable stall criteria
for inlet swirl model predictions. While the original DYNTECC model used stage
characteristic maps to determine compressor stall, recent work by Fredrick
implemented a new stall determination technique provided by the embedded
one-dimensional mean line code. Traditionally recognized in industry as the
standard stall criteria, the diffusion factor was chosen as the method to determine
stall in the modified DYNTECC/MLC model. Realizing that there have been a
host of stall criteria definitions theorized in the last half century, several methods
were studied and evaluated for their usefulness under inlet swirl conditions.
2.2.1 DIFFUSION FACTOR
The principal reason for losses in the flow across axial flow compressor
blade rows is due to the separation of the friction boundary layers on the suction
surface of the blades. The most important development in assessing this blade

11
separation is the diffusion factor developed by Lieblein in 1953 [7]. Equation 1 is
the most common form of Lieblein’s diffusion factor, and is defined based on inlet
and exit blade velocities, along with a given blade solidity (σ).
(1)
There is a direct correlation between total pressure loss and blade
diffusion (separation), which is measured by the diffusion factor. For diffusion
factors above roughly 0.6, there is a steep rise in the total pressure loss, as
shown in Figure 4. Because of this, the diffusion factor is generally found to be
no more than 0.6 at stall condition [8]. DYNTECC was originally modified to use
rotor diffusion factor as the stalling criteria. The rotor diffusion factor is calculated
by the 1-D mean line code and passed along to the main DYNTECC routine.
Figure 4. Diffusion Factor/Loss Relationship [8]

12
Schobeiri suggested that the traditional diffusion factor can and should be
manipulated to include the effect of compressibility on the flow through the
blades, and thus the diffusion factor [9]. Equation 2 is the expression derived by
Schobeiri as an extension of Lieblein’s groundbreaking work. The term in
brackets, which is heavily influenced by the inlet relative Mach number, is simply
multiplied by the final term of the original diffusion factor definition.
(2)
A final modification to the traditional diffusion factor can be made to
account for the dynamic nature of compressor performance at and near stall.
While DYNTECC typically uses steady state characteristic maps to solve the
governing equations (see Section 3.1), Reference 10 provides a discussion of
techniques available for modeling the highly dynamic compressor characteristics
near stall. For a dynamic event such as rotating stall or surge, the use of time-
averaged steady state characteristics is not necessarily correct. In the rotating
stall region, rotating stall develops very rapidly and the globally steady
characteristic is no longer applicable [10]. To provide a dynamic approximation
of stall, a first order time lag on the diffusion factor can be incorporated into the
modeling technique in the rotating stall region. The first order lag equation used
is given in Equation 3.

13
(3)
The time constant, tau (τ), essentially allows for the delay of stall
determination to offset any error incurred by the use of time-averaged steady
state stage characteristics. For the purpose of this investigation, tau was
arbitrarily chosen so that the model predicted stalling diffusion factor at clean
inlet conditions would allow the model to reach the clean inlet data stall limit.
Nevertheless, this first order lag equation can only at best delay stall compared
to the steady state approximation, limiting its usefulness in this particular inlet
swirl investigation due to the mix of over- and under-prediction of stall relative to
test data using the model created by Fredrick [11].
2.2.2 DIFFUSION RATIO
Several years after developing the diffusion factor, Lieblein published his
follow-on work that described another method of correlating blade performance
to blade loss and separation. The diffusion ratio, which is the ratio of peak blade
exit velocity to the mean blade exit velocity, is a natural extension of the diffusion
factor. Lieblein found that this new diffusion ratio correlated well with his earlier
stall prediction technique at incidence angles above the minimum loss condition
[12]. The standard diffusion ratio at stall is given by Equation 4. This equation is
empirical in nature, and was derived from extensive cascade testing of 65-series
and C.4 circular arc blade shapes [12]. Theoretically, this expression should

14
have a greater influence of swirl angle resulting from the introduction of inlet and
outlet flow directions at stall (β), as well as the change in incidence angle (i).
(4)
Much like the diffusion factor, there is a direct correlation between total
pressure loss and blade diffusion (separation), which is also measured by the
diffusion ratio. For diffusion ratios above roughly 2.0, there is a steep rise in the
momentum thickness, as shown in Figure 5. An increase in momentum
thickness can correspond to an increase in blade separation, leading to higher
losses across the blade. Because of this, the diffusion ratio is generally found to
be no more than 2.0 at stall condition [8].
Figure 5. Diffusion Ratio/Momentum Thickness Relationship [8]

15
In the same 1957 report, Lieblein also offered an alternate definition of the
standard diffusion ratio that can be used if given an alternate set of known inputs.
The previous diffusion ratio expression is only valid if the inlet and outlet flow
angles at stall are known. However, if the relative flow angles are known only at
the minimum loss condition, a new expression would be necessary [12]. The
diffusion ratio calculation given in Equation 5 differs from the previous in that the
inlet and outlet relative flow angles are expressed in terms of the minimum loss
condition, which, for the purposes of this investigation, is assumed to be found at
the operating line. Nonetheless, the change in incidence angle at stall will still
need to be gathered.
(5)
2.2.3 STATIC PRESSURE RISE COEFFICIENT
It was recognized by Koch and Smith that compressor stall was
dependent on end-wall effects (clearances) and blade aspect ratio, which the

16
traditional diffusion factor does not take into account. The static pressure rise
coefficient was developed to account for these shortcomings of the standard
diffusion factor and ratio [13]. A host of empirically developed modifications can
be applied to this equation that take into account Reynolds number, tip
clearances, and axial blade spacing. These modifications are explained in depth
in Reference 13. The simplified version of the static pressure rise coefficient is
given in Equation 6.
(6)
2.2.4 De HALLER NUMBER
De Haller brought a simplified approach to the discussion of blade
diffusion. He noted that the primary purpose of any compressor stage is to
diffuse the fluid, leading to an increase in static pressure. The more the fluid is
decelerated, the larger the pressure rise, leading to potential flow separation and
stall [8]. The most basic of the blade stall correlations, the de Haller number
(Equation 7) is the overall deceleration (diffusion) ratio across the rotor in terms
of relative velocity. The de Haller number is generally found to be no less than
0.72 at stall condition.

17
(7)
2.3 CONCLUSIONS FROM LITERATURE REVIEW
Turbine engine inlet integration issues brought on by inlet swirl distortion
have plagued the developmental community for decades, with no signs of easing
in the coming years. Several military fighter aircraft programs, such as the
Tornado, have struggled with simulating and quantifying the effects of inlet swirl,
and future programs will have to address the issue due to the advent of the S-
shaped inlet. AEDC is at the forefront of the turbine engine testing community,
and extensive work has been conducted to develop vital tools that will aid in the
understanding of inlet swirl effects on engine performance. Swirl generators are
under development and are poised to be an instrumental player in the turbine
engine ground test process. In addition, computational tools to predict and
evaluate the effects of inlet swirl are continuing to improve in terms of efficiency
and accuracy.
2.4 PROBLEM STATEMENT
The goal of the work reported herein was to modify the combined
DYNTECC/MLC developed by Fredrick so that the model predictions generated
for inlet swirl compared more favorably with acquired test data. Efforts to correct

18
this problem include calibrating to the clean inlet test data and investigating the
stall determination technique. The modified DYNTECC/MLC is to be used to
analyze the effects of different types of bulk and paired swirl on F109 fan
performance and operability with improved accuracy.

19
3.0 BACKGROUND
3.1 DYNTECC/PARALLEL COMPRESSOR THEORY
One type of compressor model commonly used to investigate inlet
distortion is called a parallel compressor model. Parallel compressor models
divide the compressor control volumes into parallel or circumferential segments
that can be specified to have separate inlet boundary conditions [14]. Despite the
distinct inlet boundary conditions, each segment will arrive at the same exit
boundary condition, and an illustration of this concept can be found in Figure 6.
Figure 6. Parallel Compressor Theory
DYNTECC (Dynamic Turbine Engine Compressor Code) is a one-
dimensional model that utilizes the parallel compressor theory to investigate the
effect of inlet distortion on the compression system stability limit [15]. Each
compression stage is divided into elemental control volumes, allowing DYNTECC
to model the test article on a stage by stage basis. Inlet and exit boundary

20
conditions of the overall compression system are input to DYNTECC by the user,
and both static pressure and Mach number can be used as the specified exit
boundary condition. Quasi one-dimensional mass, momentum, and energy
conservation equations are solved using a finite difference numerical technique
at each stage or elemental control volume. The control volume concept used by
DYNTECC is depicted in Figure 7. Source terms are supplied by stage pressure
and temperature characteristic maps, and are used to provide closure for the
momentum and energy equations with stage forces and shaft work values [15].
Figure 7. DYNTECC Control Volume Concept [15]

21
The foundation of DYNTECC is built upon the one dimensional forms of
the mass, momentum, and energy conservation equations. The one dimensional
conservation of mass expression used by DYNTECC is given in Equation 8,
where ‘WB‘ is the inter-stage bleed flow per distributed length, ‘W’ is the mass
flow rate, ‘ρ’ is the density, and ‘A’ is the area [15].
(8)
The one dimensional conservation of momentum expression used by
DYNTECC is given in Equation 9, while the contained momentum impulse term
and axial force term are given in Equations 10 and 11 respectively. The axial
velocity is denoted by ‘u’, ‘Ps‘ is the static pressure, and ‘Fb‘ is the blade force
[15].
(9)
(10)
(11)
The one dimensional conservation of energy expression used by
DYNTECC is given in Equation 12, while the contained energy function is given

22
in Equation 13. The rate of shaft work is denoted by ‘SW’, ‘Q’ is the rate of heat
addition to the control volume, ‘HB‘ is the total enthalpy of the bleed flow, and ‘e’
is the internal energy [15].
(12)
(13)
Despite a host of user specified inputs provided at the onset of each
DYNTECC solution, there are still five unknowns contained in the three
conservation equations. During normal operation, DYNTECC uses the steady
state stage characteristic maps to obtain stage pressure ratio (PR) and
temperature ratio (TR) values which provide closure for the conservation
equations. DYNTECC then backs out steady state values for the axial stage
forces (FX) and rate of shaft work (SW) using equations 7 and 10, thus leaving
three unknowns and three equations, which can be easily solved. It is worthy to
note that this process is only useful for pre-stall operation, and is inaccurate for
post-stall operation [10].
DYNTECC was originally developed to only model inlet total pressure and
temperature distortion phenomena. During normal operation where only the
distortion pattern is altered, DYNTECC can apply the same set of stage

23
characteristic maps for all cases since the stage characteristic does not change
with inlet total pressure or temperature. However, the introduction of swirl will
change the incidence angle of the rotor blades, which consequently greatly alters
the clean inlet stage characteristics. In order to use DYNTECC to model swirl,
stage characteristic maps have to be developed for each individual swirl case,
which can prove to be tedious. An alternate solution was needed to more
efficiently model inlet swirl effects, and the one-dimensional mean line code was
chosen to streamline the process [11].
3.2 MEAN LINE THEORY
Instead of developing unique compressor characteristic maps in
DYNTECC for each individual inlet swirl case, it would be desirable to develop
the source terms for closure in the DYNTECC solver by an alternate function
within the parallel compressor code. The function chosen was a one-dimensional
mean line code that had been used for decades as a standalone product. In
2003, Grady Tibboel integrated a one-dimensional compressor stage
characteristics mean line code into a parallel compressor code called DYNTECC
[16], and Nick Fredrick applied this modified model to the investigation of inlet
swirl in 2010 [11].
The mean line code is a compressible, one-dimensional, steady-state
compressor model that simulates each blade row’s performance. The code uses
velocity diagrams, blade relative total pressure loss correlations, and blade exit
deviation correlations to develop individual stage characteristics. Like

24
DYNTECC, detailed blade geometry is not required. The mean line code has
four modes of operation, three of which use a Newton multi-variable method to
converge on a solution while the fourth method calculates the solution directly
based on inlet flow conditions, relative total pressure loss across the rotor blade,
and exit angle deviation [17].
The inlet total pressure, total temperature, Mach number, and swirl angle
are specified by the user. Inlet static pressure, static temperature, and the speed
of sound can be calculated using the user supplied values along with the
isentropic relations. Velocity triangles, like those shown in Figure 8, are used by
the mean line code to determine the inlet relative velocity, inlet relative flow
angle, and inlet relative Mach number. Isentropic relationships are then used to
calculate the inlet relative total pressure and relative total temperature. In order to
calculate the total pressure and temperature across the rotor, the relative mass
flow function (MFF), relative total temperature ratio, relative total pressure ratio,
and ratio of areas perpendicular to the flow must then be calculated [17]. A
detailed explanation of this process can be found in Reference 17.

25
Figure 8. Axial Compressor Velocity Triangle [11]
During normal operation, the relative total pressure loss and exit deviation
angle of the blade are calculated from open source empirical correlations internal
to the code. In addition, experimental data can be used to calibrate the blade
relative total pressure loss and exit deviation angle resulting in add-loss and add-
deviation maps. Using these values for loss and deviation, along with the inlet
flow conditions, allow for the determination of each stage characteristic for a
given solution. The ability to by-pass the correlations and look up the blade
relative total pressure loss and exit deviation angle directly from two-dimensional
tables was added by Fredrick [11].

26
Once integrated with DYNTECC, the mean line code can provide “real
time” source terms such as stage pressure and temperature ratio at a specified
operating condition. Instead of developing multiple maps for each individual swirl
case, DYNTECC can now call on the mean line code to determine the source
terms for any input swirl angle, inlet total pressure, or inlet total temperature.
DYNTECC passes total pressure, total temperature, Mach number, mass flow,
rotor speed, inlet and exit areas, and compressor exit static pressure to the mean
line code. The mean line code is then able to determine the loss and deviation
and calculate the stage pressure ratio and temperature ratio. The calculation of
the pressure ratio and temperature ratio in the mean line code replaces the
interpolation of pressure ratio and temperature ratio maps found in the original
version of DYNTECC [11].
3.3 PREVIOUS M&S INVESTIGATION
The work presented in this report is a direct extension of the work
performed by Nick Fredrick in 2010 [11]. A new version of the MLC was
incorporated into the parallel compressor model DYNTECC as a subroutine. As a
result, DYNTECC was able to use the MLC to calculate a point-by-point
representation of the stage characteristics internally without the use of
temperature and pressure characteristic maps, which was integral to the original
version of DYNTECC. Traditionally, DYNTECC would call upon a series of
temperature and pressure maps for each stage in order to generate total
compression system pressure and temperature ratios. The modified

27
DYNTECC/MLC approach now sends several inputs and parameters to the
internal mean line routine to generate pressure and temperature ratios for each
blade row, as well as a stall determination factor [11]. This modification to
DYNTECC is outlined in Figure 9.
Figure 9. Modified DYNTECC Approach

28
During normal operation employing stage characteristic maps, DYNTECC
analyzes the slope of stage characteristic map lines to determine when stall
occurs. Both DYNTECC and the MLC were modified to determine stage stall
without the use of the characteristic maps. The MLC was modified to output a
rotor diffusion factor while DYNTECC was modified to compare the rotor diffusion
factor to a user specified stalling diffusion factor. Historical sources show that
the rotor diffusion factor should be no more than 0.6 at stall. Frederick calibrated
the value used as the stalling diffusion factor by analyzing available clean inlet
F109 fan map data and the mean line code. The value varied across the fan
speeds analyzed, so the average was taken of all the stalling diffusion factors. A
value of 0.555 was used for all subsequent swirl model runs [11]. This value was
chosen as a matter of convenience by Fredrick, and was deemed sufficient for
the investigation at the time. A plot of the F109 fan map generated diffusion
factor values as a function of fan speed is shown in Figure 10.
Figure 10. Average Stalling Diffusion Factor [11]

29
Additional modifications were made to the MLC in order to by-pass blade
relative total pressure loss and deviation correlations and look up those values
directly from a user provided two-dimensional table. Stage characteristics
required for developing the relative total pressure loss and blade exit deviation
tables were obtained from the F109 cycle deck [11]. The F109 cycle deck was
run for several mass flow points along each speed line from 20% to 115% fan
speed to develop the loss and deviation look-up maps. Rotor and stator relative
total pressure loss and exit deviation angle tables were developed using a
standalone version of the MLC operating in a calibration mode. Using the data
generated from running the mean line code at all cycle deck points shown in
Figure 11, two-dimensional loss and deviation maps were produced for both the
rotor and stator [11]. The rotor specific maps are shown in Figure 12. Note that
the color gradients in the figure reflect the change in total pressure loss and exit
deviation as specified in the scales adjacent to each plot.
Figure 11. F109 Normalized Fan Map [11]

30
Figure 12. F109 Loss and Deviation Maps [11]
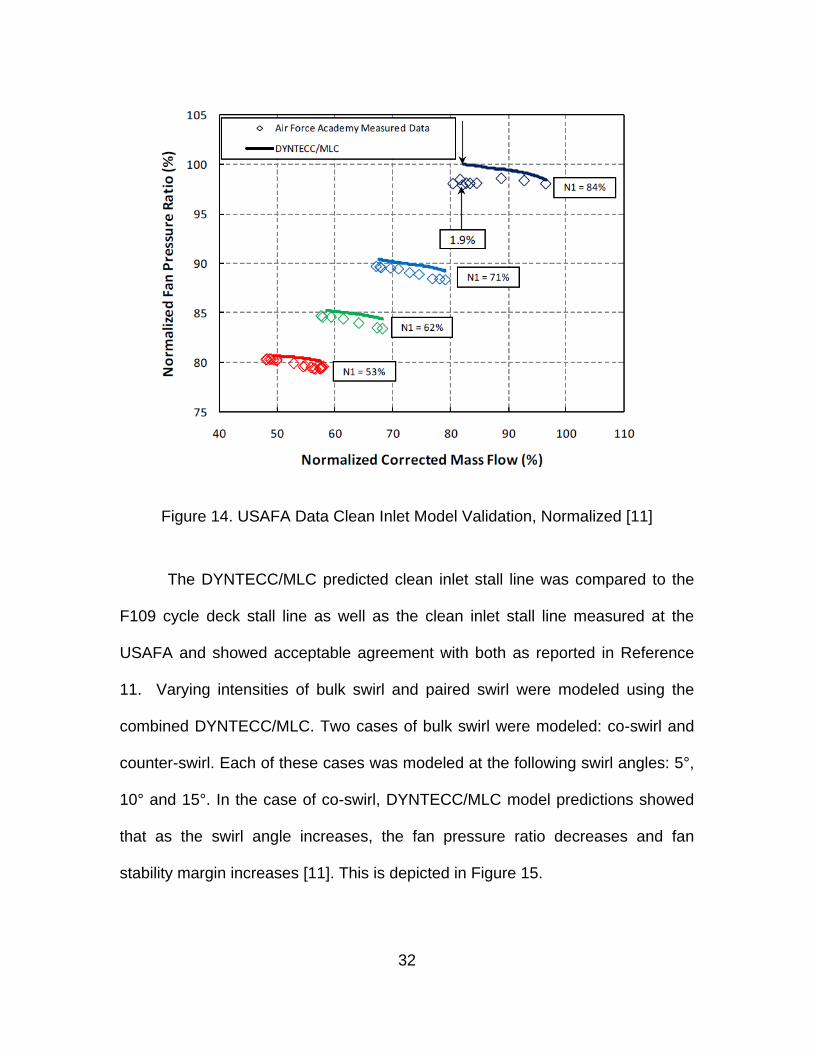
The combined DYNTECC/MLC model was validated by comparing clean
inlet predictions to the F109 cycle deck as well as clean inlet data obtained at the
USAFA. The DYNTECC/MLC predicted F109 fan pressure ratio was within 0.5%
of the F109 Cycle deck fan pressure ratio and was generally within 0.8% of the

31
USAFA measured fan pressure ratio at the same referred fan speed and referred
mass flow, as seen in Figure 13 and Figure 14 [11].
Figure 13. Cycle Deck Clean Inlet Model Validation, Normalized [11]
32
Figure 14. USAFA Data Clean Inlet Model Validation, Normalized [11]
The DYNTECC/MLC predicted clean inlet stall line was compared to the
F109 cycle deck stall line as well as the clean inlet stall line measured at the
USAFA and showed acceptable agreement with both as reported in Reference
11. Varying intensities of bulk swirl and paired swirl were modeled using the
combined DYNTECC/MLC. Two cases of bulk swirl were modeled: co-swirl and
counter-swirl. Each of these cases was modeled at the following swirl angles: 5°,
10° and 15°. In the case of co-swirl, DYNTECC/MLC model predictions showed
that as the swirl angle increases, the fan pressure ratio decreases and fan
stability margin increases [11]. This is depicted in Figure 15.

33
Figure 15. Normalized Co-Swirl Initial Predictions [11]
In the case of counter-swirl, DYNTECC/MLC model predictions showed
the opposite. As counter-swirl intensity increases, Fredrick predicted that fan
pressure ratio will increase while fan stability margin decreases [11]. This is
depicted in Figure 16.

34
Figure 16. Normalized Counter-Swirl Initial Predictions [11]
Twin swirl was the only case of paired swirl modeled using
DYNTECC/MLC. Fredrick predicted that twin swirl reduces fan pressure ratio
and also reduces fan stability margin. Fredrick showed the loss in stability
pressure ratio with 10° twin swirl compared to the loss in stability pressure ratio
with 10° counter- and co-swirl. For the same swirl angle, the loss in stability
pressure ratio was much greater and increased at a higher rate with paired twin-
swirl compared to bulk counter-swirl [11]. The twin swirl predictions for 53% and
71% fan speed are given in Figure 17 and Figure 18, respectively.

35
Figure 17. Normalized 53% Twin Swirl Initial Predictions [11]

36
Figure 18. Normalized 71% Twin Swirl Initial Predictions [11]
Once rotor and stator relative total pressure loss and blade exit deviation
tables were developed, modeling different cases of inlet swirl with the combined
DYTNECC/Mean line code was simplified because new stage characteristic
maps did not have to be developed for each case. Modeling a different case of
swirl was as easy as changing one or two DYNTECC inputs. No data had yet
been gathered for the F109 with inlet swirl at the time of Fredrick’s 2010 work.

37
3.4 F109 TURBOFAN ENGINE
3.4.1 ENGINE HISTORY
The Honeywell F109, shown in Figure 19, is a high by-pass ratio turbofan
engine with a maximum thrust of 1330 pounds-force at sea level static, standard
day conditions. The F109 has a single stage axial fan, a two stage centrifugal
high pressure compressor, a reverse flow annular combustor, a two stage axial
high pressure turbine, and a two stage axial low pressure turbine. The F109 has
a bypass ratio of 5 to 1 and the by-pass flow mixes with the core flow before
exiting through a common nozzle [6]. The F109 is ideal for inlet swirl testing
because the fan is not equipped with IGVs, which will make it more sensitive to
the presence of swirl. Universities like the USAFA and Virginia Polytechnic
Institute and State University (Virginia Tech) presently use the F109 for various
research endeavors [11].
Figure 19. F109 Turbofan Engine [6]

38
3.4.2 USAFA SWIRL INVESTIGATIONS
F109 tests with AEDC-supplied swirl generators were conducted at the
United States Air Force Academy in August 2011. The test was directed by
AEDC personnel and conducted by USAFA faculty and students with
instrumentation and test assets owned by the university. Data were collected in
the following fashion: For each swirl condition, the specified swirl angle was set
by a prearranged vane slot setting and manually measured flap setting. A flow
angularity probe was not used for mapping of the fan. A previous wind-tunnel
test without an engine was conducted to verify the flow angularity of the
prearranged slot and flap settings using a 6-sided cobra probe.
When F109 testing was initiated, a slow transient along the operation line
was made during accelerations/decelerations from idle to maximum speed and
back again to verify nominal operation. Measurement of the individual speed
line points was made possible by using an exhaust flow plug to backpressure the
fan as shown in Figure 20. Steady-state data points were gathered at the start,
while transient data points were initiated as the fan stall point approached. This
entire process was then repeated for the baseline configurations. The
configurations where data were taken, denoted by ‘X’, can be seen in Table 1
below.

39
Figure 20. F109 Nozzle Flow Plug
Table 1. USAFA Test Configurations
Swirl Configuration Op Line 53% N1 62% N1 71% N1 75% N1 Twin Swirl (+5/-5 Deg) X X X X X Twin Swirl (+9/-9 Deg) X X X X X
Twin Swirl (+18/-18 Deg) X X X X X Bulk Swirl (+7 Deg) X Bulk Swirl (-7 Deg) X
Bulk Swirl (+10 Deg) X X X Bulk Swirl (+14 Deg) X X X Bulk Swirl (-14 Deg) X X X

40
Two distinct AEDC-supplied swirl generators were used on this particular
test: the Bulk Swirl Generator and Twin Swirl Generator. These swirl generators
were designed by Dave Beale and are currently in the development and testing
phase. This was the first test where these generators were placed in front of a
live engine for purposes of investigating inlet swirl effects. Figure 21 provides an
overall, as well as downstream, view of each generator installed at the United
States Air Force Academy.
Figure 21. AEDC-Supplied Swirl Generators

41
4.0 APPROACH
4.1 OUTLINE OF APPROACH
The following is an outline of the approach used to meet the goals of the
investigation at the heart of this report. The main bullets describe the task that
had to be completed in order to meet the goals of the research. The sub-bullets
describe additional tasks that had to be completed in order to fulfill the task
described in the main bullet.
Implementation of Improved Graphical User Interface
o Re-compilation of DYNTECC/MLC Fortran code
o Modifications to code to allow extraction of pertinent data to this
particular swirl investigation
Comparison of Pre-Test Predictions to USAFA Test Data
o Reduction and analysis of USAFA test data
o Re-run of original DYNTECC/MLC model to match test data
conditions
o Analysis of error between test data and pre-test predictions
Clean Inlet Model Calibration
o Development of technique to align clean inlet model predictions
with USAFA test data
o Generation of total fan pressure ratio multiplier map
o Code modification to apply multiplier map to any inlet swirl case
Stall Criteria Investigation

42
o In-depth search for suitable stall determination techniques
o Analysis of various stall criteria definitions at inlet swirl conditions
o Development of alternate stall determination method and
implementation into existing DYNTECC/MLC code
Presentation of Final Results
o Run model with calibration and stall determination modifications in
place for all tested swirl conditions
o Plotting and analysis of final results against USAFA test data
4.2 IMPLEMENTATION OF GRAPHICAL USER INTERFACE
Since the completion of the previous investigation by Fredrick, a new and
improved DYNTECC/MLC graphical user interface (GUI) was developed. This
easy to use and improved GUI brings this particular modeling and simulation
product into the analysis domain for novice users. The GUI now operates using
the LabView Run Time Engine, and allows for greatly improved machine
efficiency and plotting capability. To allow for the integration of the updated GUI
with the existing DYNTECC/MLC Fortran code, significant work was required and
countless hurdles had to be overcome. Figure 22 shows a typical view of the
GUI in use.

43
Figure 22. Updated DYNTECC/MLC GUI
4.3 USAFA TEST DATA COMPARISON
At the conclusion of the F109 inlet swirl test conducted at the United
States Air Force Academy, the data were reduced for analysis purposes. The
fan stall points were determined and plotted on compressor maps. It was noticed
almost immediately that the actual effects of swirl on fan performance and
operability did not agree with the model predictions generated by Fredrick pre-
test. The reason for this was not clear at the onset of this work, so the pre-test
model predictions were plotted against the reduced test data for the clean inlet

44
and all swirl cases available. It should be noted that the actual swirl conditions
tested varied somewhat relative to the swirl angles used in the pre-test
prediction. The model developed by Fredrick was re-run at the as-tested
conditions for the purpose of the following plots.
The level of agreement between the pre-test predictions and the actual
test data for all inlet swirl conditions can be determined from Figure 23 through
Figure 28. Although the clean inlet model predicted stall line was in agreement
with the test data, the overall speed line projections were not in direct agreement,
as seen in Figure 23. However, for the remaining inlet swirl cases, in general,
very little agreement was found between test data and model predictions. The
error between model predicted stall and test data stall for swirl could be as high
as 4.8% total fan pressure ratio.
Figure 23. Normalized Clean Inlet Pre-Test Prediction

45
Figure 24. Normalized Bulk Swirl (+10deg) Pre-Test Prediction
Figure 25. Normalized Bulk Swirl (+14deg) Pre-Test Prediction

46
Figure 26. Normalized Bulk Swirl (-14deg) Pre-Test Prediction
Figure 27. Normalized Twin Swirl (5deg) Pre-Test Prediction

47
Figure 28. Normalized Twin Swirl (9deg) Pre-Test Prediction
While the reasons for model disagreement were still unknown after initial
analysis, it was surmised that the loss and deviation maps generated in the
previous investigation may not be entirely accurate for inlet swirl cases. These
particular maps were generated using an F109 cycle code that has no provision
for inlet swirl conditions. Therefore, it was deemed worthwhile to determine
where the current inlet swirl model predictions fell on the maps. It was found that
the majority of the swirl model runs produced inlet relative Mach number and
incidence angle combinations that fell in the extrapolated regions of the maps.
This phenomenon is presented in Figure 29 for the 14 degrees counter-swirl
condition as an example. In the absence of cycle code data in these regions, it
is possible that extrapolated loss and deviation levels are not representative of
the actual system. Also, because of the meager amount of actual test data

48
available, these maps could not be verified. This constraint will be present
throughout the remainder of this work, and will remain until a larger dataset can
be obtained to produce new maps.
Figure 29. Rotor Loss and Deviation Effect on Pre-Test Predictions

49
4.4 MODEL CALIBRATION TO TEST DATA
As seen in the previous section, the initial model predictions of stall did not
accurately reflect the data taken at the United States Air Force Academy.
Predictions of the F109 stall line with inlet swirl were consistently in error greater
than 2% total fan pressure ratio, save for the 5 degree twin swirl case, and this
amount of error was deemed excessive. To help alleviate this particular issue, it
was surmised that the model simply needed to be calibrated to the clean inlet
data taken at USAFA. Thus, a new capability had to be added to the existing
DYNTECC/MLC model to accommodate this calibration. This was accomplished
using the following process. First, at a given speed and referred mass flow point,
the actual fan pressure ratio was compared to the model predicted fan pressure
ratio for the clean inlet at 53% and 71% fan speed. From this, a multiplier was
calculated to adjust the model predicted fan pressure ratio to match the test data.
A multiplier look-up table was created to cover the entire referred mass flow
range under investigation, and a routine was developed to input and read this
map in DYNTECC. The clean inlet multiplier was then applied to each remaining
swirl case.
The results of the clean inlet baseline calibration can be seen in Figure 30.
As opposed to the drastic difference in speed line level and shape evident in
section 4.3, the clean inlet model predictions now fall close to the test data as
would be expected. No more than a 0.3% difference in total fan pressure ratio
exists between the model predictions and test data, only caused by rounding

50
error inherent to the creation of the multiplier look-up table. Note that no
adjustment to the stall criteria determination or the loss and deviation maps was
made in this calibration. The effects of the clean inlet calibration on all pertinent
inlet swirl cases can be determined from Figure 31 through Figure 35. While the
prediction of the stall point remained unchanged or even worsened, the proximity
of the model predicted speed lines to test data improved drastically for the co-
swirl cases, and improved marginally for the counter-swirl and twin swirl cases.
Figure 30. Normalized Clean Inlet Model Calibration

51
Figure 31. Normalized Bulk Swirl (+10deg) Model Calibration
Figure 32. Normalized Bulk Swirl (+14deg) Model Calibration

52
Figure 33. Normalized Bulk Swirl (-14deg) Model Calibration
Figure 34. Normalized Twin Swirl (5deg) Model Calibration

53
Figure 35. Normalized Twin Swirl (9deg) Model Calibration
4.5 STALL CRITERIA INVESTIGATION
After successful adjustment of the model speed line levels relative to the
USAFA swirl test data by a clean inlet calibration method, it was noted that the
prediction of stall was still fairly inaccurate. It was determined that it may be
useful to investigate alternate model stall criteria beyond the standard diffusion
factor. Several stall criteria definitions were analyzed and implemented into the
code. These stall criteria definitions are explained in section 2.2. The criteria
evaluated include: rotor diffusion factor, rotor diffusion factor with compressibility
effect, de Haller number, static pressure rise coefficient, rotor diffusion ratio at
stall condition, and rotor diffusion ratio at minimum loss condition.
The standard procedure for determining model stall with the rotor diffusion
factor as outlined by Fredrick remains unchanged for the initial stall criteria
54
comparison. The value of each stall criteria at stall for the clean inlet case that
matches test data was found. This clean inlet stall criteria value (SCV) was then
used for all remaining swirl model predictions. DYNTECC will run until the
calculated stall criteria value for swirl eclipses that of the clean inlet run,
indicating the compression system has stalled. However, if swirl is present, that
SCV at stall can vary immensely relative to the clean inlet, as seen in the model
predictions given in section 4.3.
However, it was found that the alternate stall criteria provided no
substantial improvement over the standard diffusion factor, which is summarized
later in Figure 37. Because of this fact, a modification to the standard procedure
for determining model stall was necessary. The final two stall criteria evaluated,
the rotor diffusion ratio at stall condition and minimum loss condition, were
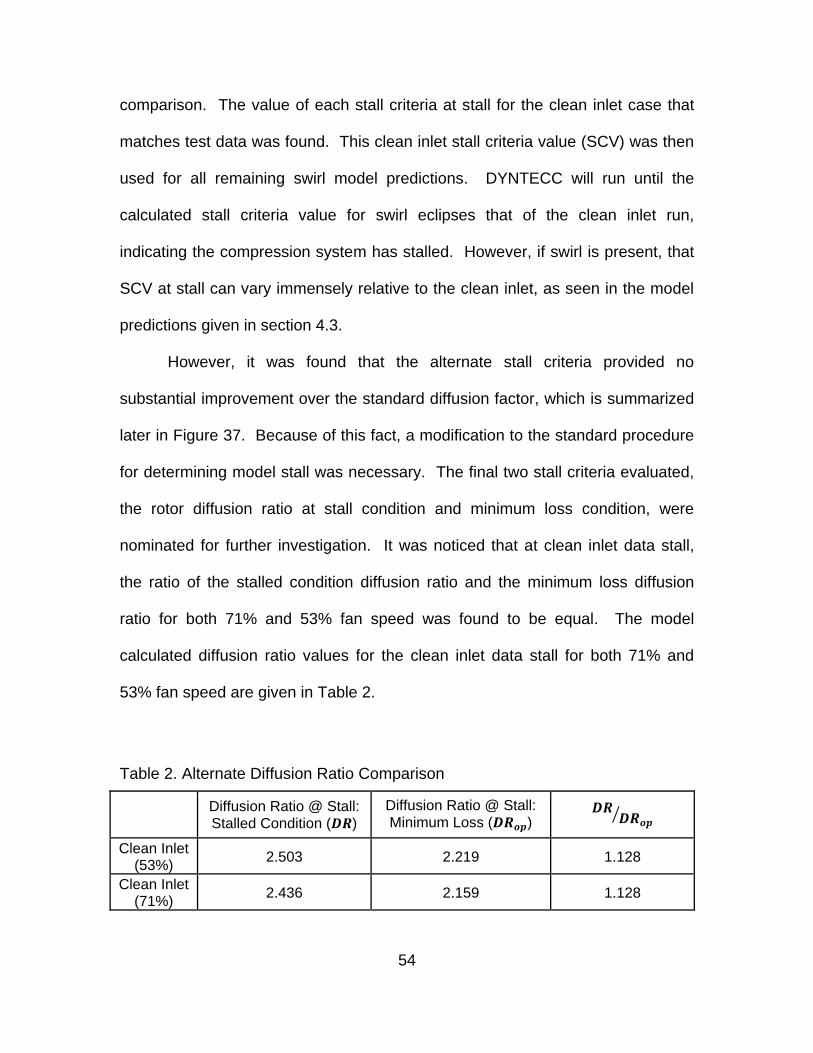
nominated for further investigation. It was noticed that at clean inlet data stall,
the ratio of the stalled condition diffusion ratio and the minimum loss diffusion
ratio for both 71% and 53% fan speed was found to be equal. The model
calculated diffusion ratio values for the clean inlet data stall for both 71% and
53% fan speed are given in Table 2.
Table 2. Alternate Diffusion Ratio Comparison
Diffusion Ratio @ Stall: Stalled Condition ( )
Diffusion Ratio @ Stall: Minimum Loss ( )
⁄
Clean Inlet (53%)
2.503 2.219 1.128
Clean Inlet (71%)
2.436 2.159 1.128

55
Based on this clean inlet observation, a simple multiplier of 1.128 was
applied to the minimum loss diffusion ratio calculation, allowing for the model
calculations of both diffusion ratio terms to be equal at clean inlet data stall. This
process was then applied to the remaining inlet swirl cases. Thus, as the
individual swirl cases are run in DYNTECC, both diffusion ratio terms are
calculated at each model iteration. When the ratio of the stalled condition
diffusion ratio and the minimum loss diffusion ratio equals one, the compression
system is considered to be stalled. A process chart describing this method can
be found in Figure 36.
Figure 36. Alternate Diffusion Ratio Method

56
Based on the stall criteria investigation, the alternate diffusion ratio
method was chosen as the most accurate stall criteria for inlet swirl applications.
It can be theorized that this is a result of the inherent advantages of the standard
rotor diffusion ratio at varying swirl angles, being the strong influence of inlet flow
direction and incidence angle on stall determination that is not as evident with the
standard rotor diffusion factor. As described in section 2.2.1, the standard
diffusion factor (Equation 1) is calculated using inlet and exit blade velocities,
while the diffusion ratio (Equation 3) is expressed in terms of inlet and outlet flow
directions, as well as the change in incidence angle. In addition, the fact that
stall determination is now based on the agreement of two similar yet competing
rotor diffusion ratio expressions, redundancy is inherent in the determination of
fan stall, thus providing a more accurate prediction than one stall criteria alone. It
should be noted that this alternate diffusion ratio method is only possible
because of the availability of test data and the subsequent model calibration to
that test data. Since data were only obtained at two fan speed conditions, it
would be of interest to gather additional data to verify that the observed diffusion
ratio relationships are evident across a wider range of fan speeds.
The comparison of the alternate diffusion ratio method versus the various
other stall criteria is depicted in the following plot where an evaluation of all six
stall criteria definitions at 71% fan speed for both co- and counter-swirl, as well
as the alternate diffusion ratio method is presented in Figure 37. The stall criteria
value at clean inlet stall was found for each stall criteria definition. This stall
criteria value was then used for the +14 degrees and -14 degrees swirl cases.
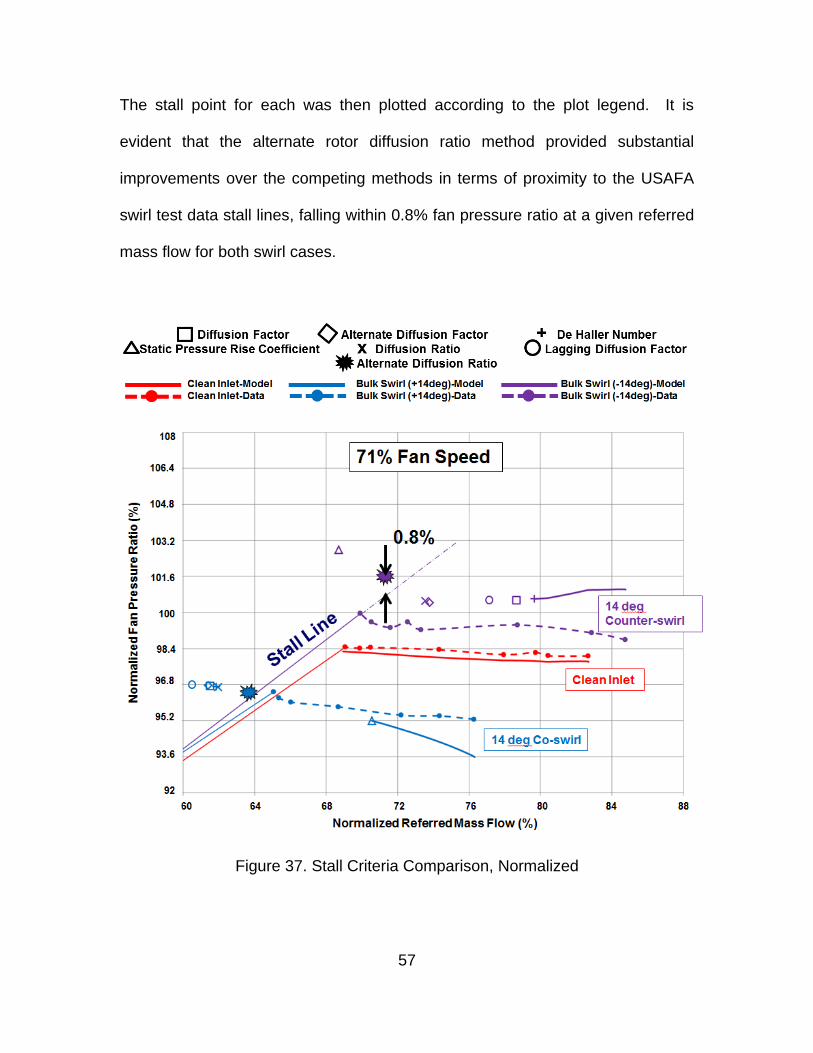
57
The stall point for each was then plotted according to the plot legend. It is
evident that the alternate rotor diffusion ratio method provided substantial
improvements over the competing methods in terms of proximity to the USAFA
swirl test data stall lines, falling within 0.8% fan pressure ratio at a given referred
mass flow for both swirl cases.
Figure 37. Stall Criteria Comparison, Normalized

58
Figure 38 also presents the clear superiority of the alternate rotor diffusion
ratio method versus the competing stall criteria. In this plot, each swirl case was
run to the data stall for all stall determination methods (excluding the lagging
diffusion factor), and the stall criteria value was noted. This plot depicts the
deviation of each swirl case stall criteria value from the clean inlet data stall
criteria value. It is evident that the alternate rotor diffusion ratio method deviated
the least from the clean inlet across all inlet swirl cases. No inlet swirl case stall
criteria value using the alternate rotor diffusion ratio method eclipsed a deviation
above 5%, while the competing swirl criteria all exhibited deviations greater than
10%. This shows that if the stall criteria value that correlates to the clean inlet
stall value is used across all inlet swirl cases, the alternate diffusion ratio method
would provide the least amount of error when predicting inlet swirl stall points.
Figure 38. Stall Criteria Precision

59
5.0 RESULTS
After the completion of the aforementioned model calibration and stall
criteria investigation, the final model predictions were generated and compared
to the USAFA test data. Three types of bulk swirl were modeled to align with
available test data: +10 degrees (co-swirl), +14 degrees (co-swirl), and -14
degrees (counter-swirl). In addition, two types of twin swirl were modeled to align
with available test data: 5 degrees and 9 degrees. The as-tested swirl angle was
input to DYNTECC, and the alternate diffusion ratio method was used as the
deciding stall criteria (Section 4.5). The model predictions are plotted against the
USAFA inlet swirl test data for comparison and analysis at the two speeds where
data were taken: 53% and 71% fan speed. The clean inlet test data is also
present on each plot to provide a stable frame of reference for the effects of inlet
swirl.
Figure 39 depicts the clean inlet test data compared to the final clean inlet
model prediction. Because the model was calibrated to the clean inlet data,
significant agreement between model and data exists. The speed line levels are
within 0.3% fan pressure ratio at a referred mass flow as a result of the model
calibration described in section 4.4. Also, since the alternate diffusion ratio
method was calibrated to the clean inlet as described in section 4.5, the model
predicted stall fan pressure ratio for each fan speed is analogous to test data
stall.

60
Figure 39. Normalized Clean Inlet Final Prediction
5.1 BULK SWIRL
Figure 40 depicts the +10° bulk swirl test data compared to the +10° bulk
swirl model prediction. As seen in section 4.4, the clean inlet model calibration
significantly improved the speed line alignment at the co-swirl cases, especially
near stall. Using the alternate diffusion ratio method as calibrated to the clean
inlet, the model predicted stall fan pressure ratio was within 1.6% of the test data
at a given referred mass flow and referred fan speed, which represents a clear
improvement over the original model prediction that exhibited an error of 3.2%.

61
Figure 40. Normalized Bulk Swirl (+10deg) Final Prediction
Figure 41 depicts the +14° bulk swirl test data compared to the +14° bulk
swirl model prediction. Using the alternate diffusion ratio method as calibrated
to the clean inlet, the model predicted stall fan pressure ratio was within 0.5% of
the test data at a given referred mass flow and referred fan speed, which
represents a marked improvement over the original model prediction that
exhibited an error of 2.5%.

62
Figure 41. Normalized Bulk Swirl (+14deg) Final Prediction
Figure 42 depicts the -14° bulk swirl test data compared to the -14° bulk
swirl model prediction. As mentioned previously, the clean inlet model calibration
significantly improved the speed line alignment at the co-swirl cases near stall.
However, even though the counter-swirl case showed improved agreement
compared to the original model predictions, the counter-swirl case did not
respond as well to the clean inlet calibration as the co-swirl cases because of the
extreme speed line misalignment of the initial predictions. Using the alternate
diffusion ratio method as calibrated to the clean inlet, the model predicted stall
fan pressure ratio was within 0.8% of the test data at a given referred mass flow
and referred fan speed, which represents a substantial improvement over the
original model prediction that exhibited an error of 4.8%.

63
Figure 42. Normalized Bulk Swirl (-14deg) Final Prediction
5.2 PAIRED SWIRL
Figure 43 depicts the 5° twin swirl test data compared to the 5° twin swirl
model prediction. As mentioned previously, the clean inlet model calibration
significantly improved the speed line alignment at the co-swirl cases near stall.
However, even though the twin swirl case showed improved agreement
compared to the original model predictions, the twin swirl case did not respond
as well to the clean inlet calibration as the co-swirl cases because of the extreme
speed line misalignment of the initial predictions. Using the alternate diffusion
ratio method as calibrated to the clean inlet, the model predicted stall fan
pressure ratio was within 1.9% of the test data at a given referred mass flow and
referred fan speed. Although this error is within the 2% threshold referenced

64
earlier in this report, it represents a definitive step back from the original model
prediction that exhibited a maximum error of 1%. It would be of interest to take
additional data at this inlet swirl case to verify the initial data is in fact accurate,
particularly at the 71% fan speed condition.
Figure 43. Normalized Twin Swirl (5deg) Final Prediction
Figure 44 depicts the 9° twin swirl test data compared to the 9° twin swirl
model prediction. Using the alternate diffusion ratio method as calibrated to the
clean inlet, the model predicted stall fan pressure ratio was within 0.6% of the
test data at a given referred mass flow and referred fan speed, which represents
a definitive improvement over the original model prediction that exhibited an error
of 2.4%.

65
Figure 44. Normalized Twin Swirl (9deg) Final Prediction

66
6.0 CONCLUSIONS AND RECOMMENDATIONS
The work contained in this thesis has provided a substantial improvement
to the development of the one-dimensional parallel compressor model used for
the prediction of inlet swirl effects on fans and compressors. Building upon
previous work completed at AEDC, the modified DYNTECC/MLC model was
validated against test data gathered at the United States Air Force Academy. To
correct model inaccuracies relative to the USAFA test data, the model reported
herein was calibrated to the clean inlet data and an alternative stall determination
method was proposed. The alternate diffusion ratio method, along with the clean
inlet calibration, provided a marked improvement in the accuracy of the model in
matching available swirl test data. The prediction of the fan stall pressure ratio
for all inlet swirl conditions tested is within 2% of the ground test stall point at the
same referred fan speed and referred mass flow.
However, the model is not perfect, and improvements can still be made to
increase the predictive capabilities of the model. Although the alternate diffusion
ratio stall criteria greatly improved the accuracy of the stall prediction, there does
not seem to be a one size fits all approach for both bulk and paired swirl patterns.
Future refinements can be made in several areas to possibly improve the
accuracy of the model. One such technique could be to employ Computational
Fluid Dynamics (CFD) to verify model boundary conditions specified at the exit of
the fan. CFD can also be used to refine the loss and deviation look-up maps that
are internal to the model, as opposed to the current maps that were generated by

67
the one-dimensional mean line code. It may also be worthwhile to investigate the
integration of a version of the Streamline Curvature Code [10] in place of mean
line code to supply the pressure ratio and temperature ratio inputs to DYNTECC.
Finally, it is important that additional F109 engine testing with inlet swirl is
completed to ensure that current data used in this report is repeatable, as well as
fill out the map with additional speed lines.

68
LIST OF REFERENCES

69
1. Mattingly, J.D., Elements of Gas Turbine Propulsion, American Institute of
Aeronautics and Astronautics, Inc., Reston, VA, 2005.
2. Bouldin, B. and Sheoran, Y., “Impact of Complex Swirl Patterns on
Compressor Performance and Operability Using Parallel Compressor
Analysis,” ISABE2007-1140, 18th International Symposium on Air
Breathing Engines, Beijing, China, Sep. 2-7, 2007.
3. Guo, R.W. and Seddon, J., “Swirl Characteristics of an S-Shaped Air
Intake with both Horizontal and Vertical Offsets,” Aeronautical Quarterly,
Vol. 34, pp. 130-146, May 1982.
4. Davis, M., Hale, A. and Beale, D., “An Argument for Enhancement of the
Current Inlet Distortion Ground Test Practice for Aircraft Gas Turbine
Engines,” Journal of Turbomachinery, Vol. 124, No. 2, pp. 235-241, April
2002.
5. Aulehla, F., “Intake Swirl – A Major Disturbance Parameter in
Engine/Intake Compatibility,” ICAS-82-4.8.1, Congress of the International
Council of the Aeronautical Sciences, Vol. 2, pp. 1415-1424, 1982.
6. Davis, M., Beale, D. and Sheoran, Y., “Integrated Test and Evaluation
Techniques as Applied to an Inlet Swirl Investigation using the F109 Gas
Turbine Engine,” GT2008-50074, ASME Turbo Expo 2008: Power for
Land, Sea and Air, Berlin, Germany, June 9-13, 2008.
7. Lieblein, S., Schwenk, F.C., and Broderick, R.L., “Diffusion Factor for
Estimating Losses and Limiting Blade Loadings In Axial-Flow-Compressor
Blade Elements,” NASA RM E53D01, 1953.

70
8. Cumptsy, N.A., Compressor Aerodynamics, John Wiley & Sons, New
York, NY, 1989.
9. Schobeiri, M., Turbomachinery Flow Physics and Dynamic Performance,
Springer Science & Business Media, New York, NY, 2005.
10. Davis, M.W., Hale, A. A. and Klepper, J., “40 Years of AEDC
Development, Evolution and Application of Numerical Simulations for
Integrated Test and Evaluation of Turbine Engine Turbomachinery
Operability Issues,” AEDC-TR-09-T-19, Arnold Engineering Development
Center, Arnold Air Force Base, TN, March 2010.
11. Fredrick, N.J., “Investigation of the Effects of Inlet Swirl on Compressor
Performance and Operability Using a Modified Parallel Compressor
Model,” MS Thesis, University of Tennessee, Knoxville, TN, December
2010.
12. Lieblein, S., “Analysis of Experimental Low-Speed Loss and Stall
Characteristics of Two-Dimensional Compressor Blade Cascades,” NASA
RM E57A28, 1957.
13. Koch, C.C., “Stalling Pressure Rise Capability of Axial Flow Compressor
Stages,” ASME Journal of Engineering for Power, Vol. 103, pp. 645-656,
October 1981.
14. Davis, M. and Hale, A., “A Parametric Study on the effects of Inlet Swirl on
Compression System Performance and Operability Using Numerical
Simulations,” GT2007-27033, ASME Turbo Expo 2007: Power for Land,
Sea, and Air, Montreal, Canada, May 14–17, 2007.

71
15. Hale, A. A. and Davis, M.W., “DYNamic Turbine Engine Compressor Code
DYNTECC – Theory and Capabilities,” AIAA 92-3190, 28th Joint
Propulsion Conference and Exhibit, Nashville, TN, July 6-8, 1992.
16. Tibboel, G.A., “Modification of a One-Dimensional Dynamic Compression
System Model to Calculate Stage Characteristics Internally,” MS Thesis,
University of Tennessee, Knoxville, TN, May 2003.
17. Smith, S.L., “1-D Mean Line Code Technique to Calculate Stage-by-Stage
Compressor Characteristics,” MS Thesis, University of Tennessee,
Knoxville, TN, May 1999.
18. SAE S-16 Committee, “Gas Turbine Engine Inlet Flow Distortion
Guidelines,” ARP 1420, Revision B, Society of Automotive Engineers,
February 2002.
19. SAE Aerospace Information Report AIR1419, Revision A, “Inlet Total-
Pressure-Distortion Considerations for Gas-Turbine Engines,” May 1982.
20. Beale, D.K., “Improving Information Productivity and Quality in Turbine
Engine Ground Testing,” AIAA 2001-0163, 39th AIAA Aerospace Sciences
Meeting and Exhibit, Reno, NV, January 8-11, 2001.
21. Beale, D.K., Cramer, K.B. and King, P.S., “Development of Improved
Methods for Simulating Aircraft Inlet Distortion in Turbine Engine Ground
Tests,” AIAA 2002- 3045, 22nd AIAA Aerodynamic Measurement
Technology and Ground Testing Conference, St. Louis, MO, June 24-26,
2002.

72
22. Wellborn, S.R., Reichert, B.A. and Okiishi, T.H., “An Experimental
Investigation of the Flow in a Diffusing S-Duct,” AIAA 92-3622, 28th Joint
Propulsion Conference and Exhibit, Nashville, TN, July 6-8, 1992.
23. Pazur, W. and Fottner, L., “The Influence of Inlet Swirl Distortions on the
Performance of a Jet Propulsion Two-Stage Axial Compressor,” Journal of
Turbomachinery, Vol. 113, pp. 233-240, April 1991.
24. Davis, M.W., “A Stage-by-Stage Post-Stall Compression System Modeling
Technique: Methodology, Validation, and Application,” PhD Dissertation,
Virginia Polytechnic Institute and State University, Blacksburg, VA,
December 1986.
25. Lieblein, S., “Aerodynamic Design of Axial-Flow Compressors,” NASA SP-
36, Chapter VI, 1965.

73
VITA
Reginald S. Floyd Jr. was born in Nashville, Tennessee in March 1988 to Mr.
Reginald S. Floyd Sr. and Mrs. Leona L. Floyd. His primary and secondary
education was received at St. Bernard Academy and Father Ryan High School in
Nashville, Tennessee. In 2010, Reginald graduated with a 4.0 grade point
average as valedictorian of his graduating class from Tennessee State University
in Nashville, Tennessee with a Bachelor of Science in Mechanical Engineering.
After graduating from Tennessee State University, Reginald began his civil
service career for the United States Air Force at the Arnold Engineering
Development Complex as a turbine engine analysis engineer. Reginald enrolled
in the graduate program at the University of Tennessee Space Institute in the fall
of 2011.