validation of forecasts of scientific indicators: the case of world leadership of science
DESCRIPTION
Validation of Forecasts of Scientific Indicators: The Case of World Leadership of Science. R. D. (Duane) Shelton ITRI & WTEC Baltimore, Maryland, USA. Atlanta Conference on Science and Innovation Policy, Sep., 2013. Outline. Introduction: Theories in Scientometrics - PowerPoint PPT PresentationTRANSCRIPT

Validation of Forecasts of Scientific Indicators:
The Case of World Leadership of Science
R. D. (Duane) SheltonITRI & WTECBaltimore, Maryland, USA
Atlanta Conference on Science and Innovation Policy, Sep., 2013

Outline
Introduction: Theories in Scientometrics Indicator Extrapolation Validations: When will
China again lead the world? Validation and Refinement of the Shelton Model
for Paper Shares Conclusion: Opportunities to Build More Models

Uncle Sam Worries About the Rise of China
And so does John Bull, Deutcher Michel, Marianne, Bharat Mata, …

Purposes
1. Provide indicators to evaluate current national leadership of S&T (2009 data mostly). An art.
2. Validate earlier forecasts that were based on 2005 data. A bit of science, but mostly art.
3. Focus on a theory to explain why some countries excel in scientific publication. A little more science.
4. You can extend to other indicators: PhDs, patenting, hi-tech exports, …
The next few slides review the forecasts in 2009.

0
5
10
15
20
25
30
1998 1999 2000 2001 2002 2003 2004 2005 2006
Per
cen
tag
e %
US
EU27
China
This was typical: China starting far below, but rising rapidly. It was easy to extrapolate underlying exports graphically, but shares have to add to 100%. (Shelton & Foland 2009)
Hi-Tech Export Share
(Example of 2009 Forecast: China Would Lead by 2010)

Input Indicators (2005 data in 2009 paper)Indicator U.S. EU27 PRC Units
1. Population 297 (1.0%) 492 (0.4%) 1308 (0.6%) Millions
2. Researchers 1388 (1.0%) 1300 (3.1%) 1119 (10.6%) Thousands
3. GDP 12376 (5.5%) 13031(4.4%) 5333 (12.9%) Billions, PPP, current dollars
4. GERD 324 (1.7%) 227 (2.2%) 71 (18.9%) Billions, PPP, current dollars, (percentage in constant dollars)
5. GERD Share 36 (-2.0%) 26 (-1.5%) 7.8 (14.7%) Percent of OECD Group
Average annual percentage rates of change in parentheses. Blue emphasizes very rapid growth. GERD = gross expenditures on R&D. (Shelton & Foland 2009)

Output Indicators (2005 Data in 2009 paper)
Indicator US EU27 China Source
1. Quantity of Papers (SCI) 205,320 (1.5%) 234,868 (1.3%) 41,596 (17.0%) NSB, 2008
2. Relative Impacts 1.47 (0.6%) 1.09 (1.1%) 0.63 (2.3%) ISI, 2006
3. Triadic Patents 15,774 (1.2%) 14,571 (0.9%) 356(35.1%) OECD, 2008
4. S&E Ph.D. Production 26,275 (1.6%) 45,398 (2%) 14,858 (17.3%)NSB, 2008Moguerou, 2006
5. Nobel Prizes (1950-2008) 168 260 3Nobel, 2008, by
birth
6. High-Tech Exports,World Market Share in Percent 19 (-3%) 17 (0%) 15 (30%) EC, 2007
7. Trade Balance(Goods in Billion Euros, current) - 666 (5%) - 127 (9%) 82 (45%) Eurostat, 2009
Average annual percentage rates of change in parentheses. (Shelton & Foland, 2009)
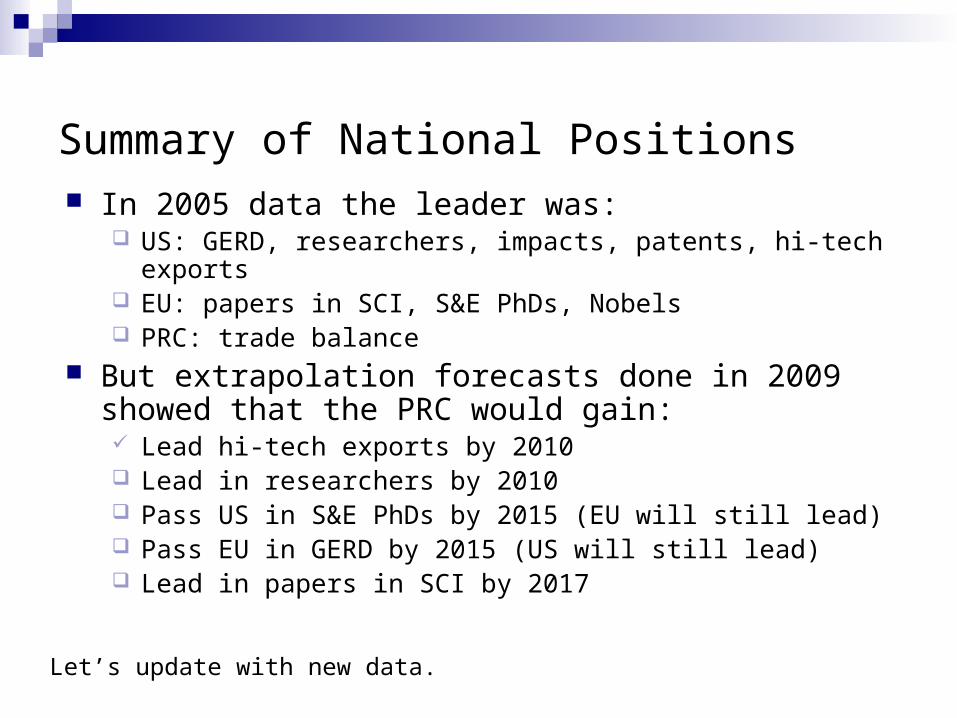
Summary of National Positions In 2005 data the leader was:
US: GERD, researchers, impacts, patents, hi-tech exports EU: papers in SCI, S&E PhDs, Nobels PRC: trade balance
But extrapolation forecasts done in 2009 showed that the PRC would gain: Lead hi-tech exports by 2010 Lead in researchers by 2010 Pass US in S&E PhDs by 2015 (EU will still lead) Pass EU in GERD by 2015 (US will still lead) Lead in papers in SCI by 2017
Let’s update with new data.
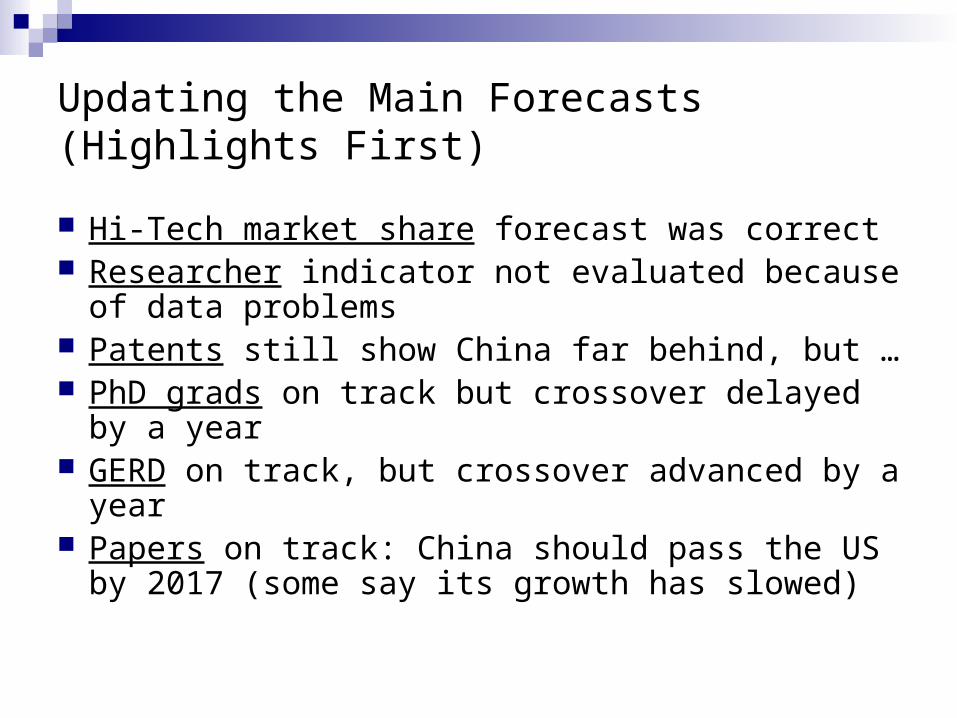
Updating the Main Forecasts (Highlights First)
Hi-Tech market share forecast was correct Researcher indicator not evaluated because of data
problems Patents still show China far behind, but … PhD grads on track but crossover delayed by a year GERD on track, but crossover advanced by a year Papers on track: China should pass the US by 2017
(some say its growth has slowed)

It was Easy to Forecast that China Would Take the Lead In High Tech Exports
Hi-Tech Market Share
0
5
10
15
20
25
1992
1993
1994
1995
1996
1997
1998
1999
2000
2001
2002
2003
2004
2005
2006
2007
2008
2009
2010
2011
Per
cen
t
EU15
US
PRC
The vertical line (at 2005) divides data used for 2009 forecasts, and actuals since then. You could build a model for this, but you might want to collaborate with me since I have one started.

PCT Patents
0
10000
20000
30000
40000
50000
60000
2000 2001 2002 2003 2004 2005 2006 2007 2008 2009 2010 2011
US
EU28
PRC
PCT (International) Patents are a Good Indicator of Applied Research
You could put this data into MiniTab and forecast the crossover. Or build a model based on a GERD or BERD driver to connect patents to investments. (Shelton & Monbo, 2012)

S&E PhD Grads (2009 Paper)
0
5,000
10,000
15,000
20,000
25,000
30,000
1984
1986
1988
1990
1992
1994
1996
1998
2000
2002
2004
2006
US
EU
China
EU = Germany and UK only; EU27 curve would be far above the US one.

PhD Grads in S&E
0
5000
10000
15000
20000
25000
30000
35000
40000
45000
2000 2001 2002 2003 2004 2005 2006 2007 2008 2009 2010 2011
EU7
US
PRC
The PRC values after 3008 are estimated as 64.5% of their totals. You could build a model connecting this to the driver: the number of researchers—a birth-death differential equation!
Forecast Based on Latest Data: When Will the PRC Pass the US?

Focus on Model for Papers and its GERD Driver
This really comes from applied math modeling Regression confirms connection GERD is a good explanatory variable for papers. Later I found that the government component of
GERD, and the higher education spending component are slightly better.
This might be a good time to explain WHY China is rising so fast in all these indicators.

Why China is Rising in Science: Money is the Engine
It gets worse. The US sharply cut its real investment in R&D after 2008; the EU cut somewhat. This will speed their fall relative to the PRC. GERD = gross national expenditures on R&D (OECD 2013).
Real GERD Increases Over Previous Year
-5.0
0.0
5.0
10.0
15.0
20.0
25.0
30.0
35.0
1996 1997 1998 1999 2000 2001 2002 2003 2004 2005 2006 2007 2008 2009 2010 2011
Per
cen
t US
EU28
PRC

GERD Share With Forecasts (2009 paper)
0
5
10
15
20
25
30
35
40
45
1990 1995 2000 2005 2010 2015 2020 2025
US
EU27
PRC
This is based on an extrapolation of GERD, then shares of all OECD countries are constrained to add to 100%.

Validation: My Short Term Forecasts of GERD Shares are Not Bad
F = Forecasts in 2009 based on 2005 data; A = Actuals.
The PRC and EU are a little more than forecast, but the US is less.
Actual vs. Forecast of GERD Share
0.0
5.0
10.0
15.0
20.0
25.0
30.0
35.0
40.0
2006 2007 2008 2009
US-A
EU27_A
PRC-A
US-F
EU27-F
PRC-F

GERD Share of OECDg
0
5
10
15
20
25
30
35
40
45
1996 1997 1998 1999 2000 2001 2002 2003 2004 2005 2006 2007 2008 2009 2010 2011
Per
cen
t US
EU28
PRC
We can use MiniTab to forecast, but we need to decide if growth is linear or exponential.
2011 Data is Now Available; So When are These Likely to Cross?

Linear vs. Geometric Growth
0
100
200
300
400
500
600
700
2001 2002 2003 2004 2005 2006 2007 2008 2009 2010
Linear: 20 units each year (fixedincrement)
Geometric: 20% each year(compounded)
First Difference of Linear Curve
First Difference of Geometric Curve
It’s Hard to Tell if a Curve is Linear or Exponential at First, Especially if Data is Noisy
Test: linear growth has a constant slope, geometric growth has an increasing slope. (Finite differences are the discrete derivatives.)

First Difference in GERD
-10000
-5000
0
5000
10000
15000
20000
25000
30000
35000
1996 1997 1998 1999 2000 2001 2002 2003 2004 2005 2006 2007 2008 2009
US
EU27
PRC
Finite differences Show China’s GERD growth is NOT Linear--Its Slope Increases
In response to the Great Recession (2008) the West cut back R&D investments; the Chinese accelerated them. Geometric growth will be used for China in forecasts.

GERD Forecasts
0
100000
200000
300000
400000
500000
600000
2012 2013 2014 2015 2016 2017
$ m
illi
on
s o
f co
nst
ant
2005
PRC
US-Linear
US-Geometric
EU28-Geometric
EU28-Linear
The PRC is Now Forecasted to Lead the World in R&D Investments by 2016
This is one year earlier than I forecasted in 2009. Linear vs. geometric doesn’t much matter for US or EU. These MiniTab forecasts are based on 1995-2011 data.

SCI Publications (2009 Paper)
0
50
100
150
200
250
1994
1995
1996
1997
1998
1999
2000
2001
2002
2003
2004
2005
2006
Thousands
US
EU27
China
From NSF S&EI 2008, fractional count.

Actual vs. Forecast of Paper Share
0
5
10
15
20
25
30
35
40
2006 2007 2008 2009
US-A
EU27-A
PRC-A
US-F
EU27-F
PRC-F
My Short Term Paper Share Forecasts are Not Bad
Unlike the earlier forecasts, these are not just extrapolations of the output indicator. They are based on what I modestly call the Shelton Model. How does it work?

Model of a National Scientific Enterprise
Indicators measure inputs and outputs
Multiple linear regression can identify which inputs are most important This is a “scientometric model” similar to an econometric model.
“The Black Box”
Resources InS&T Outputs

More Detailed Model of Publication System (Inside the Black Box)
$ Inputs
US
EU
PRC
ROW
Papers
Published
National Research Systems -- Fairly Independent
Highly Interdependent Paper Selection
Journal
Editors
g1p1
G (total) P (total)
wi = gi/G
GERD share
mi = pi/P
Paper share

• mi is share of papers published (fractional basis)
• wi is the share of GERD for the OECD Group
• k i is a "constant" of proportionality; it differs by country.
• k i is also the efficiency of country i in producing papers per $1 million in GERD, normalized by the OECD average efficiency.
• For data in a single year the equation is an identity, but it is most useful over a range of years IF k i is approximately constant
A Simple Model for Country i
mi = k iwi

Ki based on GERD in $2005 PPP
0
0.2
0.4
0.6
0.8
1
1.2
1.4
1.6
1995 1996 1997 1998 1999 2000 2001 2002 2003 2004 2005 2006 2007 2008 2009
US
EU27
PRC
This continues to be flat, indicating that the Shelton Model still works for these countries. Chinese ki changed from the 2009 paper because its PPP weight changed. It is now as efficient as the US.
Relative Efficiency for Fractional Papers in the OECDg:
ki = Paper Share / GERD Share

Use of Shelton Model
It connects a policy input (investments) to a science indicator output (papers)
It permits better forecasts since the investments can be more easily predicted. They are often set by published policy goals, and some countries like China actually meet their goals.
Thus I forecast GERD and use the model to forecast papers.
I don’t simply extrapolate papers, as I did with the other indicators.

Fractional count data from SEI2012 through 2009, forecasts after 2009 based on OECD (2013) GERD data through 2011. The US crossover will occur a year or two sooner if the US continues its folly of cutting real investment in R&D.
Shelton Continues to Forecast China Passing US by 2017 and EU28 by 2018 to Lead in the SCI.
SCI +SSCI Papers
0
5
10
15
20
25
30
35
40
1995
1996
1997
1998
1999
2000
2001
2002
2003
2004
2005
2006
2007
2008
2009
2010
2011
2012
2013
2014
2015
2016
2017
Per
cen
t S
har
e o
f O
EC
Dg
US
EU28
PRC

Further Work in Science and Innovation Policy
You can develop scientometric models for other indicators, similar to econometric models, to provide policy levers
Here are some hints: [the best explanatory variables] Patents [Industrial GERD, BERD with lags] PhD Graduates in S&T [Researchers] International Market Share in Hi-Tech Products [GERD,
BERD with lags] Improved Models for Papers [Govt. GERD, HERD] Impacts and Citations [?]
Be cautious: like economics, scientometrics is social science, not rocket science
PS: I’ll be glad to help you

Update of Forecasts of National Positions
In 2009 data the leader was: US: GERD, impacts, patents EU: papers in SCI, S&E PhDs PRC: trade balance, hi-tech trade
But current forecasts predict that the PRC will gain: Lead in GERD by 2016 Pass US in S&E PhDs by 2015 (EU will still lead) Lead in papers in SCI by 2017

Index
US
201720152013201120092007200520032001199919971995
450000
400000
350000
300000
250000
200000
Accuracy MeasuresMAPE 3MAD 8545MSD 105323479
Variable
Forecasts
ActualFits
US GERDLinear Trend Model
Yt = 228465 + 9221.96*t
Linear Forecasts Depend on What Interval You Use
Index
US-1
2017201620152014201320122011201020092008
375000
370000
365000
360000
355000
350000
Accuracy MeasuresMAPE 0MAD 610MSD 479914
Variable
Forecasts
ActualFits
US GERD (Linear) Start at 2007Linear Trend Model
Yt = 375978 - 2535.3*tBased on 1995-2011
Based on 2008-2011

Conclusions
Forecasts predict that China will soon pass the US and EU in key indicators
I forecast that, if present trends continue, China will regain its historical leadership of world science and technology by 2017. It’s the Central Kingdom, after all.
But there are some caveats: Qualitative assessments of Chinese science are not
quite so positive, e.g. those of WTEC Black swan events also fill Chinese history: financial
or political upheavals could derail their progress—neither would be good for the West, either.

Key References Shelton, RD (2008) Relations between national research investment input and publication
output: Application to an American paradox. Scientometrics Vol. 74 No. 2, 191-205, Feb., 2008.
Shelton, RD & P Foland, (2009) The race for world leadership in science and technology: status and forecasts. Proceedings of the 12th International Conference on Scientometrics and Informetrics 369-380. Rio de Janerio, Also in Chinese in Science Focus (2010) 5:1 1-9.
Wilsdon, J, et al. (2011) Knowledge, networks, and nations: Global scientific collaboration in the 21st century. London: The Royal Society.
Shelton, RD & L. Leydesdorff, (2012) Publish or Patent: Bibliometric evidence for empirical trade-offs in national funding strategies. Journal of the American Society for Information Science and Technology. Vol. 63(3): 498-511.
Leydesdorff, L. (2012) World shares of publications of the USA, EU-27, and China compared and predicted using the new interface of the Web-of-Science versus Scopus. El Professional de la información 21 (1).
Shelton, RD & S. Monbo (2012). Input-output modelling and simulation of scientific indicators: A focus on patents, Proceedings of the 17th International Conference on Science and Technology Indicators, pp. 756-767. Montreal.
Zhou, P (2013) The growth momentum of China in producing international scientific publications seems to have slowed down. Information Processing and Management 49 (4) 1049 – 105.
Fu, J; R Frietsch, U Tagscherer (2013) : Publication activity in the Science Citation Index Expanded (SCIE) database in the context of Chinese science and technology policy from 1977 to 2012, Fraunhofer ISI Discussion Papers Innovation Systems and Policy Analysis, No. 35.
http://stats.oecd.org/Index.aspx?DataSetCode=MSTI_PUB MSTI 2013-1 database from the OECD Accessed 8/29/13

Appendix: Extra Slides
More info at http://itri2.org/Atlanta2/

Share of World SCIE Articles, Proc Papers, Reviews
0.0
5.0
10.0
15.0
20.0
25.0
30.0
35.0
40.0
45.0
1995 1996 1997 1998 1999 2000 2001 2002 2003 2004 2005 2006 2007 2008 2009 2010 2011 2012
Per
cen
t EU27
US
PRC
Update of Top National Positions in the SCIE
Some say the Chinese increase has changed from exponential to linear (or even ended!), but it is hard to tell here. (Whole WoS counts, and share of the world, not the fractional shares of OECDg in the Shelton Model.)

Linear forecast from 2005 to 2010 using data in Tables 1 and 2y1 = 5*s*y0 + y0 unless noted
2005 Slope 2010 2015US EU27 PRC US EU27 PRC US EU27 PRC US EU27 PRC
Population 297 492 1308 1 0.4 0.6 312 502 1347 327 512 1386Researchers 1388 1300 1119 1 3.1 10.6 1457 1502 1712 1527 1703 2305GDP 12376 13031 5333 5.5 4.4 12.9 15779 15898 8773 19183 18765 12213GERD 324 227 71 1.7 2.2 18.9 352 252 138 379 277 205GERD share 36 26 7.8 -2 -1.5 14.7 32 Constrained to add to 100%
0 0 0 0Papers 205320 234868 41596 1.5 1.3 17 220719 250134 76953 236118 265401 112309 SCI, based linear extrapolation, compare to Shelton ModelImpacts 1.47 1.09 0.63 0.6 1.1 2.3 1.51 1.15 0.70 1.56 1.21 0.77Patents 15774 14571 356 1.2 0.9 35.1 16720 15227 981 17667 15882 1606PhD 26275 45398 14858 1.6 2 17.3 28377 49938 27710 30479 54478 40562Nobel 0 0 0 0 0 0 China will clearly be far behind for a very long timeHi-Tech Exports 0 0 0 0 0 0 China will clearly lead if present trends continueTrade Balance -666 -127 82 5 9 45 -833 -184 267 -999 -241.3 451
Linear Extrapolation Details
Some indicators are zero sum--GERD share, for example. Results need to be constrained to add to 100%.

Foreign Industry R&D Funding
U.S. Industry R&D Funding
Patent Office
Applications
Backlog Queue Server
Grants
Multiplier
Delay
Multiplier
Delay
Abandonments
GPSS/H is used for simulation
Model for Applications and Grants from R&D Inputs
Shelton & Monbo (2012)

Index
PRC_1
2012
2011
2010
2009
2008
2007
2006
2005
2004
2003
2002
2001
2000
200000
150000
100000
50000
0
Accuracy MeasuresMAPE 11MAD 7474MSD 77752779
VariableActualFits
Trend Analysis Plot for PRC_1Linear Trend Model
Yt = 2598.42 + 13557.0*t
This also shows that Chinese paper growth is not linear, but continues to grow exponentially
PRC Papers in the WoS: Whole Counts

Total sales is not a zero-sum game—the hi-tech sector is growing rapidly worldwide
Hi-Tech Sales
0
500000
1000000
1500000
2000000
2500000
3000000
1995 1996 1997 1998 1999 2000 2001 2002 2003 2004 2005 2006 2007 2008 2009 2010 2011
$mil
lio
n (
curr
ent)
EU15
US
PRC
OECDg

First Differences in PhD Grads
-2000
-1000
0
1000
2000
3000
4000
5000
6000
2001 2002 2003 2004 2005 2006 2007 2008 2009 2010 2011
EU7
US
PRC
These discrete derivatives show roughly linear growth, but all rates slowed after mid-decade, except for the US 2011 point.

First Differences in GERD
-10000
-5000
0
5000
10000
15000
20000
25000
30000
35000
1996 1997 1998 1999 2000 2001 2002 2003 2004 2005 2006 2007 2008 2009 2010 2011$ m
illi
on
s (c
on
stan
t 20
05 P
PP
)
US
EU28
PRC
This discrete derivative shows whether changes are arithmetic (linear) or geometric (perhaps exponential)
Since its slope increases, Chinese GERD continues to grow geometrically, while the average in the West is only linear.

Ratio PhD Grads in S&E to Researchers
0
0.005
0.01
0.015
0.02
0.025
0.03
0.035
0.04
0.045
2000 2001 2002 2003 2004 2005 2006 2007 2008
US
EU15
PRC
This shows that the rate of new grads is approximately proportional to the total number of the current stock of researchers. This is a birth-death process, leading to a simple linear first-order differential equation model.

Ratio PhD Grads in S&E to Researchers
0
0.01
0.02
0.03
0.04
0.05
0.06
0.07
1999 2000 2001 2002 2003 2004 2005 2006 2007 2008
UK
Germany
France
Italy
This birth-death model works for some of Europe’s largest countries, but not all

Even in Percent Shares, the PRC is still rising faster than linear, while the others decrease fairly linearly, not keeping up with the rise in the overall SCIE
In the limit when the shares are US = EU27 = 0%, and the PRC = 100%, all these first differences must flatten out!
First Differences in Shares
-3.00
-2.50
-2.00
-1.50
-1.00
-0.50
0.00
0.50
1.00
1.50
2.00
1996
1997
1998
1999
2000
2001
2002
2003
2004
2005
2006
2007
2008
2009
2010
2011
2012
Per
cen
t
EU27
US
PRC
World (SCIE actually)

Scientific PublicationsINSPEC (Physical Sciences)
0
20000
40000
60000
80000
100000
120000
140000
1998 2000 2002 2004 2006 2008
USA
EU27
PRC
As forecast, China took the lead in 2008. It now has double the papers as the US.
Papers in Inspec by First Author's Location
0
50000
100000
150000
200000
250000
2000 2001 2002 2003 2004 2005 2006 2007 2008 2009 2010 2011
EU27
US
PRC

Triadic Patents
0
2000
4000
6000
8000
10000
12000
14000
16000
2000 2001 2002 2003 2004 2005 2006 2007 2008 2009 2010 2011
US
EU28
PRC
Triadic Patents
0
200
400
600
800
1000
1200
2000 2001 2002 2003 2004 2005 2006 2007 2008 2009 2010 2011
PRC
Triadic Patents Continue to Show China Rising Rapidly From a Small Base

Index
PRC
121110987654321
200000
150000
100000
50000
0
Accuracy MeasuresMAPE 15MAD 10043MSD 124480433
VariableActualFits
Trend Analysis Plot for PRCLinear Trend Model
Yt = -723.324 + 13741.6*t
This MiniTab plot also shows Chinese GERD increases faster than linear

Ki-prime for the WoS
0.00
0.20
0.40
0.60
0.80
1.00
1.20
1.40
1.60
2000 2001 2002 2003 2004 2005 2006 2007 2008 2009 2010 2011
US
EU
PRC
This is a new Ki-prime based on the WoS Whole Counts, 3 types of pubs, share of whole world, but divided by GERD share of OECDg.
I need to find out why the PRC efficiency changes here, perhaps because of their jump in investment in 2009

First Differences in Papers
-5000
0
5000
10000
15000
20000
25000
30000
35000
1996 1997 1998 1999 2000 2001 2002 2003 2004 2005 2006 2007 2008 2009 2010 2011 2012
EU27
US
PRC
A linear increase must result in constant finite differences, but the Chinese pattern shows a continuing increase in this discrete version of the derivative

Other Analyses of Paper Shares and Forecasts
Royal Society (2011) Forecasts WoS and Scopus crossings
Loet Leydesdorff (2012) Chinese growth has slowed Ping Zhou (2013) Chinese growth may have
stopped J. Fu, R Frietsch, & U Tagscherer (2013)

Applications to patent offices of Japan, USA, Europe, S. Korea, and PRC. From Zhou & Stembridge, Patented in China, Thompson Reuters World IP Today, 2010. The Chinese took the lead in 2011.
China’s Patent Office Now Leads the World