validation report for the cams greenhouse gas global
TRANSCRIPT

ECMWF COPERNICUS REPORT
Copernicus Atmosphere Monitoring Service
Validation report for the CAMS greenhouse gas global reanalysis for the period 2003-2010
Issued by: KNMI
Date: 6-5-2019
Ref: CAMS84_2018SC1_D5.1.2-2010_v1.2

This document has been produced in the context of the Copernicus Atmosphere Monitoring Service (CAMS). The activities leading to these results have been contracted by the European Centre for Medium-Range Weather Forecasts, operator of CAMS on behalf of the European Union (Delegation Agreement signed on 11/11/2014). All information in this document is provided "as is" and no guarantee or warranty is given that the information is fit for any particular purpose. The user thereof uses the information at its sole risk and liability. For the avoidance of all doubts, the European Commission and the European Centre for Medium-Range Weather Forecasts has no liability in respect of this document, which is merely representing the authors view.

Copernicus Atmosphere Monitoring Service
CAMS84_2018SC1_D5.1.2-2010_v1.2, GHG reanalysis 2003-2010 validation report Page 3 of 44
Validation report for the CAMS greenhouse gas global reanalysis for the period 2003-2010
AUTHORS: M. Ramonet (CEA-LSCE), B. Langerock (BIRA-IASB), T. Warneke (UBC), A. ElYazidi (CEA-LSCE), K. Yala (CEA-LSCE), H. Eskes (KNMI)
REPORT OF THE COPERNICUS ATMOSPHERE MONITORING SERVICE, VALIDATION SUBPROJECT.
AVAILABLE AT: HTTP://ATMOSPHERE.COPERNICUS.EU/
CITATION: Ramonet, M., B. Langerock, T. Warneke, A. ElYazidi , K. Yala, H. J. Eskes, Validation report of the CAMS greenhouse gas global reanalysis for the period 2003-2010, Copernicus Atmosphere Monitoring Service (CAMS) report CAMS84_2018SC1_D5.1.2-2010_v1.2.pdf, May 2019. STATUS: Version 1.2, final
DATE: 6/5/2019
Copernicus Atmosphere Monitoring Service
CAMS84_2018SC1_D5.1.2-2010_v1.2, GHG reanalysis 2003-2010 validation report Page 4 of 44
Summary
The Copernicus Atmosphere Monitoring Service (http://atmosphere.copernicus.eu, CAMS) is a component of the European Earth Observation programme Copernicus. The CAMS service focuses on atmospheric composition and consists of a global component as well as a European regional air quality component. Based on satellite and in-situ observations, the CAMS service produces daily analysis, forecasts as well as reanalyses.
As one of the service products, CAMS is producing global-scale reanalyses, one for the greenhouse gases, and one for the reactive gases and aerosol concentrations. The production of these reanalyses has started early 2017. The reactive gases and aerosols reanalysis for the period 2003-2016 became available in October 2018 (Inness et al., 2019). For the greenhouse gases, the validation report for the period 2003-2005 became available in July 2018 (Ramonet et al., 2018). The CAMS reanalysis will be further extended in the years up to 2021, catching up with real-time.
This document presents the validation results for the greenhouse gases (CO2, CH4) for the first 8 years of the reanalysis run, period 2003 - 2010. The evaluation of the reactive gas and aerosol reanalysis for the period 2003 - 2017 is discussed in a separate document (Bennouna et al., 2019) available from the CAMS website.
Below are the main conclusions from the validation work, for methane and carbon dioxide respectively. Detailed results can be found in the other sections in this report.
Methane
According to NDACC sites the reanalysis performs well in the troposphere (averaged relative differences across all sites being -0.2%), see Fig. S.1. For the stratospheric columns the mean relative bias is significantly higher (+5%), with a small positive trend, which is not seen in the troposphere. The reanalysis overestimates the CH4 total columns (TCCON) for most mid- and high-latitude sites, with a relative difference of up to 2.5%, but shows a better agreement for the low latitude sites (Izana, Darwin, Wollongong). At the surface we also observe a better agreement with the reanalysis at the low latitude sites (Mauna Loa, Samoa). At the higher latitude sites the bias is stronger, with both a trend and site dependent seasonal cycle. At most surface site the bias is going from positive to negative values.
Carbon dioxide
In the case of CO2 we validated the simulations over the period 2003-2010 with 23 surface stations, most of them covering the full period, and 15 total column monitoring sites most of them starting in 2007 (See Fig. S.2). The mean difference between the observations (surface and total column), and the control run increases regularly over time from about 0% in 2003 up to +3% in 2011. The same feature is observed at all stations.

Copernicus Atmosphere Monitoring Service
CAMS84_2018SC1_D5.1.2-2010_v1.2, GHG reanalysis 2003-2010 validation report Page 5 of 44
Figure S.1. Time series of the bias between the CAMS CH4 reanalysis and independent observations. Top-left: OBSPACK surface observations; top-right: TCCON observations; bottom: NDACC observations in the troposphere and stratosphere. Vertical axis is the station, horizontal axis is time.
Figure S.2. Time series of the CAMS CO2 reanalysis and independent observations. Top-left: Minamitorishima surface observations compared with the reanalysis and control run. Top-right: Comparison with TCCON observations in Bremen. Bottom-left: same as top-left, but relative difference. Bottom-right: same as top-right, but absolute difference. Red: reanalysis; blue: control run; black: observations.

Copernicus Atmosphere Monitoring Service
CAMS84_2018SC1_D5.1.2-2010_v1.2, GHG reanalysis 2003-2010 validation report Page 6 of 44
The reanalysis model agrees better with the measurements and relative differences are typically below 1%. Actually, the two simulations (control and reanalysis) remains very close from 2003 to 2006, when they start to diverge. In 2006 and 2007 the mean bias of the reanalysis is close to 1%, and then it decreases in 2008 to remain stable afterward. This change is linked to the assimilation of IASI which starts in 2007. In the Northern Hemisphere there is a seasonality in the relative differences between both runs. The magnitude of the seasonal difference (up to 4% at some surface sites in Summer) is site dependent and may be related to the number of observations assimilated at specific sites which is changing with time.

Copernicus Atmosphere Monitoring Service
CAMS84_2018SC1_D5.1.2-2010_v1.2, GHG reanalysis 2003-2010 validation report Page 7 of 44
Table of Contents
Summary 4
Table of Contents 7
1. Introduction 8
2. System summary and model background information 10
2.1 System based on the ECMWF IFS model 10 2.1.1 CAMS reanalysis system 10 2.1.2 Control 10 2.2 CAMS reanalysis product 11 2.3 Validation results for greenhouse gases 12
3. GHG reanalysis evaluation with surface observations 13
3.1 Validation with surface CO2 observations 13 3.2 Validation with surface CH4 observations 23
4. Validation against FTIR methane observations from NDACC 25
5. Validation of the GHG reanalysis with TCCON CO2 and CH4 31
6. References 38
7. Acknowledgements 43

Copernicus Atmosphere Monitoring Service
CAMS84_2018SC1_D5.1.2-2010_v1.2, GHG reanalysis 2003-2010 validation report Page 8 of 44
1. Introduction
The Copernicus Atmosphere Monitoring Service (CAMS, http://atmosphere.copernicus.eu/) is a component of the European Earth Observation programme Copernicus. The CAMS global near-real time (NRT) service provides daily analyses and forecasts of trace gas and aerosol concentrations. Apart from these daily analyses, CAMS is producing a global reanalysis and this reanalysis will be extended with recent years until 2021. A first release of the reactive gas and aerosol reanalysis occurred in October 2018 and was covering the 14-year period 2003-2016 (Inness et al., 2019).
The CAMS system was originally developed by a series of MACC research projects (MACC I-II-III) until it became operational in 2015. The CAMS near-real time and reanalysis services consist of daily analysis and forecasts with the ECMWF IFS system with modelling and data assimilation of trace gas concentrations and aerosol properties. A second component of CAMS consists of the provision of air-quality forecasts and reanalyses over Europe, based on an ensemble of European air quality models.
This document presents the validation of the global CAMS reanalysis of CO2 and CH4 for the years 2003-2010 during production (during the years 2017-2018). The CAMS validation methodology and measurement datasets are discussed in Eskes et al. (2015). The CAMS validation reports are accompanied by the "Observations characterization and validation methods" report, Douros et al. (2018), which describes the observations used in the comparisons, and the validation methodology. This report can also be found on the global validation page, http://atmosphere.copernicus.eu/user-support/validation/verification-global-services.
Key CAMS products and their users are: Boundary conditions for regional air quality models (e.g. AQMEII, air quality models not participating in CAMS); Long range transport of air pollution (e.g. LRTAP); Stratospheric ozone column and UV (e.g. WMO, DWD); 3D ozone fields (e.g. SPARC). CAMS data are made available to users as data products (grib or netcdf files) and graphical products from ECMWF, http://atmosphere.copernicus.eu/. Extended validation for the CAMS service products can be found online via regularly updated verification pages, http://atmosphere.copernicus.eu/user-support/validation/verification-global-services.
Table 1.1 provides an overview of the greenhouse gas species discussed in this CAMS reanalysis validation report. The reanalysis results are compared with results from a free model run without assimilation, to document the improvements from the assimilation. Two types of observations are used to validate the simulations: total/partial vertical columns from the TCCON (CO2 and CH4) and NDACC (CH4) networks; and surface observations of CO2 and CH4 concentrations. The ICOS dataset, which is used to validate the CAMS real-time forecast experiments, is not available since the project only started to produce observations in 2016. Alternatively, we are using the collaborative OBSPACK dataset compiled by NOAA/ESRL for CO2 (Obspack, 2016a) and for CH4 (Obspack, 2016b)
A summary of the reanalysis system setup is given in section 2. Section 3 gives an overview of the performance of the system against surface observations. Section 4 describes the performance of the system against TCCON observations, and section 5 describes the validation against NDACC.

Copernicus Atmosphere Monitoring Service
CAMS84_2018SC1_D5.1.2-2010_v1.2, GHG reanalysis 2003-2010 validation report Page 9 of 44
Table 1.1: Overview of the assimilation and validation datasets used for the CAMS greenhouse gas reanalysis. Shown are the datasets assimilated in the CAMS reanalyses (second column) and the datasets used for validation, as shown in this report (third column, last four rows). Green colours indicate that substantial data is available to either constrain the species in the analysis, or substantial data is available to assess the quality of the analysis. Note that not all the observations listed in the assimilation and validation column are available during the period evaluated (see e.g. Table 2.2).
Species, vertical range
Assimilation Validation
CO2, surface, PBL OBSPACK cooperative data product
CO2, column SCIAMACHY, IASI, TANSO TCCON
CH4, surface, PBL OBSPACK cooperative data product
CH4, column SCIAMACHY, IASI, TANSO TCCON, NDACC FTIR

Copernicus Atmosphere Monitoring Service
CAMS84_2018SC1_D5.1.2-2010_v1.2, GHG reanalysis 2003-2010 validation report Page 10 of 44
2. System summary and model background information
The specifics of the CAMS greenhouse gas reanalysis system setup are given in this section.
2.1 System based on the ECMWF IFS model
Key model information is given on the CAMS greenhouse gas (GHG) reanalysis data-assimilation and its control experiment. Further details on the different model runs and their data usage can be found on the global products documentation pages of the CAMS website.
2.1.1 CAMS reanalysis system
For the greenhouse gases CO2 and CH4 the reanalysis is produced with experiment identifiers gvqb (200301-200801) and gzre (200802-201012). In the end, the entire reanalysis is provided to users with one uniform access mechanism, and users do not have to worry about the underlying experiment ids mentioned here. The model resolution is T255 with 60 vertical layers. Here a summary of the main specifications of the CAMS GHG reanalysis system is given.
• The meteorological model is based on IFS version cy42r1, with interactive ozone and aerosol in radiation scheme, see also http://www.ecmwf.int/en/forecasts/documentation-and-support/changes-ecmwf-model; the model resolution is T255L60.
• CO2 and CH4 emissions are described in Table 2.1.
The model configuration for GHG is based on the specification of the following components documented in the listed papers below:
• Emissions for CO2 are documented in Agusti-Panareda et al. (2014), Massart et al. (2016).
• Bias correction for CO2 ecosystem fluxes based on the Biogenic Flux Adjustment Scheme is documented by Agusti-Panareda et al. (2016).
• Emissions and loss rate for CH4 is documented in Massart et al. (2014).
• Mass fixer configuration for CO2 and CH4 is documented by Agusti-Panareda et al. 2017 and also by an ECMWF Tech Memo which describes the latest updates (Diamantakis and Agusti-Panareda, 2017).
• NRT fire emissions are taken from GFASv1.2 (Kaiser et al. 2012).
2.1.2 Control
The control run applies the same settings as the reanalysis, based on the IFS system for cy42r1, except that data assimilation is not switched on. It consists of 24h cycling forecasts and uses the meteorological fields from the CAMS GHG reanalysis. The experiments producing the control run are gyb6 (200301-200801) and gzzo (200802-201012).

Copernicus Atmosphere Monitoring Service
CAMS84_2018SC1_D5.1.2-2010_v1.2, GHG reanalysis 2003-2010 validation report Page 11 of 44
Table 2.1: Emission datasets used in the CAMS reanalysis.
Emission dataset Details
GFAS v1.2: 20030101-
CO2 ocean fluxes Takahashi et al. (2009) climatology
CO2 emissions from aviation Based on ACCMIP NO emissions from aviation scaled to annual total CO2 from EDGAR aviation emissions.
CO2 ecosystem fluxes Based on CHTESSEL (modelled online in C-IFS) bias corrected with BFAS
CO2 anthropogenic emissions EDGARv4.2FT2010 (2003-2010)
CH4 wetland emissions LPJ-HYMN climatology (Spanhi et al., 2011)
CH4 total emissions Based on EDGARv4.2FT2010, LPJ-HYMN wetland climatology and other natural sources/sinks (2003-2010)
CH4 chemical sink Based on Bergamaschi et al. (2009) dataset
CH4 anthropogenic emissions EDGARv4.2FT2010 (2003-2010)
Table 2.2: Satellite retrievals of greenhouse gases that are actively assimilated in the reanalysis. The table only contains datasets used for the years 2003-2010. For an assessment of the CCI products, see Chevallier et al. (2017).
Variable Instrument Satellite Product Origin Period AK
CO2 SCIAMACHY Envisat TC CCI Bremen 20030101-20120324 yes
CH4 SCIAMACHY Envisat TC CCI SRON V7 20030108-20100331 yes
CO2 IASI METOP A&B
TC LMD v8.0 20070701-20150531 yes
CH4 IASI METOP A&B
TC LMD V8.3 20070701-20150630 yes
CO2 Tanso Gosat TC CCI SRON (V2.3.6) 200906-201312 yes
CH4 Tanso Gosat TC CCI SRON (V2.3.6) 200906-201312 yes
2.2 CAMS reanalysis product
The CAMS 3D reanalysis products are stored as 3-hourly fields and will be available from the CAMS website, http://atmosphere.copernicus.eu/ and the Copernicus Atmosphere Data Store (ADS). The following fields are archived:
• Forecast fields: From 0z, 3-hourly, step=0,3,.., 48
• Analysis fields: Every 3 hours, e.g. 0z, 3z,...21z
• Surface forecast fields: From 0z, 1-hourly, step=0,1,2,...,48

Copernicus Atmosphere Monitoring Service
CAMS84_2018SC1_D5.1.2-2010_v1.2, GHG reanalysis 2003-2010 validation report Page 12 of 44
Several parameters are also available as synoptic monthly means, for each particular time and forecast step (stream=mnth) and as monthly means of daily means, for the month as a whole (stream=moda), see https://confluence.ecmwf.int/display/CKB/CAMS+Reanalysis+data+documentation.
2.3 Validation results for greenhouse gases
The following sections present the validation results of the CAMS global reanalysis for greenhouse gases. Naming and color-coding conventions predominantly follow the scheme as given in the table below:
Name in figs Experiments Colour
{obs name} {obs} black
CAMS reanalysis gvqb, gzre red
Control gyb6, gzzo blue

Copernicus Atmosphere Monitoring Service
CAMS84_2018SC1_D5.1.2-2010_v1.2, GHG reanalysis 2003-2010 validation report Page 13 of 44
3. GHG reanalysis evaluation with surface observations
We have used the continuous long-term CO2 and CH4 time series available in the collaborative OBSPACK dataset compiled by NOAA/ESRL for both species (Figure 3.1). Considering the period 2003-2010, 24 surface sites have been extracted from the latest CO2 OBSPACK version released on October 29, 2018 (obspack-co2-1-GLOBALVIEWplus_v4.1_2018-10-29), and only 10 sites for CH4 (obspack_ch4_1_GLOBALVIEWplus_v1.0_2019_01_08).
CO2 data from the following sites has been used: Alert (ALT), Candle Lake (CDL), Fraserdale (FSD), Sable Island (WSA) (Worthy et al., 2003); Argyle (AMT), Park Falls (LEF), Moody (WKT) (Andrews et al., 2013); Point Barrow (BRW) (Peterson et al.1986); Mace Head (MHD) (Ramonet et al. 2010); Cabauw (CES) (Vermeulen et al., 2011); Kasprowy (KAS) (Rozanski et al., 2003); Schauinsland (SSL) (Schmidt et al., 2003); Hegyhatsall (HUN) (Haszpra et al., 2001); puy de Dôme (PUY) (Lopez et al., 2015); Ryori (RYO), Minamitorishima (MNM), Yonagunijima (YON) (Tsutsumi et al., 2005); Samoa (SMO) (Halter et al., 1988); Sout Pole (SPO) (Gillette et al., 1987); Cape Point (CPT) (Brunke et al., 2004); Amsterdam Island (AMS) (Gaudry et al., 1991); Baring Head (BHD) (Brailsford et al., 2012); Syowya (SYO).
CH4 data from the following sites have been used: Point Barrow (BRW), Mauna Loa (MLO), Samoa (SMO), Cape Point (CPT) (Dlugokencky et al., 1995); Alert (ALT), Candle Lake (CDL), Fraserdale (FSD) Sable Island (WSA) (Worthy et al., 2003); Hegyhatsall (HUN); Park Falls (LEF).
3.1 Validation with surface CO2 observations
Results are shown in figure 3.1.1 for three surface stations: South Pole (Southern hemisphere), Minamitorishima (Tropics) and Mace Head, Ireland (Northern Hemisphere). At these three stations the differences of the observations with the control run show a steadily increasing bias between 2003 and 2010 from 0 to 2.5%. The comparison with the reanalysis can be separated in three periods:
• simulated values relatively close to the control runs from 2003 to 2005 (bias up to 0.5%)
• stabilization of the bias for the reanalysis from 2005 to 2007
• decrease of the bias in 2007/2008 and stabilization afterwards
The change in bias after 2007 shows the impact of the assimilation of IASI retrievals. From the Taylor plots shown in Figure 3.1.2 we can compare the correlation coefficients and standard deviations for the control run and the reanalysis at all stations. There is no systematic improvement of the correlation coefficient with the reanalysis compared to the control run, but the standard deviation (SD) is improved at many stations (Figure 3.1.2). The ratio observed SD / modelled SD is lower than 1 at all stations (except one) with the control run and is systematically increased with the reanalysis. For this later run it is lying close to 1 for most of the stations, but there are two groups of sites on both side of the 1:1 line. Five stations show an overestimated simulated SD (ratio between 0.75 and 0.85), and five others an underestimated SD (ratio between 1.2 and 1.35). In this later group we find the 5 European stations (CES, HUN, KAS, PUY, SSL), three of them being set up on mountain sites. It is not clear at this stage if there is a regional effect for Europe, or if this is related to the type of stations considered.

Copernicus Atmosphere Monitoring Service
CAMS84_2018SC1_D5.1.2-2010_v1.2, GHG reanalysis 2003-2010 validation report Page 14 of 44
Figure 3.1. Overview of the geographical distribution of the surface stations (left), and NDACC and TCCON FTIR instruments (right).
All surface stations are also represented in Figure 3.1.3, showing the CO2 bias (in ppm) weekly averaged from 2003 to 2010 for the control run and the reanalysis. As shown in more details at few stations (Figure 3.1.1), we clearly see the similarities of the two simulations from 2003 to 2006, and the significantly reduced bias in the reanalysis after 2008. We also observe few outliers in the model/data comparison. For example, the models strongly overestimate CO2 concentrations at RYO, a coastal site located 120 km apart from Sendai, Japan (Watanabe et al., 2000). In such case the models can overestimate the CO2 concentrations due to the anthropogenic activities inside the grid of the model (80 km resolution). One solution to improve the model/data compatibility would be to

Copernicus Atmosphere Monitoring Service
CAMS84_2018SC1_D5.1.2-2010_v1.2, GHG reanalysis 2003-2010 validation report Page 15 of 44
Figure 3.1.1: Comparison of the CO2 daily mean OBSPACK surface observation (black) with the reanalysis (red) and the control run (blue) at South Pole (top), Minamitorishima (middle) and Mace Head (bottom). Lower panels: differences of the observations minus the simulations. Right panels: Linear fit between observations and simulations.

Copernicus Atmosphere Monitoring Service
CAMS84_2018SC1_D5.1.2-2010_v1.2, GHG reanalysis 2003-2010 validation report Page 16 of 44
Figure 3.1.2: Taylor diagrams relating the standard deviations for the model and time series of CO2 mole fractions at the surface for the control run (left) and the reanalysis (right). All time-series (2003-2010) are normalized such that the standard deviation of the model is equal to one. Values greater than one indicate an underestimation of the observed variability. There are 3 symbols depending on the type of stations: square symbols for continental stations, triangles for mountain stations and circles for background/oceanic stations (from the OBSPACK distribution).
use one grid offshore to reduce the contribution of local emissions in the simulations. In the Southern hemisphere the station of Baring Head (BHD) also appears as an outlier with negative biases when other sites in this area of the world display positive offset. At this site a quite complex procedure is used to select background data, corresponding to air masses originating from the Southern Indian Ocean and reaching directly the station located between the South and North islands of New-Zealand (Brailsford et al., 2012; Stephens et al., 2013). For this reason, there are only very few data selected, and the models probably have a too high biospheric activity due to the grid resolution. Except for those outliers we observe different seasonal behavior for the Northern Hemisphere sites. Especially three of them located in Northern America (CDL, FSD, AMT) show strong negative biases every Summer. At these sites the summertime CO2 drawdown is overestimated in the reanalysis by about 4% (10-20 ppm). At other Northern Hemisphere stations in Europe, USA (WSA, LEF), or boreal latitudes (BRW, ALT) the seasonal variability of the CO2 bias is different, especially marked with positive offset in Spring and early Summer.
Some sites also show negative biases in late Summer/Fall. Such differences in the seasonal cycles must be related to the surface fluxes from the vegetation. A more detailed analysis would be needed to verify the kind of ecosystems present in the footprint of those stations.
In the last analysis (Figure 3.1.4) we have averaged the model/data diagnostics at the surface stations for 3 categories: Northern Hemisphere, Tropics, and Southern Hemisphere. More stations are available in the Northern Hemisphere (15) compared to the other areas where we have only 3 and 5 sites respectively. This analysis aims to provide a synthetic overview of the model performances. However, considering the seasonal differences observed at the stations in Northern Hemisphere (Figure 3.1.3) the mean diagnostic may be somehow misleading. The main conclusions which can be deduced from those figures are the following:

Copernicus Atmosphere Monitoring Service
CAMS84_2018SC1_D5.1.2-2010_v1.2, GHG reanalysis 2003-2010 validation report Page 17 of 44
• the CO2 bias and the RMSE are significantly reduced in the reanalysis compared to the control run from 2007 after the assimilation of IASI retrievals began;
• in the Tropics and Southern Hemisphere the reanalysis displays a positive bias increasing from 0 to 3 ppm from 2003 to 2007, and close to 1.5 ppm afterward;
• in the Northern Hemisphere a seasonal cycle is superimposed on the longer-term signal, with biases ranging between -2 and +6 ppm with the maximum values reached in summertime. The summer is also characterized by higher RMSE and lower coefficient correlations.

Copernicus Atmosphere Monitoring Service
CAMS84_2018SC1_D5.1.2-2010_v1.2, GHG reanalysis 2003-2010 validation report Page 18 of 44
Figure 3.1.3: Mosaic plot of CO2 biases (in ppm) of the CAMS products (top: control, bottom: reanalysis) compared to surface station observations. Each vertical coloured line represents a weekly mean.

Copernicus Atmosphere Monitoring Service
CAMS84_2018SC1_D5.1.2-2010_v1.2, GHG reanalysis 2003-2010 validation report Page 19 of 44
Figure 3.1.4a: Monthly statistics (bias, RMSE, correlation coefficients) of control run (top) and reanalysis (bottom) compared to the surface measurements. The results obtained for 15 Northern hemisphere sites (see the list of sites in the title) are averaged.

Copernicus Atmosphere Monitoring Service
CAMS84_2018SC1_D5.1.2-2010_v1.2, GHG reanalysis 2003-2010 validation report Page 20 of 44
Figure 3.1.4b: Same for Tropics (3 stations)

Copernicus Atmosphere Monitoring Service
CAMS84_2018SC1_D5.1.2-2010_v1.2, GHG reanalysis 2003-2010 validation report Page 21 of 44
Figure 3.1.4c: Same for Southern hemisphere (5 stations)

Copernicus Atmosphere Monitoring Service
CAMS84_2018SC1_D5.1.2-2010_v1.2, GHG reanalysis 2003-2010 validation report Page 22 of 44
Figure 3.2.1: Comparison of CH4 daily mean surface observations (black) with the reanalysis (red) and the control run (blue) at Alert (top), Fraserdale (middle) and Mauna Loa (bottom). Lower-left: differences of the observations minus the simulations. Right: Linear fit between observations and simulations.
Copernicus Atmosphere Monitoring Service
CAMS84_2018SC1_D5.1.2-2010_v1.2, GHG reanalysis 2003-2010 validation report Page 23 of 44
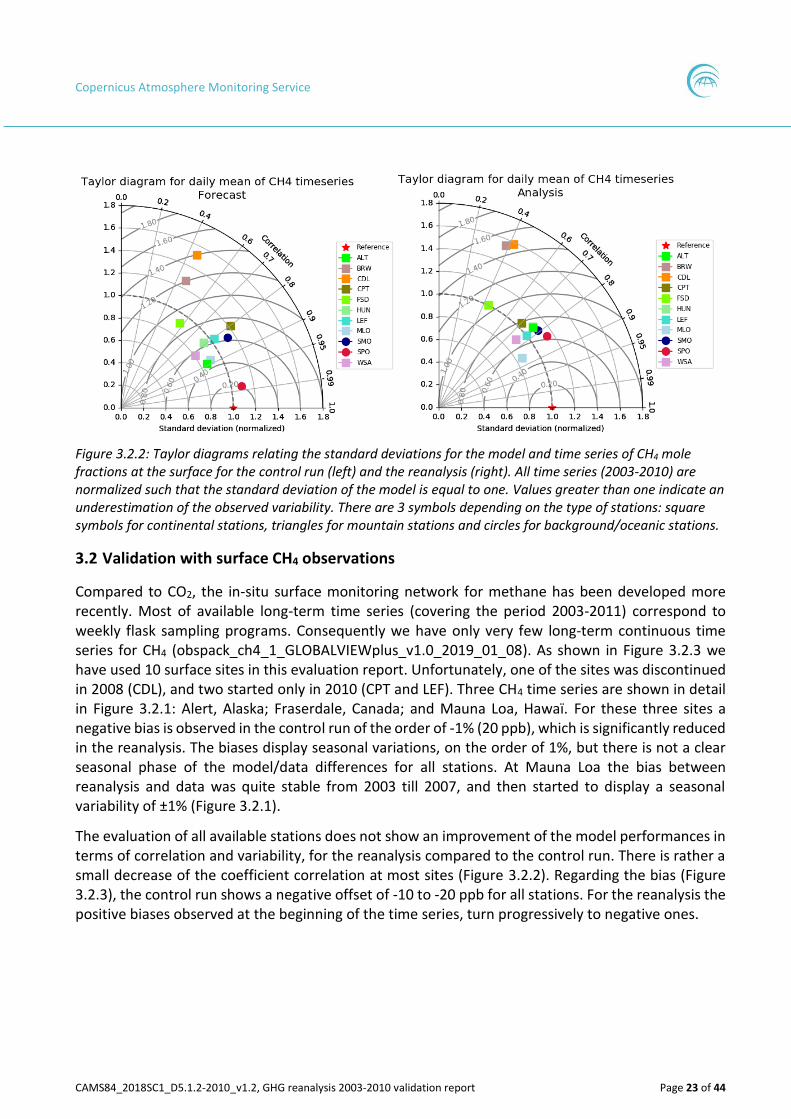
Figure 3.2.2: Taylor diagrams relating the standard deviations for the model and time series of CH4 mole fractions at the surface for the control run (left) and the reanalysis (right). All time series (2003-2010) are normalized such that the standard deviation of the model is equal to one. Values greater than one indicate an underestimation of the observed variability. There are 3 symbols depending on the type of stations: square symbols for continental stations, triangles for mountain stations and circles for background/oceanic stations.
3.2 Validation with surface CH4 observations
Compared to CO2, the in-situ surface monitoring network for methane has been developed more recently. Most of available long-term time series (covering the period 2003-2011) correspond to weekly flask sampling programs. Consequently we have only very few long-term continuous time series for CH4 (obspack_ch4_1_GLOBALVIEWplus_v1.0_2019_01_08). As shown in Figure 3.2.3 we have used 10 surface sites in this evaluation report. Unfortunately, one of the sites was discontinued in 2008 (CDL), and two started only in 2010 (CPT and LEF). Three CH4 time series are shown in detail in Figure 3.2.1: Alert, Alaska; Fraserdale, Canada; and Mauna Loa, Hawaï. For these three sites a negative bias is observed in the control run of the order of -1% (20 ppb), which is significantly reduced in the reanalysis. The biases display seasonal variations, on the order of 1%, but there is not a clear seasonal phase of the model/data differences for all stations. At Mauna Loa the bias between reanalysis and data was quite stable from 2003 till 2007, and then started to display a seasonal variability of ±1% (Figure 3.2.1).
The evaluation of all available stations does not show an improvement of the model performances in terms of correlation and variability, for the reanalysis compared to the control run. There is rather a small decrease of the coefficient correlation at most sites (Figure 3.2.2). Regarding the bias (Figure 3.2.3), the control run shows a negative offset of -10 to -20 ppb for all stations. For the reanalysis the positive biases observed at the beginning of the time series, turn progressively to negative ones.

Copernicus Atmosphere Monitoring Service
CAMS84_2018SC1_D5.1.2-2010_v1.2, GHG reanalysis 2003-2010 validation report Page 24 of 44
Figure 3.2.3: Mosaic plot of CH4 biases (in ppm) of the CAMS products (above: control, below: reanalysis) compared to surface observations. Each vertical coloured line represents a weekly mean.

Copernicus Atmosphere Monitoring Service
CAMS84_2018SC1_D5.1.2-2010_v1.2, GHG reanalysis 2003-2010 validation report Page 25 of 44
4. Validation against FTIR methane observations from NDACC
In this section, we compare the CH4 profiles of the CAMS reanalysis model with FTIR measurements at selected NDACC sites (see Figure 3.1 and Figure 4.1). These ground-based, remote-sensing instruments are sensitive to the CH4 abundance in the troposphere and lower stratosphere, i.e. between the surface and up to 25 km altitude. From the FTIR profile retrievals, we deduce a tropospheric column, a stratospheric column and a total column between the surface and 25km and each is compared to the corresponding column derived from the CAMS model data. In the co-location criteria, the line of sight of the FTIR measurement is taken into account and the FTIR averaging kernel is applied to the co-located model data. A more detailed description of the instruments and applied methodologies can be found at http://nors.aeronomie.be. The typical total uncertainty of the FTIR CH4 column is rather high due to spectroscopic uncertainties. The total column (surf-60km) has a typical uncertainty of approximately 4%. The uncertainty for tropospheric column is typically 3.5%, while stratospheric have a typical uncertainty of 7%.
The main observations drawn from the comparison against NDACC partial column data are summarized as
• Both runs perform well in the troposphere (Figure 4.4(a)), with averaged relative differences across all sites being -0.2% for the reanalysis and -1% for the control run, both well within the measurement’s uncertainty. For the stratospheric column (Figure 4.4(b)), the reanalysis (5% mean relative bias) performs slightly worse than the control run (3.6% mean relative bias).
Figure 4.1. Overview of the FTIR CH4 data product time series available on NDACC. Sites are sorted by latitude. The plot shows dry air column averaged methane. Due to outliers in Bremen and Paramaribo, these sites are left out from the results presented here. The Wollongong instrument 001 only reports column and is left out. Toronto experienced instrumental problems in 2008.

Copernicus Atmosphere Monitoring Service
CAMS84_2018SC1_D5.1.2-2010_v1.2, GHG reanalysis 2003-2010 validation report Page 26 of 44
Figure 4.2 (a). Time series plots of the tropospheric partial column of CAMS compared with FTIR observations at the two NDACC stations Jungfraujoch (top) and Arrival Heights (bottom, Antarctic station). The relative differences of the tropospheric columns are plotted. The trend for the bias of the tropospheric column data is negligible.
• Concerning the stability of relative differences throughout the entire time series (see Figure 4.2(a)) the reanalysis and the control run perform equal in the troposphere with negligible trends (see also Figure 4.5). In the stratosphere, the reanalysis has a stronger positive trend compared to the control run (Figure 4.2(b)).
• From the Taylor diagrams in Figure 4.3, the correlation coefficients for both reanalysis and control run are comparable.
• Figure 4.5 shows the monthly mean relative difference at two stations (Lauder and Jungfraujoch) with a periodic fitting to show the seasonal dependence. During local autumn/winter months the relative bias reaches a minimum and the models underestimate the CH4 concentration. The seasonal dependence may be related to OH in the model.

Copernicus Atmosphere Monitoring Service
CAMS84_2018SC1_D5.1.2-2010_v1.2, GHG reanalysis 2003-2010 validation report Page 27 of 44
Figure 4.2 (b). Time series plots of the stratospheric partial column of the CAMS reanalysis (red) and control run (blue) compared with FTIR observations at the two NDACC stations Jungfraujoch (top) and Arrival Heights (bottom, Antarctic station). The daily mean relative differences for the stratospheric columns are plotted. The stratospheric relative differences show a positive trend for both the reanalysis and the control run. The reanalysis has a stronger trend of approx. 0.2%/y in addition to the positive trend seen in the control run.

Copernicus Atmosphere Monitoring Service
CAMS84_2018SC1_D5.1.2-2010_v1.2, GHG reanalysis 2003-2010 validation report Page 28 of 44
Figure 4.3. Taylor diagrams for the total CH4 column against FTIR observations of NDACC (left: control run; right: reanalysis). Both experiments have a similar performance with values ranging between 0.6 and 0.9. The tropical site at Mauna Loa performs worse.
Figure 4.4 (a). Mosaic plot of seasonal relative biases at all NDACC FTIR sites (top: reanalysis, bottom: control) for the tropospheric CH4 columns. The reanalysis has higher methane concentrations than the control run. In the troposphere the assimilation reduces the overall relative bias.

Copernicus Atmosphere Monitoring Service
CAMS84_2018SC1_D5.1.2-2010_v1.2, GHG reanalysis 2003-2010 validation report Page 29 of 44
Figure 4.4 (b). Mosaic plot of seasonal relative biases at all NDACC FTIR sites (top: reanalysis, bottom: control) for the stratospheric columns. The reanalysis has higher methane concentrations compared to the control run for the stratosphere. In the stratospheric column the assimilation increases the overall bias.

Copernicus Atmosphere Monitoring Service
CAMS84_2018SC1_D5.1.2-2010_v1.2, GHG reanalysis 2003-2010 validation report Page 30 of 44
Figure 4.5. Monthly mean relative difference time series showing the seasonal dependence for tropospheric columns against NDACC FTIR observations at Lauder (top) and Jungfraujoch (bottom) (the red line is a periodic fitting of the relative difference). During spring/summer the relative bias is lowest, and during autumn/winter months the reanAN underestimates the CH4 concentrations in the troposphere. A similar pattern is observed for the tropospheric control model. The stratospheric columns do not show this seasonal dependence.

Copernicus Atmosphere Monitoring Service
CAMS84_2018SC1_D5.1.2-2010_v1.2, GHG reanalysis 2003-2010 validation report Page 31 of 44
5. Validation of the GHG reanalysis with TCCON CO2 and CH4
In this section, we compare column averaged mole fractions of CO of the CAMS reanalysis model (reanAN) and the control model with TCCON retrievals. Data from the following TCCON sites has been used: Izana (Blumenstock et al., 2017), Reunion (De Mazière et al., 2017), Bialystok (Deutscher et al., 2017), Manaus (Dubey et al., 2017), Four Corners (Dubey et al., 2017), Ascension (Feist et al., 2017), Anmeyondo (Goo et al., 2017), Darwin (Griffith et al., 2017), Wollongong (Griffith et al., 2017), Karlsruhe (Hase et al., 2017), Edwards (Iraci et al., 2017), Indianapolis (Iraci et al., 2017), Saga (Kawakami et al., 2017), Sodankyla (Kivi et al., 2017), Hefei (Liu et al., 2018), Tsukuba (Morino et al., 2017), Burgos (Morino et al., 2018), Rikubetsu (Morino et al., 2017), Bremen (Notholt et al., 2017), Spitsbergen (Notholt et al., 2017), Lauder (Sherlock et al., 2017, Pollard et al., 2019), Eureka (Strong et al., 2018), Garmisch (Sussmann et al., 2017), Zugspitze (Sussmann et al., 2018), Paris (Te et al., 2017), Orleans (Warneke et al., 2017), Park Falls (Wennberg et al., 2017), Caltech (Wennberg et al., 2017), Lamont (Wennberg et al., 2017), Jet Propulsion Laboratory (Wennberg et al., 2017), East Trout Lake (Wunch et al., 2017).
The TCCON ground-based, remote-sensing measurements are performed in the near IR spectral region and have the sensitivity that is highest close to the Earth’s surface (Wunch et al., 2011). The standard TCCON data products are column averaged mole fractions. TCCON obtains the column averaged mole fractions from a ratio of the gas of interest and O2. This ratio is then multiplied by the mole fraction of O2 yielding the dry air mole fraction. Since the variations of the O2 mole fraction in the atmosphere is several magnitudes smaller than the uncertainty of the TCCON data product it can be regarded as constant. The advantage of this approach is that systematic errors common to the columns of the gas and O2 partially cancel out. The column averaged mole fractions can also be calculated via the atmospheric pressure corrected by the atmospheric water content.
In the co-location criteria, the line of sight of the FTIR measurement is taken into account and the FTIR averaging kernel is applied to the co-located model data. A description of the applied methodologies for the comparison is given in Langerock et al. (2015). An example of such a comparison is shown for the TCCON site in Bremen in Figure 5.1 (a) and Figure 5.1 (b).
For CH4 the control run (lower panel in Figure 5.2 (a)) compares well with the mid- and high-latitude sites in both hemispheres. For the lower latitude sites Izana and Darwin the model strongly underestimates the CH4. This latitudinal behavior can nicely be seen in Figure 5.3 (blue columns in upper plot).
Copernicus Atmosphere Monitoring Service
CAMS84_2018SC1_D5.1.2-2010_v1.2, GHG reanalysis 2003-2010 validation report Page 32 of 44
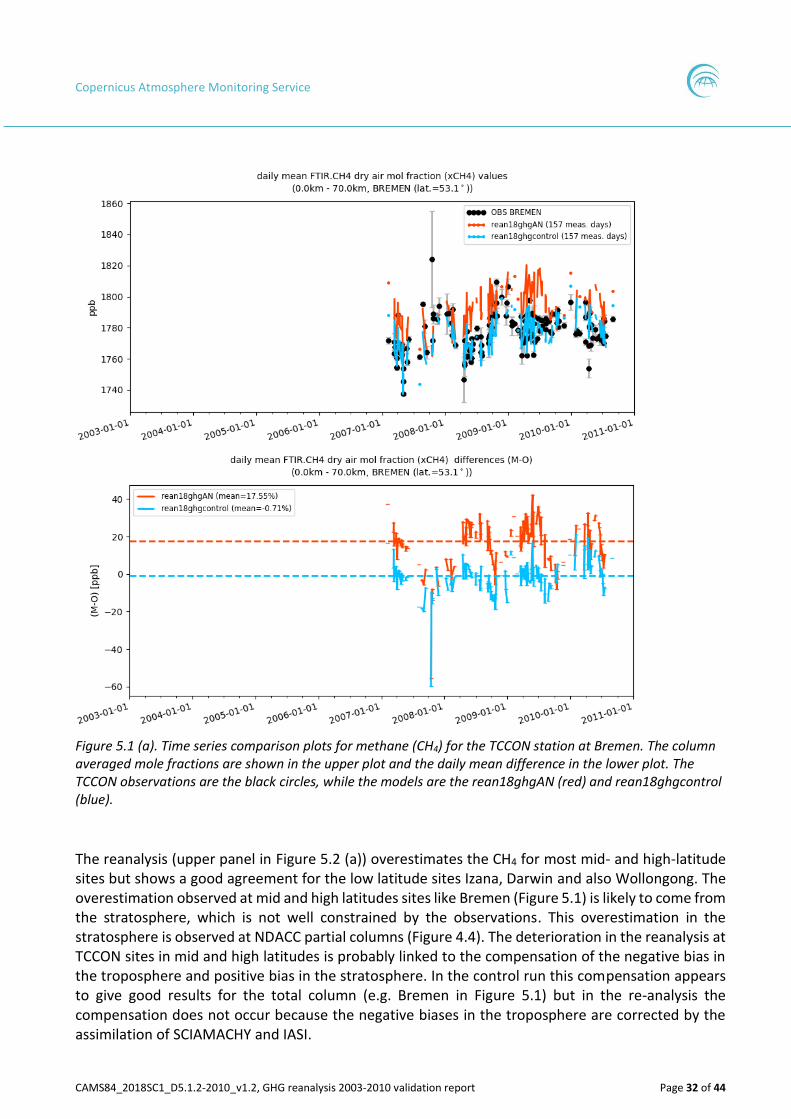
Figure 5.1 (a). Time series comparison plots for methane (CH4) for the TCCON station at Bremen. The column averaged mole fractions are shown in the upper plot and the daily mean difference in the lower plot. The TCCON observations are the black circles, while the models are the rean18ghgAN (red) and rean18ghgcontrol (blue).
The reanalysis (upper panel in Figure 5.2 (a)) overestimates the CH4 for most mid- and high-latitude sites but shows a good agreement for the low latitude sites Izana, Darwin and also Wollongong. The overestimation observed at mid and high latitudes sites like Bremen (Figure 5.1) is likely to come from the stratosphere, which is not well constrained by the observations. This overestimation in the stratosphere is observed at NDACC partial columns (Figure 4.4). The deterioration in the reanalysis at TCCON sites in mid and high latitudes is probably linked to the compensation of the negative bias in the troposphere and positive bias in the stratosphere. In the control run this compensation appears to give good results for the total column (e.g. Bremen in Figure 5.1) but in the re-analysis the compensation does not occur because the negative biases in the troposphere are corrected by the assimilation of SCIAMACHY and IASI.

Copernicus Atmosphere Monitoring Service
CAMS84_2018SC1_D5.1.2-2010_v1.2, GHG reanalysis 2003-2010 validation report Page 33 of 44
Figure 5.1 (b). Time series comparison plots for CO2 for the TCCON station at Bremen. The column averaged mole fractions are shown in the upper plot and the daily mean relative difference in the lower plot. The TCCON observations are the black circles, while the CAMS configurations are the analysis (red) and control (blue).
In the case of CO2 the control run (lower panel in Figure 5.2 (b)) overestimates the xCO2. As also seen in the example of Bremen (Figure 5.1 (b)) the difference increases over the time of the comparison. This is not limited to Bremen but seen for most sites. The reanalysis (upper panel in Figure 5.2 (b)) agrees better with the measurements than the control run.
Both CH4 and CO2 show a seasonality in the relative differences between both runs. The magnitude is site dependent.

Copernicus Atmosphere Monitoring Service
CAMS84_2018SC1_D5.1.2-2010_v1.2, GHG reanalysis 2003-2010 validation report Page 34 of 44
Figure 5.2 (a). Mosaic plot of CH4 seasonal differences at all TCCON sites. The analysis is shown in the upper panel and the control run in the lower panel. The sites are ordered by latitude. The site name is on the left vertical axis and the corresponding latitude is indicated on the right vertical axis.

Copernicus Atmosphere Monitoring Service
CAMS84_2018SC1_D5.1.2-2010_v1.2, GHG reanalysis 2003-2010 validation report Page 35 of 44
Figure 5.2 (b). Mosaic plot of CO2 seasonal differences at all TCCON sites. The analysis is shown in the upper panel and the control run in the lower panel. The sites are ordered by latitude. The site name is on the left vertical axis and the corresponding latitude is indicated on the right vertical axis.

Copernicus Atmosphere Monitoring Service
CAMS84_2018SC1_D5.1.2-2010_v1.2, GHG reanalysis 2003-2010 validation report Page 36 of 44
Figure 5.3. Histogram plots of differences against TCCON observations for daily mean timeseries (CH4 in the upper plot and CO2 in the bottom plot). The comparisons with the analysis are shown in red and the ones for the control model in blue. Stations are ordered by latitude, from North Pole to South Pole.

Copernicus Atmosphere Monitoring Service
CAMS84_2018SC1_D5.1.2-2010_v1.2, GHG reanalysis 2003-2010 validation report Page 37 of 44
Figure 5.4 (a) Taylor diagrams for the xCH4 compared to TCCON observations. Left: control run; right: reanalysis.
Figure 5.4 (b) Taylor diagrams for the xCO2 compared to TCCON observations. Left: control run; right: reanalysis.

Copernicus Atmosphere Monitoring Service
CAMS84_2018SC1_D5.1.2-2010_v1.2, GHG reanalysis 2003-2010 validation report Page 38 of 44
6. References
Agustí-Panareda, A., Massart, S., Chevallier, F., Boussetta, S., Balsamo, G., Beljaars, A., Ciais, P., Deutscher, N. M., Engelen, R., Jones, L., Kivi, R., Paris, J.-D., Peuch, V.-H., Sherlock, V., Vermeulen, A. T., Wennberg, P. O., and Wunch, D.: Forecasting global atmospheric CO2, Atmos. Chem. Phys., 14, 11959-11983, doi:10.5194/acp-14-11959-2014, 2014.
Agustí-Panareda, A., Massart, S., Chevallier, F., Balsamo, G., Boussetta, S., Dutra, E., and Beljaars, A.: A biogenic CO2 flux adjustment scheme for the mitigation of large-scale biases in global atmospheric CO2 analyses and forecasts, Atmos. Chem. Phys., 16, 10399-10418, doi:10.5194/acp-16-10399-2016, 2016.
Agusti-Panareda, A., Diamantakis, M., Bayona, V., Klappenbach, F., and Butz, A.: Improving the inter-hemispheric gradient of total column atmospheric CO2 and CH4 in simulations with the ECMWF semi-Lagrangian atmospheric global model, Geosci. Model Dev., 10, 1-18, doi:10.5194/gmd-10-1-2017, 2017.
Bennouna, Y., M. Schulz, Y. Christophe, H.J. Eskes, S. Basart, A. Benedictow, A.-M. Blechschmidt, S. Chabrillat, H. Clark, E. Cuevas, H. Flentje, K.M. Hansen, U. Im, J. Kapsomenakis, B. Langerock, K. Petersen, A. Richter, N. Sudarchikova, V. Thouret, A. Wagner, Y. Wang, C. Zerefos, Validation report of the CAMS global Reanalysis of aerosols and reactive gases, years 2003-2017, Copernicus Atmosphere Monitoring Service (CAMS) report, CAMS84_2018SC1_D5.1.1-2017_v1.pdf, February 2019, doi:10.24380/ xjhk-zt69.
Bergamaschi, P., et al. (2009), Inverse modeling of global and regional CH4 emissions using SCIAMACHY satellite retrievals, J. Geophys. Res., 114, D22301, doi: 10.1029/2009JD012287.
Bergamaschi, P., et al. (2013), Atmospheric CH4 in the first decade of the 21st century: Inverse modeling analysis using SCIAMACHY satellite retrievals and NOAA surface measurements, J. Geophys. Res. Atmos., 118, 7350–7369, doi:10.1002/jgrd.50480.
Brailsford, G.W., Stephens, B.B., Gomez, A.J., Riedel, K., Mikaloff-Fletcher, S., Nichol, S., and Manning, M.: Long-term continuous atmospheric CO2 measurements at Baring Head, New Zealand, Atmos. Meas. Tech., 5, 3109-3117, doi:10.5194/amt-5-3109-2012,2012.
Chevallier, F., P. Bergamaschi, D. Brunner, L. Feng, S. Houweling, T. Kaminski, W. Knorr, J. Marshall, P. I. Palmer, S. Pandey, M. Reuter, M. Scholze, and M. Voßbeck, Climate Assessment Report for the GHG-CCI project of ESA’s Climate Change Initiative, pp. 96, version 4, 28 March 2017.
Diamantakis, M, Agusti-Panareda, A, A positive definite tracer mass fixer for high resolution weather and atmospheric composition forecasts, ECMWF Tech Memo 819, https://www.ecmwf.int/en/elibrary/17914-positive-definite-tracer-mass-fixer-high-resolution-weather-and-atmospheric, doi:10.21957/qpogzoy, 2017.
Douros, J., S. Basart, A. Benedictow, A.-M. Blechschmidt, S. Chabrillat, Y. Christophe, H. Clark, E. Cuevas, H.J. Eskes, H. Flentje, K. M. Hansen, J. Kapsomenakis, B. Langerock, K. Petersen, M. Ramonet, A. Richter, M. Schulz, A. Wagner, T. Warneke, C. Zerefos, Observations characterisation and validation methods document, Copernicus Atmosphere Monitoring Service (CAMS) report, CAMS84_2015SC2_D.84.8.1.1-2017_observations_v2.pdf, October 2017. Available from: http://atmosphere.copernicus.eu/user-support/validation/verification-global-services.
Eskes, H., Huijnen, V., Arola, A., Benedictow, A., Blechschmidt, A.-M., Botek, E., Boucher, O., Bouarar, I., Chabrillat, S., Cuevas, E., Engelen, R., Flentje, H., Gaudel, A., Griesfeller, J., Jones, L., Kapsomenakis, J., Katragkou, E., Kinne, S., Langerock, B., Razinger, M., Richter, A., Schultz, M., Schulz, M., Sudarchikova, N., Thouret, V., Vrekoussis, M., Wagner, A., and Zerefos, C.: Validation of reactive gases and aerosols in the MACC global analysis and forecast system, Geosci. Model Dev., 8, 3523-3543, doi:10.5194/gmd-8-3523-2015, 2015.

Copernicus Atmosphere Monitoring Service
CAMS84_2018SC1_D5.1.2-2010_v1.2, GHG reanalysis 2003-2010 validation report Page 39 of 44
Kaiser, J. W., Heil, A., Andreae, M. O., Benedetti, A., Chubarova, N., Jones, L., Morcrette, J.-J., Razinger, M., Schultz, M. G., Suttie, M., and van der Werf, G. R.: Biomass burning emissions estimated with a global fire assimilation sys- tem based on observed fire radiative power, Biogeosciences, 9, 527–554, doi:10.5194/bg-9-527-2012, 2012
Langerock, B., De Mazière, M., Hendrick, F., Vigouroux, C., Desmet, F., Dils, B., and Niemeijer, S.: Description of algorithms for co-locating and comparing gridded model data with remote-sensing observations, Geosci. Model Dev., 8, 911-921, https://doi.org/10.5194/gmd-8-911-2015, 2015.
Massart, S., Agusti-Panareda, A., Aben, I., Butz, A., Chevallier, F., Crevoisier, C., Engelen, R., Frankenberg, C., and Hasekamp, O.: Assimilation of atmospheric methane products into the MACC-II system: from SCIAMACHY to TANSO and IASI, Atmos. Chem. Phys., 14, 6139-6158, doi:10.5194/acp-14-6139-2014, 2014.
Massart, S., Agustí-Panareda, A., Heymann, J., Buchwitz, M., Chevallier, F., Reuter, M., Hilker, M., Burrows, J. P., Deutscher, N. M., Feist, D. G., Hase, F., Sussmann, R., Desmet, F., Dubey, M. K., Griffith, D. W. T., Kivi, R., Petri, C., Schneider, M., and Velazco, V. A.: Ability of the 4-D-Var analysis of the GOSAT BESD XCO2 retrievals to characterize atmospheric CO2 at large and synoptic scales, Atmos. Chem. Phys., 16, 1653-1671, doi:10.5194/acp-16-1653-2016, 2016.
Obspack, 2016a, Cooperative Global Atmospheric Data Integration Project; (2016):Multi-laboratory compilation of atmospheric carbon dioxide data for the period 1957-2015; obspack_co2_1_GLOBALVIEWplus_v2.1_2016_09_02; NOAA Earth System Research Laboratory, Global Monitoring Division.http://dx.doi.org/10.15138/G3059Z.
Obspack, 2016b, Cooperative Global Atmospheric Data Integration Project; (2019):Multi-laboratory compilation of atmospheric methane data for the period 1957-2017; obspack_ch4_1_GLOBALVIEWplus_v1.0_2019_01_08; NOAA Earth System Research Laboratory, Global Monitoring Division.http://dx.doi.org/10.25925/20190108
Ramonet, M., B. Langerock, T. Warneke, H. J. Eskes, Validation report of the CAMS global Reanalysis of greenhouse gases, years 2003-2005, Copernicus Atmosphere Monitoring Service (CAMS) report, CAMS84_2015SC2_D84.7.1.4_Y3GHG_v1.pdf, July 2018.
Stephens, B. B., G. W. Brailsford, A. J. Gomez, K. Riedel, S. E. Mikaloff Fletcher, S. Nichol, and M. Manning. Analysis of a 39-year continuous atmospheric CO2 record from Baring Head, New Zealand. Biogeosciences 10, no. 4 (2013): 2683-2697, doi:10.5194/bg-10-2683-2013.
Watanabe F., O. Uchino, Y. Joo, M. Aono, K. Higashijima, Y. Hirano, K. Tsuboi and K. Suda: Interannual variation of growth rate of atmospheric carbon dioxide concentration observed at the JMA's three monitoring stations: Large increase in concentration of atmospheric carbon dioxide in 1998. Journal of Meteorological Society of Japan, Vol.78, No.5. 673-682, 2000.
Wunch, D., Toon, G. C., Blavier, J. F., Washenfelder, R. A., Notholt, J., Connor, B. J., Griffith, D. W. T., Sherlock, V., and Wennberg, P. O.: The Total Carbon Column Observing Network, Philos. T. R. Soc. A, 369, 2087–2112, https://doi.org/10.1098/rsta.2010.0240, 2011.
References for the used TCCON data are:
Blumenstock, T., F. Hase, M. Schneider, O. E. García, and E. Sepúlveda. 2017. "TCCON data from Izana (ES), Release GGG2014.R1." CaltechDATA. doi:10.14291/tccon.ggg2014.izana01.r1.
De Mazière, M., M. K. Sha, F. Desmet, C. Hermans, F. Scolas, N. Kumps, J.-M. Metzger, V. Duflot, and J.-P. Cammas. 2017. "TCCON data from Réunion Island (RE), Release GGG2014.R1." CaltechDATA. doi:10.14291/tccon.ggg2014.reunion01.r1.

Copernicus Atmosphere Monitoring Service
CAMS84_2018SC1_D5.1.2-2010_v1.2, GHG reanalysis 2003-2010 validation report Page 40 of 44
Deutscher, N. M., J. Notholt, J. Messerschmidt, C. Weinzierl, T. Warneke, C. Petri, and P. Grupe. 2017. "TCCON data from Bialystok (PL), Release GGG2014.R1." CaltechDATA. doi:10.14291/tccon.ggg2014.bialystok01.r1/1183984.
Dubey, M. K., B. G. Henderson, D. Green, Z. T. Butterfield, G. Keppel-Aleks, N. T. Allen, J.-F. Blavier, C. M. Roehl, D. Wunch, and R. Lindenmaier. 2017. "TCCON data from Manaus (BR), Release GGG2014.R0." CaltechDATA. doi:10.14291/tccon.ggg2014.manaus01.r0/1149274.
Dubey, M. K., R. Lindenmaier, B. G. Henderson, D. Green, N. T. Allen, C. M. Roehl, J.-F. Blavier, et al. 2017. "TCCON data from Four Corners (US), Release GGG2014.R0." CaltechDATA. doi:10.14291/tccon.ggg2014.fourcorners01.r0/1149272.
Feist, D. G., S. G. Arnold, N. John, and M. C. Geibel. 2017. "TCCON data from Ascension Island (SH), Release GGG2014.R0." CaltechDATA. doi:10.14291/tccon.ggg2014.ascension01.r0/1149285.
Goo, T.-Y., Y.-S. Oh, and V. A. Velazco. 2017. "TCCON data from Anmeyondo (KR), Release GGG2014.R0." CaltechDATA. doi:10.14291/tccon.ggg2014.anmeyondo01.r0/1149284.
Griffith, D. W. T., N. M. Deutscher, V. A. Velazco, P. O. Wennberg, Y. Yavin, G. Keppel-Aleks, R. A. Washenfelder, et al. 2017. "TCCON data from Darwin (AU), Release GGG2014.R0." CaltechDATA. doi:10.14291/tccon.ggg2014.darwin01.r0/1149290.
Griffith, D. W. T., V. A. Velazco, N. M. Deutscher, C. Paton-Walsh, N. B. Jones, S. R. Wilson, R. C. Macatangay, G. C. Kettlewell, R. R. Buchholz, and M. O. Riggenbach. 2017. "TCCON data from Wollongong (AU), Release GGG2014.R0." CaltechDATA. doi:10.14291/tccon.ggg2014.wollongong01.r0/1149291.
Hase, F., T. Blumenstock, S. Dohe, J. Groß, and M.ä. Kiel. 2017. "TCCON data from Karlsruhe (DE), Release GGG2014.R1." CaltechDATA. doi:10.14291/tccon.ggg2014.karlsruhe01.r1/1182416.
Iraci, L. T., J. R. Podolske, P. W. Hillyard, C. Roehl, P. O. Wennberg, J.-F. Blavier, J. Landeros, et al. 2017. "TCCON data from Edwards (US), Release GGG2014.R1." CaltechDATA. doi:10.14291/tccon.ggg2014.edwards01.r1/1255068.
—. 2017. "TCCON data from Indianapolis (US), Release GGG2014.R1." CaltechDATA. doi:10.14291/tccon.ggg2014.indianapolis01.r1/1330094.
Kawakami, S., H. Ohyama, K. Arai, H. Okumura, C. Taura, T. Fukamachi, and M. Sakashita. 2017. "TCCON data from Saga (JP), Release GGG2014.R0." CaltechDATA. doi:10.14291/tccon.ggg2014.saga01.r0/1149283.
Kivi, R., P. Heikkinen, and E. Kyrö. 2017. "TCCON data from Sodankylä (FI), Release GGG2014.R0." CaltechDATA. doi:10.14291/tccon.ggg2014.sodankyla01.r0/1149280.
Liu, Cheng, Wei Wang, and Youwen Sun. 2018. "TCCON data from Hefei (PRC), Release GGG2014.R0." CaltechDATA. doi:10.14291/tccon.ggg2014.hefei01.r0.
Morino, I., N. Yokozeki, T. Matsuzaki, and M. Horikawa. 2017. "TCCON data from Rikubetsu (JP), Release GGG2014.R2." CaltechDATA. doi:10.14291/tccon.ggg2014.rikubetsu01.r2.
Morino, I., T. Matsuzaki, and M. Horikawa. 2017. "TCCON data from Tsukuba (JP), 125HR, Release GGG2014.R2." CaltechDATA. doi:10.14291/tccon.ggg2014.tsukuba02.r2.
Morino, Isamu, Voltaire A. Velazco, Akihiro Hori, Osamu Uchino, and David W. T. Griffith. 2018. "TCCON data from Burgos, Ilocos Norte (PH), Release GGG2014.R0." CaltechDATA. doi:10.14291/tccon.ggg2014.burgos01.r0.
Notholt, J., C. Petri, T. Warneke, N. M. Deutscher, M. Palm, M. Buschmann, C. Weinzierl, R. C. Macatangay, and P. Grupe. 2017. "TCCON data from Bremen (DE), Release GGG2014.R0." CaltechDATA. doi:10.14291/tccon.ggg2014.bremen01.r0/1149275.

Copernicus Atmosphere Monitoring Service
CAMS84_2018SC1_D5.1.2-2010_v1.2, GHG reanalysis 2003-2010 validation report Page 41 of 44
Notholt, J., T. Warneke, C. Petri, N. M. Deutscher, C. Weinzierl, M. Palm, and M. Buschmann. 2017. "TCCON data from Ny Ålesund, Spitsbergen (NO), Release GGG2014.R0." CaltechDATA. doi:10.14291/tccon.ggg2014.nyalesund01.r0/1149278.
Pollard, David Frank, John Robinson, and Hisako Shiona. 2019. "TCCON data from Lauder (NZ), Release GGG2014.R0." CaltechDATA. doi:10.14291/tccon.ggg2014.lauder03.r0.
Sherlock, V., B. Connor, J. Robinson, H. Shiona, D. Smale, and D. F. Pollard. 2017. "TCCON data from Lauder (NZ), 120HR, Release GGG2014.R0." CaltechDATA. doi:10.14291/tccon.ggg2014.lauder01.r0/1149293.
—. 2017. "TCCON data from Lauder (NZ), 125HR, Release GGG2014.R0." CaltechDATA. doi:10.14291/tccon.ggg2014.lauder02.r0/1149298.
Strong, K., S. Roche, J. E. Franklin, J. Mendonca, E. Lutsch, D. Weaver, P. F. Fogal, J. R. Drummond, R. Batchelor, and R. Lindenmaier. 2018. "TCCON data from Eureka (CA), Release GGG2014.R3." CaltechDATA. doi:10.14291/tccon.ggg2014.eureka01.r3.
Sussmann, R., and M. Rettinger. 2017. "TCCON data from Garmisch (DE), Release GGG2014.R2." CaltechDATA. doi:10.14291/tccon.ggg2014.garmisch01.r2.
—. 2018. "TCCON data from Zugspitze (DE), Release GGG2014.R1." CaltechDATA. doi:10.14291/tccon.ggg2014.zugspitze01.r1.
Té, Y., P. Jeseck, and C. Janssen. 2017. "TCCON data from Paris (FR), Release GGG2014.R0." CaltechDATA. doi:10.14291/tccon.ggg2014.paris01.r0/1149279.
Warneke, T., J. Messerschmidt, J. Notholt, C. Weinzierl, N. M. Deutscher, C. Petri, and P. Grupe. 2017. "TCCON data from Orléans (FR), Release GGG2014.R0." CaltechDATA. doi:10.14291/tccon.ggg2014.orleans01.r0/1149276.
Wennberg, P. O., C. M. Roehl, D. Wunch, G. C. Toon, J.-F. Blavier, R. Washenfelder, G. Keppel-Aleks, N. T. Allen, and J. Ayers. 2017. "TCCON data from Park Falls (US), Release GGG2014.R1." CaltechDATA. doi:10.14291/tccon.ggg2014.parkfalls01.r1.
Wennberg, P. O., C. M. Roehl, J.-F. Blavier, D. Wunch, and N. T. Allen. 2017. "TCCON data from Jet Propulsion Laboratory (US), 2011, Release GGG2014.R1." CaltechDATA. doi:10.14291/tccon.ggg2014.jpl02.r1/1330096.
Wennberg, P. O., D. Wunch, C. M. Roehl, J.-F. Blavier, G. C. Toon, and N. T. Allen. 2017. "TCCON data from Caltech (US), Release GGG2014.R1." CaltechDATA. doi:10.14291/tccon.ggg2014.pasadena01.r1/1182415.
—. 2017. "TCCON data from Lamont (US), Release GGG2014.R1." CaltechDATA. doi:10.14291/tccon.ggg2014.lamont01.r1/1255070.
Wennberg, P. O., D. Wunch, Y. Yavin, G. C. Toon, J.-F. Blavier, N. T. Allen, and G. Keppel-Aleks. 2017. "TCCON data from Jet Propulsion Laboratory (US), 2007, Release GGG2014.R0." CaltechDATA. doi:10.14291/tccon.ggg2014.jpl01.r0/1149163.
Wunch, D., J. Mendonca, O. Colebatch, N. T. Allen, J.-F. Blavier, S. Roche, J. Hedelius, et al. 2017. "TCCON data from East Trout Lake, SK (CA), Release GGG2014.R1." CaltechDATA. doi:10.14291/tccon.ggg2014.easttroutlake01.r1.
References for the used greenhouse gas surface data are:
Andrews, A. E., J. D. Kofler, M. E. Trudeau, J. C. Williams, D. H. Neff, K. A. Masarie, D. Y. Chao, D. R. Kitzis, P. C. Novelli, C. L. Zhao, E. J. Dlugokencky, P. M. Lang, M. J. Crotwell, M. L. Fischer, M. J. Parker, J. T. Lee, D. D. Baumann, A. R. Desai, C. O. Stanier, S. F. J. de Wekker, D. E. Wolfe, J. W. Munger and P. P. Tans, (2013), CO2, CO and CH4 measurements from the NOAA Earth System Research Laboratory, Atmospheric Measurement Techniques Discussions, 6, 1, 10.5194/amtd-6-1461-2013.

Copernicus Atmosphere Monitoring Service
CAMS84_2018SC1_D5.1.2-2010_v1.2, GHG reanalysis 2003-2010 validation report Page 42 of 44
Brunke, E-G., Labuschagne, C., Parker, B., Scheel, H.E. and Whittlestone, S. (2004). Baseline air mass selection at Cape Point, South Africa: Application of 222Rn and other filter criteria to CO2. Atmospheric Environment 38, 33, (Oct 04), 5693 - 5702.
Dlugokencky, E. J., L. P. Steele, P. M. Lang and K. A. Masarie, (1995), Atmospheric methane at Mauna Loa and Barrow observatories: Presentation and analysis of in situ measurements, Journal of Geophysical Research-Atmospheres, 100, d11, 23103-23113, doi:10.1029/95JD0246.
Gaudry, A., P. Monfray, G. Polian, G. Bonsang, B. Ardouin, A. Jegou, and G. Lambert, 1991. Non-seasonnal variations of atmospheric CO2 concentrations at Amsterdam Island. Tellus 43B, 136-143.
Gillette, D.A., W.D. Komhyr, L.S. Waterman, L.P. Steele, and R.H. Gammon, The NOAA/GMCC continuous CO2 record at the South Pole, 1975 1982, J. Geophys. Res., 92, 4231 4240, 1987.
Halter, B.C., Harris, J.M., and Conway, T.J., Component signals in the record of atmospheric carbon dioxide concentration at American Samoa, J. Geophys. Res., 93, 15914 15918, 1988.
Haszpra, L., Barcza, Z., Bakwin, P. S., Berger, B. W., Davis, K. J., Weidinger, T., 2001: Measuring system for the long-term monitoring of biosphere/atmosphere exchange of carbon dioxide. J. of Geophysical Research 106D, 3057-3070.
Lopez, M., M. Schmidt, M. Ramonet, J.-L. Bonne, A. Colomb, V. Kazan, P. Laj, and J.-M. Pichon, A gas chromatograph system for semi-continuous greenhouse gas measurements at Puy de Dome station, Central France, Atmos. Meas. Tech. Discuss., 8, 3121-3170, 2015.
Peterson, J.T., W.D. Komhyr, L.S. Waterman, R.H. Gammon, K.W. Thoning, and T.J. Conway, Atmospheric CO2 variations at Barrow, Alaska, 1973 1982, J. Atmos. Chem., 4, 491 510, 1986.
Ramonet, M., P. Ciais, T. Aalto, C. Aulagnier, F. Chevallier, D. Cipriano, T.J. Conway, L. Haszpra, V. Kazan, F. Meinhardt, J.-D. Paris, M. Schmidt, P. Simmonds, I. Xueref-Remy, and J. Necki, A recent build-up of atmospheric CO2 over Europe. Part 1: observed signals and possible explanations, Tellus B, DOI: 10.1111/j.1600-0889.2009.00442, 2010
Rozanski, K., Zimnoch, M., Korus, A., Lasa, J., Graul, R., Levin, I., (2003). Six-year record of atmospheric carbon dioxide and methane at a high-altitude mountain site in Poland. Tellus, 55B: 94-104.
Schmidt, M., Graul, R., Sartorius, H., and Levin, L.: The Schauinsland CO2 record: 30 years of continental observations and their implications for the variability of the European CO2 budget, J. Geophys. Res.-Atmos., 108, 4619-4626, 2003.
Tsutsumi, Y., H. Matsueda, S. Nishioka, Consistency of the CO2 primary standards in JMA, 12th WMO/IAEA meeting of experts on carbon dioxide concentration and related tracers measurement techniques (Toronto, Canada, 15-18 September 2003), Global Atmosphere Watch Report No. 161 (WMO/TD-No.1275), 23-31, 2005.
Vermeulen, A. T., Hensen, A., Popa, M. E., van den Bulk, W. C. M., and Jongejan, P. A. C.: Greenhouse gas observations from Cabauw Tall Tower (1992-2010), Atmos. Meas. Tech., 4, 617-644, doi:10.5194/amt-4-617-2011, 2011.
Worthy, D.E., K.Higuchi, and D. Chan, 2003. North American influence on atmospheric carbon dioxide data collected at Sable Island, Canada. Tellus 55B, 105-114.

Copernicus Atmosphere Monitoring Service
CAMS84_2018SC1_D5.1.2-2010_v1.2, GHG reanalysis 2003-2010 validation report Page 43 of 44
7. Acknowledgements
We acknowledge all the contributors to the Obspack data packages: Environment and Climate Change Canada; NOAA Global Monitoring Division; Laboratoire des Sciences du Climat et de l'Environnement - UMR8212 CEA-CNRS-UVSQ; Energy Research Centre of the Netherlands; University of Science and Technology (AGH); Umweltbundesamt; Hungarian Meteorological Service; Japan Meteorological Agency; South African Weather Service; Center for Atmospheric and Oceanic Studies, Tohoku University; National Institute of Water and Atmospheric Research.
The data used in this publication were obtained as part of the Network for the Detection of Atmospheric Composition Change (NDACC) and are publicly available (see http://www.ndacc.org).

Copernicus Atmosphere Monitoring Service
atmosphere.copernicus.eu copernicus.eu ecmwf.int
ECMWF - Shinfield Park, Reading RG2 9AX, UK
Contact: [email protected]