validationreport - disc learning solutions · everythingdisc® classic...
TRANSCRIPT
Everything DiSC® ClassicValidation Report
Everything DiSC® Classic Research Report©2008 by Inscape Publishing, Inc. All rights reserved. Copyright secured in the USand foreign countries.“DiSC,” “Inscape Publishing,” and the Inscape logo are registered trademarks ofInscape Publishing, Inc.Permission to reproduce only when used in conjunction with DiSC® Classic orDiSC PPSS.

Everything DiSC® Classic
© 2008 by Inscape Publishing, Inc. All rights reserved. 1
D i S C® VALIDATION
Everything DiSC® ClassicValidation Report Table of Contents
Page
The Validation Process ..........................................................................................................3Reliability ..........................................................................................................................4Validity...............................................................................................................................6
Construct Validity.........................................................................................................6Scale Intercorrelations.................................................................................................6Multidimensional Scaling of the DiSC® Scales............................................................7Factor Analysis of the DiSC Items ..............................................................................8Correlations with Other Instruments............................................................................8Comparing Scale Scores with Respondent Self-Perceptions ...................................11Comparing Scale Scores with Respondent Attitudes................................................12
Norms and Group Comparisons.....................................................................................16Scoring of the DiSC Profile.............................................................................................19Appendix 1......................................................................................................................21Appendix 2......................................................................................................................22Appendix 3......................................................................................................................25Appendix 4......................................................................................................................26Appendix 5......................................................................................................................27References .....................................................................................................................28

Everything DiSC® Classic
© 2008 by Inscape Publishing, Inc. All rights reserved. 3
V A L I D A T I O N
The Validation ProcessPsychological instruments are used to measure abstract qualities that we canʼt touch or see.These are characteristics like intelligence, dominance, or honesty. So how do researchersevaluate these instruments? How do we know whether such tools are actually providingaccurate information about these characteristics or just generating haphazard feedback thatsounds believable? Simply put, if an instrument is indeed useful and accurate, it should meeta variety of different standards that have been established by the scientific communitythroughout the years. Validation is the process through which researchers assess the qualityof a psychological instrument by testing the tool against these different standards. This paperis designed to help you understand these different standards and see how Inscapeʼs DiSC®
instruments perform under examination. Note that the research referenced here has beendone on the DiSC Classic instrument. Because it uses the same response page, thisresearch is equally relevant to the DiSC PPSS instrument.Validation asks two fundamental questions:
1. How reliable is the tool? That is, researchers ask if an instrument measures ina way that is consistent and dependable. If the results from a tool contain a lot ofrandom variation, it will be deemed less reliable.
2. How valid is the tool? That is, researchers ask if an instrument measuresaccurately. The more that a tool measures what it proposes to measure, the morevalid the tool is.
The following analogy usually helps people understand the importance of reliability andvalidity. Imagine that you get on your bathroom scale today and weigh yourself. Tomorrowyou do the same thing, only to discover that your weight has dropped by 30 percent. Althoughyou may be delighted at first, reality will eventually set in. Your weight didnʼt change; the scaledid. Would you trust such a scale? No, itʼs not reliable.But now letʼs imagine a second instance in which you weighed yourself twice and both timesthe scale shows that you weigh about half of what you expected. So although you may havea reliable scale, itʼs reliably wrong. The scale doesnʼt measure what it proposes to measure:your weight. Itʼs not valid.In the first instance, the scale is neither reliable nor valid. That is, the scale canʼt be a validmeasurement of your weight if it fluctuates randomly and unreliably in its results. Therefore,an instrument cannot be valid if it is not reliable. In the second instance, however, we havea scale that is reliable but not valid. It does measure consistently (i.e., reliably), but thatmeasurement is not accurate (i.e., valid.)Note that no psychometric tool is perfectly reliable or perfectly valid. All psychologicalinstruments are subject to various sources of error. Reliability and validity are matters ofdegree on continuous scales, rather than reliable/unreliable and valid/invalid on dichotomousscales. Consequently, it is more appropriate to ask, “How reliable is this tool?” than “Is thistool reliable?”
4 © 2008 by Inscape Publishing, Inc. All rights reserved.
Everything DiSC® Classic
V A L I D A T I O N
ReliabilityWhen we talk of reliability in relation to profiles such as Inscape Publishingʼs DiSC®
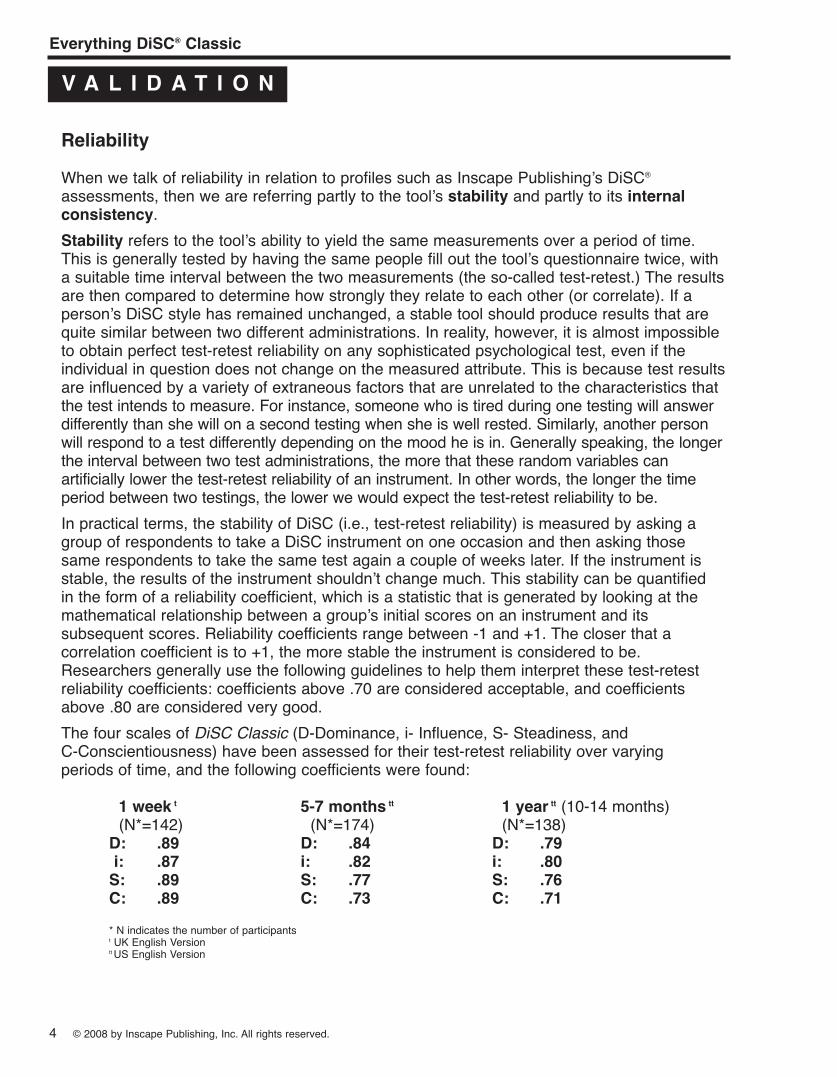
assessments, then we are referring partly to the toolʼs stability and partly to its internalconsistency.Stability refers to the toolʼs ability to yield the same measurements over a period of time.This is generally tested by having the same people fill out the toolʼs questionnaire twice, witha suitable time interval between the two measurements (the so-called test-retest.) The resultsare then compared to determine how strongly they relate to each other (or correlate). If apersonʼs DiSC style has remained unchanged, a stable tool should produce results that arequite similar between two different administrations. In reality, however, it is almost impossibleto obtain perfect test-retest reliability on any sophisticated psychological test, even if theindividual in question does not change on the measured attribute. This is because test resultsare influenced by a variety of extraneous factors that are unrelated to the characteristics thatthe test intends to measure. For instance, someone who is tired during one testing will answerdifferently than she will on a second testing when she is well rested. Similarly, another personwill respond to a test differently depending on the mood he is in. Generally speaking, the longerthe interval between two test administrations, the more that these random variables canartificially lower the test-retest reliability of an instrument. In other words, the longer the timeperiod between two testings, the lower we would expect the test-retest reliability to be.In practical terms, the stability of DiSC (i.e., test-retest reliability) is measured by asking agroup of respondents to take a DiSC instrument on one occasion and then asking thosesame respondents to take the same test again a couple of weeks later. If the instrument isstable, the results of the instrument shouldnʼt change much. This stability can be quantifiedin the form of a reliability coefficient, which is a statistic that is generated by looking at themathematical relationship between a groupʼs initial scores on an instrument and itssubsequent scores. Reliability coefficients range between -1 and +1. The closer that acorrelation coefficient is to +1, the more stable the instrument is considered to be.Researchers generally use the following guidelines to help them interpret these test-retestreliability coefficients: coefficients above .70 are considered acceptable, and coefficientsabove .80 are considered very good.The four scales of DiSC Classic (D-Dominance, i- Influence, S- Steadiness, andC-Conscientiousness) have been assessed for their test-retest reliability over varyingperiods of time, and the following coefficients were found:
1 week t 5-7 months tt 1 year tt (10-14 months)(N*=142) (N*=174) (N*=138)D: .89 D: .84 D: .79i: .87 i: .82 i: .80S: .89 S: .77 S: .76C: .89 C: .73 C: .71* N indicates the number of participantst UK English Versiontt US English Version
Everything DiSC® Classic
© 2008 by Inscape Publishing, Inc. All rights reserved. 5
V A L I D A T I O N
This suggests that results produced by DiSC® Classic are quite stable over time. Consequently,test takers and test administrators should expect no more than small changes when theinstrument is taken at different times. As the period between administrations increases,however, the results of these administrations will become more noticeable.Note that even over very short intervals an instrumentʼs results can show small changes. Infact, it is unlikely that two administrations of a test will yield the exact same results on anysophisticated psychological instrument. When such changes are observed in DiSC, however,the exact elevation of a profile is more likely to change than the basic shape of a profile.Consequently, the fundamental interpretation of the results will usually be the same.Internal consistency evaluates the degree of correlation among questions that profess tomeasure the same thing. That is, each of the four scales in DiSC Classic is measuredusing a series of different items (i.e., questions in the form ofadjectives, such as Daring, Independent, Aggressive, or Direct).Researchers recognize that if all of the items on a given scale (e.g.,the D scale) are in fact measuring the same thing (e.g., Dominance),they should all correlate with one another to some degree. In otherwords, all of the items on a scale should be consistent with oneanother. In most cases, a statistic called Cronbachʼs Alpha is usuallyregarded as the best method of evaluating internal consistency.Much like the reliability coefficients described above, CronbachʼsAlpha expresses the degree of correlation as a specific number, which typically variesbetween 0.0 and 1.0. If the value of Alpha is 0.0, then there is no relationship among theitems/statements on a given scale. On the other hand, if all the statements in a questionnaireare identical, then the value of Alpha will be 1.0, which indicates absolute internal consistency.Cronbachʼs Alpha is calculated separately for each of the toolʼs scales (i.e., D, i, S, and C.)The following guidelines are frequently used to evaluate the quality of a scaleʼs internalreliability: Alpha values above .70 are generally considered acceptable and satisfactory, alphavalues above .80 are usually considered quite good, and values above .90 are considered toreflect exceptional internal consistency. In fact, Alpha values that are too high may indicatethat the items on a scale are redundant or too similar. In such cases, many of the instrumentʼsitems may provide very little new information about a respondent.DiSC Classic has repeatedly shown good-to-excellent internal consistency. The developmentsample of the US English version of DiSC Classic demonstrated the following Alphas when itwas revised in 1996 (sample size=812):
D: .92i: .87S: .88C: .85
DDaringAggressive
IndependentDirect
6 © 2008 by Inscape Publishing, Inc. All rights reserved.
Everything DiSC® Classic
V A L I D A T I O N
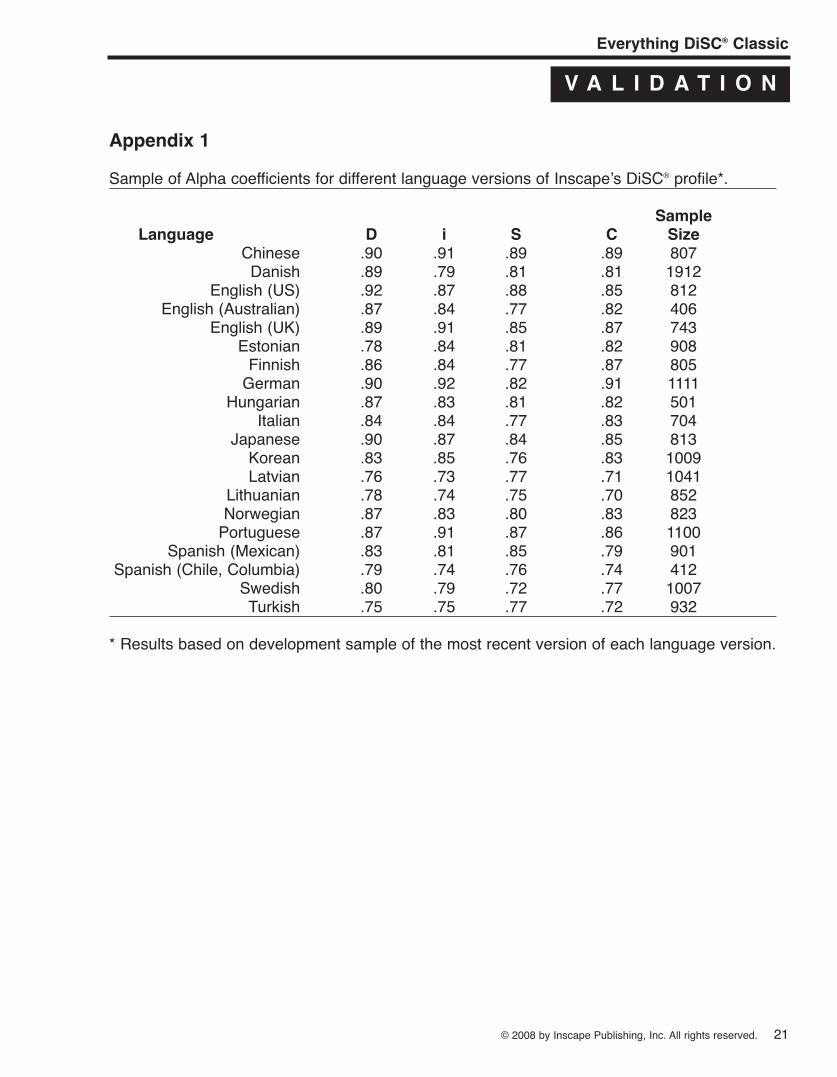
Repeated research since that time has produced similar Alpha coefficients on the US Englishversion, as well as on other language versions that have been developed throughout theworld. Appendix 1 contains a sample of the alpha coefficients for different language versionsof DiSC® Classic. All of these coefficients are above the .70 cutoff, and the majority of themare well above this cutoff. Demographic characteristics of the US English 1996 developmentsample are shown in Appendix 2.
ValidityAs already mentioned, validity indicates the degree to which a tool measures what it hasbeen designed to measure. Assessing the validity of a psychological tool that measuresabstract qualities (like intelligence, dominance, or honesty) can be tricky. There are, however,a number of basic strategies that researchers use to answer the question “How well is thisinstrument measuring what it says itʼs measuring?” The validation strategies that will bediscussed here fall under the heading of construct validity.
Construct ValidityConstruct validity examines the validity of a tool on a highly theoretical level. A construct isan abstract idea or concept (such as intelligence, dominance, or honesty) that is used tomake sense of our experience. The D scale of DiSC, for example, measures the constructof Dominance. This construct of Dominance, in turn, is theoretically related to a variety ofother constructs. For instance, it is reasonable to assume that someone who is very dominantwill be rated as more aggressive by their peers. Thus, Dominance and peer ratings ofaggressiveness are theoretically linked. Consequently, if our measure of Dominance has highvalidity, it should correlate highly with peer ratings of aggressiveness. This is essentially whatresearchers do when they examine construct validity. First, they specify a series of theoreticalrelationships (e.g., the construct of Dominance is theoretically rated to the constructs of X, Y,and Z). Then they test these theoretical relationships empirically to see if the relationshipsactually exist. If the proposed relationships exist, the instrument is thought to have highervalidity.
Scale IntercorrelationsAs you might imagine, there are a variety of different ways to test construct validity. First,we can examine the validity of an instrument as a whole. Instruments like DiSC proposean underlying model in which the scales within the tool have a specific relationship to oneanother. Researchers examine the actual relationship among the scales to see if it reflectsthe theoretical relationship proposed by the model.The DiSC model proposes that adjacent scales (e.g., C/S or C/D) will have weak to moderatecorrelations. That is, these correlations should be considerably smaller than the Alpha reliabilitiesof the individual scales. For example, the correlation between the D and i scales (-.11) shouldbe substantially lower than the Alpha reliability of the D scale (.87). On the other hand,complementary scales (e.g., D/S or C/i) are theoretically opposite, and so they should havestrong negative correlations. Table 1 shows data obtained from a 2002 sample of 7,038respondents who completed the US English version of DiSC® Classic. The correlationsamong the D, i, S, and C scales support this model. That is, strong negative correlations are
Everything DiSC® Classic
© 2008 by Inscape Publishing, Inc. All rights reserved. 7
V A L I D A T I O N
observed between C and i, and between S and D. Further, weak correlations are observedbetween adjacent pairs of scales.
Table 1. Intercorrelations among the DiSC® Classic scalesD i S C
D .87i -.11 .81S -.82 -.22 .82C -.37 -.71 .30 .77
Cronbachʼs Alpha reliabilities are shown in bold along the diagonal, and the correlation coefficients among scales are shown withinthe body of the table. Correlation coefficients range from -1 to +1. A correlation of +1 indicates that two variables are perfectlypositively correlated such that as one variable increases, the other variable increases by a proportional amount. A correlation of -1indicates that two variables are perfectly negatively correlated, such that as one variable increases, the other variable decreases bya proportional amount. A correlation of 0 indicates that two variables are completely unrelated. The following guidelines can help youinterpret the relative strength of these correlation coefficients (both positive and negative): very weak correlations range from 0.0 to.2, weak correlations range from .2 to .4, moderate correlations range from .4 to .6, strong correlations range from .6 to .8, and verystrong correlations range from .8 to 1.0.
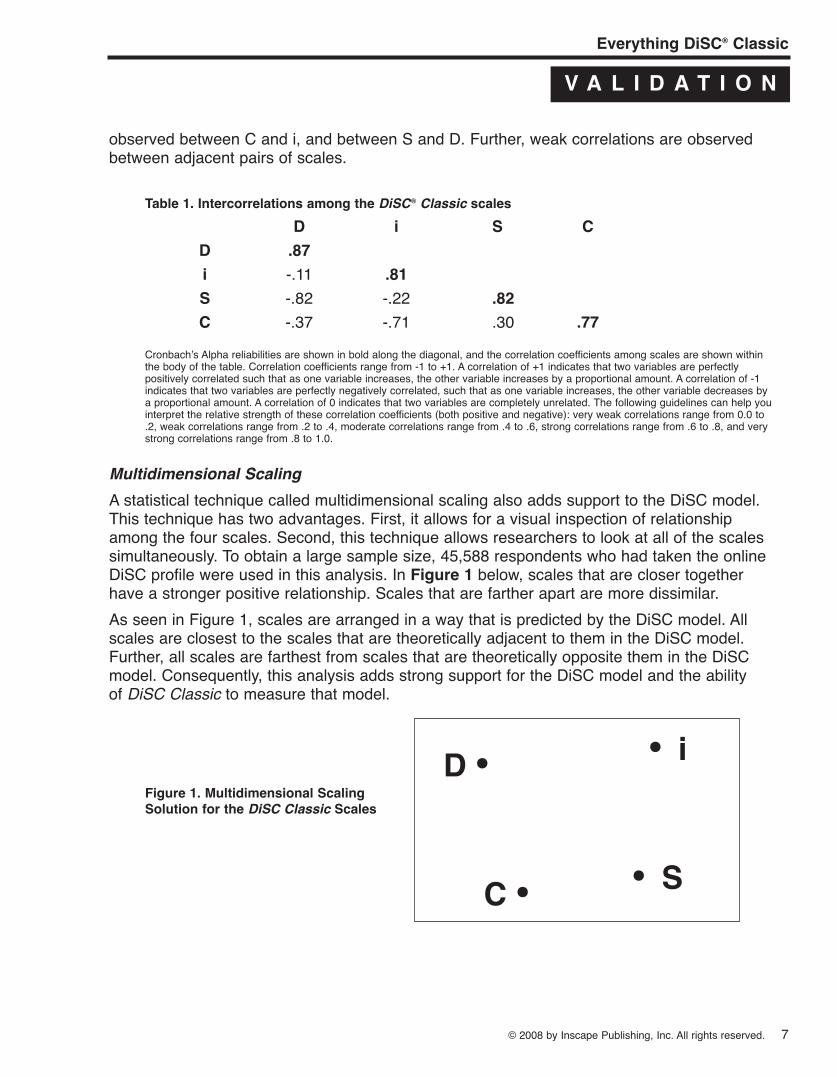
Multidimensional ScalingA statistical technique called multidimensional scaling also adds support to the DiSC model.This technique has two advantages. First, it allows for a visual inspection of relationshipamong the four scales. Second, this technique allows researchers to look at all of the scalessimultaneously. To obtain a large sample size, 45,588 respondents who had taken the onlineDiSC profile were used in this analysis. In Figure 1 below, scales that are closer togetherhave a stronger positive relationship. Scales that are farther apart are more dissimilar.As seen in Figure 1, scales are arranged in a way that is predicted by the DiSC model. Allscales are closest to the scales that are theoretically adjacent to them in the DiSC model.Further, all scales are farthest from scales that are theoretically opposite them in the DiSCmodel. Consequently, this analysis adds strong support for the DiSC model and the abilityof DiSC Classic to measure that model.
Figure 1. Multidimensional ScalingSolution for the DiSC Classic Scales
D • • i
C • • S
8 © 2008 by Inscape Publishing, Inc. All rights reserved.
Everything DiSC® Classic
V A L I D A T I O N
Factor Analysis of the DiSC® ItemsAnother method used to assess the validity of DiSC® Classic is factor analysis. Unlike thecorrelational analysis and multidimensional scaling analysis described above, the factoranalysis described here was used to examine the DiSC instrument on the level of itemsrather than at the level of scales.Generally speaking, factor analysis helps researchers understand which items are highlycorrelated and thus group together to form a scale. This statistical technique takes intoaccount the correlations among all of the items within a test and identifies independentfactors (or dimensions) that explain those correlations. The DiSC model proposes that twoprimary factors (or dimensions) underlie the four DiSC scales. If this model is sufficientlymeasured by DiSC Classic, a factor analysis should identify two independent dimensions.Further, items on the i and C scales should correlate highly with one factor and items on theD and S scales should correlate highly with the other factor. In summary, factor analysis wasused to confirm: 1) the two-dimensional structure of the DiSC model as measured by DiSCClassic; and 2) confirm that items were assigned to the appropriate scale.The results of a factor analysis on 812 participants in the DiSC Classic developmental sampledemonstrated that for each of the DiSC scales, items grouped together in the expectedfashion. Two clear factors emerged in the analysis that reflected the two dimensionsproposed in the DiSC model (i.e., one factor with D and S items and one factor with i and Citems). In addition, the vast majority of the DiSC items were most strongly correlated withtheir expected factor. In a subsequent analysis, using a sample size of 45,588, the 112 DiSCitems were submitted to factor analysis using a Varimax rotation. A two-factor solution wasspecified. In the rotated solution, over 90% of the items loaded most highly on the appropriatefactor. That is, D and S items loaded most highly on the first factor and I and C items loadedmost highly on the second factor. These results support the appropriateness of the DiSCClassic items to measure the two dimensions within the DiSC model.
Correlations with Other InstrumentsWhen validating an instrument, test developers recognize that it is important to understandthe relationship that a given instrument (e.g., DiSC) has with other psychological tools inthe field. In particular, researchers identify instruments that measure constructs (such asaggressiveness, playfulness, or emotional stability) that are theoretically related to constructsmeasured by the instrument in question (such as Dominance, Influence, or Steadiness.) Forinstance, the Influence scale of DiSC is theoretically related to the construct of extraversion.Consequently, the Influence scale should correlate highly with scales on other tools thatmeasure extraversion. This type of construct validity is often called convergent validity.
The 16PFOne of the instruments with which DiSC has been correlated is the Cattell 16 PersonalityFactor Questionnaire (16PF). This instrument was developed by Raymond Cattell in the1940s using a largely factor analytic methodology. It proposes to measure 16 traits thatrepresent the major dimensions of differences within human personality. These traits describea person's individual style of perceiving, thinking, and acting in a wide variety of differentsituations over a relatively extended period of time.
Everything DiSC® Classic
© 2008 by Inscape Publishing, Inc. All rights reserved. 9
V A L I D A T I O N
For the purposes of DiSC® validation, we are only interested in those scales that aretheoretically related to the constructs measured by DiSC. A group of 103 participants wereasked to take both the DiSC instrument and the 16PF. (The DiSC instrument used was thepredecessor to the current DiSC Classic.) The scales of the two instruments were thencorrelated. The following paragraphs describe a series of hypothesized correlations basedon the theoretical DiSC model, along with the empirical support for these hypotheses.
The Dominance scale of the 16PF should be positively correlated with the D scale ofDiSC and negatively correlated with the S scale of DiSC. Analyses confirmed that theDominance scale of the 16PF was strongly and positively correlated with the D scaleof the DiSC instrument (r= .62) and strongly and negatively correlated with the S scale(r= -.52).The Liveliness scale of the 16PF should be positively correlated with the i scale of theDiSC instrument. Data supports this hypothesis and shows a strong positive relationshipbetween these two scales (r=.61). The Liveliness scale also demonstrated a moderatenegative correlation with the C scale of DiSC (r= -.45).The Sensitivity scale of the 16PF measures people on a continuum that ranges fromutilitarian, unsentimental, and tough-minded on the low end to sensitive, sentimental,and tender-minded on the high end. This sensitivity construct is touched upon in the Dand S scales of DiSC, but only indirectly. Therefore, the D scale of DiSC should show anegative, but moderate correlation with the Sensitivity scale, and the S scale shouldshow a positive, but moderate relationship. The data support this hypothesis. The Dscale demonstrated a negative and moderate, but statistically significant relationshipwith the Sensitivity scale. The S scale showed a positive correlation with the Sensitivityscale, although this relationship was not statistically significant.The Rule Consciousness scale of the 16PF measures people on a continuum that rangesfrom self-indulgent and rule-disregarding on the low end to dutiful and rule-conscious onthe high end. This rule-consciousness construct is measured indirectly by the C scale ofDiSC, so we would expect a positive, but moderate relationship between these twoscales. The data indicate a small, but statistically significant relationship between the Cscale of DiSC and the Rule Consciousness scale of the 16PF.The Social Boldness scale of the 16PF measures people on a continuum that rangesfrom shy and threat-sensitive on the low end to bold and adventurous on the high end.From a theoretical perspective, this Social Boldness scale should correlate moderatelywith each of the four DiSC scales. The S and C scales should show moderate negativecorrelations, and the D and i scales should show moderate positive relationships. Thedata support three of these four hypothesized correlations. The S and C scales bothshowed negative, statistically significant correlations with this scale. In addition, the iscale showed a positive, statistically significant correlation with the scale. Although theD scale did have a positive correlation with the Social Boldness scale as expected, thiscorrelation was smaller than theorized.
10 © 2008 by Inscape Publishing, Inc. All rights reserved.
Everything DiSC® Classic
V A L I D A T I O N
The Privateness scale of the 16PF measures people on a continuum that ranges fromforthright and open on the low end to discreet and non-disclosing on the high end. TheDiSC® scales touch indirectly on this construct. Specifically, we would expect that the iscale of DiSC would have a negative, but moderate relationship with this scale. Further,we would expect that the C scale would have a positive, but moderate relationship withprivateness. The data support these hypotheses. The i scale showed a moderatelynegative correlation with the Privateness scale that was statistically significant. Inaddition, the C scale showed a moderately positive correlation with the Privatenessscale that was statistically significant.
The MBTIThe Myers-Briggs Type Indicator (MBTI) is a personality inventory based on the theoreticalwork of Carl Jung. It proposes to measure an individualʼs stable, personal preferences onfour primary scales (i.e., Introversion /Extraversion, Sensing/Intuition, Thinking/Feeling, andJudging/Perceiving). Based on the theoretical DiSC model, only one of the MBTI scales(i.e., Introversion/Extraversion) was proposed to have a strong relationship with the scalesof the DiSC profile. Another MBTI scale (i.e., Thinking/Feeling), however, was expected tohave a moderate or weak relationship with the scales of the DiSC profile. To examine therelationship between these two instruments, 103 people were asked to take both the MBTIand the DiSC profile. (The DiSC instrument used was the predecessor to the current DiSCClassic.) The following paragraphs describe the research hypotheses in more detail anddocument the results.
The Introversion/Extraversion scale (I/E) of the MBTI proposes to measure thesource of oneʼs personal energy. Introverts (i.e., those who score low on this scale) arethought to derive their energy from reflecting on an inner world of information, ideas,or concepts. People who receive low scores on the I/E scale are often described ascontained, reflective, or quiet. These same adjectives are frequently used to describeindividuals who score highly on the C scale of the DiSC profile. Consequently, we shouldexpect a negative correlation between these two scales. On the other hand, Extraverts(i.e., those who score highly on this scale) are thought to derive their energy frominteraction with the outer world of people or things. People who score highly on thisscale are often described as expressive, gregarious, or enthusiastic. These sameadjectives also are often used to describe people who score highly on the i scale of theDiSC profile. Consequently, these two scales should be positively correlated. The datasupport these hypotheses. The i scale of the DiSC profile correlated strongly andpositively (r=.65) with the I/E scale. The C scale demonstrated a negative correlationwith the I/E scale (r=-.35), although this correlation was more moderate in strength.Both correlations were statistically significant.The Thinking/Feeling scale (T/F) of the MBTI proposes to measure the method bywhich a person makes decisions or draws conclusions. Those who make decisionsbased on objective, logical analysis are described as Thinking. This is indicated by alow score on the T/F scale. Similarly, the D and C styles within the DiSC model are alsoproposed to make frequent decisions based on these criteria. Consequently, we wouldexpect weak-to-moderate negative correlations between the T/F scale and both the Dand C scales of the DiSC profile. Those who make decisions based on personal values
Everything DiSC® Classic
© 2008 by Inscape Publishing, Inc. All rights reserved. 11
V A L I D A T I O N
for the purpose of creating harmony are described as Feeling. This is indicated by ahigh score on the T/F scale. In the DiSC® model, the i and S styles are also proposedto make frequent decisions based on these criteria. Therefore, we would expect to seeweak-to-moderate positive correlations between the T/F scale and both the i and Sscales of the DiSC profile. The results of the data analysis show that the T/F scale did,in fact, have a negative correlation with the D scale, but had a slightly positivecorrelation with the C scale. (This correlation, however, was not statistically significant).The i and S scales of the DiSC profile, however, did demonstrate the expected positivecorrelations with the T/F scale.
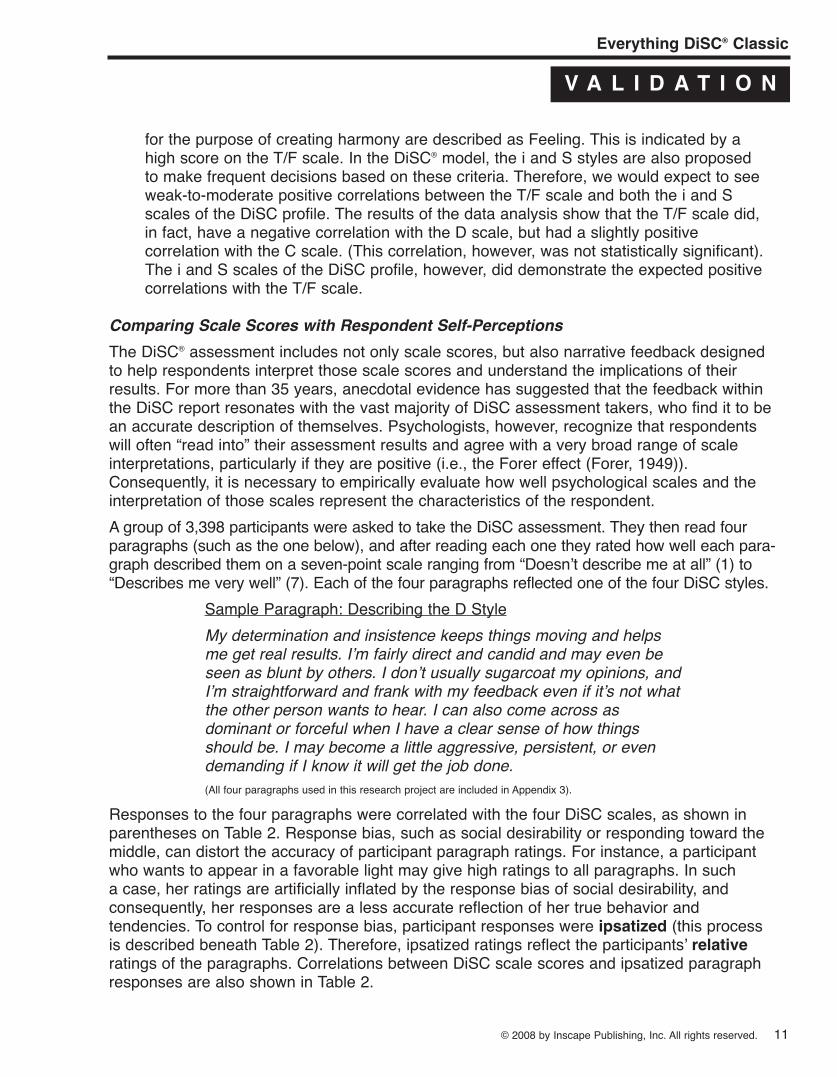
Comparing Scale Scores with Respondent Self-PerceptionsThe DiSC® assessment includes not only scale scores, but also narrative feedback designedto help respondents interpret those scale scores and understand the implications of theirresults. For more than 35 years, anecdotal evidence has suggested that the feedback withinthe DiSC report resonates with the vast majority of DiSC assessment takers, who find it to bean accurate description of themselves. Psychologists, however, recognize that respondentswill often “read into” their assessment results and agree with a very broad range of scaleinterpretations, particularly if they are positive (i.e., the Forer effect (Forer, 1949)).Consequently, it is necessary to empirically evaluate how well psychological scales and theinterpretation of those scales represent the characteristics of the respondent.A group of 3,398 participants were asked to take the DiSC assessment. They then read fourparagraphs (such as the one below), and after reading each one they rated how well each para-graph described them on a seven-point scale ranging from “Doesnʼt describe me at all” (1) to“Describes me very well” (7). Each of the four paragraphs reflected one of the four DiSC styles.
Sample Paragraph: Describing the D StyleMy determination and insistence keeps things moving and helpsme get real results. Iʼm fairly direct and candid and may even beseen as blunt by others. I donʼt usually sugarcoat my opinions, andIʼm straightforward and frank with my feedback even if itʼs not whatthe other person wants to hear. I can also come across asdominant or forceful when I have a clear sense of how thingsshould be. I may become a little aggressive, persistent, or evendemanding if I know it will get the job done.(All four paragraphs used in this research project are included in Appendix 3).
Responses to the four paragraphs were correlated with the four DiSC scales, as shown inparentheses on Table 2. Response bias, such as social desirability or responding toward themiddle, can distort the accuracy of participant paragraph ratings. For instance, a participantwho wants to appear in a favorable light may give high ratings to all paragraphs. In sucha case, her ratings are artificially inflated by the response bias of social desirability, andconsequently, her responses are a less accurate reflection of her true behavior andtendencies. To control for response bias, participant responses were ipsatized (this processis described beneath Table 2). Therefore, ipsatized ratings reflect the participantsʼ relativeratings of the paragraphs. Correlations between DiSC scale scores and ipsatized paragraphresponses are also shown in Table 2.
12 © 2008 by Inscape Publishing, Inc. All rights reserved.
Everything DiSC® Classic
V A L I D A T I O N
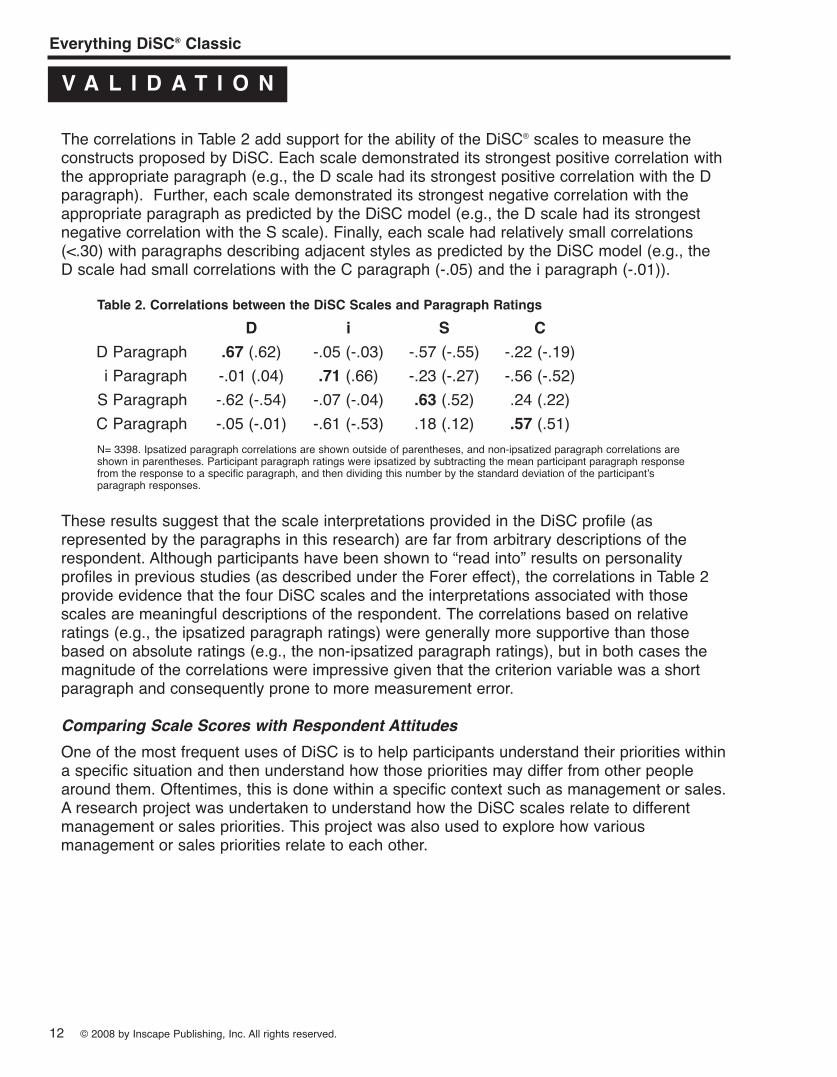
The correlations in Table 2 add support for the ability of the DiSC® scales to measure theconstructs proposed by DiSC. Each scale demonstrated its strongest positive correlation withthe appropriate paragraph (e.g., the D scale had its strongest positive correlation with the Dparagraph). Further, each scale demonstrated its strongest negative correlation with theappropriate paragraph as predicted by the DiSC model (e.g., the D scale had its strongestnegative correlation with the S scale). Finally, each scale had relatively small correlations(<.30) with paragraphs describing adjacent styles as predicted by the DiSC model (e.g., theD scale had small correlations with the C paragraph (-.05) and the i paragraph (-.01)).
Table 2. Correlations between the DiSC Scales and Paragraph RatingsD i S C
D Paragraph .67 (.62) -.05 (-.03) -.57 (-.55) -.22 (-.19)i Paragraph -.01 (.04) .71 (.66) -.23 (-.27) -.56 (-.52)
S Paragraph -.62 (-.54) -.07 (-.04) .63 (.52) .24 (.22)C Paragraph -.05 (-.01) -.61 (-.53) .18 (.12) .57 (.51)N= 3398. Ipsatized paragraph correlations are shown outside of parentheses, and non-ipsatized paragraph correlations areshown in parentheses. Participant paragraph ratings were ipsatized by subtracting the mean participant paragraph responsefrom the response to a specific paragraph, and then dividing this number by the standard deviation of the participantʼsparagraph responses.
These results suggest that the scale interpretations provided in the DiSC profile (asrepresented by the paragraphs in this research) are far from arbitrary descriptions of therespondent. Although participants have been shown to “read into” results on personalityprofiles in previous studies (as described under the Forer effect), the correlations in Table 2provide evidence that the four DiSC scales and the interpretations associated with thosescales are meaningful descriptions of the respondent. The correlations based on relativeratings (e.g., the ipsatized paragraph ratings) were generally more supportive than thosebased on absolute ratings (e.g., the non-ipsatized paragraph ratings), but in both cases themagnitude of the correlations were impressive given that the criterion variable was a shortparagraph and consequently prone to more measurement error.
Comparing Scale Scores with Respondent AttitudesOne of the most frequent uses of DiSC is to help participants understand their priorities withina specific situation and then understand how those priorities may differ from other peoplearound them. Oftentimes, this is done within a specific context such as management or sales.A research project was undertaken to understand how the DiSC scales relate to differentmanagement or sales priorities. This project was also used to explore how variousmanagement or sales priorities relate to each other.
Everything DiSC® Classic
© 2008 by Inscape Publishing, Inc. All rights reserved. 13
V A L I D A T I O N
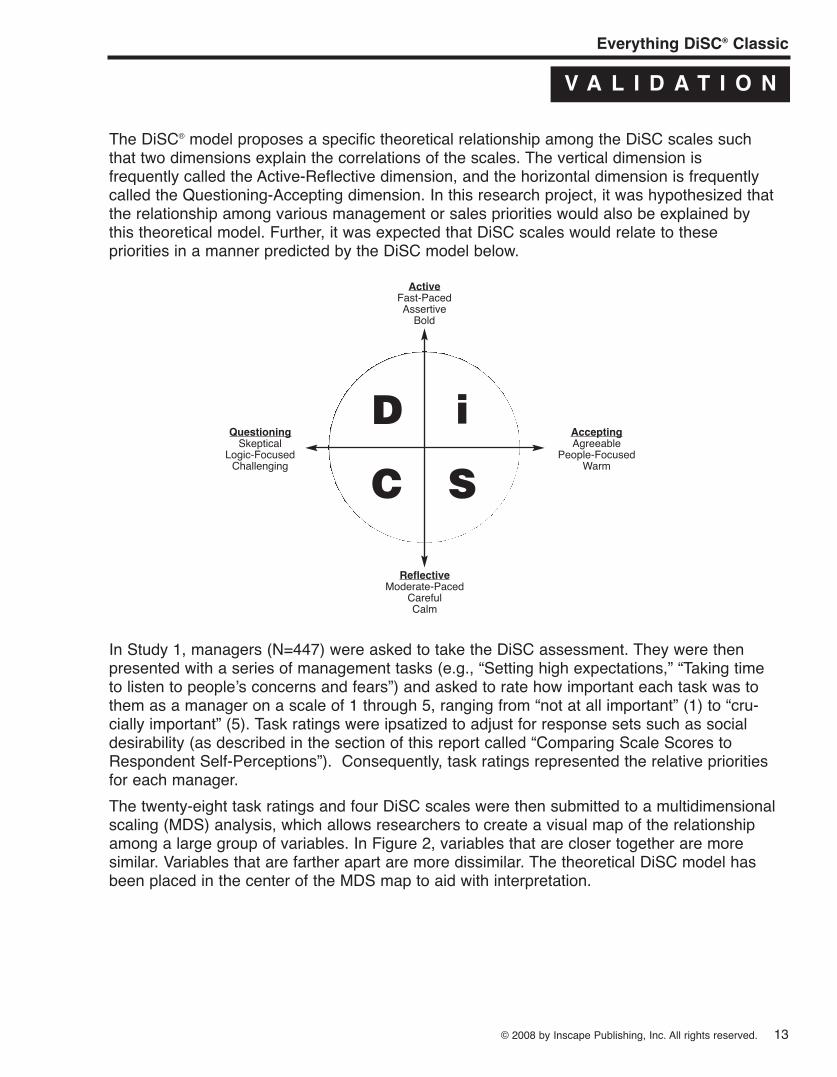
The DiSC® model proposes a specific theoretical relationship among the DiSC scales suchthat two dimensions explain the correlations of the scales. The vertical dimension isfrequently called the Active-Reflective dimension, and the horizontal dimension is frequentlycalled the Questioning-Accepting dimension. In this research project, it was hypothesized thatthe relationship among various management or sales priorities would also be explained bythis theoretical model. Further, it was expected that DiSC scales would relate to thesepriorities in a manner predicted by the DiSC model below.
In Study 1, managers (N=447) were asked to take the DiSC assessment. They were thenpresented with a series of management tasks (e.g., “Setting high expectations,” “Taking timeto listen to peopleʼs concerns and fears”) and asked to rate how important each task was tothem as a manager on a scale of 1 through 5, ranging from “not at all important” (1) to “cru-cially important” (5). Task ratings were ipsatized to adjust for response sets such as socialdesirability (as described in the section of this report called “Comparing Scale Scores toRespondent Self-Perceptions”). Consequently, task ratings represented the relative prioritiesfor each manager.The twenty-eight task ratings and four DiSC scales were then submitted to a multidimensionalscaling (MDS) analysis, which allows researchers to create a visual map of the relationshipamong a large group of variables. In Figure 2, variables that are closer together are moresimilar. Variables that are farther apart are more dissimilar. The theoretical DiSC model hasbeen placed in the center of the MDS map to aid with interpretation.
ActiveFast-PacedAssertive
Bold
ReflectiveModerate-Paced
CarefulCalm
AcceptingAgreeable
People-FocusedWarm
QuestioningSkeptical
Logic-FocusedChallenging
D i
SC
14 © 2008 by Inscape Publishing, Inc. All rights reserved.
Everything DiSC® Classic
V A L I D A T I O N
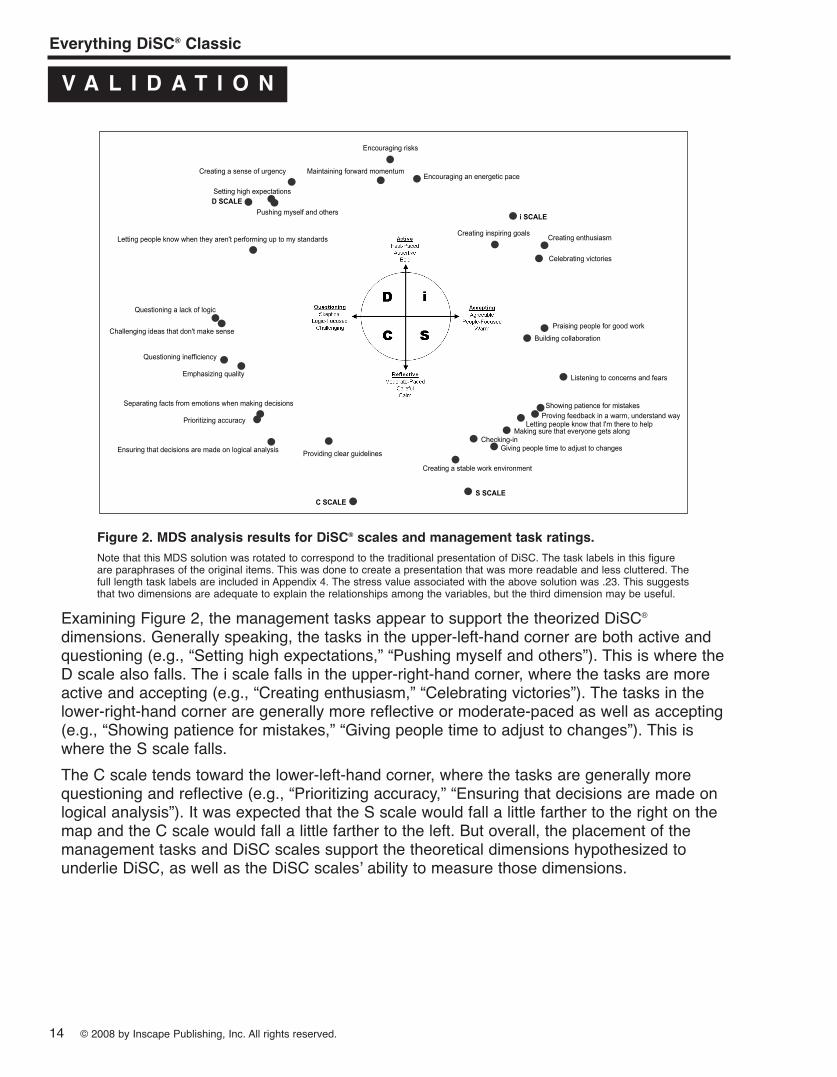
Figure 2. MDS analysis results for DiSC® scales and management task ratings.Note that this MDS solution was rotated to correspond to the traditional presentation of DiSC. The task labels in this figureare paraphrases of the original items. This was done to create a presentation that was more readable and less cluttered. Thefull length task labels are included in Appendix 4. The stress value associated with the above solution was .23. This suggeststhat two dimensions are adequate to explain the relationships among the variables, but the third dimension may be useful.
Examining Figure 2, the management tasks appear to support the theorized DiSC®
dimensions. Generally speaking, the tasks in the upper-left-hand corner are both active andquestioning (e.g., “Setting high expectations,” “Pushing myself and others”). This is where theD scale also falls. The i scale falls in the upper-right-hand corner, where the tasks are moreactive and accepting (e.g., “Creating enthusiasm,” “Celebrating victories”). The tasks in thelower-right-hand corner are generally more reflective or moderate-paced as well as accepting(e.g., “Showing patience for mistakes,” “Giving people time to adjust to changes”). This iswhere the S scale falls.The C scale tends toward the lower-left-hand corner, where the tasks are generally morequestioning and reflective (e.g., “Prioritizing accuracy,” “Ensuring that decisions are made onlogical analysis”). It was expected that the S scale would fall a little farther to the right on themap and the C scale would fall a little farther to the left. But overall, the placement of themanagement tasks and DiSC scales support the theoretical dimensions hypothesized tounderlie DiSC, as well as the DiSC scalesʼ ability to measure those dimensions.
Maintaining forward momentum
S SCALE
Creating a stable work environment
Checking-inGiving people time to adjust to changes
Making sure that everyone gets alongLetting people know that I'm there to help
Proving feedback in a warm, understand wayShowing patience for mistakes
Listening to concerns and fears
Building collaboration
Praising people for good work
i SCALE
Celebrating victories
Creating inspiring goals Creating enthusiasm
Encouraging an energetic pace
Encouraging risks
Creating a sense of urgency
Setting high expectations
Pushing myself and othersD SCALE
Letting people know when they aren't performing up to my standards
Questioning a lack of logic
Challenging ideas that don't make sense
Questioning inefficiency
Emphasizing quality
Separating facts from emotions when making decisions
Prioritizing accuracy
Ensuring that decisions are made on logical analysis Providing clear guidelines
C SCALE
Everything DiSC® Classic
© 2008 by Inscape Publishing, Inc. All rights reserved. 15
V A L I D A T I O N
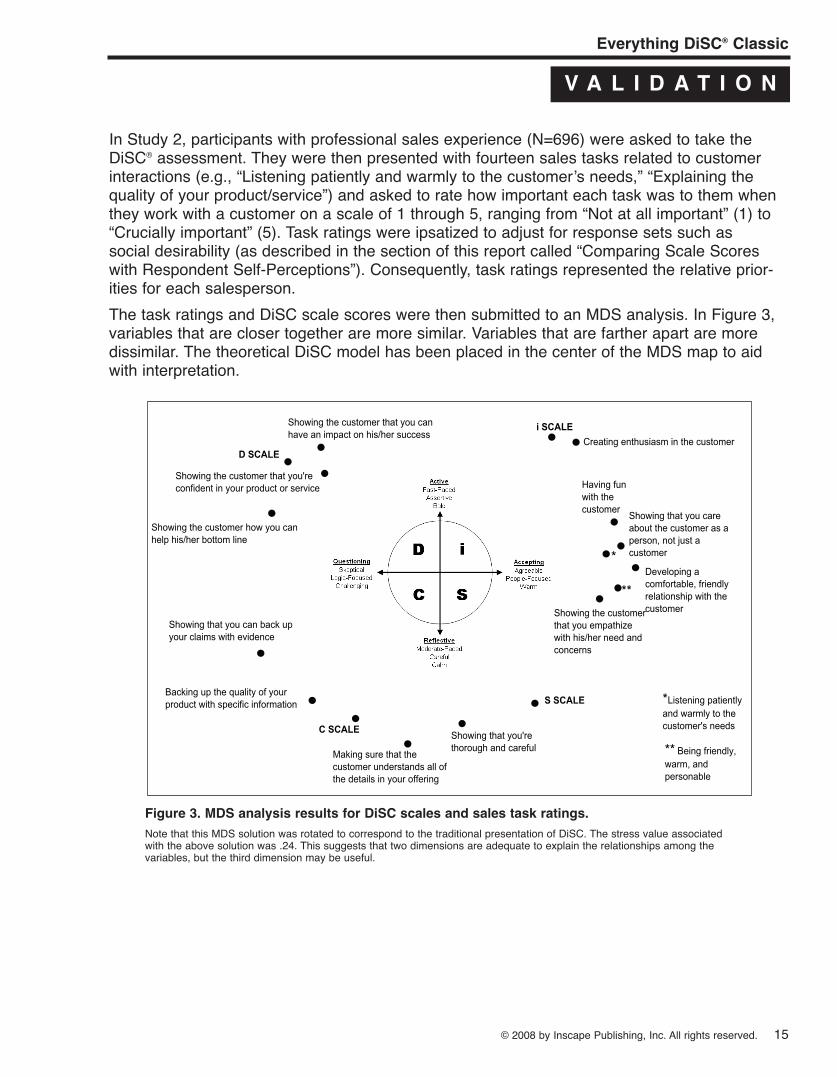
In Study 2, participants with professional sales experience (N=696) were asked to take theDiSC® assessment. They were then presented with fourteen sales tasks related to customerinteractions (e.g., “Listening patiently and warmly to the customerʼs needs,” “Explaining thequality of your product/service”) and asked to rate how important each task was to them whenthey work with a customer on a scale of 1 through 5, ranging from “Not at all important” (1) to“Crucially important” (5). Task ratings were ipsatized to adjust for response sets such associal desirability (as described in the section of this report called “Comparing Scale Scoreswith Respondent Self-Perceptions”). Consequently, task ratings represented the relative prior-ities for each salesperson.The task ratings and DiSC scale scores were then submitted to an MDS analysis. In Figure 3,variables that are closer together are more similar. Variables that are farther apart are moredissimilar. The theoretical DiSC model has been placed in the center of the MDS map to aidwith interpretation.
Figure 3. MDS analysis results for DiSC scales and sales task ratings.Note that this MDS solution was rotated to correspond to the traditional presentation of DiSC. The stress value associatedwith the above solution was .24. This suggests that two dimensions are adequate to explain the relationships among thevariables, but the third dimension may be useful.
Showing the customer that you can have an impact on his/her success
Showing the customer that you're confident in your product or service
Developing a comfortable, friendly relationship with the customer
** Being friendly, warm, and personable
Showing the customerthat you empathize with his/her need and concerns
Showing that you can back up your claims with evidence
Making sure that the customer understands all of the details in your offering
Showing that you're thorough and careful
S SCALE
Showing the customer how you can help his/her bottom line
Backing up the quality of your product with specific information
C SCALE
D SCALE
i SCALECreating enthusiasm in the customer
Having fun with the customer
*Listening patiently and warmly to the customer's needs
Showing that you care about the customer as a person, not just a customer*
**

16 © 2008 by Inscape Publishing, Inc. All rights reserved.
Everything DiSC® Classic
V A L I D A T I O N
The results from Study 2, shown in Figure 3, again support the dimensions theorized tounderlie the four DiSC® scales. The D scale is located in the upper-left-hand corner ofthe MDS map. Because people who score high on this scale have a fast pace, they arehypothesized to care less about details or specifics and more about bottom-line results. Andbecause these same people are more questioning or skeptical by nature, they are oftenhypothesized to skip social niceties and, again, focus their efforts on results. The MDS mapsupports these hypotheses, indicating that the D scale is most highly related to tasks such asshowing confidence, helping the customerʼs bottom line, and affecting the customerʼs success.The i scale is located in the upper-right-hand corner and is closest to tasks such as creatingenthusiasm and having fun with the customer. Both of these tasks reflect an active pace anda more accepting nature. The S scale is located in the lower-right-hand corner. This scale ishypothesized to combine an accepting nature with a slower, more reflective pace. The twotasks closest to this scale support this hypothesis. The S scale is close to the task, “Showingthat youʼre thorough and careful,” which reflects the cautious, slower paced aspects of thisscale. The S scale is also close to the task, “Showing the customer that you empathize withhis/her needs and concerns,” which reflects a more accepting nature. A cluster of tasks fallbetween the i and S scales, all of which reflect an accepting, people-focused disposition.The C scale falls in the lower-left-hand corner of the MDS map. The tasks that fall in thisregion reflect an assumption that the customer is careful, detail-oriented, and questioning,such as “Showing that you can back up your claims with evidence” and “Backing up thequality of your product with specific information.” As with Study 1, the overall results of Study2 provide strong support for the theoretical dimensions hypothesized to underlie DiSC, as wellas the DiSC scalesʼ ability to measure those dimensions.
Norms and Group ComparisonsNorms are an important concept in psychological testing. They allow you to compare yourresults on a test with the average person within a given population (e.g., your country, yourage group, your occupational group). And from this, norms allow us to understand whatscores should be considered average, what scores should be considered high, and whatscores should be considered low. This section will take a brief look at the use and relevanceof norms on the DiSC profile.When people take a psychological test, they receive what is called a raw score. This usuallyinvolves adding the number of items answered in a certain way and/or subtracting thenumber of items that are answered in a different way. For example, Graph III raw scoreson DiSC Classic are derived by adding the number of a participantʼs “most” responses andsubtracting the number of a participantʼs “least” responses. The raw score on each DiSCscale ranges from roughly -28 to +28 on Graph III of the profile. This range may be smallerdepending on the language version of the instrument (see Scoring of the DiSC Profile formore information.) Test designers need some way, however, to interpret the meaning of thatraw score. That is, what does a score of 9 mean in practical terms? Is it high? Is it low?Consequently, tests are "referenced" so that test designers can make sense of raw scoresand attach some practical meaning to the results. There are a variety of ways to referencea test. DiSC is “norm-referenced,” which means that a person's raw scores (ranging fromroughly -28 to +28) are interpreted relative to how everyone else in the population scores
Everything DiSC® Classic
© 2008 by Inscape Publishing, Inc. All rights reserved. 17
V A L I D A T I O N
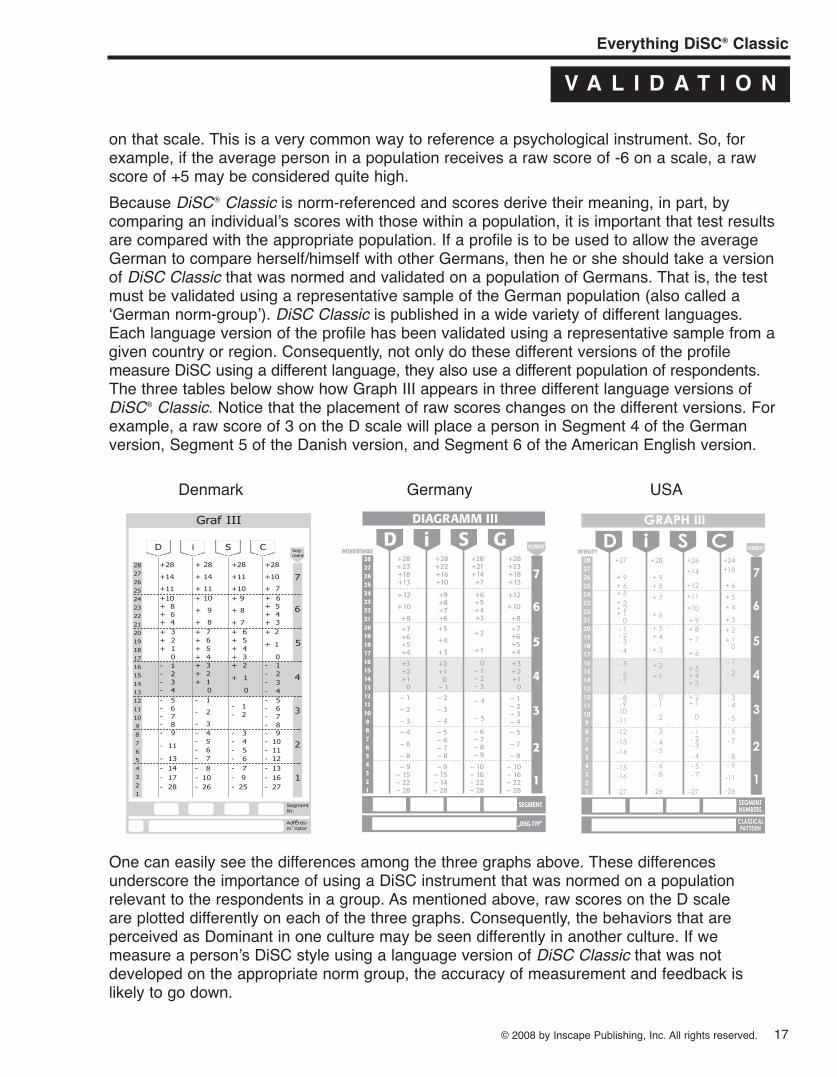
on that scale. This is a very common way to reference a psychological instrument. So, forexample, if the average person in a population receives a raw score of -6 on a scale, a rawscore of +5 may be considered quite high.Because DiSC® Classic is norm-referenced and scores derive their meaning, in part, bycomparing an individualʼs scores with those within a population, it is important that test resultsare compared with the appropriate population. If a profile is to be used to allow the averageGerman to compare herself/himself with other Germans, then he or she should take a versionof DiSC Classic that was normed and validated on a population of Germans. That is, the testmust be validated using a representative sample of the German population (also called aʻGerman norm-groupʼ). DiSC Classic is published in a wide variety of different languages.Each language version of the profile has been validated using a representative sample from agiven country or region. Consequently, not only do these different versions of the profilemeasure DiSC using a different language, they also use a different population of respondents.The three tables below show how Graph III appears in three different language versions ofDiSC® Classic. Notice that the placement of raw scores changes on the different versions. Forexample, a raw score of 3 on the D scale will place a person in Segment 4 of the Germanversion, Segment 5 of the Danish version, and Segment 6 of the American English version.
Denmark Germany USA
One can easily see the differences among the three graphs above. These differencesunderscore the importance of using a DiSC instrument that was normed on a populationrelevant to the respondents in a group. As mentioned above, raw scores on the D scaleare plotted differently on each of the three graphs. Consequently, the behaviors that areperceived as Dominant in one culture may be seen differently in another culture. If wemeasure a personʼs DiSC style using a language version of DiSC Classic that was notdeveloped on the appropriate norm group, the accuracy of measurement and feedback islikely to go down.
18 © 2008 by Inscape Publishing, Inc. All rights reserved.
Everything DiSC® Classic
V A L I D A T I O N
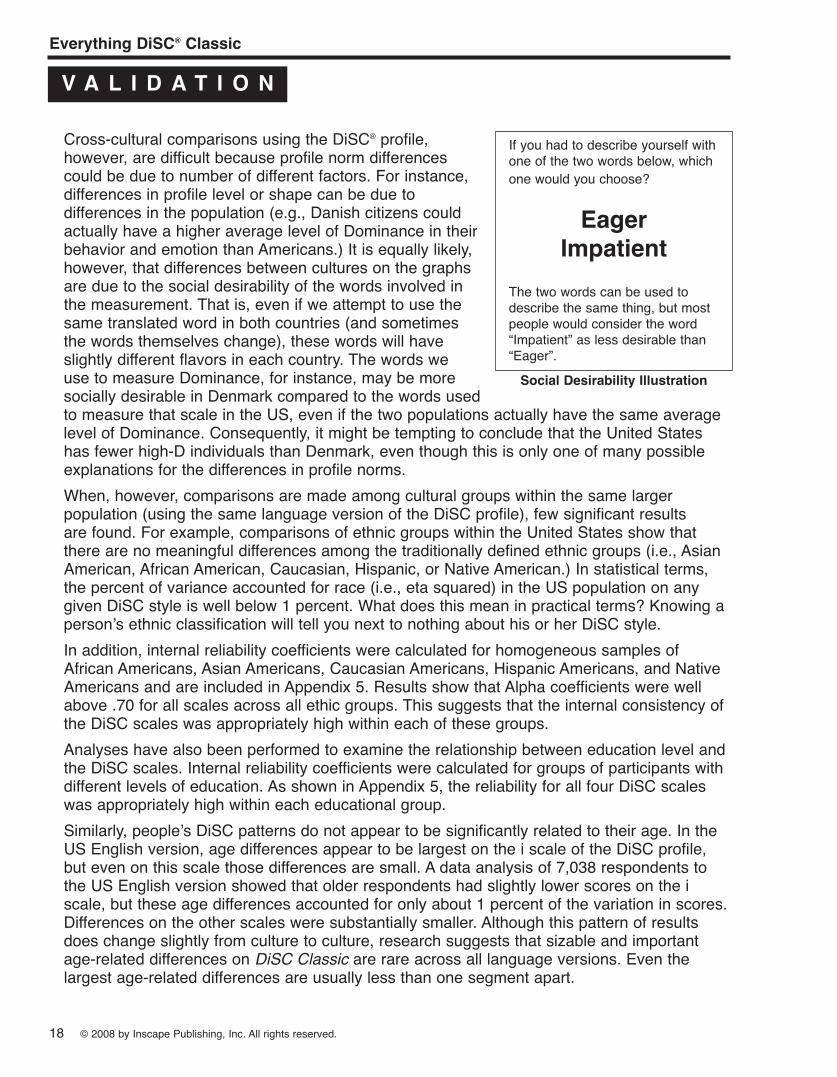
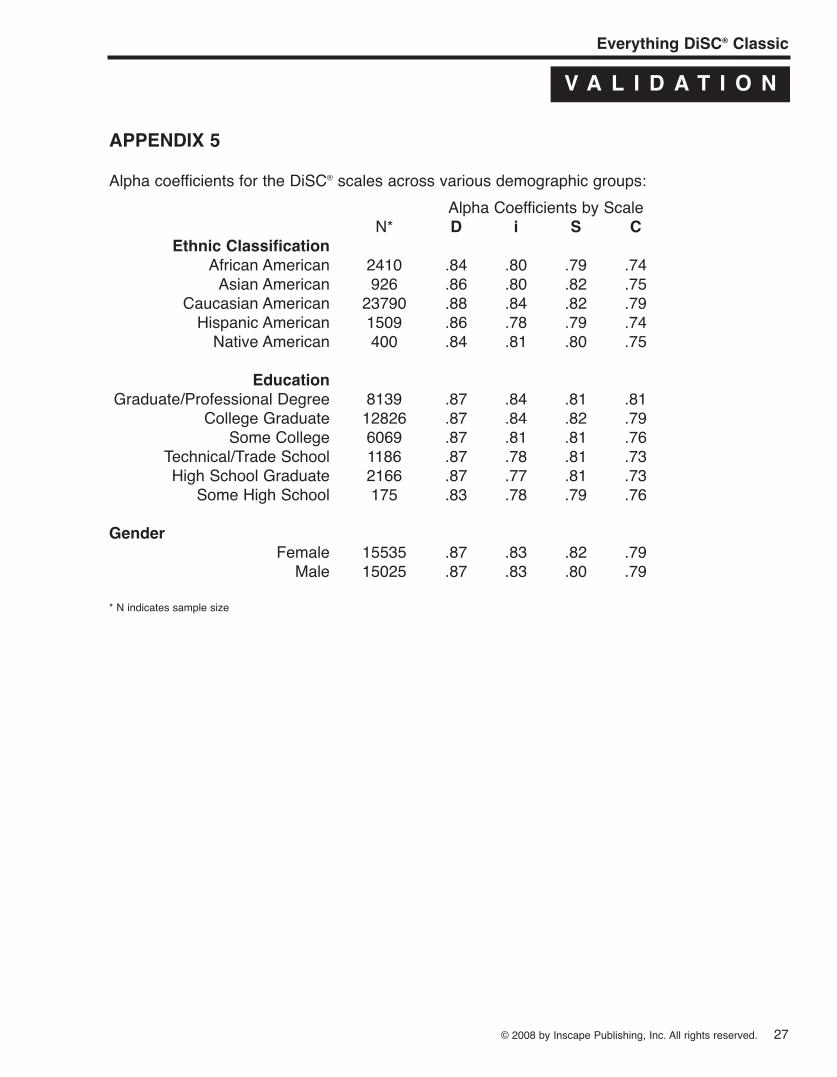
Cross-cultural comparisons using the DiSC® profile,however, are difficult because profile norm differencescould be due to number of different factors. For instance,differences in profile level or shape can be due todifferences in the population (e.g., Danish citizens couldactually have a higher average level of Dominance in theirbehavior and emotion than Americans.) It is equally likely,however, that differences between cultures on the graphsare due to the social desirability of the words involved inthe measurement. That is, even if we attempt to use thesame translated word in both countries (and sometimesthe words themselves change), these words will haveslightly different flavors in each country. The words weuse to measure Dominance, for instance, may be moresocially desirable in Denmark compared to the words usedto measure that scale in the US, even if the two populations actually have the same averagelevel of Dominance. Consequently, it might be tempting to conclude that the United Stateshas fewer high-D individuals than Denmark, even though this is only one of many possibleexplanations for the differences in profile norms.When, however, comparisons are made among cultural groups within the same largerpopulation (using the same language version of the DiSC profile), few significant resultsare found. For example, comparisons of ethnic groups within the United States show thatthere are no meaningful differences among the traditionally defined ethnic groups (i.e., AsianAmerican, African American, Caucasian, Hispanic, or Native American.) In statistical terms,the percent of variance accounted for race (i.e., eta squared) in the US population on anygiven DiSC style is well below 1 percent. What does this mean in practical terms? Knowing apersonʼs ethnic classification will tell you next to nothing about his or her DiSC style.In addition, internal reliability coefficients were calculated for homogeneous samples ofAfrican Americans, Asian Americans, Caucasian Americans, Hispanic Americans, and NativeAmericans and are included in Appendix 5. Results show that Alpha coefficients were wellabove .70 for all scales across all ethic groups. This suggests that the internal consistency ofthe DiSC scales was appropriately high within each of these groups.Analyses have also been performed to examine the relationship between education level andthe DiSC scales. Internal reliability coefficients were calculated for groups of participants withdifferent levels of education. As shown in Appendix 5, the reliability for all four DiSC scaleswas appropriately high within each educational group.Similarly, peopleʼs DiSC patterns do not appear to be significantly related to their age. In theUS English version, age differences appear to be largest on the i scale of the DiSC profile,but even on this scale those differences are small. A data analysis of 7,038 respondents tothe US English version showed that older respondents had slightly lower scores on the iscale, but these age differences accounted for only about 1 percent of the variation in scores.Differences on the other scales were substantially smaller. Although this pattern of resultsdoes change slightly from culture to culture, research suggests that sizable and importantage-related differences on DiSC Classic are rare across all language versions. Even thelargest age-related differences are usually less than one segment apart.
If you had to describe yourself withone of the two words below, whichone would you choose?
EagerImpatient
The two words can be used todescribe the same thing, but mostpeople would consider the word“Impatient” as less desirable than“Eager”.Social Desirability Illustration
Everything DiSC® Classic
© 2008 by Inscape Publishing, Inc. All rights reserved. 19
V A L I D A T I O N
Gender-related differences on DiSC® Classic have also been explored. Women and men doseem to show small but noticeable group differences on two of the four DiSC scales in theUS English version. Using the data set described above, women showed higher scores thanmen on the S scale, and men showed higher scores than women on the D scale. In bothcases, however, gender differences were less than one segment score and accounted forless than 3 percent of the variation in DiSC scores. Although men and women differ as agroup on the D and S scales, these results suggest that a personʼs gender will tell you verylittle about his or her expected DiSC profile. Other analyses showed that although womenscored higher than men on the i scale, this difference was not practically meaningful. Inaddition, women and men, on average, received almost identical scores on the C scale. Thisgeneral pattern of gender-related results is similar across a variety of different languageversions of DiSC Classic (e.g., German, Danish, UK English), although slight variations aresometimes observed. Internal reliability coefficients were calculated separately for femalesand males across all four DiSC scales. As shown in Appendix 5, reliability coefficients werewell above .70 for both genders across all scales.For reference purposes, Appendix 2 provides a sample of the demographic makeup of threedifferent DiSC Classic language versions (US English, UK English, and German). Thedemographics within these samples are designed to provide a rough reflection of the actualdemographics within the larger population. Subsequently, analyses on larger datasets supportthe validity and reliability that were found in these developmental samples. For instance, asample of over 7,000 respondents took the US English version of DiSC Classic. Theserespondents were roughly equivalent to the developmental sample on all major demographiccategories. As mentioned above, analyses of this newer, larger sample provides continuedsupport for the reliability and validity of the instrument.
Scoring of the DiSC ProfileDiSC Classic uses a measurement technique that is referred to as “forced-choice.” WithinDiSC Classic, this forced-choice format means that respondents are presented with fouradjectives (or phrases in some language versions) and asked to choose one that is most likethem and one that is least like them. The primary advantage of this format is that it reducessocial desirability of responding. Social scientists have long recognized that when mostpeople take a psychological instrument, they tend to respond in a way that makes them lookgood. This isnʼt necessarily a conscious attempt to deceive the instrument or test administrator.Rather, it is a natural desire to think about oneself and present oneself in the most positivelight. This is true of most psychologically healthy adults, across almost all cultures. Theforced-choice format reduces the influence of this tendency by forcing them to choose onlyone of many socially desirable choices. For instance, the first response box in the US Englishversion of DiSC Classic asks people to choose among the words enthusiastic, daring,diplomatic, and satisfied. Each of these words is a positive quality and therefore sociallydesirable. DiSC respondents, however, can only choose one that is most like them. Further,they also are forced to choose one that is least like them. Consequently, they cannot chooseevery positive quality, but rather must choose their relative highs and lows.
20 © 2008 by Inscape Publishing, Inc. All rights reserved.
Everything DiSC® Classic
V A L I D A T I O N
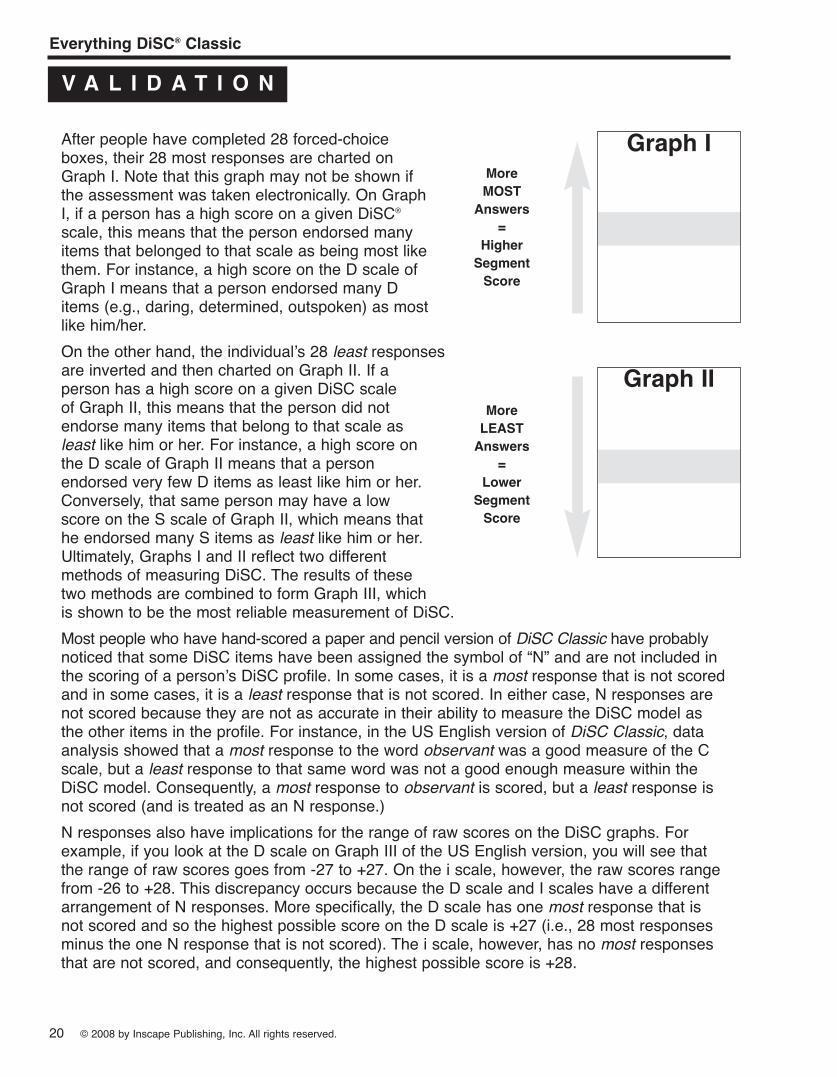
After people have completed 28 forced-choiceboxes, their 28 most responses are charted onGraph I. Note that this graph may not be shown ifthe assessment was taken electronically. On GraphI, if a person has a high score on a given DiSC®
scale, this means that the person endorsed manyitems that belonged to that scale as being most likethem. For instance, a high score on the D scale ofGraph I means that a person endorsed many Ditems (e.g., daring, determined, outspoken) as mostlike him/her.On the other hand, the individualʼs 28 least responsesare inverted and then charted on Graph II. If aperson has a high score on a given DiSC scaleof Graph II, this means that the person did notendorse many items that belong to that scale asleast like him or her. For instance, a high score onthe D scale of Graph II means that a personendorsed very few D items as least like him or her.Conversely, that same person may have a lowscore on the S scale of Graph II, which means thathe endorsed many S items as least like him or her.Ultimately, Graphs I and II reflect two differentmethods of measuring DiSC. The results of thesetwo methods are combined to form Graph III, whichis shown to be the most reliable measurement of DiSC.Most people who have hand-scored a paper and pencil version of DiSC Classic have probablynoticed that some DiSC items have been assigned the symbol of “N” and are not included inthe scoring of a personʼs DiSC profile. In some cases, it is a most response that is not scoredand in some cases, it is a least response that is not scored. In either case, N responses arenot scored because they are not as accurate in their ability to measure the DiSC model asthe other items in the profile. For instance, in the US English version of DiSC Classic, dataanalysis showed that a most response to the word observant was a good measure of the Cscale, but a least response to that same word was not a good enough measure within theDiSC model. Consequently, a most response to observant is scored, but a least response isnot scored (and is treated as an N response.)N responses also have implications for the range of raw scores on the DiSC graphs. Forexample, if you look at the D scale on Graph III of the US English version, you will see thatthe range of raw scores goes from -27 to +27. On the i scale, however, the raw scores rangefrom -26 to +28. This discrepancy occurs because the D scale and I scales have a differentarrangement of N responses. More specifically, the D scale has one most response that isnot scored and so the highest possible score on the D scale is +27 (i.e., 28 most responsesminus the one N response that is not scored). The i scale, however, has no most responsesthat are not scored, and consequently, the highest possible score is +28.
Graph IMoreMOSTAnswers
=HigherSegmentScore
Graph IIMoreLEASTAnswers
=LowerSegmentScore
Everything DiSC® Classic
© 2008 by Inscape Publishing, Inc. All rights reserved. 21
V A L I D A T I O N
Appendix 1Sample of Alpha coefficients for different language versions of Inscapeʼs DiSC® profile*.
SampleLanguage D i S C Size
Chinese .90 .91 .89 .89 807Danish .89 .79 .81 .81 1912
English (US) .92 .87 .88 .85 812English (Australian) .87 .84 .77 .82 406
English (UK) .89 .91 .85 .87 743Estonian .78 .84 .81 .82 908
Finnish .86 .84 .77 .87 805German .90 .92 .82 .91 1111
Hungarian .87 .83 .81 .82 501Italian .84 .84 .77 .83 704
Japanese .90 .87 .84 .85 813Korean .83 .85 .76 .83 1009Latvian .76 .73 .77 .71 1041
Lithuanian .78 .74 .75 .70 852Norwegian .87 .83 .80 .83 823
Portuguese .87 .91 .87 .86 1100Spanish (Mexican) .83 .81 .85 .79 901
Spanish (Chile, Columbia) .79 .74 .76 .74 412Swedish .80 .79 .72 .77 1007Turkish .75 .75 .77 .72 932
* Results based on development sample of the most recent version of each language version.
22 © 2008 by Inscape Publishing, Inc. All rights reserved.
Everything DiSC® Classic
V A L I D A T I O N
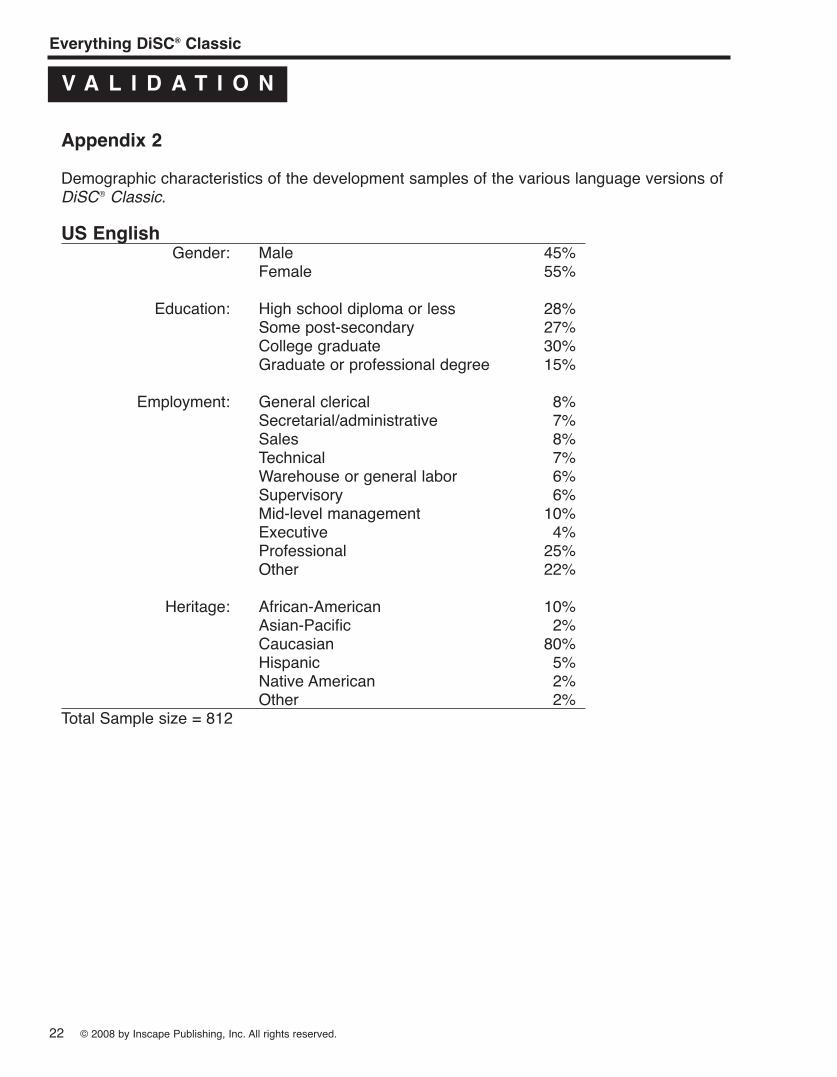
Appendix 2Demographic characteristics of the development samples of the various language versions ofDiSC® Classic.
US EnglishGender: Male 45%
Female 55%
Education: High school diploma or less 28%Some post-secondary 27%College graduate 30%Graduate or professional degree 15%
Employment: General clerical 8%Secretarial/administrative 7%Sales 8%Technical 7%Warehouse or general labor 6%Supervisory 6%Mid-level management 10%Executive 4%Professional 25%Other 22%
Heritage: African-American 10%Asian-Pacific 2%Caucasian 80%Hispanic 5%Native American 2%Other 2%
Total Sample size = 812
Everything DiSC® Classic
© 2008 by Inscape Publishing, Inc. All rights reserved. 23
V A L I D A T I O N
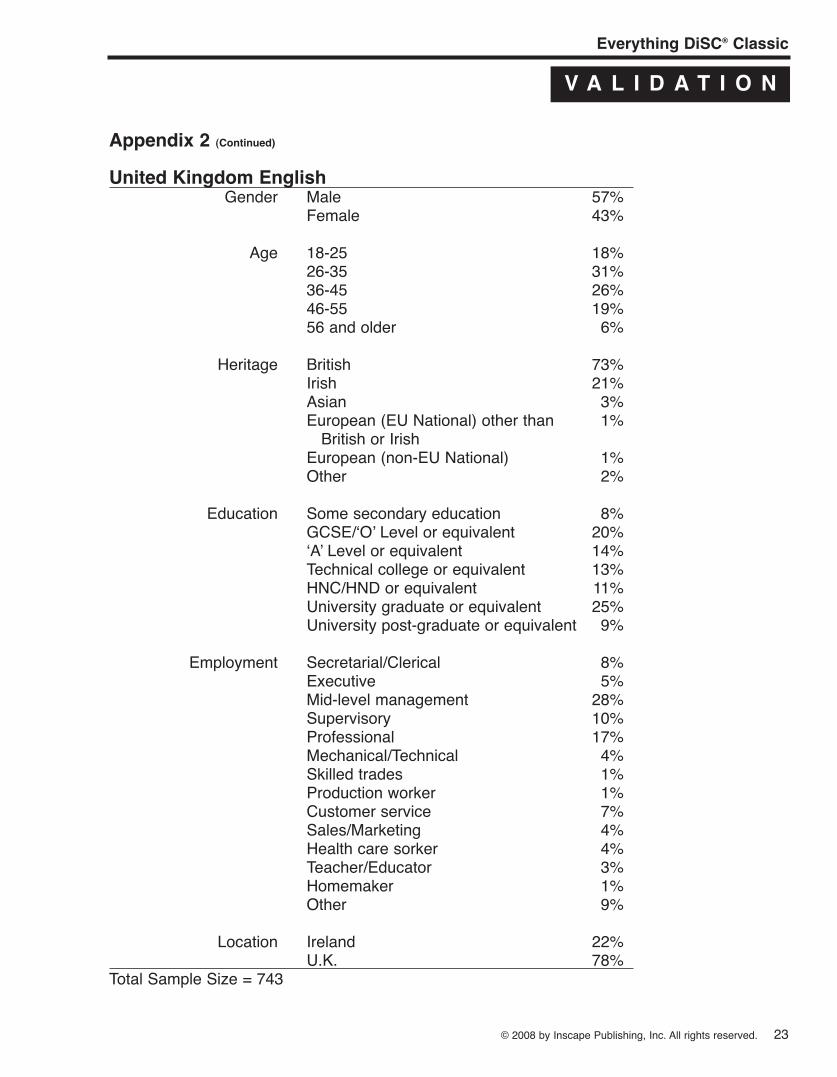
Appendix 2 (Continued)
United Kingdom EnglishGender Male 57%
Female 43%
Age 18-25 18%26-35 31%36-45 26%46-55 19%56 and older 6%
Heritage British 73%Irish 21%Asian 3%European (EU National) other than 1%
British or IrishEuropean (non-EU National) 1%Other 2%
Education Some secondary education 8%GCSE/ʻOʼ Level or equivalent 20%ʻAʼ Level or equivalent 14%Technical college or equivalent 13%HNC/HND or equivalent 11%University graduate or equivalent 25%University post-graduate or equivalent 9%
Employment Secretarial/Clerical 8%Executive 5%Mid-level management 28%Supervisory 10%Professional 17%Mechanical/Technical 4%Skilled trades 1%Production worker 1%Customer service 7%Sales/Marketing 4%Health care sorker 4%Teacher/Educator 3%Homemaker 1%Other 9%
Location Ireland 22%U.K. 78%
Total Sample Size = 743

24 © 2008 by Inscape Publishing, Inc. All rights reserved.
Everything DiSC® Classic
V A L I D A T I O N
Appendix 2 (Continued)
GermanGender Male 50%
Female 50%
Age 16-18 1%19-25 18%26-40 47%41-55 28%56-65 4%65+ 1%Missing 2%
Education No school 1%Main school 22%Secondary leading to intermediate 29%Grammar school 44%Missing 5%
Job Status Head of department 6%Worker/Mechanic 6%Civil servant 4%Self-employed 6%Company management 4%Unskilled worker 1%Clerical services 2%Mid-level management 5%Educator/Social worker 3%Official in charge 12%Engineering 7%Sales 10%Industrial classification 23%Missing 11%
Heritage German 72%Swiss 11%Austrian 11%Other 3%Missing 4%
Total Sample Size = 1070
Everything DiSC® Classic
© 2008 by Inscape Publishing, Inc. All rights reserved. 25
V A L I D A T I O N
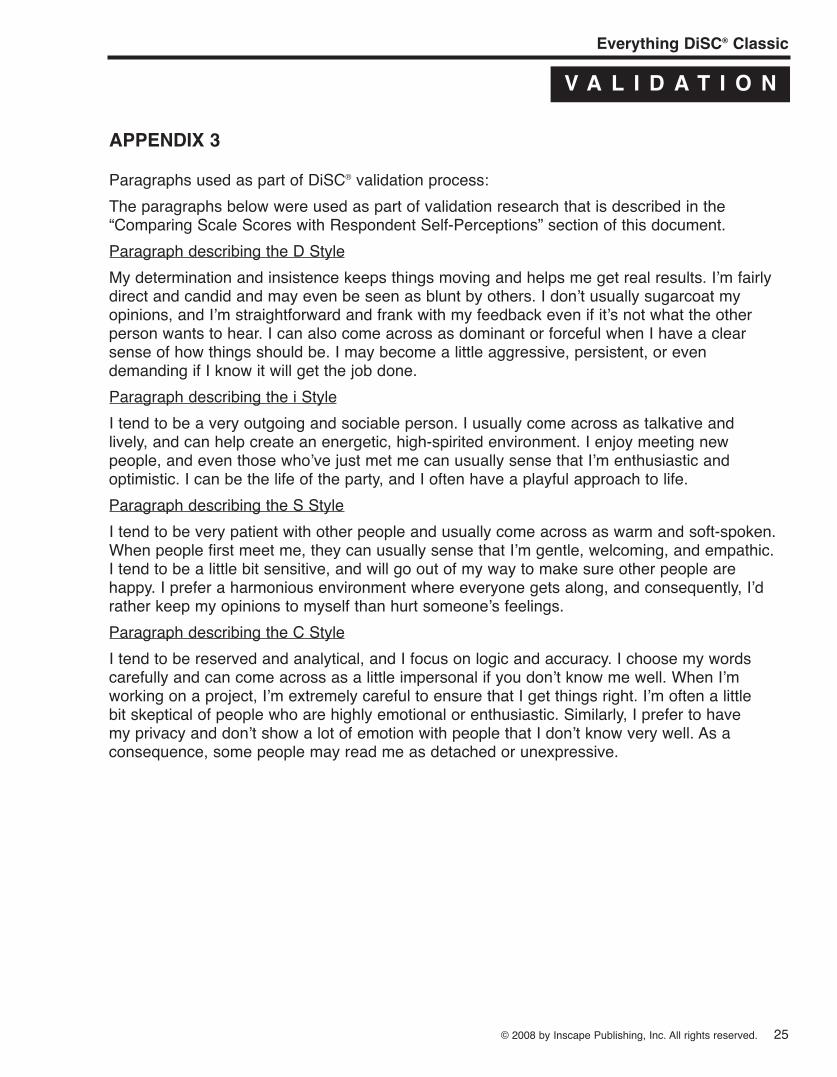
APPENDIX 3
Paragraphs used as part of DiSC® validation process:The paragraphs below were used as part of validation research that is described in the“Comparing Scale Scores with Respondent Self-Perceptions” section of this document.Paragraph describing the D StyleMy determination and insistence keeps things moving and helps me get real results. Iʼm fairlydirect and candid and may even be seen as blunt by others. I donʼt usually sugarcoat myopinions, and Iʼm straightforward and frank with my feedback even if itʼs not what the otherperson wants to hear. I can also come across as dominant or forceful when I have a clearsense of how things should be. I may become a little aggressive, persistent, or evendemanding if I know it will get the job done.Paragraph describing the i StyleI tend to be a very outgoing and sociable person. I usually come across as talkative andlively, and can help create an energetic, high-spirited environment. I enjoy meeting newpeople, and even those whoʼve just met me can usually sense that Iʼm enthusiastic andoptimistic. I can be the life of the party, and I often have a playful approach to life.Paragraph describing the S StyleI tend to be very patient with other people and usually come across as warm and soft-spoken.When people first meet me, they can usually sense that Iʼm gentle, welcoming, and empathic.I tend to be a little bit sensitive, and will go out of my way to make sure other people arehappy. I prefer a harmonious environment where everyone gets along, and consequently, Iʼdrather keep my opinions to myself than hurt someoneʼs feelings.Paragraph describing the C StyleI tend to be reserved and analytical, and I focus on logic and accuracy. I choose my wordscarefully and can come across as a little impersonal if you donʼt know me well. When Iʼmworking on a project, Iʼm extremely careful to ensure that I get things right. Iʼm often a littlebit skeptical of people who are highly emotional or enthusiastic. Similarly, I prefer to havemy privacy and donʼt show a lot of emotion with people that I donʼt know very well. As aconsequence, some people may read me as detached or unexpressive.
26 © 2008 by Inscape Publishing, Inc. All rights reserved.
Everything DiSC® Classic
V A L I D A T I O N
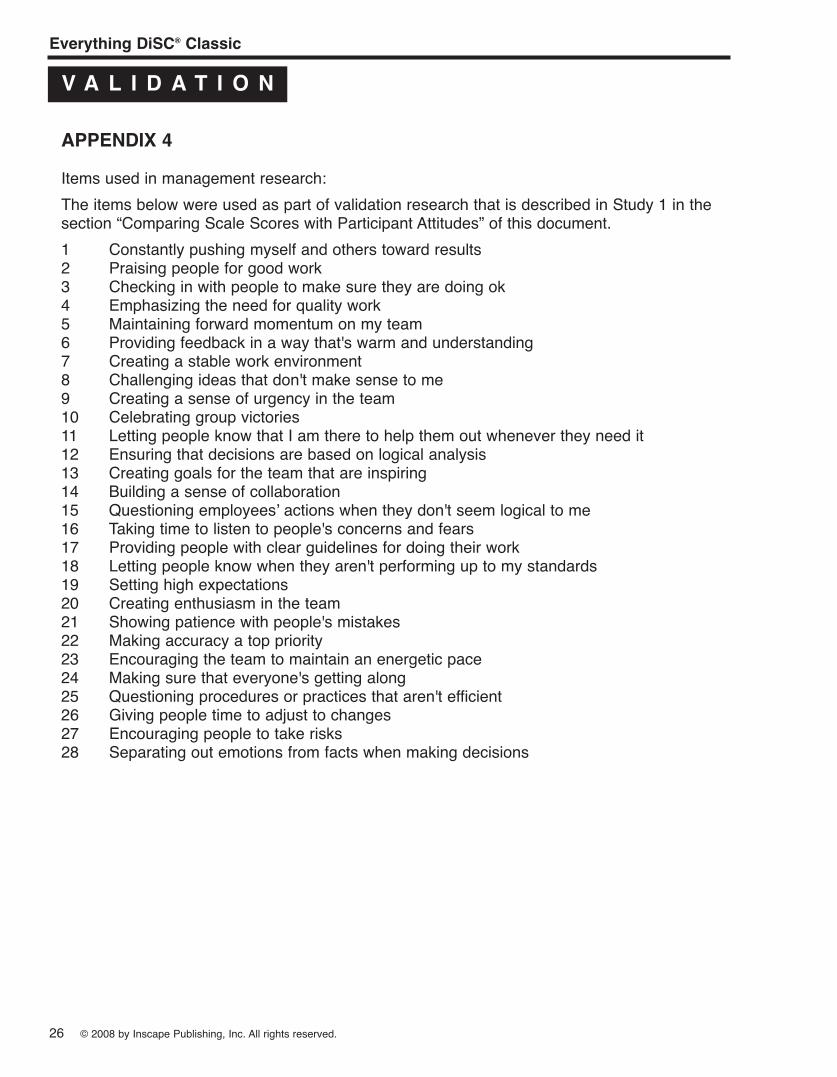
APPENDIX 4Items used in management research:The items below were used as part of validation research that is described in Study 1 in thesection “Comparing Scale Scores with Participant Attitudes” of this document.1 Constantly pushing myself and others toward results2 Praising people for good work3 Checking in with people to make sure they are doing ok4 Emphasizing the need for quality work5 Maintaining forward momentum on my team6 Providing feedback in a way that's warm and understanding7 Creating a stable work environment8 Challenging ideas that don't make sense to me9 Creating a sense of urgency in the team10 Celebrating group victories11 Letting people know that I am there to help them out whenever they need it12 Ensuring that decisions are based on logical analysis13 Creating goals for the team that are inspiring14 Building a sense of collaboration15 Questioning employeesʼ actions when they don't seem logical to me16 Taking time to listen to people's concerns and fears17 Providing people with clear guidelines for doing their work18 Letting people know when they aren't performing up to my standards19 Setting high expectations20 Creating enthusiasm in the team21 Showing patience with people's mistakes22 Making accuracy a top priority23 Encouraging the team to maintain an energetic pace24 Making sure that everyone's getting along25 Questioning procedures or practices that aren't efficient26 Giving people time to adjust to changes27 Encouraging people to take risks28 Separating out emotions from facts when making decisions
Everything DiSC® Classic
© 2008 by Inscape Publishing, Inc. All rights reserved. 27
V A L I D A T I O N
APPENDIX 5
Alpha coefficients for the DiSC® scales across various demographic groups:Alpha Coefficients by Scale
N* D i S CEthnic Classification
African American 2410 .84 .80 .79 .74Asian American 926 .86 .80 .82 .75
Caucasian American 23790 .88 .84 .82 .79Hispanic American 1509 .86 .78 .79 .74
Native American 400 .84 .81 .80 .75
EducationGraduate/Professional Degree 8139 .87 .84 .81 .81
College Graduate 12826 .87 .84 .82 .79Some College 6069 .87 .81 .81 .76
Technical/Trade School 1186 .87 .78 .81 .73High School Graduate 2166 .87 .77 .81 .73
Some High School 175 .83 .78 .79 .76
GenderFemale 15535 .87 .83 .82 .79
Male 15025 .87 .83 .80 .79
* N indicates sample size
28 © 2008 by Inscape Publishing, Inc. All rights reserved.
Everything DiSC® Classic
V A L I D A T I O N
REFERENCES
Benjamin, L. S. (1996). A clinician-friendly version of the Interpersonal Circumplex: StructuralAnalysis of Social Behavior (SASB). Journal of Personality Assessment, 66, 248-266.
Forer, B. R. (1949). The fallacy of personal validation: a classroom demonstration of gullibility.Journal of Abnormal and Social Psychology, 44, 118-123.
Kiesler, D. J. (1987). The Check List of Interpersonal Transactions—Revised (CLOIT-R).Richmond, VA: Virginia Commonwealth University.
Kiesler, D. J., & Schmidt, J. A. (1991). The Impact Message Inventory: Form IIA Octant ScaleVersion. Richmond, VA: Virginia Commonwealth University.
Leary, T. (1957). Interpersonal Diagnosis of Personality. New York: Ronald Press.Marston, W. M. (1928). The Emotions of Normal People. New York: Harcourt Brace
and Company.Wiggins, J. S. (1995). Interpersonal Adjective Scales: Professional Manual. Odessa, FL:
Psychological Assessment Resources, Inc.