valuations case study: ahold - scott mongeau - · pdf file‘valuations case study: ahold...
TRANSCRIPT

Erasmus RSM MFM: Valuations (H. Haanappel)‘Valuations Case Study: Ahold’
Friday, May 01, 2009S. Mongeau
Page 1 of 27
doug
Valuations Case Study: Ahold
Author: Scott Allen MongeauErasmus Rotterdam School of BusinessCandidate - 2009 Masters in Financial Management
Supervisor: Hans Haanappel, PhDErasmus University Rotterdam, Department of Finance
Assistant Professor - Faculty of [email protected]
I. MANAGEMENT SUMMARY
Royal Ahold (Koninklijke Ahold N.V.: www.ahold.com), publicly listed on the NYSE Euronext exchange(NYSE:AH) and US OTC market (OTC:AHONY), is a global retail supermarket group based in Europeand the United States with company headquarters in Amsterdam, The Netherlands. Chief competitors /peer group members include Carrefour, Delhaize, Metro AG, Kroger Co., Safeway Inc., Super de Boer,Wal Mart Stores Inc., Tesco PLC, and Supervalu Inc. The food retail sector is a highly competitive sector,with dependencies on geographic presence and sensitivities to consumer spending cycles, consumerloyalty, and material & supplier pricing pressures. The ability to retain market share via competitivepricing while safeguarding profit margins via passing-on material costs is thus a sensitive balance. Thiscase study takes a broad and deep look at Royal Ahold, offering a valuation perspective on the companyduring a period of challenge and change to the supermarket retailing sub-sector. The analysis covers thefollowing components: industry dynamics & firm strategy, historical performance analysis, DCF analysis(scenarios: standalone base case, standalone management guidance, and buyouts / LBO), alternativevaluation perspective (trading multiples), and results interpretation.
Keywords
Ahold, supermarket, food retail sector, valuation, case study

Erasmus RSM MFM: Valuations (H. Haanappel)‘Valuations Case Study: Ahold’
Friday, May 01, 2009S. Mongeau
Page 2 of 27
II. INDUSTRY DYNAMICS
A. Industry Outlook
In order to establish context for the valuation exercise it is important to understand Ahold’s core businessand industry via an inquiry into:
Key food retailing industry trends View on competition strengths / weaknesses and firm strategy Key value drivers Forecasting storyline
o Prospects for revenue growth / long term profitabilityo Business drivers
The food retail sector, variously identified as the grocery stores industry or the supermarket sector, is ahighly competitive industry facing distinct challenges amidst the current economic downturn. A decline inconsumer retail expenditures is underway, with a continuing pessimistic outlook for at least the next 12months. Food retailers are being squeezed between a curtailment in consumer spending (forcingretailers to lower prices to maintain competitiveness) and suppliers threatening to raise prices as theyface liquidity pressures (forcing downstream price increases).
While the global credit crisis initially impacted the financial services industry starting in late 2007, thechain reaction after-effects have negatively impacted firm and consumer credit liquidity as well asmacroeconomic trends such as unemployment. Combined with the after-effects of a full-blown stockmarket panic, the upshot has been massive equity losses on company balance sheets and accompanyinglosses on the part of institutional and individual investors.
In terms of food retail industry equity performance for the US market, Q1 2009 saw a -21.2% decline inthe S&P Food Retail Index versus -24.6% in the S&P 1500 (2008 overall: -30.6% S&P Food Retail versus-38.2% S&P 1500). For a broader comparison, the MSCI World Index evidenced a -40.82% decline in2008. Thus, food retail equities in particular have done slightly ‘less badly’ than the broader stock market,perhaps bolstered by the reputation of the food retail sector as being ‘recession proof’. However, thehistoric scale of recent equity deleveraging has resulted in a broad macroeconomic challenge to globalconsumers, via the threat of unemployment, the loss of personal savings, and broad economic malaise.This trend is challenging food retail revenue streams as consumers tighten spending.
Although there is a consumer staples ‘necessity factor’ built into the grocery industry, profit margins arevery much at risk as the credit crisis puts pressure on consumer spending as a follow-on effect. Asreported recently in Progressive Grocer, an online industry guide, “traditionally, grocery has been viewedas recession-resistant, but the channel is not recession-proof” (Progressive Grocer Staff, 2009). Alreadytight food retail sector profit margins thus stand vulnerable concerning all retailing outside consumerstaples.
Evolving industry analysis bears out the effects of macroeconomic concerns in this industry. While Q42008 saw consumers shift from restaurants and other food service vendors to supermarkets, causing aslight gross sales uptick in many markets (Drake, 2008), a continuing deterioration in consumer spendinghas seen food retailing belt tightening as well now. It has been remarked by food retail sector analyststhat 2009 saw the return of careful consumer behavior, including price watching, coupon cutting, andbuying discount brands (Progressive Grocer Staff, 2009).
Continuing consumer curtailment in 2009 will put pricing pressures on food retailers, already operating onthin margins due to competition in saturated markets. In particular, food retailers operating indiscretionary, higher priced markets will be forced to rapidly retrench to meet a pronounced phase ofconsumer thriftiness. With global credit tight, suppliers will be challenged as well; there is the realpotential of food retailers facing a pricing squeeze between tight consumer spending and supplierspassing-on downstream pricing increases to the retailers.
The food retail sector in developed markets is highly saturated, with competitive factors driving tight profitmargin sensitivities. Dependencies rest on geographic point-of-sale positioning in profitable residential
Erasmus RSM MFM: Valuations (H. Haanappel)‘Valuations Case Study: Ahold’
Friday, May 01, 2009S. Mongeau
Page 3 of 27
consumer markets. Sensitivities are tied to consumer spending cycles, consumer loyalty, and material &supplier pricing pressures. Additionally, third-party manufactured / processed retail goods embed costssuch as transport, storage, raw materials, manufacturing, safety / quality assurance, marketing, brandingand advertizing, and wastage / spoilage costs. The ability to retain market share via competitive pricingwhile safeguarding profit margins via passing-on downstream costs to the consumer is thus a crucialbalance in this industry.
Reoccurring costs associated with food retail industry operators includes (not exhaustive):
Attracting and retaining clientele (advertizing, marketing, branding, consumer incentives, etc.) Personnel (management, inventory control, stocking, store maintenance, back-office, etc.) Information technology (particularly as associated with efficient real-time inventory management) Store / property maintenance overhead Transport Storage Wastage and spoilage Self-produced / branded goods production (as applicable)
Of the various cost factors, it is worthy to note that the last, self-branded or ‘private label’ goods are apromising aspect for the industry. Typically self-produced products are lower-cost and thus compete wellwith higher-cost brands with price sensitive consumers. As noted in a recent Progressive Grocer analystarticle:
Private label was also the beneficiary of financial worries, with both unit and dollar sales hitting anall-time high in 2008. Toward year-end, private label dollar sales jumped by about 10 percentover five consecutive four-week periods, averaging out to 4 percent dollar and 5 percent unitsales growth for the year. In the same period, branded offerings underperformed, realizing a 3percent dollar sales increase and a 3 percent decline in unit sales. (2009)
Thus, for careful food retailers, there are silver linings in the current economic malaise. Self-brandedgoods have pricing advantages and food retailers can amplify their sales via product placement (i.e.: shelfpositioning, store placement – a core power of food retailers) and promotions (i.e.: coupons, discounts,special deals via consumer loyalty cards, etc.). However, the general retail environment is one ofdeclining consumer expenditures, in particular regarding non-essentials.
The long-term food retail industry outlook is complicated by the dramatic recent macroeconomicdevelopments. One hopeful aspect of the current climate is the rapidity and breadth with which theunfolding credit crisis took hold: a rapid decline presages a potential rapid recovery. Many retail sectoranalysts have posited that consumer confidence will begin a gradual upswing beginning in the secondhalf of 2009 (Progressive Grocer Staff, 2009).
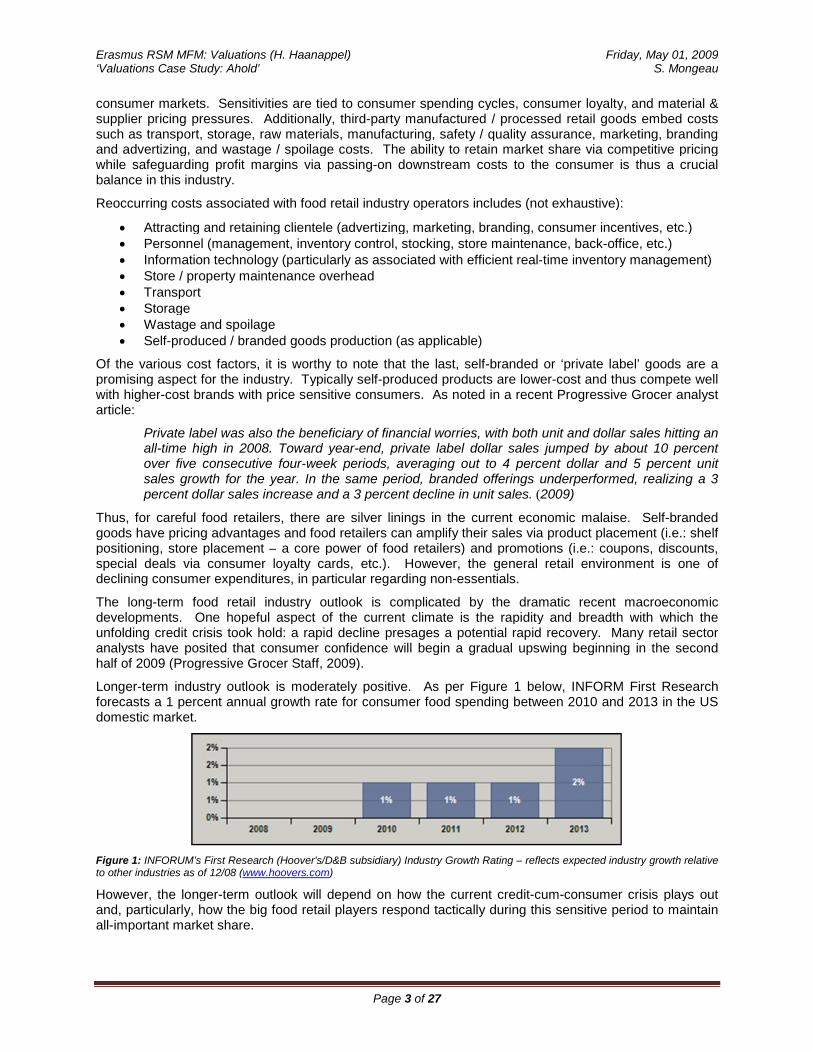
Longer-term industry outlook is moderately positive. As per Figure 1 below, INFORM First Researchforecasts a 1 percent annual growth rate for consumer food spending between 2010 and 2013 in the USdomestic market.
Figure 1: INFORUM’s First Research (Hoover's/D&B subsidiary) Industry Growth Rating – reflects expected industry growth relativeto other industries as of 12/08 (www.hoovers.com)
However, the longer-term outlook will depend on how the current credit-cum-consumer crisis plays outand, particularly, how the big food retail players respond tactically during this sensitive period to maintainall-important market share.

Erasmus RSM MFM: Valuations (H. Haanappel)‘Valuations Case Study: Ahold’
Friday, May 01, 2009S. Mongeau
Page 4 of 27
B. Competitive Pressures
Competitive forces in the food retail sector are pronounced, forcing tight margins in a highly-saturatedmarket. Population demographics, consumer tastes and spending capacity drive demand factors.Because margins are low, the profitability of individual stores, and by extension companies andconglomerates, depends on high volume sales and efficient operations.
Efficient food retail operations involve aspects such as:
Distribution networks (rapid transport, warehousing and proper handling to minimize spoilage) Inventory control (particularly modern information technology-driven systems) Goods handling facilities and processes (efficient staging and stocking processes in tight
conjunction with inventory management) Supplier relations (volume pricing, tightly negotiated terms, credit terms, contractual terms, etc.) Retail acumen (product placement, shelving practices, promotions, marketing, etc.)
Concerning scale, larger companies and conglomerates can offer a wide selection of products(particularly self-branded) and have advantages in purchasing (supplier relations), distribution, inventorycontrol, marketing, and finance. Particularly with tight information technology oversight, food retailers canrealize many efficiencies of scale, similar to those that can be observed in broader goods retailers suchas Walmart and Amazon. The case-study here, being centered on Ahold, Figure 2 below shows the top-ten supermarket retail sector retailers by market cap (note Ahold at position seven):
Figure 2: Top-ten supermarket sector retailers by market cap as positioned by Alacra (www.alacrastore.com)
However, scale can also result in difficulties in rapid tactical retailing responsiveness. The speed of thecurrent economic crisis took many retailers by surprise, trapping food retailers such as Whole Foods and,to some degree Albert Heijn (at least in the native Dutch market) in higher-end consumer discretionaryspending markets that rapidly dried up. Small companies, by comparison, have the flexibility to rapidlyrespond to changes in consumer demand. Smaller retail operations can also compete via offering nicheand specialty products, serving localized markets, and/or providing superior customer service. Thebenefits of scale, as in other industries, are balanced by restrictions in tactical agility.
Concerning relative rankings, there is a wealth of analyst equity research for the US markets. Ahold, thesubject for this case study is not typically covered in the US equity market, being an OTC / Euronextequity. However, in terms of key statistics and ratios, Ahold compares favorably to US industrycompetitor Krogers (NYSE:KR). Krogers and Ahold have a nearly identical profitability profile. In termsof valuation and economic value added factors, the two firms compare quite favorably. In terms of keydifferences, Ahold has a stronger financial strength rating due to a proportionately lower debt to equityratio (relative to a basket of competitors). On the other hand, Ahold equity trades at a relative premium,having a 75% higher P/E ratio than that of comparable food retail competitors 15.42x versus 11.32x). Fordetailed comparison amongst the two comparable firms, see Figure 3 below.

Erasmus RSM MFM: Valuations (H. Haanappel)‘Valuations Case Study: Ahold’
Friday, May 01, 2009S. Mongeau
Page 5 of 27
Ahold Krogers
Figure 3: Via ETrade (www.etrade.com), key figure / ratio similarities between Ahold and Kroger (low relative debt level and highP/E for Ahold compared to basket of competitors). Note that analysis conducted later in this case had different figures for yearending 2008 (i.e.: gross margin 26.9%, different P/E and P/BV ratios, ROE and ROIC) – please see accompanying spreadsheet‘Valuation Ahold’ for details (‘Valuation Presentation’ and ‘Ratios’ worksheets).
The US market generates slightly over half of Ahold’s annual sales, and is thus is a key component inanalyzing company health and value. Supermarket News ranked Ahold's U.S. division No. 7 in the 2007"Top 75 North American Food Retailers" rating (Chee, 2009). Taking Krogers as a rough proxy for USmarket comparison, Ahold compares favorably (in terms of analyst equity investment recommendations)amongst a basket of US competitors as per Figure 4 below (source: Jaywalk Rating). Krogers has astrong buy-to-hold rating. Note that contrary to Figure 3 Valuation commentary, subsequent analysis (seeaccompanying spreadsheet) suggested that Ahold’s P/E ratio is not appreciably higher than that of peers(this is additionally backed by Thompson One). Though the Figure 4 comparison focuses on equityinvestment analyst recommendations, the positions can be considered indicative of general firm strength.

Erasmus RSM MFM: Valuations (H. Haanappel)‘Valuations Case Study: Ahold’
Friday, May 01, 2009S. Mongeau
Page 6 of 27
Figure 4: ‘Jaywalk Rating’ US Grocery Store Sector Equity Recommendation Matrix - equity analyst buy/sell ratings weighted bynumber of Independent Research Providers (IRPs) reporting. Krogers can be considered a rough proxy for Ahold based on similarmultiples as per Figure 3.
Later in this valuation exercise (see section V C), an in depth trading multiples-based valuation isconducted utilizing a basket of Ahold peer group members including Carrefour, Delhaize, Metro AG,Kroger Co., Safeway Inc., Super de Boer, Wal Mart Stores Inc., Tesco PLC, and Supervalu Inc. Insummary, for the purpose of understanding Ahold in the context of the food retail sector, it can be saidthat Ahold is a major player in both US and European markets and that as a firm it is favorable regardedamongst comparable competitors by industry analysts.
In terms of broad industry trends, as covered in Section II A concerning the rapid deterioration in theglobal economic outlook, in late 2008 consumers cut discretionary spending, shifting to value-orientedbrands and retailers for staples. Discounters saw gains, while premium retailers saw dramatic declines.Mid-range retailers who had been following the trend toward upmarket retailing were forced into a rapidabout-face to accommodate the new economic realities. In a dramatic example, upmarket US organicfoods retailer Whole Foods Market Inc. (WFMI:NASDAQ) saw more than a 70% decline in equityvaluation in 2008 (see also Figure 4 for analyst peer equity rating). As noted in a recent Business Weekarticle:
For years, the Austin (Tex.)-based company has fed off the popularization of organic foods,seeking to cater to ‘customers aspiring to a healthier lifestyle’ with organic vegetables, high-quality meats, and gourmet cheeses. The company, which runs 271 stores in the U.S., Canada,and Britain, booked $6.6 billion in 2007 revenue. But as inflation and growing unemploymenthave taken a bite out of consumers' purchasing power, some are shunning the store's high-quality image in search of cheaper alternatives. (McRoskey, 2008)
(Krogers)SupervaluWhole Foods
Casey’sRuddick
DelhaizeThe Pantry
Ingles MarketsArden Group
Village Super MarketWinn-Dixie Stores
Susser Holdings
Companhia Brasiliera
Blue Square IsraelDeidrich Coffee
Safeway

Erasmus RSM MFM: Valuations (H. Haanappel)‘Valuations Case Study: Ahold’
Friday, May 01, 2009S. Mongeau
Page 7 of 27
Thus, surviving the global recession underway will depend in part upon the ability of retailers to rapidlyattach themselves to a mass consumer flight to ‘cost sensitivity’. As per the Wholefoods case, high-endsupermarket retailers, and those retailers serving discretionary consumer segments, are at high risk ofdouble-jeopardy as consumers and investors flee alike. In summary, the currently slowing economy ispushing consumers to low-margin products, forcing retailers to rapidly shift merchandising efforts towardscost savings drivers. Not responding effectively to this sudden shift will see existing players lose marketshare in the longer-term.
III. DESCRIPTION OF COMPANY
A. Company Overview
Ahold is a food retail and foodservice company with 2,897 storesserving 35 million customers in 27 countries as of Q4 2008. Aholdachieved €25.7 billion in 2008 net sales via its core activity of operatingretail food stores via subsidiaries and joint ventures. Retail operationsoperate via five key subsidiaries: Stop & Shop / Giant-Landover, Giant-Carlisle, Albert Heijn, Albert / Hypernova, Other retail and CorporateCenter. Chief competitors / peer group members include Carrefour,Delhaize, Metro AG, Kroger Co., Safeway Inc., Super de Boer, WalMart Stores Inc., Tesco PLC, and Supervalu Inc. As per Figure 2 inSection II B, Ahold is ranked seventh amongst global food retailers asmeasured by market capitalization (US $13.6 billion). Figure 5 belowshows a geographic breakdown of the Ahold group of companies.
Albert Heijn began selling groceries inthe 1880’s.
Figure 5: Geographic breakdown of Ahold company portfolio (source: www.ahold.com)
The Ahold portfolio of 2,897 stores breaks down into 711 stores for Ahold USA and 2,186 for AholdEurope. The US market generates slightly over half of Ahold’s annual sales (Chee, 2009). A strategicrefurbishment of US stores started in 2006 has eaten into profit margins for the US segment, but it isprojected these improvements will contribute to a rise in profits later in 2009. Within the Europeanmarket, the Albert Heijn chain is the flagship banner of Royal Ahold (1,861 stores). The grocery chain hasa 22% share of the European market, but is losing ground to competitors, including hard discounter ALDIof Germany and region rivals Laurus N.V. and Edah. In response, Albert Heijn has undergone an imagemakeover; from the most expensive supermarket in Holland to a price-competitive supermarket chain.

Erasmus RSM MFM: Valuations (H. Haanappel)‘Valuations Case Study: Ahold’
Friday, May 01, 2009S. Mongeau
Page 8 of 27
Figure 6: Number of stores in each company segment as perQ4 2008. Note that Peapod is a ‘virtual’ / internet based food retailcompany (source: Ahold 2008 Annual Report - Financial Statement)
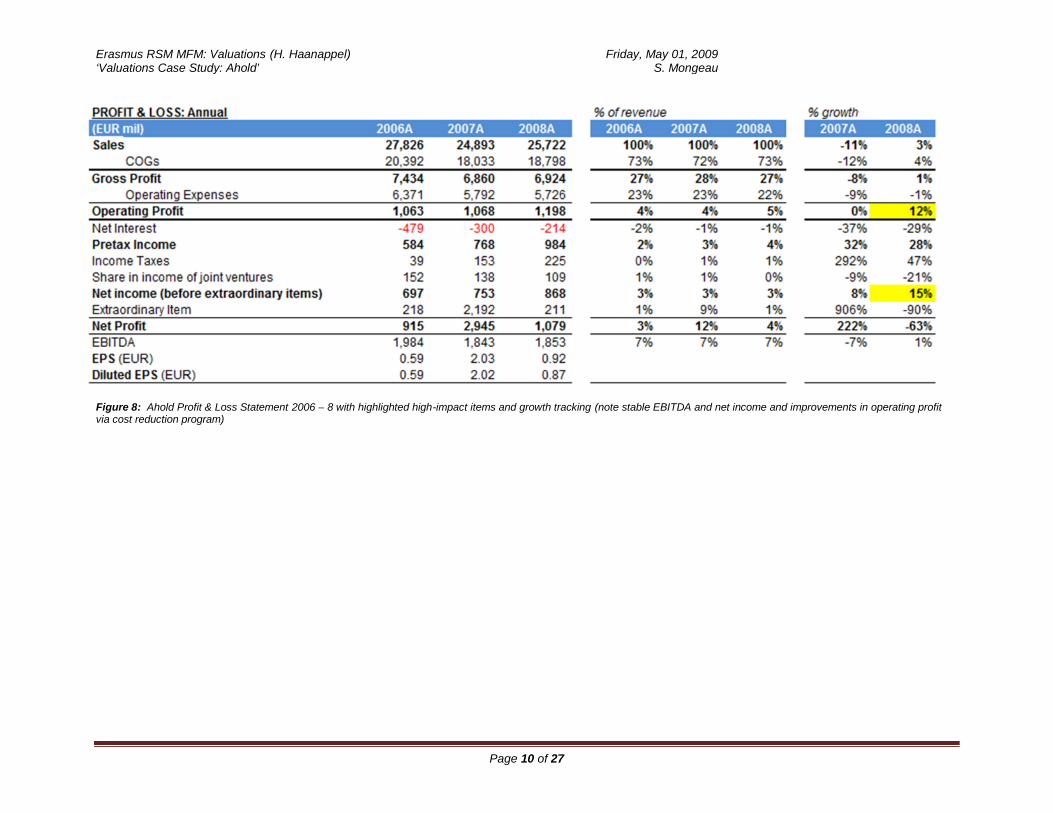
A historical analysis was carried out: key financial ratios were derived from the 2006 – 8 Balance Sheet(see Figure 7 – note highlighted items having significant weight). As well, a Profit & Loss Statement wasprepared for the same time period (see Figure 8). Of note, stable EBITDA and net margin can beobserved. An improvement in operating profit can be observed over this time period due to a costreduction program. Finally, key financial ratios were derived from this data. Later in the analysis, theratios are used to compare to a basket of competitors. In general, as per the comparison with Krogers,Ahold compares well to competitors. Ahold has a low debt ratio; the stock trades at a relatively high P/Eratio though, so firm strength is firmly priced into the current equity valuation.

Erasmus RSM MFM: Valuations (H. Haanappel)‘Valuations Case Study: Ahold’
Friday, May 01, 2009S. Mongeau
Page 9 of 27
Figure 7: Ahold Balance Sheet 2006 – 8 with highlighted high-impact items and growth tracking
Erasmus RSM MFM: Valuations (H. Haanappel)‘Valuations Case Study: Ahold’
Friday, May 01, 2009S. Mongeau
Page 10 of 27
Figure 8: Ahold Profit & Loss Statement 2006 – 8 with highlighted high-impact items and growth tracking (note stable EBITDA and net income and improvements in operating profitvia cost reduction program)

Erasmus RSM MFM: Valuations (H. Haanappel)‘Valuations Case Study: Ahold’
Friday, May 01, 2009S. Mongeau
Page 11 of 27
Figure 9: Ahold Key Financial Ratios 2006 – 8

Erasmus RSM MFM: Valuations (H. Haanappel)‘Valuations Case Study: Ahold’
Friday, May 01, 2009S. Mongeau
Page 12 of 27
Based on 2006 – 8 Ahold per store segment operating income data, a ten year forecast was projected (see Figure 10 below). A scenario analysisincluding geographic GDP growth and inflation was also conducted (see Figure 11). Economic Value Added (EVA) was tracked and forecasted(see Figure 12). As well, Return on Invested Capital (ROIC) was calculated (see Figure 13). Complete revenue tracking and p rojections areavailable in the accompanying spreadsheet.
In terms of tracking performance, it is worthy to note that Ahold went through a period of selling non-US / European stores in order to consolidateoperations into these two markets. As well, a ambitious US store refurbishment campaign was commenced in 2006 and concluded in 2008,dragging down revenues but establishing a foundation for future profitability. In the current economic downturn, 2009 will be a sensitive year asmargins will be slim given the general curtailment of consumer expenditures. As discussed previously, compared to high -end retailers such asWholefoods, Ahold should perform favorably. However, particularly in the native Dutch market Albert Hein still services a discretio nary, expensivemarket that will be challenged in 2009. Otherwise, the benefits of efficiency and scale can be seen in Ahold’s fin ancial performance.
Revenue by Store (broken by Ahold Group Company)
Figure 10: Revenue by store (broken by Ahold group company segment) and sales growth

Erasmus RSM MFM: Valuations (H. Haanappel)‘Valuations Case Study: Ahold’
Friday, May 01, 2009S. Mongeau
Page 13 of 27
A. Scenario Analysis - Ahold Store Growth Base Case
Figure 11A: Scenario analysis for store growth

Erasmus RSM MFM: Valuations (H. Haanappel)‘Valuations Case Study: Ahold’
Friday, May 01, 2009S. Mongeau
Page 14 of 27
B. Scenario Analysis – Ahold Management Guidance
Figure 11B: Scenario analysis – management guidance
C. Scenario Analysis - Ahold LBO / Buyout Scenario Analysis
Figure 11C: LBO / Buyout scenario analysis (with optimized exit value in 2010)

Erasmus RSM MFM: Valuations (H. Haanappel)‘Valuations Case Study: Ahold’
Friday, May 01, 2009S. Mongeau
Page 15 of 27
Economic Value Added
Figure 12: Economic value added – tracking and forecast

Erasmus RSM MFM: Valuations (H. Haanappel)‘Valuations Case Study: Ahold’
Friday, May 01, 2009S. Mongeau
Page 16 of 27
1
ROIC
21%
19%
21%
2006A 2007A 2008A
After-tax return on invested capital
5.90
5.49
5.78
2006A 2007A 2008A
Capital turnover (times)
4%4%
5%
2006A 2007A 2008A
Operating margin
93%
80% 77%
2006A 2007A 2008A
1-Tax rate
3% 3%2%
2006A 2007A 2008A
Depreciation/Rev
23%23%
22%
2006A 2007A 2008A
Operating exp/Rev
-4%-3%
-4%
2006A 2007A 2008A
WC/Rev
24%24%
24%
2006A 2007A 2008A
Net PPE/Rev
-3%-2% -2%
2006A 2007A 2008A
Other assets/Rev
70%
70%
71%
2006A 2007A 2008A
COGs/Rev
X
X
+
+
+
+
1 -
1 /

Erasmus RSM MFM: Valuations (H. Haanappel)‘Valuations Case Study: Ahold’
Friday, May 01, 2009S. Mongeau
Page 17 of 27
Figure 13: Return on Invested Capital (ROIC)

Erasmus RSM MFM: Valuations (H. Haanappel)‘Valuations Case Study: Ahold’
Friday, May 01, 2009S. Mongeau
Page 18 of 27
Finally, a historical stock performance analysis was performed using daily prices dating back to August of2007. From this, an annual volatility rating of 35% was derived.
Estimating AHOLD's stock Volatility Using Daily Data (source Yahoo.com/finance)
Number of days data 427
number of daily returns 426
Mean daily returns 0.0003
Daily Variance 0.000491
Daily standard deviation 0.022156
Volatility (annualized) 35%
Figure 14: Historical Ahold stock price volatility analysis
0
2
4
6
8
10
12
Erasmus RSM - MFM: Valuations Elective Valuations Paper: Ahold
Page 19 of 27
B. Company Strategy
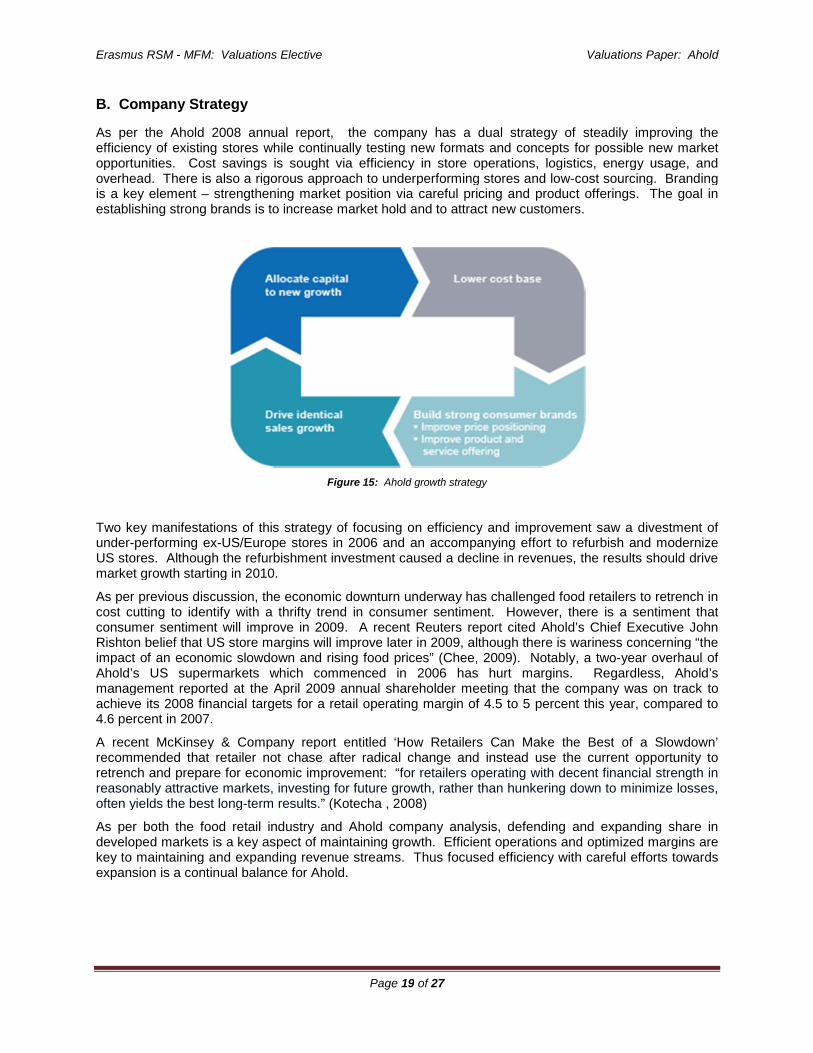
As per the Ahold 2008 annual report, the company has a dual strategy of steadily improving theefficiency of existing stores while continually testing new formats and concepts for possible new marketopportunities. Cost savings is sought via efficiency in store operations, logistics, energy usage, andoverhead. There is also a rigorous approach to underperforming stores and low-cost sourcing. Brandingis a key element – strengthening market position via careful pricing and product offerings. The goal inestablishing strong brands is to increase market hold and to attract new customers.
Figure 15: Ahold growth strategy
Two key manifestations of this strategy of focusing on efficiency and improvement saw a divestment ofunder-performing ex-US/Europe stores in 2006 and an accompanying effort to refurbish and modernizeUS stores. Although the refurbishment investment caused a decline in revenues, the results should drivemarket growth starting in 2010.
As per previous discussion, the economic downturn underway has challenged food retailers to retrench incost cutting to identify with a thrifty trend in consumer sentiment. However, there is a sentiment thatconsumer sentiment will improve in 2009. A recent Reuters report cited Ahold’s Chief Executive JohnRishton belief that US store margins will improve later in 2009, although there is wariness concerning “theimpact of an economic slowdown and rising food prices” (Chee, 2009). Notably, a two-year overhaul ofAhold’s US supermarkets which commenced in 2006 has hurt margins. Regardless, Ahold’smanagement reported at the April 2009 annual shareholder meeting that the company was on track toachieve its 2008 financial targets for a retail operating margin of 4.5 to 5 percent this year, compared to4.6 percent in 2007.
A recent McKinsey & Company report entitled ‘How Retailers Can Make the Best of a Slowdown’recommended that retailer not chase after radical change and instead use the current opportunity toretrench and prepare for economic improvement: “for retailers operating with decent financial strength inreasonably attractive markets, investing for future growth, rather than hunkering down to minimize losses,often yields the best long-term results.” (Kotecha , 2008)
As per both the food retail industry and Ahold company analysis, defending and expanding share indeveloped markets is a key aspect of maintaining growth. Efficient operations and optimized margins arekey to maintaining and expanding revenue streams. Thus focused efficiency with careful efforts towardsexpansion is a continual balance for Ahold.

Erasmus RSM - MFM: Valuations Elective Valuations Paper: Ahold
Page 20 of 27
IV. VALUATION ANALYSIS: STANDALONE, STRATEGIC BUYER, P/E VALUATION
A. Key Assumptions
Based on the groundwork set in the historical and company analysis as covered in section III, a valuationof the company was carried out. Following from Figures 11A – C, three valuation scenarios wereconducted: 1) standalone base case (DCF), 2) management guidance, and 3) LBO / buyout. As well, analternative valuation was conducted using peer trading multiples.
B. DCF Valuation
The aspects applied in the Discounted Cash Flow (DCF) valuation were as follows:
Forecast key value drivers Derive forecasted balance sheet, P&L & cash flows Determine cost of capital Calculate continuing value Estimate enterprise and equity value Derive WACC FCF forecasts Derive NPV Adjust for non-operating assets and liabilities Subtract debt to get to equity value
As input, for the base case scenario, an economic forecast (inflation and GDP) for each of the geographicareas with active Ahold stores was carried-out (source: Economic Intelligence Unit forecast). Thisincluded a forecast of new stores as well as revenue per store square meter per region and companygroup. SG&A and CAPEX were also broken-out and forecasted. The resulting data profile was used toproject revenues, operating income, and expenses. Key figure working capital balance sheet projectionswere derived from financials from 2006 – 2008, including AR, inventories, provisions, etc. Both tangibleand intangible fixed assets were projected from financials, as were shareholders equity, debt schedule,and other items. WACC was derived (see Figure 17 below). A detailed debt profile projection wascarried out for short and long-term debt. Financial statements (Income Statement, Balance Sheet, andCash Flow Statement) were tracked (2006 – 2008) and projected (2010 – 2019), resulting in an EconomicValue Added (EVA) picture as per Figure 12. Finally a DCF valuation picture resulted (see Figure 21)proposing a EUR 13 per share valuation. Finally, a peer multiples (trading multiples) valuation wasundertaken, as was an LBO valuation analysis. Full details for each of these steps is available in theaccompanying valuation spreadsheet.
WACC Analysis Details
As Ahold is financed both with debt and equity, theWeighted Average Cost of Capital (WACC) wascomputed to establish the firm discount rate (theminimum, value creating return on capital expectedby the combination of creditors and equity holders).Ahold WACC was calculated by weighting the costof debt and equity capital according to theirrespective market values as per the WACCformula.
Figure 16: WACC calculation using CAPM model

Erasmus RSM - MFM: Valuations Elective Valuations Paper: Ahold
Page 21 of 27
The following assumptions were applied to the Ahold CAPMWACC calculation, resulting in a WACC of 7%:
Risk free rate of 4.0% (the average of 3-month yield of a10-year government bond using the ECB rates) *
Market premium risk of 6 percent, an average fordeveloped countries during the current economic
downtown (5 - 6 % on average for developed countries, 6- 6.5% for the period of economic downturn) **
Beta of .54, calculated using Ahold’s 5-year historicalprices (monthly) and the MCCI – the World Index toestablish comparison to true market risk ~
Small firm premium of 0.3% is utilized as Ahold marketcapitalization is between US$5.3 and 12.4 million ***
Liquidity premium is 0% based on the similar trade volumeto common shares outstanding of the large marketcapitalization companies e.g. Royal Dutch Shell andUnilever
Marginal tax rate of 25.5% is the statutory tax rate in theNetherlands
Cost of debt is the average interest rate of Ahold in 2008
Risk free rate * 4%
Market risk premium ** 6%
Beta ~ 0.54
Small firm premium *** 0.30%
Liquidity premium **** 0%
Cost of equity 7.4%
Cost of debt 8%
Cost of preferred equity 0
Marginal tax rate 25.50%
D/V 0.28
E/V 0.72
Preferred equity/ V 0
WACC 7.00%
Figure 17: WACC calculation
~ Beta Calculation Detail5 years monthly prices compared to MSCI World Index covariance 0.0008
variance 0.0015
Beta 0.54Figure 18: Beta calculation
Figure 19: WACC Terminal Growth Calculation
Figure 20: DCF Valuation (NOPLAT / FCF method)

Erasmus RSM - MFM: Valuations Elective Valuations Paper: Ahold
Page 22 of 27
Figure 21: P/E Valuations and Band
Figure 22: P/BV Valuations and Band

Erasmus RSM - MFM: Valuations Elective Valuations Paper: Ahold
Page 23 of 27
C. Alternative Valuations and Analysis
A trading multiples valuation (based on current market capitalization) was conducted utilizing a basket offood retail sector competitors / peer group members: Carrefour, Delhaize, Metro AG, Kroger Co., SafewayInc., Super de Boer, Wal Mart Stores Inc., Tesco PLC, and Supervalu Inc. Key figures for a basket ofnine peers resulted in a synthesized average enterprise value as a multiple of sales, EBITDA, and EBIT.The peer group averages were then used to derive an equity valuation for Ahold. Of note, the transactionmultiples method gives a lower valuation that that of a trading multiple calculation, which is from theperspective of an M&A pricing and thus includes a goodwill premium.
* Note: Super De Boer calculated from annual report2008; Wal Mart from fiscal year 2009
Figure 23: Ahold peer group trading figures

Erasmus RSM - MFM: Valuations Elective Valuations Paper: Ahold
Page 24 of 27
Ahold Peer Group Trading Averages Ahold Trading Multiples Valuation
Figure 24: Ahold Peer Group Trading Averages and Multiples Valuation
D. LBO / Buyout Analysis
Finally, an LBO (Leveraged Buyout) valuation was conducted. Ahold might be a hypothetical target forlarge competitors such as Wal Mart: it has cash in hand, experienced management, and a strong,geographically diversified market share within the food retail sector. As per Figure 25, a DCF valuationwas conducted, arriving at an equity value of EUR 11 per share (from the perspective of a leveragedbuyer). Also, the debt-financed buyout projections resulted in IRR forecasts showing a peak IRR of 14%in 2010 (thus recommended exit timeframe).
Figure 25: LBO DCF Valuation – note value per share of 11

Erasmus RSM - MFM: Valuations Elective Valuations Paper: Ahold
Page 25 of 27
Figure 26: IRR reaches height in 2010
E. Valuation Results Analysis
From DCF Valuation perspective (see Figure 20), at 0% terminal growth based on our base casescenario*, AHOLD target price ranges from EUR 9.4 to 13.2 per share (up to 60% upside potential at thecompany WACC at 7%**). The LBO analysis supported this, targeted EUR 11 per share (though this isfrom the perspective of a debt financed buyer, not an equity investor).
The resulting Ahold equity investor recommendation is ‘buy’ based on the weighted average fair valuebetween DCF and EV/EBITDA valuations (50%:50%). A 2009 target price of EUR 12.1 was arrived at,which provides 47% upside potential at the current price of EUR 8.24. Currently, Ahold is trading at thelowest P/E ratio of the past 3 years (forwarded PER 9.35x) and P/BV ratio at 1.76x (see Figures 21 and22).
* 0% terminal growth rate was chosen as a conservative assumption. The DCF valuation shown in Figure20 has a EUR 13 target price at 7% WACC and 0% terminal growth.
** If an individual indestor considers a 7% WACC too low, a higher scenario can be inputted in theaccompanying spreadsheet to achieve a higher recommended equity share target price.

Erasmus RSM - MFM: Valuations Elective Valuations Paper: Ahold
Page 26 of 27
V. OVERALL CONCLUSION AND RECOMMENDATIONS
A. Concluding Remarks
The results of the Ahold valuation analysis is a positive ‘buy/hold’ rating on the stock and an overallpositive assessment of firm strength and value. The analysis carried-out I backed by conclusionsreached by independent industry analysts. It is felt that the valuation carried-out is in line with industrydynamics and the competitive position of Ahold compared to a basket of peers. In particular, although thecurrent economic decline is challenging retailing broadly, Ahold is weathering the downturn reasonablywell and is well positioned to maneuver when the economy begins to recover later in 2009 (as projectedby analysts and economists).
The business implications of the valuation analysis is that Ahold will need to position itself to takeadvantage of a rapid shift to consumer cost-consciousness. However, the Ahold group stores should notradically overhaul operations or over-invest in change in a panic. This would challenge the cash flowsand likely would be an over-reaction as many industry analysts anticipate a recovery later in 2009.
Late 2008 and the first half of 2009 are thus proposed as an unusual perturbation in equity valuation andconsumer activity. Ahold will need to react, but should not over-react by over investment nor radicallychanging course given its stated business strategy (as per Figure 15). Indeed, Ahold’s existing strategyfocuses on efficiency and adapting to changing circumstances, so the company would be well-served tofollow its existing strategic protocols.
In summary, the valuation analysis conducted revealed the following elements of strength to recommendAhold:
- Strong brand in local: Albert Heijn including Etos, Gall & Gall- Repositioning / refurbishment investment program for Stop & Shop and Giant-Landover (started
Sept 2006 – mid 2008): sales and margins have improved as a result and are projected tocontinue to improve through 2010
- Cost saving and improving margin trend- Good position and financial performance among peers in the grocery sector- Valuation upside
As per the DCF / valuation conclusion, the current signal is ‘buy’ ( based on the weighted average fairvalue between DCF and EV/EBITDA valuations). A 2009 target price of EUR 12.1 was arrived at, whichprovides 47% upside potential at the current price of EUR 8.24.
As per the industry analysis in Section 2, the main caveat is that the current economic downturn mightprove to be more severe. It is possible that a vicious cycle of consumer curtailment, deflation, andsupplier price pressures will come to bear to challenge revenue streams for an extended period of time.Even if, as projected, retailing picks up later in 2009, it is possible that a new, longer term consumer trendis shaping: discount ‘price sensitive’ consumerism. This will propose a challenge to retailers as they aresqueezed between deep discounting competitors and losses on premium products. As observed in arecent Economist article: “it appears that some shoppers are embracing austerity not just out of necessitybut also as somewhat of a fashion. Ostentatious parsimony is the new conspicuous consumption.”(Economist Staff, 2009)

Erasmus RSM - MFM: Valuations Elective Valuations Paper: Ahold
Page 27 of 27
IX. REFERENCES
Chee, Foo Yun. (2008) UPDATE 2-Ahold sees U.S. stores picking up in H2, Reuters (www.reuters.com),April 23, 2009.
Drake, Isobel. (2008) Cafes and restaurants hit hardest by downturn, supermarkets benefit, AFN Online(www.ausfoodnews.com.au), November 17, 2008.
Economist Staff. (2009) Austerity Chic, The Economist, May 2 – 8, 2009, pp 16.
Kotecha, Ashish A. , Leibowitz, J. and MacKenzie, I. (2008) How Retailers Can Make the Best of aSlowdown, The McKinsey Quarterly, September 2008.
McRoskey, R. (2008) Whole Foods’ Big Markdown, Business Week, August 5, 2008.
Progressive Grocer Staff. (2009) Two Major Trends in Retail Emerge, Progressive Grocer(www.progressivegrocer.com), Feb 8, 2009.