value-add winn dixie retail center - turnvest cre marketing
TRANSCRIPT
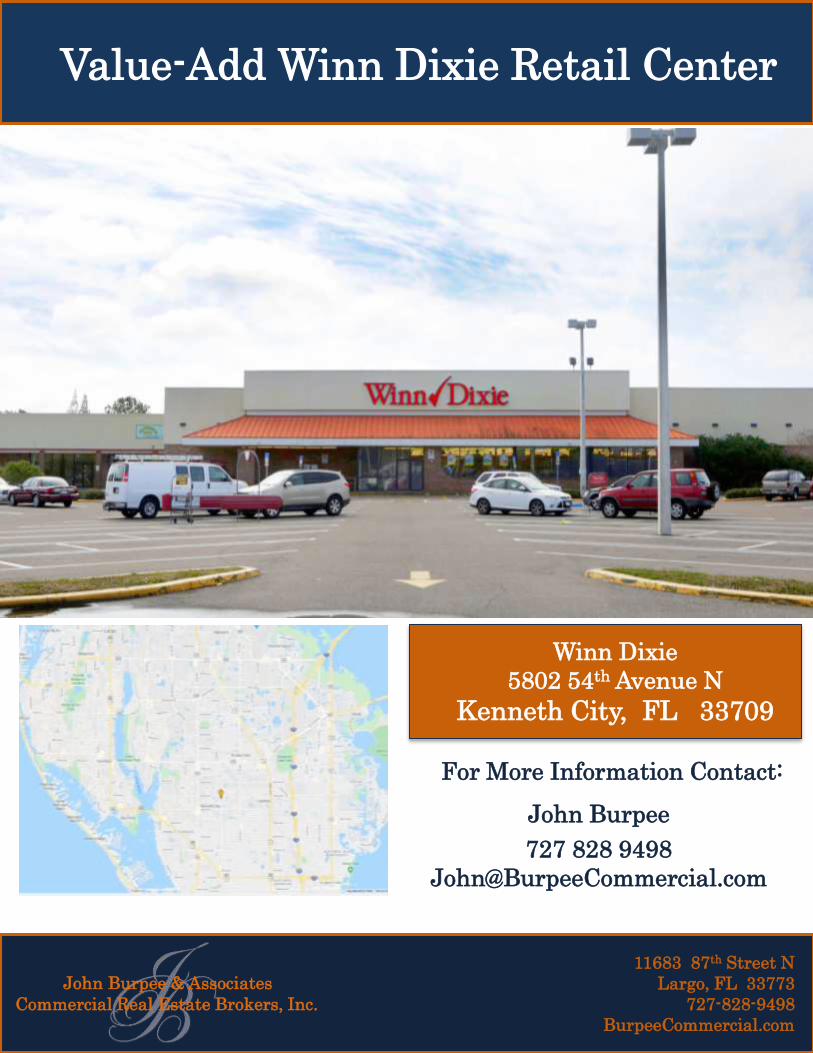
Winn Dixie
5802 54th Avenue N
Kenneth City, FL 33709
For More Information Contact:
John Burpee
727 828 9498
John Burpee & Associates
Commercial Real Estate Brokers, Inc.
11683 87th Street N
Largo, FL 33773
727-828-9498
BurpeeCommercial.com
Value-Add Winn Dixie Retail Center

Confidentiality Agreement and Disclaimer
This will serve as notice regarding the use of
certain material, data and information
contained herein (“Evaluation Material”)
which we have made available to you in
connection with a possible purchase of the
property by you or your client. As a
prerequisite to your accepting and utilizing the
Evaluation Material, you hereby represent and
agree as follows:
The Evaluation Material furnished by us will
be used solely for evaluating a possible
transaction exclusively for your own account,
as principal in the transaction, and not as a
broker or agent for any other person.
Therefore, you agree to keep all Evaluation
Material strictly confidential; provided
however, that any of such Evaluation Material
may be disclosed to your directors, officers or
employees as well as your counsel, accounting
firms and financial institution who need to
know such information of the purpose of
assisting you with your possible purchase of
the Property. Such directors, officers
employees, lawyers, financial institutions and
accountants shall be informed by you of the
confidential nature of such information and
shall be directed by you to treat such
information with strict confidence.
Although we have endeavored to include in the
Evaluation Material, information which we
believe to be accurate and relevant for the
purpose of helping you in your evaluation of
the Property for possible purchase, you
understand and acknowledge that neither the
Owner of the Property nor John Burpee &
Associates (“Agent”) make any representation
or warranty as to the accuracy or completeness
of the Evaluation Material except as set forth
in a definitive agreement. You agree that
neither the Owner nor the Agent shall have
any liability to you as a result of your use of
the Evaluation Material except as set forth in a
definitive agreement and it is understood that
you are expected to perform such due diligence
investigations and inspections of the Property
as you deem necessary or desirable and as
permitted by agreement with the Owner of the
property.
You also represent that no broker or agent
represents you or will represent you in any
possible transactions involving the Property
unless you disclose it in writing to John
Burpee & Associates prior to the receipt of the
Evaluation Material and you fully agree to
compensate your broker or agent. Neither
Agent nor the Owner is responsible for any
compensation to be paid to your broker or
agent whatsoever.
Table of
Contents
Section 1.
Section 2.
Section 3.
Section 4.
Section 5.
Section 6.
Section 7.
Section 8.
Executive Summary
Property Details
• Property Info
• Taxes
• Tenant Info
• Lease
Proforma
Location Overview
Property Photos
Sales Comps
• Sales Volume
• Sales Pricing
• Peer Comparison
Vacancy Rates
Demographics
• Summary
• Traffic Counts
• Growth Trends
• Market Summary

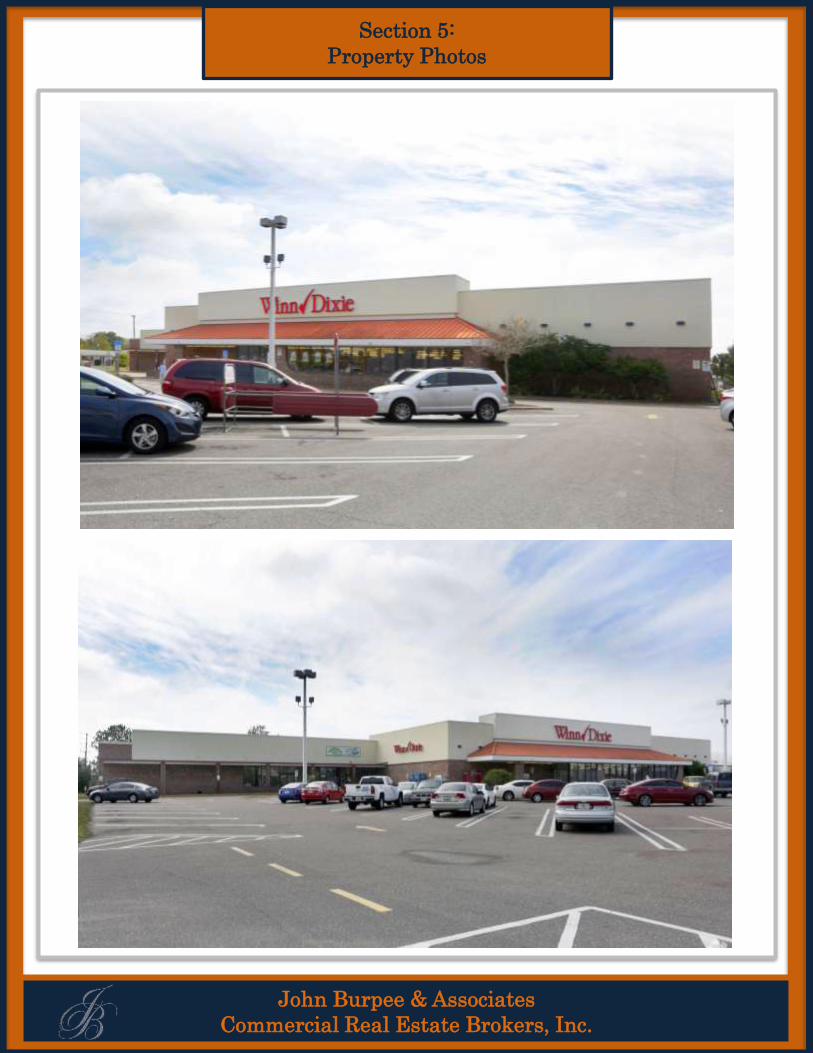
John Burpee & Associates is proud to present the 49,686 Net
rentable SqFt Winn Dixie Plaza Located in Kenneth City, Fl
(St. Petersburg Pinellas County Tampa Bay MSA). The property
has been continuously occupied by Winn Dixie since 1964 and is
one of their better performing properties in the Tampa Bay MSA.
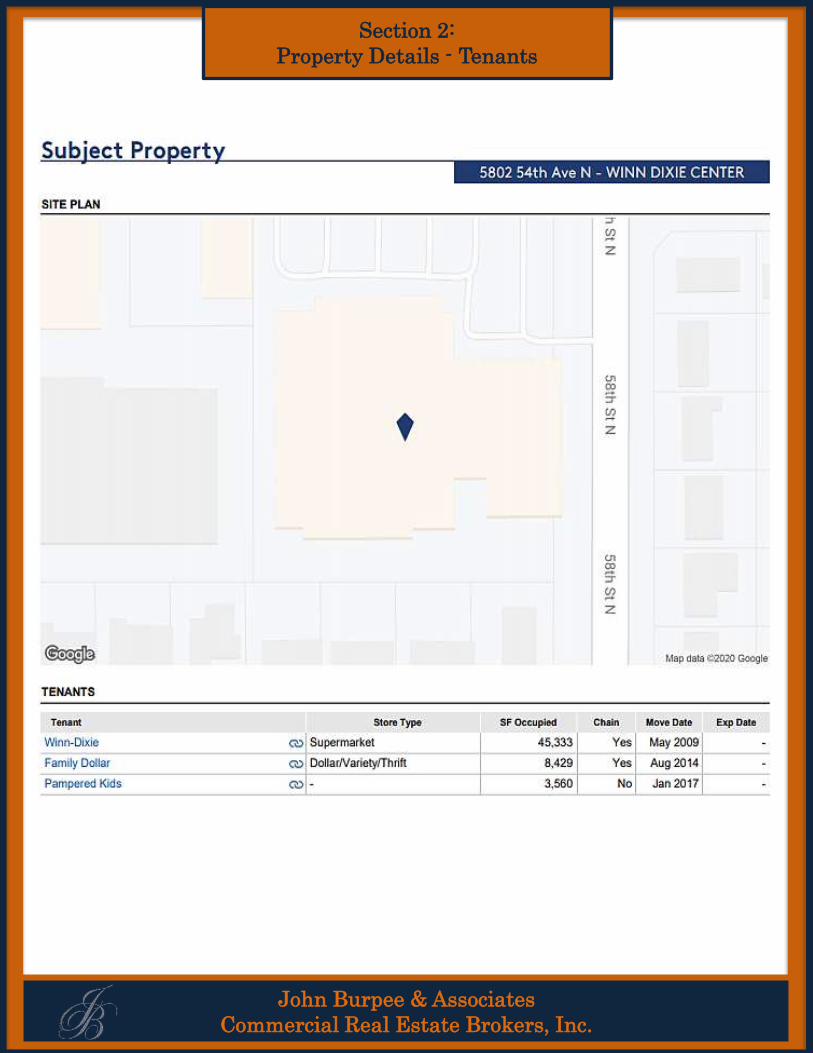
Winn Dixie currently occupies 36,097 SqFt feet (72.59%) with
the current lease expiring November 2023.
There is an additional 13,589 SqFt of local tenant mini box space
that is currently vacant for value-add opportunity to a new owner.
Rents in the market should generate $15 PSF NNN for the
current vacant space with minor T/I expense for new tenancy.
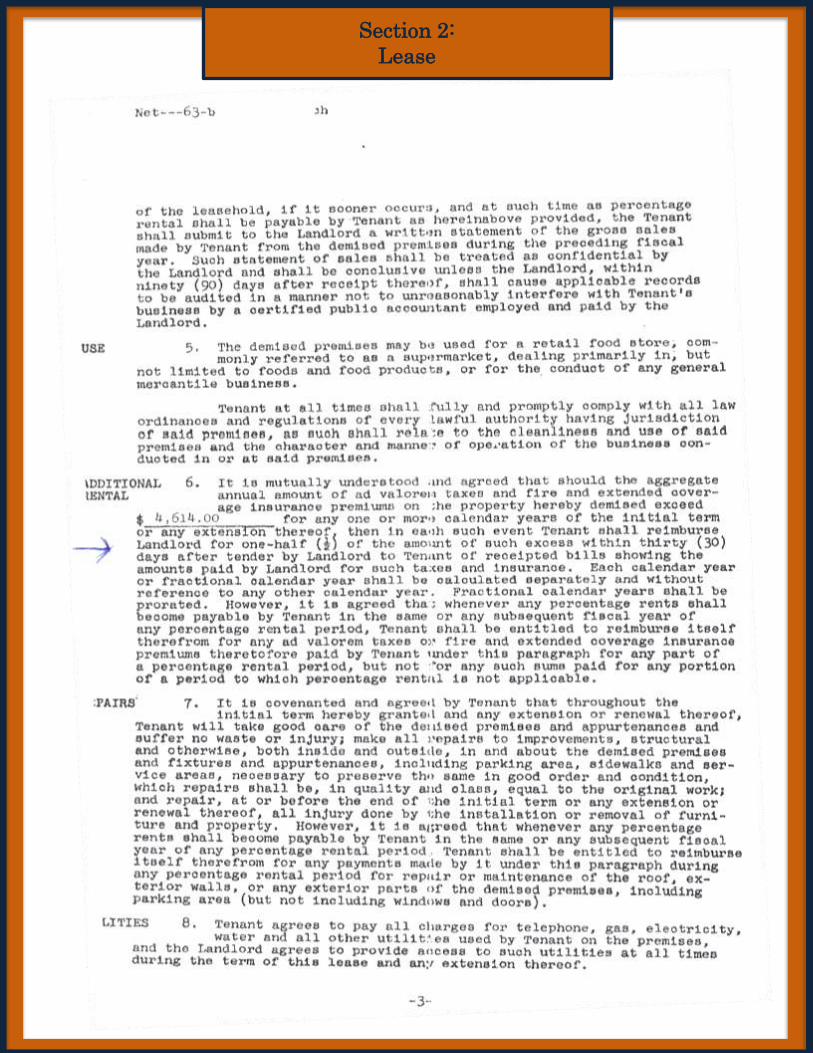
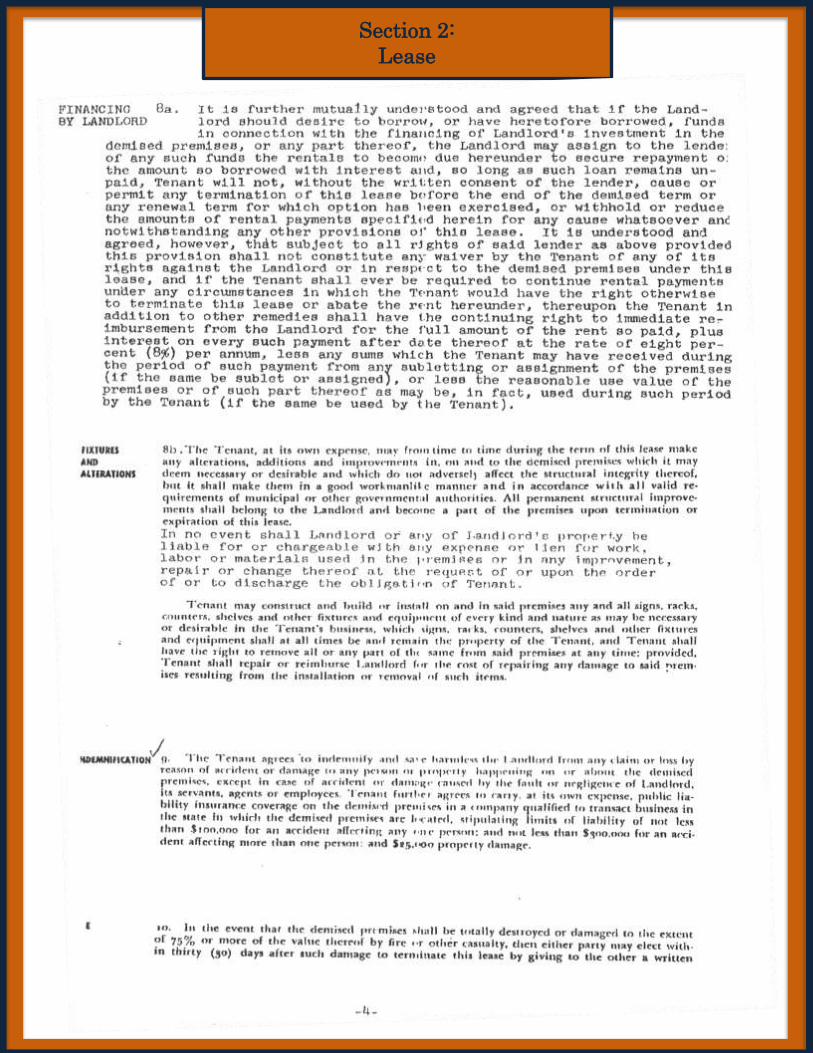
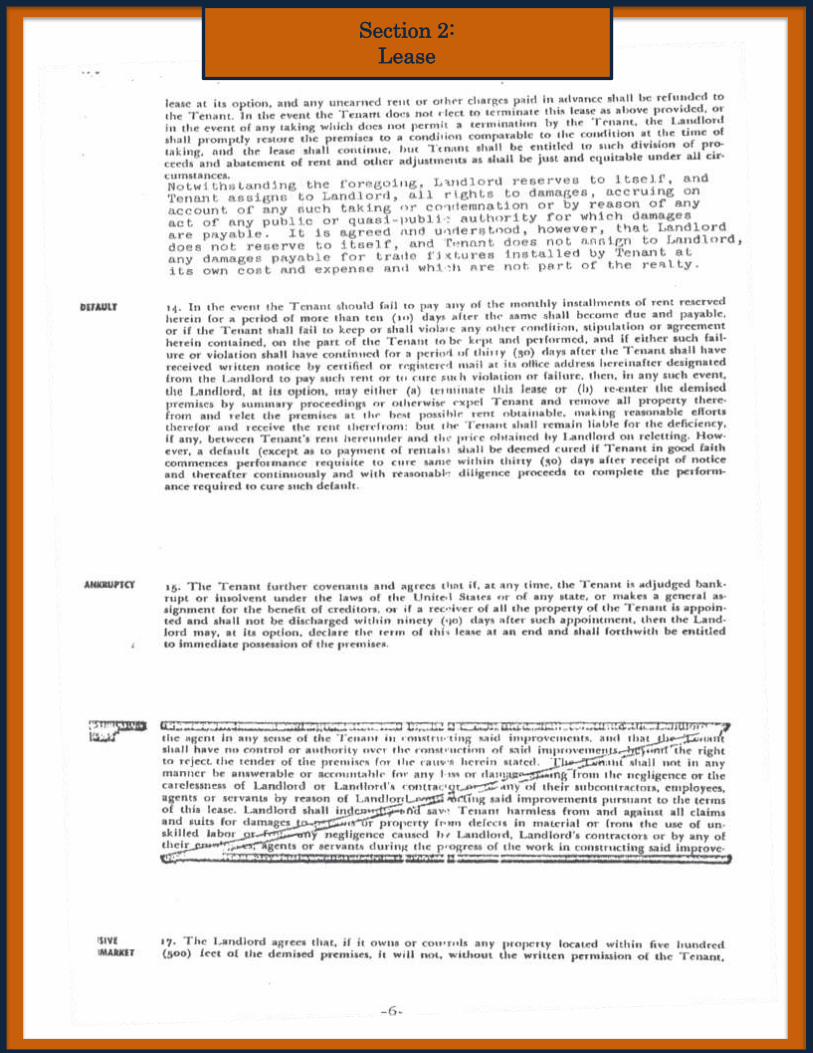
Please see copies of the current Winn Dixie Lease on Page 7 of
section 2 of this O/M.
John Burpee & Associates
Commercial Real Estate Brokers, Inc.
Section 1:
Executive Summary
Call John Burpee at 727-828-9498
for details and questions.
$3,600,000 / $69.28 / SqFt
7.5% ProForma CAP
on a “As-IS” Sale

II. PROPERTY DETAILS
John Burpee & Associates
Commercial Real Estate Brokers, Inc.
Section 2:
Property Details
Type: 2 Star Retail Storefront
Stories: 1 Year Built: 1963
Avg. Unit Size: 772 Year Renovated: 2014
Stories: 1 Ceiling Height: 24’6”
GLA: 51,964 SF Construction: Masonry
Docs: 1 Ext Building Depth: 120’
Parking 232 Surface Spaces / 4.66 per/1,000 SF
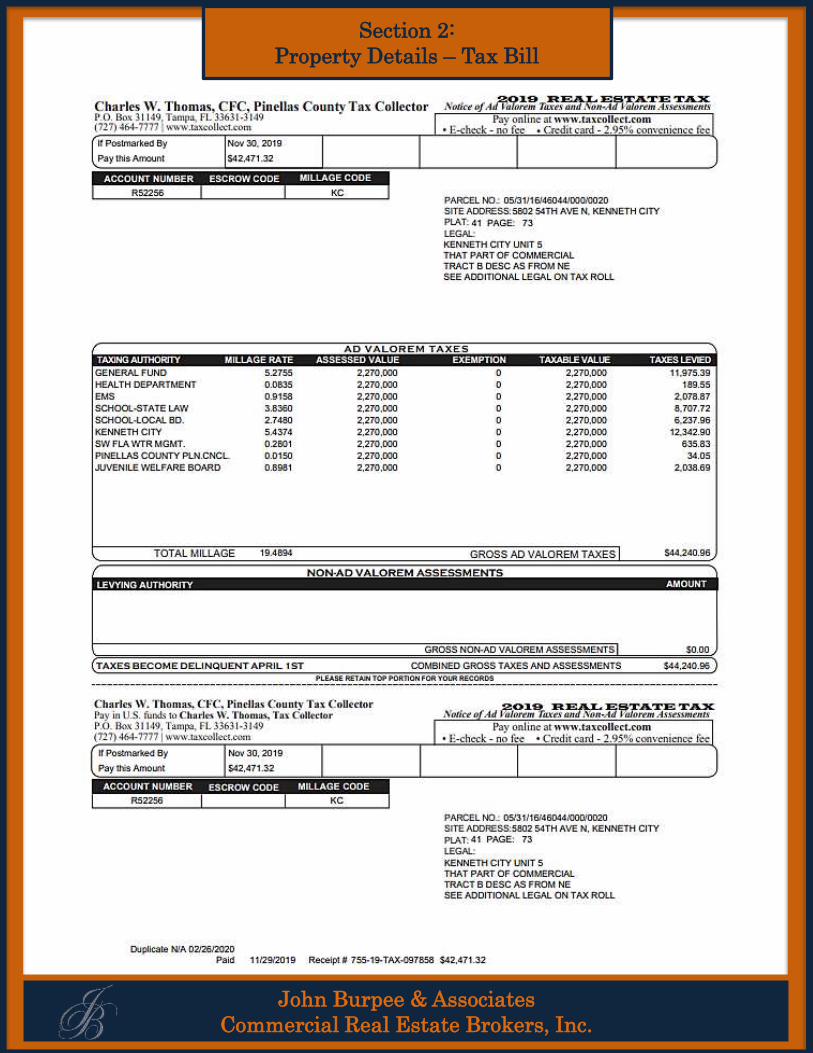
2018 Taxes: $.95/SF
Parcel ID: 05-31-16-46044-000-0020
Land Acres: 3.75 AC Land SF: 163,350 SF
Dimensions: 383’ x 683’ Building FAR 0.32
Building
Land
Amenities
Air Conditioning
II. PROPERTY DETAILS
John Burpee & Associates
Commercial Real Estate Brokers, Inc.
Section 2:
Property Details – Tax Bill
II. PROPERTY DETAILS
John Burpee & Associates
Commercial Real Estate Brokers, Inc.
Section 2:
Property Details - Tenants
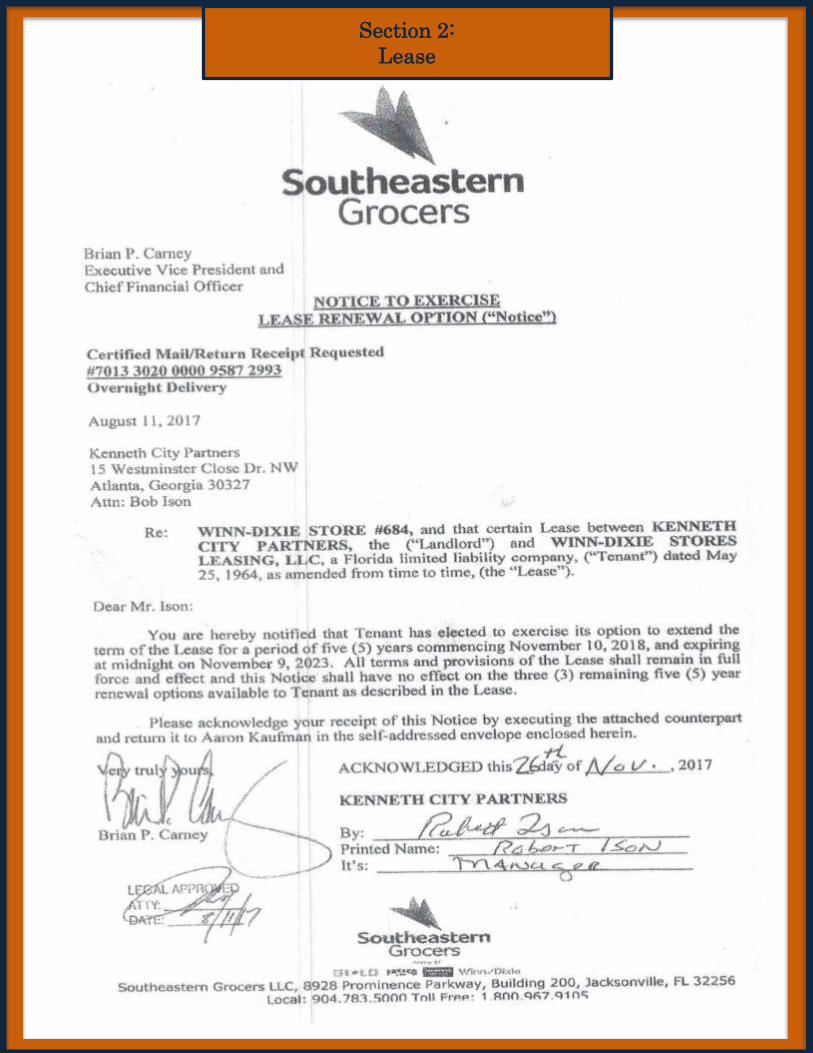
II. PROPERTY DETAILSSection 2:
Lease
II. PROPERTY DETAILSSection 2:
Lease

II. PROPERTY DETAILSSection 2:
Lease

II. PROPERTY DETAILSSection 2:
Lease
II. PROPERTY DETAILSSection 2:
Lease
II. PROPERTY DETAILSSection 2:
Lease

II. PROPERTY DETAILSSection 2:
Lease
II. PROPERTY DETAILSSection 2:
Lease

II. PROPERTY DETAILSSection 2:
Lease

II. PROPERTY DETAILSSection 2:
Lease
II. PROPERTY DETAILSSection 2:
Lease

II. PROPERTY DETAILSSection 2:
Lease

II. PROPERTY DETAILSSection 2:
Lease

II. PROPERTY DETAILSSection 2:
Lease

II. PROPERTY DETAILSSection 2:
Lease

II. PROPERTY DETAILSSection 2:
Lease
II. PROPERTY DETAILSSection 2:
Lease

II. PROPERTY DETAILSSection 2:
Lease
II. PROPERTY DETAILSSection 3:
Proforma
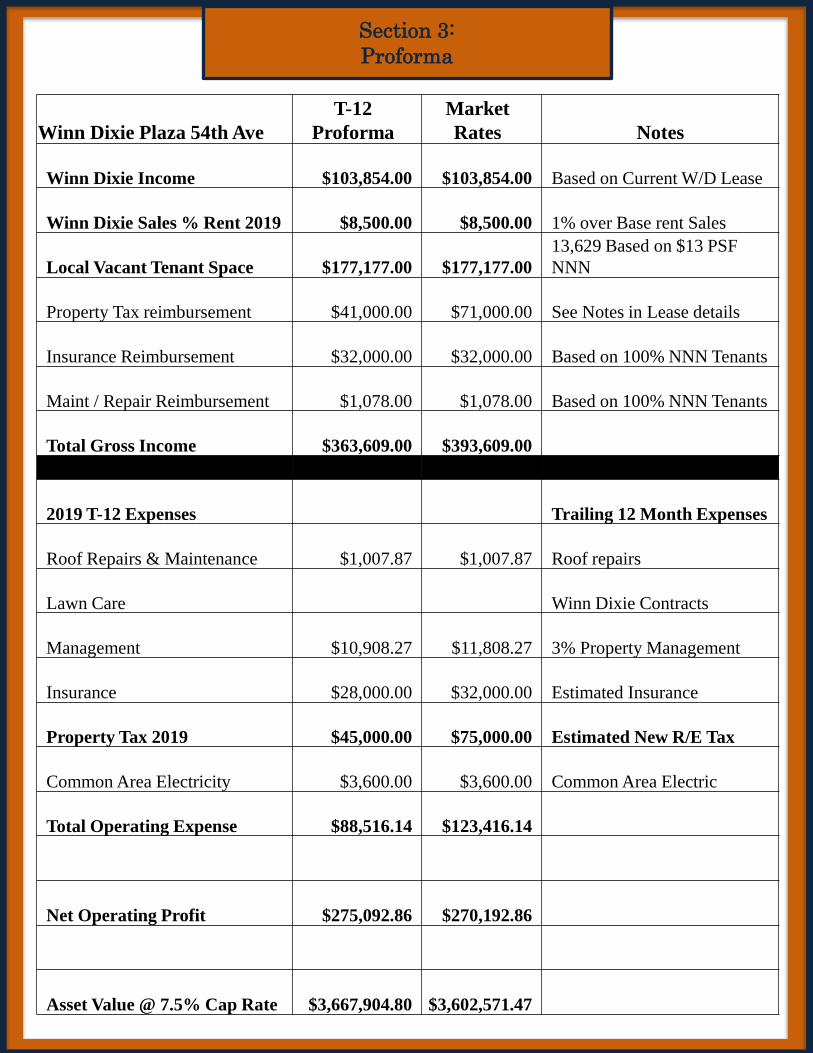
Winn Dixie Plaza 54th Ave
T-12
Proforma
Market
Rates Notes
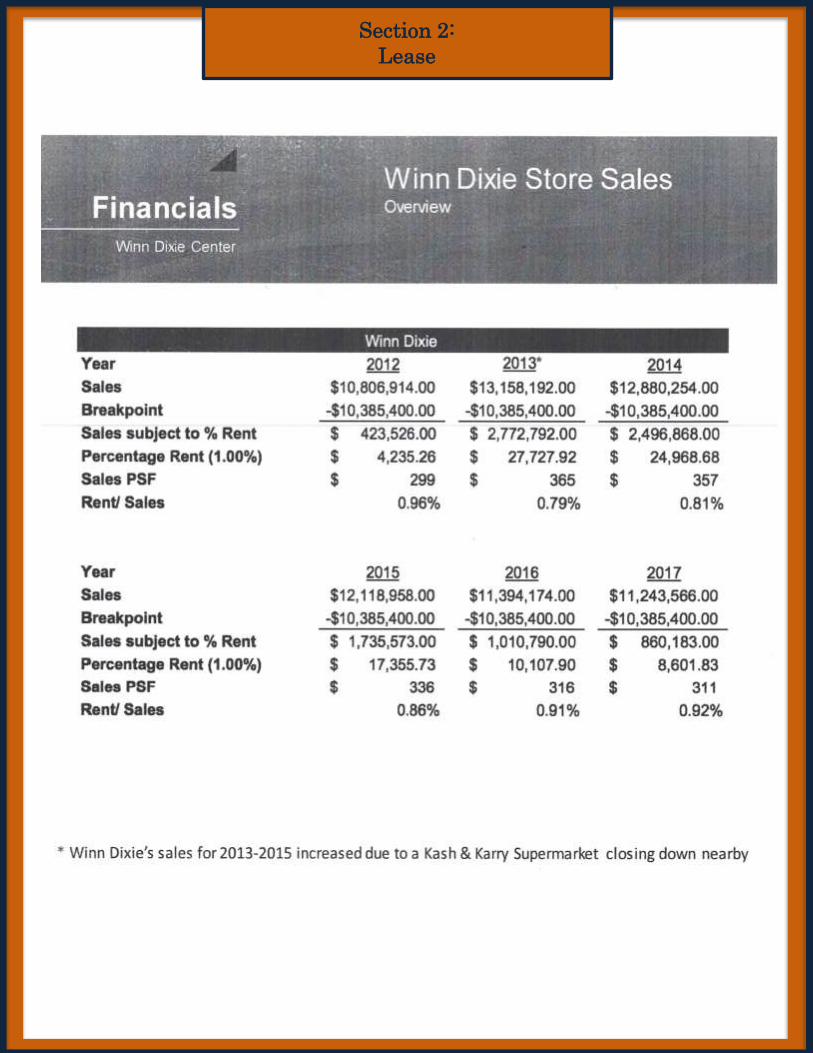
Winn Dixie Income $103,854.00 $103,854.00 Based on Current W/D Lease
Winn Dixie Sales % Rent 2019 $8,500.00 $8,500.00 1% over Base rent Sales
Local Vacant Tenant Space $177,177.00 $177,177.00
13,629 Based on $13 PSF
NNN
Property Tax reimbursement $41,000.00 $71,000.00 See Notes in Lease details
Insurance Reimbursement $32,000.00 $32,000.00 Based on 100% NNN Tenants
Maint / Repair Reimbursement $1,078.00 $1,078.00 Based on 100% NNN Tenants
Total Gross Income $363,609.00 $393,609.00
2019 T-12 Expenses Trailing 12 Month Expenses
Roof Repairs & Maintenance $1,007.87 $1,007.87 Roof repairs
Lawn Care Winn Dixie Contracts
Management $10,908.27 $11,808.27 3% Property Management
Insurance $28,000.00 $32,000.00 Estimated Insurance
Property Tax 2019 $45,000.00 $75,000.00 Estimated New R/E Tax
Common Area Electricity $3,600.00 $3,600.00 Common Area Electric
Total Operating Expense $88,516.14 $123,416.14
Net Operating Profit $275,092.86 $270,192.86
Asset Value @ 7.5% Cap Rate $3,667,904.80 $3,602,571.47

John Burpee & Associates
Commercial Real Estate Brokers, Inc.
Section 4:
Location Overview

John Burpee & Associates
Commercial Real Estate Brokers, Inc.
Section 4:
Location Overview
John Burpee & Associates
Commercial Real Estate Brokers, Inc.
Section 5:
Property Photos

John Burpee & Associates
Commercial Real Estate Brokers, Inc.
Section 6:
Sales Comps

John Burpee & Associates
Commercial Real Estate Brokers, Inc.
Section 6:
Sales Comps – Sales Volume
John Burpee & Associates
Commercial Real Estate Brokers, Inc.
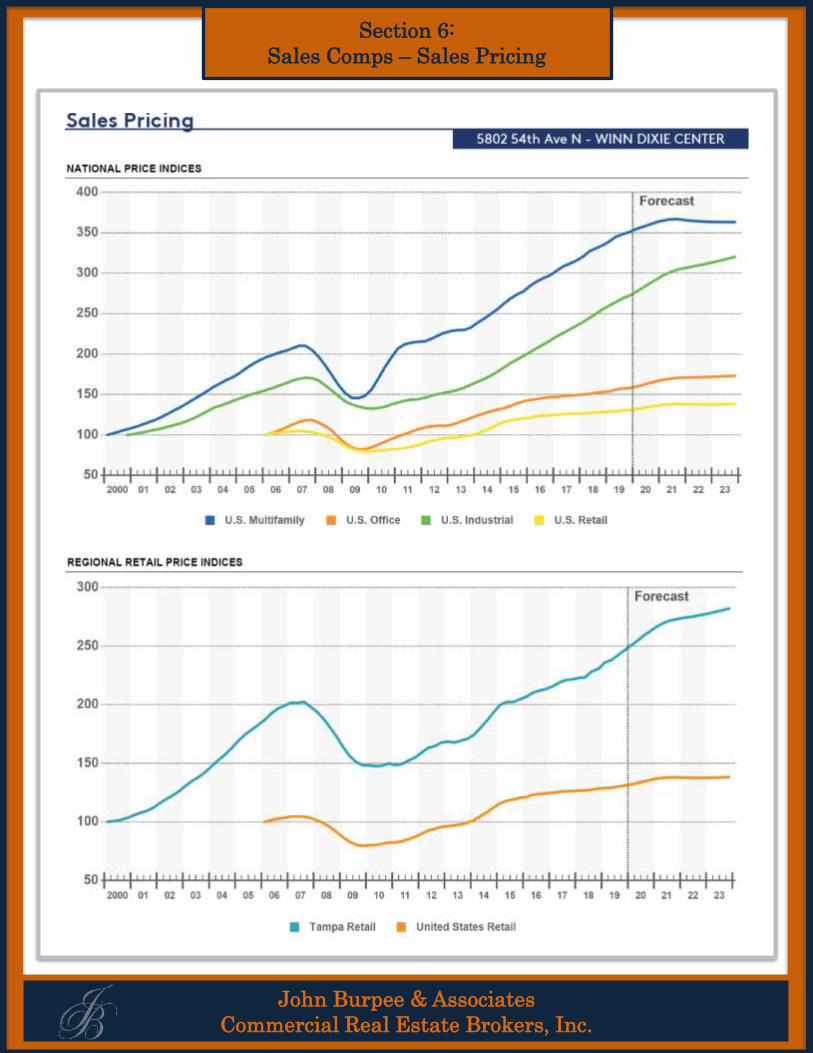
Section 6:
Sales Comps – Sales Pricing
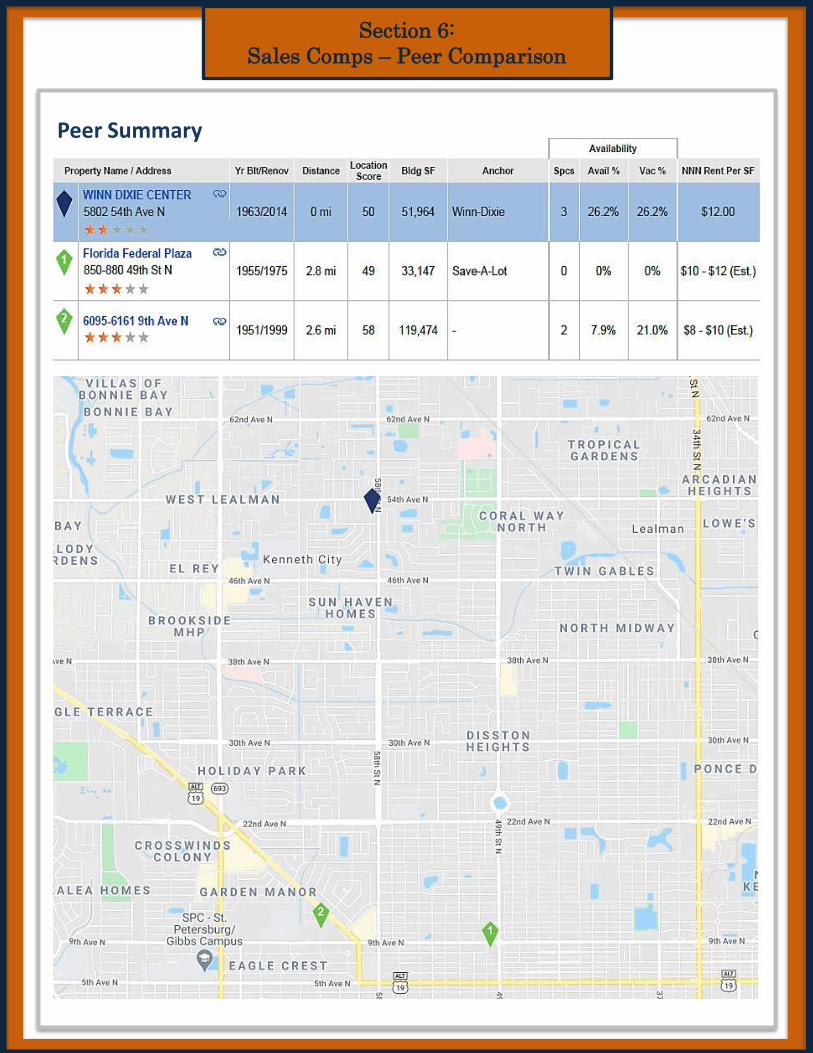
II. PROPERTY DETAILSSection 6:
Sales Comps – Peer Comparison
Peer Summary

II. PROPERTY DETAILSSection 6:
Sales Comps – Peer Comparison

II. PROPERTY DETAILS
Fueled by robust population growth, elevated job growth, and record-setting tourism, Tampa's retail demand
over the past five years has been consistently strong. The market reached an all-time low vacancy rate in 2019,
though Tampa has effectively stayed in equilibrium for the past three years. Given the expectation for Tampa to
maintain job and population growth rates well above the national average and a muted pipeline, the market
appears unlikely to experience severe negative absorption shocks over the near term.
Mirroring national trends, Tampa has seen an increase in recent retail store closures. While this has impacted
available inventory levels, particularly in big-box retail sites, Tampa has managed to backfill these vacancies
more quickly than much of the nation. Spaces are often only on the market for a few months, such as when RH
Outlet took down the former Babies R Us space in the Drew 19 Shopping Center in Clearwater.
The metro has also benefited from a large influx of grocers expanding their Tampa presence over recent years,
including new entries like Sprouts and EarthFare. Adaptive-reuse strategies have experienced increasing
success with other sectors, such as converting to help satiate the region's robust medical office demand.
Retail in Tampa draws heavily from the vibrant tourism industry, with both Hillsborough and Pinellas among
only nine counties in Florida to achieve "high-impact" tourism status. The record-setting visitor counts
continue to drive retail spending, particularly in the core CBD areas and along the metro's famous beaches.
Strategic Property Partners recently began the initial phase of its $3 billion Water Street Tampa development.
The project is expected to add approximately 1 million SF of retail space by 2027 and drive personal
consumption and retail demand. The primary retail component is a redeveloped area along the waterway
known as Sparkman Wharf. The concept plans to avoid national chains, as evident from allowing Hooter's to
vacate their location after 15 years. Instead, the focus will be on local chefs and dining experiences to promote
a walkable environment.
Section 7:
Vacancy Rates

II. PROPERTY DETAILSSection 7:
Vacancy Rates Overview
Tampa is one of the strongest retail rent growth markets in the nation and has remained so for roughly the past
six years. Annual gains have shown few signs of slowing, with the market establishing a record growth rate in
2019. Though there has been some relative cooling since then, the current growth rate is still over three times
the national average and well above the long-term trend.
Despite a relative uptick in recent deliveries and current construction, the metro has seen little impact on rent
growth. The moderate supply and expected continued strong demand levels should insulate rent growth from
significant downward pressure. Furthermore, retail starts slowed in 2019, though the proposed pipeline remains
active.
Rent growth throughout the entire metro is elevated, with even the outlying submarkets such as Pasco County,
Southeast Hillsborough County, and Hernando County seeing growth well above their historical averages.
Even the lowest retail rent growth submarket is also drastically outperforming the national average. Westshore,
home to some of Tampa's premier shopping districts, maintains the highest asking rents in the metro. The other
top rent growth submarkets include perennial performers such as Downtown Tampa and Downtown
St. Petersburg.
John Burpee & Associates
Commercial Real Estate Brokers, Inc.
Section 6:
Demographics
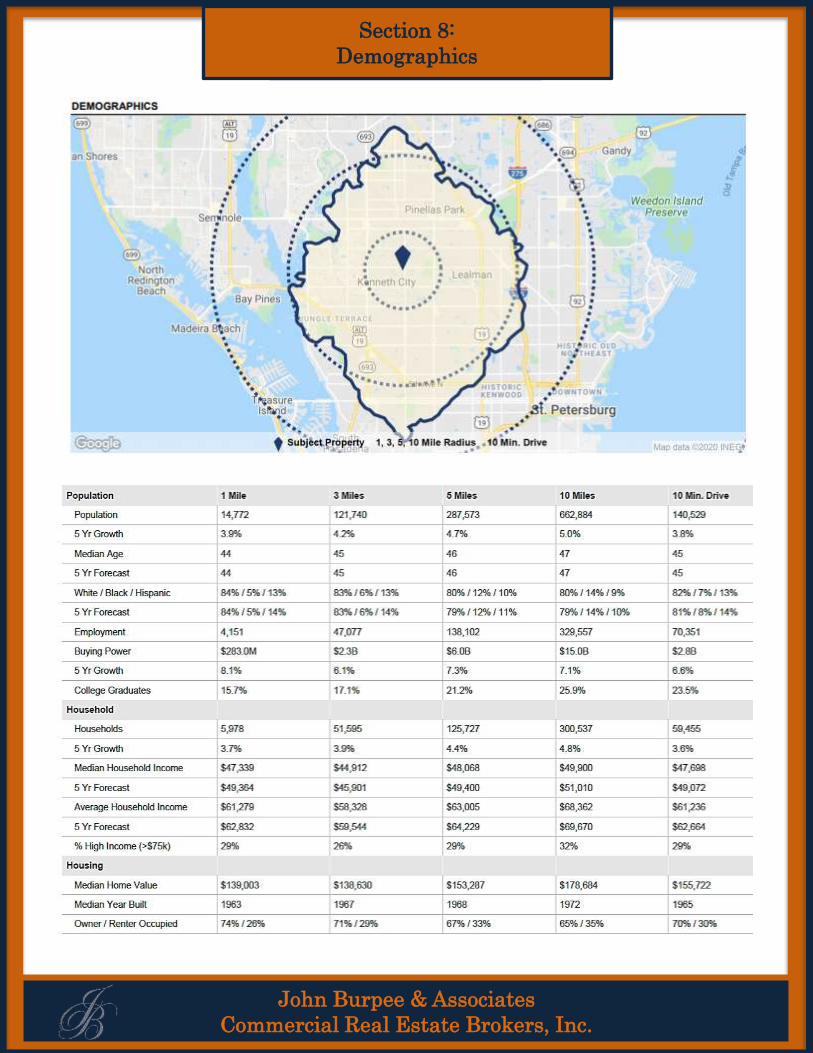
Section 8:
Demographics
II. PROPERTY DETAILS
John Burpee & Associates
Commercial Real Estate Brokers, Inc.
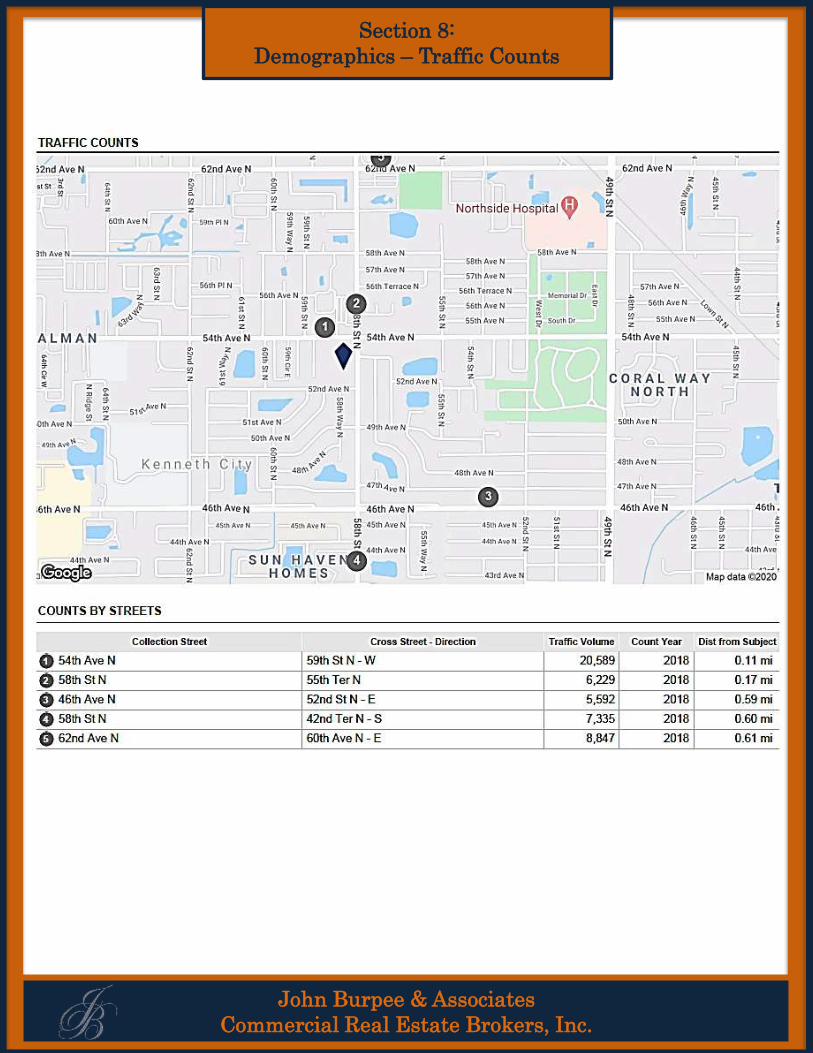
Section 8:
Demographics – Traffic Counts

II. PROPERTY DETAILSSection 8:
Demographics – Growth Trends

II. PROPERTY DETAILS
Tampa's retail market is flourishing, thanks to elevated personal consumption from the metro's robust
population and wage growth, as well as significant lift provided by vibrant tourism. After outperforming the
nation for the past five years with both tighter vacancies and stronger rent growth, the market continues to see
both metrics improve. In 2019, both the average vacancy rate and annual rent growth established record levels.
While Tampa’s retail trade employment has been one of the highest growth sectors over the past two years,
with over 5% job growth, retail trade has slowed substantially and even shed over 1,000 jobs over the past
twelve months. This may be having a lagged impact on net absorption which has started to gradually taper off,
though this could as easily be a function of a market at full occupancy with vacancies sitting near record lows.
Retail starts have slowed since the start of 2019, with only a little over 600,000 SF underway in 2020, the
lowest amount in seven years. This has also pushed Tampa's retail pipeline below the pace of the nation as
measured by percent of existing inventory. The Channel District of the Downtown Tampa Submarket is a
particular hotbed of activity, with multiple apartment complexes recently delivered and underway, spurring
retail demand such as the submarket's first Publix location, organic grocer GreenWise, and a CVS lease
signing.
Redevelopment plays of big-box vacancies have also taken center stage in 2020. The former Sears location at
University Mall is being demolished for future development and the vacant Sears at Citrus Park recently sold
with the new Miami owner planning significant renovations.
One key component of Water Street Tampa is the ongoing transitioning of Channelside Bay Plaza into the new
concept Sparkman Wharf. The redeveloped plaza, along the fringes of Downtown Tampa, caters to a
destination retail environment through features such as a biergarten and a dining garden by Tampa-based chefs
in repurposed shipping containers.
Investment activity has remained elevated and relatively consistent for the past seven years, though sales
volume slightly slowed in 2019 from the prior year's cyclic-high. However, cap rates have continued to gently
compress, and pricing is at an all-time high.
Section 8
Demographics – Market Summary

II. PROPERTY DETAILS
Tampa’s strong economic expansion continues to roll in 2020, once again among the nation’s leaders for job and
population growth rates. The sustained, long-term job growth has tightened Tampa’s labor market to one of the best in
the U.S., which has ultimately driven up wages and incomes across the metro. Over the past two years, Tampa has
posted some of the higher income growth in the country, increasing the market’s buying power and personal
consumption, which has provided ample fuel for both strong retail and industrial demand. The market has some
challenges, including a below-average median
income level, a nearly complete reliance this cycle upon in-migration, and some of the nation’s worst infrastructure
and public transit options.
Job growth is the market’s biggest success story and has been for nearly a decade, outperforming the nation for 35
consecutive quarters. During this timeframe, Tampa has averaged a 2.5% annual growth rate, nearly twice the U.S.
average. Job growth has steadily cooled over the past four quarters, as the market is nearing full employment.
Tampa’s unemployment rate has compressed significantly over recent years and is now below the U.S. unemployment
rate, with the spread in 19Q2 growing to over 50 basis points. The slowing pace of jobs added to the market is likely to
continue over the next few quarters, though Tampa is likely to continue seeing annual employment gains greater than
the nation as a whole. The market’s labor force is also growing at roughly half the pace of job growth, which will
continue to apply downward pressure on the unemployment rate.
The Oxford Economics Base Case forecast is calling for job growth to slow considerably in 2020 – 2021. While the
slowdown in U.S. job growth would also heavily weigh upon Tampa’s future employment growth expectations, the
market is expected to hold up relatively well and is likely to continue outperforming the nation.
Over the past year, the best performing job sector has been financial activities, growing at a 4.5% annual clip, roughly
five times the national average. The financial services sector is also historically one of Tampa’s strongest performers,
which spurred the metropolitan area's reputation as a financial hub. Other recent stalwarts include construction (2.9%),
professional and business services (2.7%), leisure and hospitality (2.5%), and manufacturing (2%).
The leisure and hospitality job growth rates also reflect an increasing focus on tourism, especially in Hillsborough
County, which recently joined Pinellas County across the bay as one of only nine high-impact tourism counties in the
state of Florida. While Pinellas County benefits from world-renowned beaches, Hillsborough has relied upon hosting
conferences and major sporting events, including landing the upcoming Wrestlemania 36 and Super Bowl LV.
While the job growth and overall tight labor market have improved Tampa’s median income level to nearly $55,000, it
still trails the U.S. average by over 15%. However, the market has many factors to help offset this large spread,
including no state income taxes and one of the nation’s more affordable housing markets.
Tampa’s relative affordability has been a primary driver of the region’s strong net migration patterns. Since 2013,
roughly 300,000 people moved into the market, tied for the most in-migration in the state of Florida. However, this
strength also belies a potential weakness. Net migration accounted for virtually all of Tampa’s population growth
during this timeframe. The natural population growth has also slowed during this timeframe and over the past two
years has even turned negative.
The market could be overexposed to recessionary influences, as migration, particularly domestic, is often
quick to dry up in adverse economic times.
Infrastructure has long been a sore spot for Tampa. There is virtually no public transit, and only four roadways
connecting Pinellas and Hillsborough counties. Improving public transit is a key focus across the region in 2019, as
reflected by the Tampa City Council approving a $3 billion infrastructure plan.
Section 8:
Demographics – Market Summary