value-added auditing for global systems effectiveness · pdf fileglobal performance auditing 1...
TRANSCRIPT
Global Performance Auditing 1 of 14
Global Performance Auditing Value-added auditing for global systems effectiveness
Jennifer Kirley CMQ/OE
December 30, 2010 Approximately 3,300 words
Part 1: The Vision It’s time to move the auditing process to the next level. Quality management system audits that have been focusing on compliance to standard elements should progress beyond simple compliance and into management system performance.
Site audits should still make sure to audit all of the standard elements. Registrars expect it, and the standards are designed to include all the system performance components. Nonconformances should still cite the element number and problem statements describing how the requirements were not met.
In Global Audit Management we move beyond this minimum and into process auditing that includes the requirements of internal and external customers. Auditors assess the effectiveness of inputs and outputs as connections with other processes. A management level oversight function oversees the global audit findings and their resolution. Reports to top management includes overall learnings and common challenges, and shows how corrective actions improve the effectiveness of corporate sites and the proceeses that depend on each other to provide high quality customer product on time, every time. This paper outlines a proposed process, reporting methods, tools and a roadmap for implementation.
Process
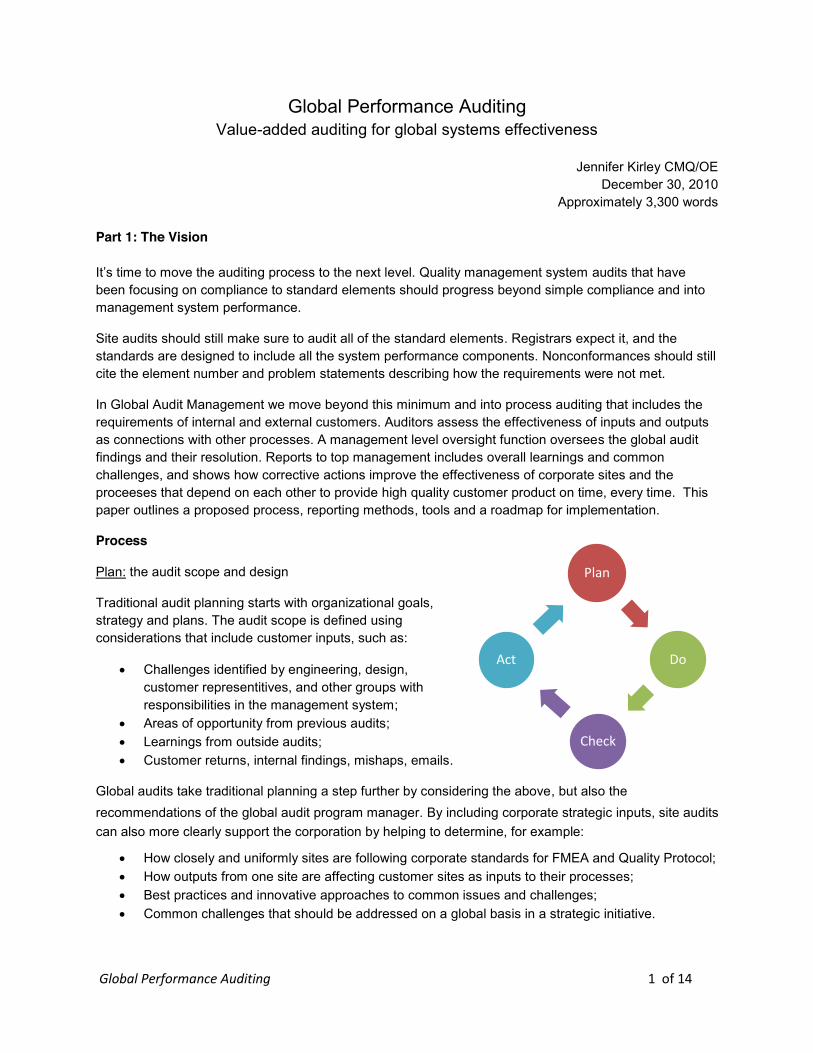
Plan: the audit scope and design
Traditional audit planning starts with organizational goals, strategy and plans. The audit scope is defined using considerations that include customer inputs, such as:
Challenges identified by engineering, design, customer representitives, and other groups with responsibilities in the management system;
Areas of opportunity from previous audits; Learnings from outside audits; Customer returns, internal findings, mishaps, emails.
Global audits take traditional planning a step further by considering the above, but also the recommendations of the global audit program manager. By including corporate strategic inputs, site audits can also more clearly support the corporation by helping to determine, for example:
How closely and uniformly sites are following corporate standards for FMEA and Quality Protocol; How outputs from one site are affecting customer sites as inputs to their processes; Best practices and innovative approaches to common issues and challenges; Common challenges that should be addressed on a global basis in a strategic initiative.
Plan
Do
Check
Act
Global Performance Auditing 2 of 14
Do: the auditing stage
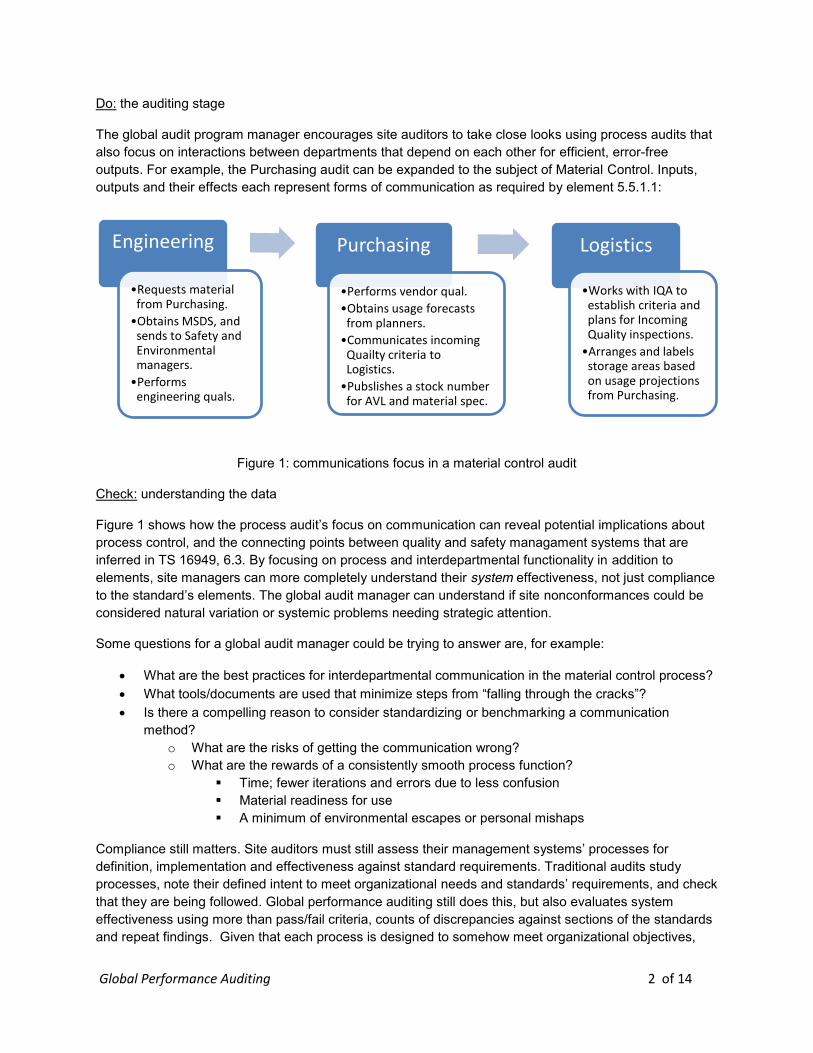
The global audit program manager encourages site auditors to take close looks using process audits that also focus on interactions between departments that depend on each other for efficient, error-free outputs. For example, the Purchasing audit can be expanded to the subject of Material Control. Inputs, outputs and their effects each represent forms of communication as required by element 5.5.1.1:
Figure 1: communications focus in a material control audit
Check: understanding the data
Figure 1 shows how the process audit’s focus on communication can reveal potential implications about process control, and the connecting points between quality and safety managament systems that are inferred in TS 16949, 6.3. By focusing on process and interdepartmental functionality in addition to elements, site managers can more completely understand their system effectiveness, not just compliance to the standard’s elements. The global audit manager can understand if site nonconformances could be considered natural variation or systemic problems needing strategic attention.
Some questions for a global audit manager could be trying to answer are, for example:
What are the best practices for interdepartmental communication in the material control process? What tools/documents are used that minimize steps from “falling through the cracks”? Is there a compelling reason to consider standardizing or benchmarking a communication
method? o What are the risks of getting the communication wrong? o What are the rewards of a consistently smooth process function?
Time; fewer iterations and errors due to less confusion Material readiness for use A minimum of environmental escapes or personal mishaps
Compliance still matters. Site auditors must still assess their management systems’ processes for definition, implementation and effectiveness against standard requirements. Traditional audits study processes, note their defined intent to meet organizational needs and standards’ requirements, and check that they are being followed. Global performance auditing still does this, but also evaluates system effectiveness using more than pass/fail criteria, counts of discrepancies against sections of the standards and repeat findings. Given that each process is designed to somehow meet organizational objectives,
Engineering
•Requests material from Purchasing.•Obtains MSDS, and
sends to Safety and Environmental managers.•Performs
engineering quals.
Purchasing
•Performs vendor qual.•Obtains usage forecasts
from planners.•Communicates incoming
Quailty criteria to Logistics. •Pubslishes a stock number
for AVL and material spec.
Logistics
•Works with IQA to establish criteria and plans for Incoming Quality inspections.•Arranges and labels
storage areas based on usage projections from Purchasing.
Global Performance Auditing 3 of 14
each nonconformance represents some type of risk to achieving site and coproate goals. In order to move auditing to global systems performance assessments, audits convey a recognition of the type and degree of risk introduced to the system as well as failure to comply or a loss of control. Some types of risk include:
Loss of customer product o Misprocessing o Inadequate yield o Quality escape
Regulatory breach o Lost personnel readiness
Lost time, impacting time-to-market goal o Process down time o Engineering time to correct issues o Missed shipment goal
An audit process that assesses system performance can help process owners move beyond fixing nonconformances. As members of the QMS, auditors that approve corrective action plans can help process owners understand their connection to the end result, customer satisfaction and eventually market share. Site auditors can help process owners recognize the effects their actions have on risks.
Performance criteria
Traditional audit reporting metrics include the percent of nonconforming against elements checked, and recognition of performance against system components: documentation, calibration, safety, cleanliess, responsibility, training etc. should still take place. Systems assessments using performance auditing methods also identify parts of the system in which nonconformities were found, but metrics are designed to show that plus why the finding was important: the type and extent of risk the problem represents.
Audit metrics in performance auditing can represent a variety of factors that can help managers understand their issues’ meaning. To be meaningful and actionable, metrics should include at minimum:
1) The element subgroup of the finding. Types of controls are arranged in elements, such as quality system development, responsibility and communication, resources, process control, and so on. Understanding the type of problem is important, but it needs to be provided in enough detail to shed light on the type of control needing improvement. Control types should be trended to understand the organization’s greatest opportunities and progress in bolstering the various disciplines that contribute to organizational goals.
2) The Department/group/ process involved with root cause. To supply actionable information, metrics should identify areas of opportunity in the organization such as, but not limited to planning, design engineering, process engineering, equipment engineering, human resources, inspection and test, and so on. Identifying functional areas can help top management pinpoint targets of strategic system improvements.
3) The type of risk that the nonconformance represents. Process outputs can be critical to downstream process inputs. Identifying risk types and degrees can help process owners and their managers keep aware of their importance in the system and potential consequences of issues. Risk types can be diverse: for example product loss, missed shipments, violation of one or more regulations, and lost resources such as time and/or materials to work around the symptoms and deal with repeat problems.
Global Performance Auditing 4 of 14
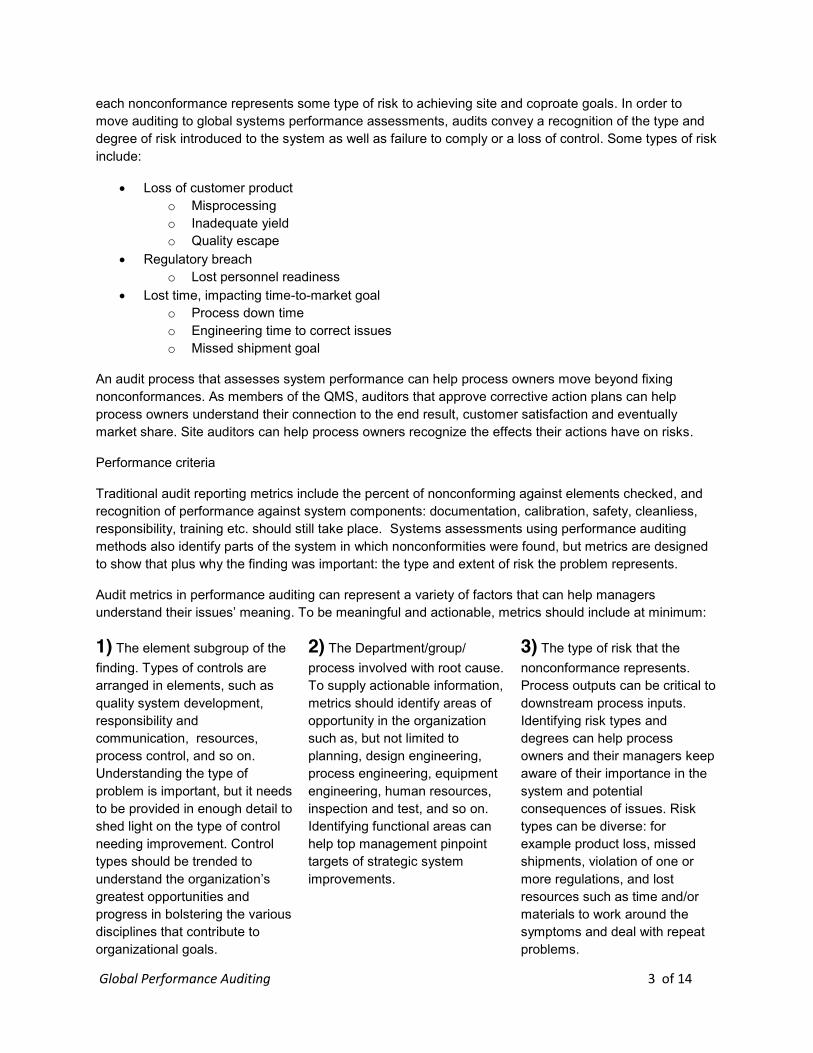
Act: management system response
Traditional audit programs issue nonconformances and monitor the corrective actions taken to resolve the system discrepancies and close the nonconformances. Global performance auditing does that too, but it goes farther. Global performance auditing data from sites feed in together into a central corporate set of business and quality objectives. Audit metrics show the aggregate performance of the whole.
In reviewing results of site audits, the global audit manager notes common issues and system opportunities. The metrics identifying types of problem, their relative risks and weight are considered to determine if, and what corporate opportunity is worth investigating further to see if strategic intervention seems warranted. Through regular conference calls with site audit managers, the global audit manager pursues details and defines common management system opportunities for corporate management review. Resulting corporate intiatives, if any, are fed back into the sites via the AOP process or corporate quality initiative. The site auditing processes are then planned to include assessment of the rollout: definition, implementation and effectiveness.
Part 2: The Road Map
Independent site audit activities can continue to use their trained process experts to perform audits as collateral duties. Site audits maintain separate tracking methods, report to local management using locally defined metrics, and send quarterly reports to corporate using common metrics. Local audit activities can continue independently, but site managers should develop a common systems performance focus:
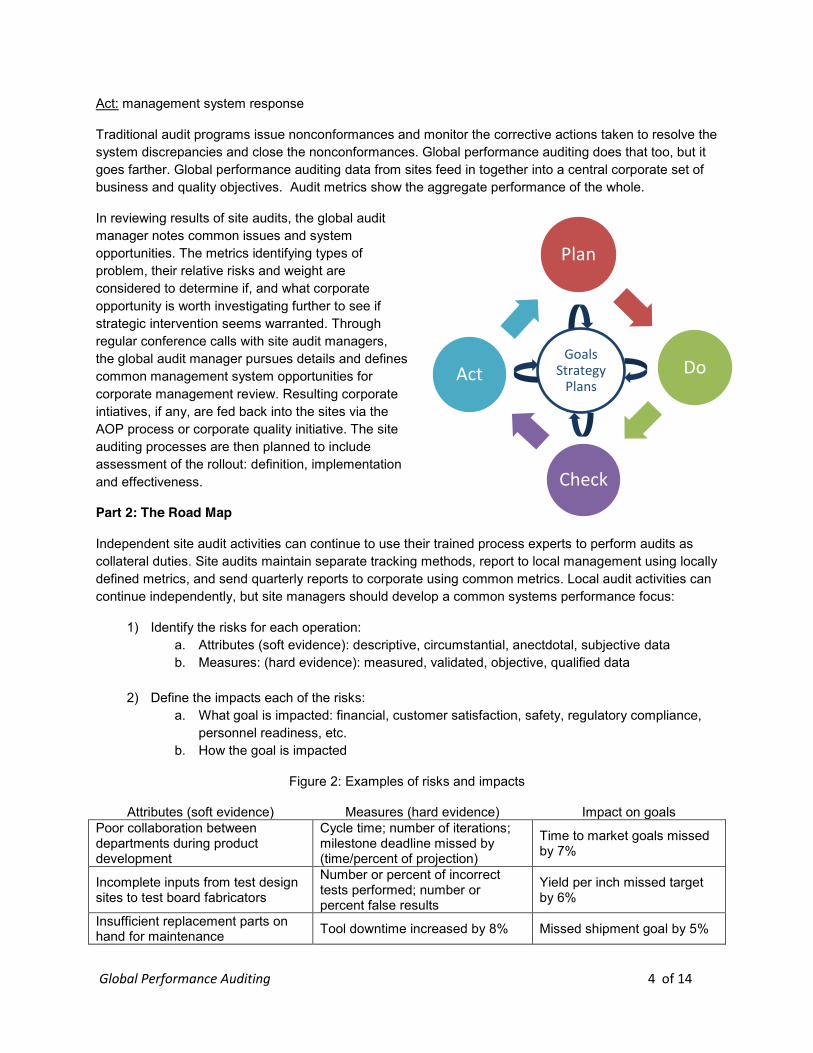
1) Identify the risks for each operation: a. Attributes (soft evidence): descriptive, circumstantial, anectdotal, subjective data b. Measures: (hard evidence): measured, validated, objective, qualified data
2) Define the impacts each of the risks:
a. What goal is impacted: financial, customer satisfaction, safety, regulatory compliance, personnel readiness, etc.
b. How the goal is impacted
Figure 2: Examples of risks and impacts
Attributes (soft evidence) Measures (hard evidence) Impact on goals Poor collaboration between departments during product development
Cycle time; number of iterations; milestone deadline missed by (time/percent of projection)
Time to market goals missed by 7%
Incomplete inputs from test design sites to test board fabricators
Number or percent of incorrect tests performed; number or percent false results
Yield per inch missed target by 6%
Insufficient replacement parts on hand for maintenance Tool downtime increased by 8% Missed shipment goal by 5%
Goals Strategy
Plans
Plan
Do
Check
Act
Global Performance Auditing 5 of 14
3) Brainstorm risk severity definitions. The definitions will vary depending on each site’s role in sales, design, corporate management, Site etc., but the definitions should be understood and agreed upon as a global audit team effort.
a. Attributes: descriptive indicators b. Measures: the degree to which goals are jeopardized
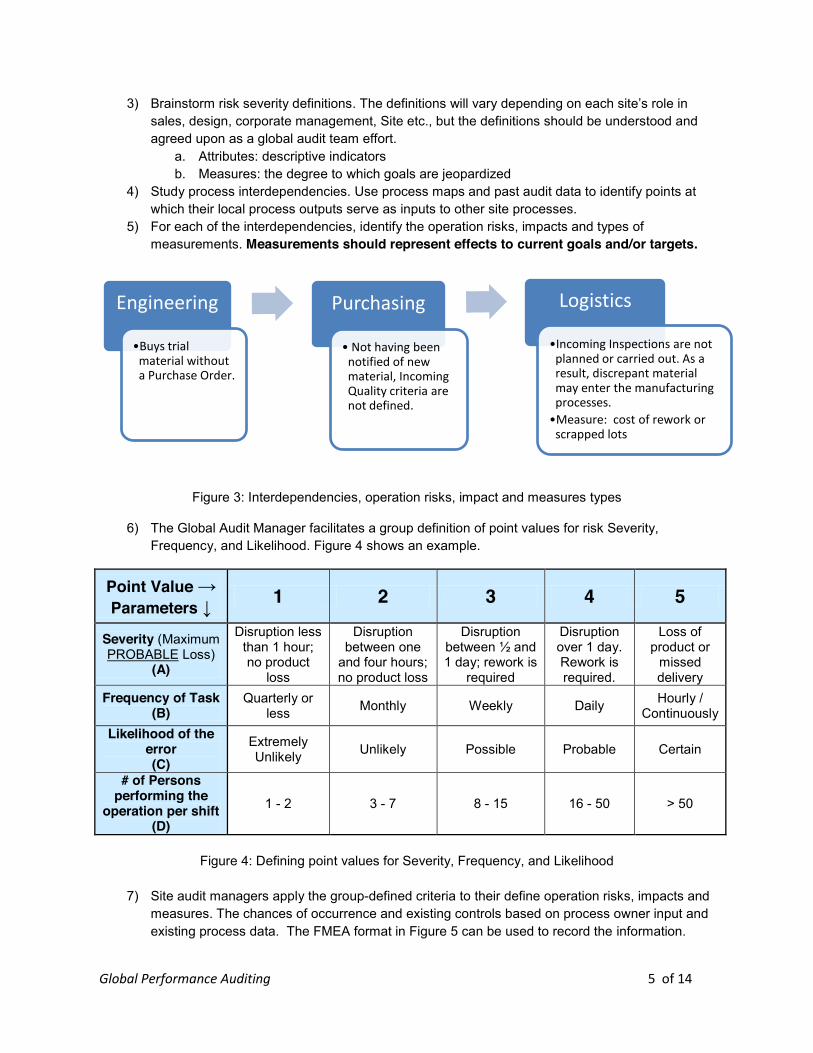
4) Study process interdependencies. Use process maps and past audit data to identify points at which their local process outputs serve as inputs to other site processes.
5) For each of the interdependencies, identify the operation risks, impacts and types of measurements. Measurements should represent effects to current goals and/or targets.
Figure 3: Interdependencies, operation risks, impact and measures types
6) The Global Audit Manager facilitates a group definition of point values for risk Severity, Frequency, and Likelihood. Figure 4 shows an example.
Point Value → Parameters ↓ 1 2 3 4 5
Severity (Maximum PROBABLE Loss)
(A)
Disruption less than 1 hour; no product
loss
Disruption between one
and four hours; no product loss
Disruption between ½ and 1 day; rework is
required
Disruption over 1 day. Rework is required.
Loss of product or
missed delivery
Frequency of Task (B)
Quarterly or less Monthly Weekly Daily Hourly /
Continuously Likelihood of the
error (C)
Extremely Unlikely Unlikely Possible Probable Certain
# of Persons performing the
operation per shift (D)
1 - 2 3 - 7 8 - 15 16 - 50 > 50
Figure 4: Defining point values for Severity, Frequency, and Likelihood
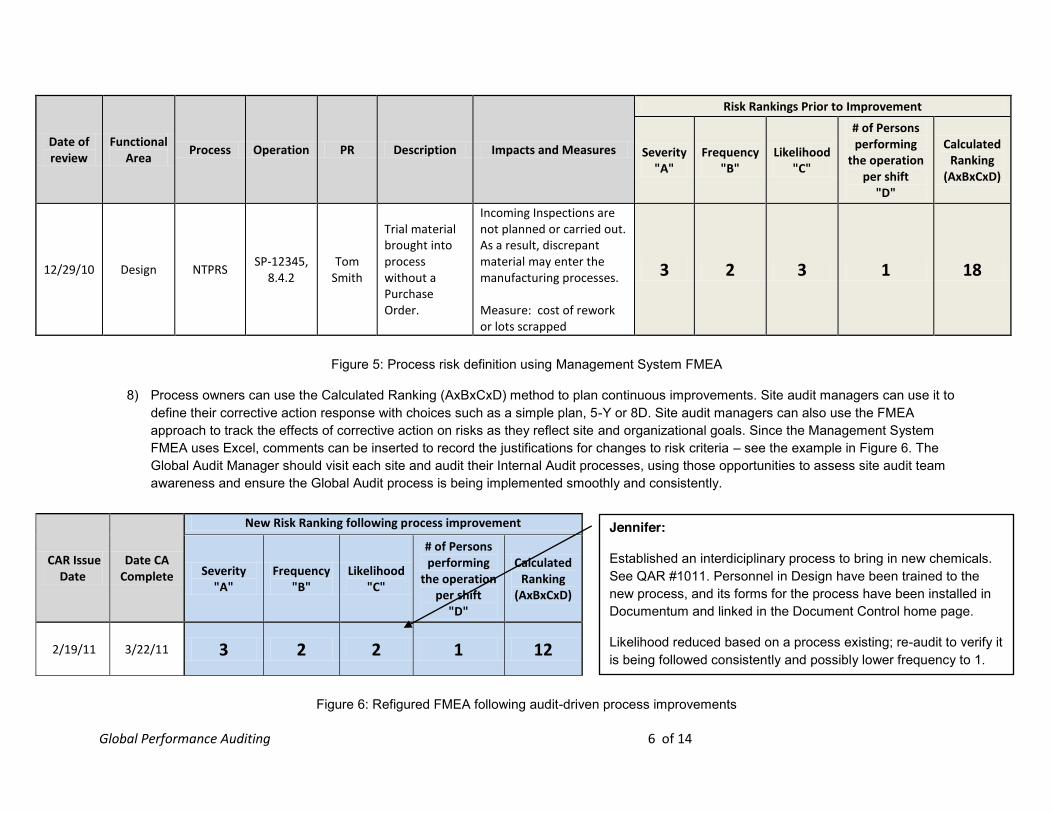
7) Site audit managers apply the group-defined criteria to their define operation risks, impacts and
measures. The chances of occurrence and existing controls based on process owner input and existing process data. The FMEA format in Figure 5 can be used to record the information.
Engineering
•Buys trial material without a Purchase Order.
Purchasing
• Not having been notified of new material, Incoming Quality criteria are not defined.
Logistics
•Incoming Inspections are not planned or carried out. As a result, discrepant material may enter the manufacturing processes.•Measure: cost of rework or
scrapped lots
Global Performance Auditing 6 of 14
Date of review
Functional Area
Process Operation PR Description Impacts and Measures
Risk Rankings Prior to Improvement
Severity "A"
Frequency "B"
Likelihood "C"
# of Persons performing
the operation per shift
"D"
Calculated Ranking
(AxBxCxD)
12/29/10 Design NTPRS SP-12345,
8.4.2 Tom
Smith
Trial material brought into process without a Purchase Order.
Incoming Inspections are not planned or carried out. As a result, discrepant material may enter the manufacturing processes. Measure: cost of rework or lots scrapped
3 2 3 1 18
Figure 5: Process risk definition using Management System FMEA
8) Process owners can use the Calculated Ranking (AxBxCxD) method to plan continuous improvements. Site audit managers can use it to define their corrective action response with choices such as a simple plan, 5-Y or 8D. Site audit managers can also use the FMEA approach to track the effects of corrective action on risks as they reflect site and organizational goals. Since the Management System FMEA uses Excel, comments can be inserted to record the justifications for changes to risk criteria – see the example in Figure 6. The Global Audit Manager should visit each site and audit their Internal Audit processes, using those opportunities to assess site audit team awareness and ensure the Global Audit process is being implemented smoothly and consistently.
CAR Issue Date
Date CA Complete
New Risk Ranking following process improvement
Severity "A"
Frequency "B"
Likelihood "C"
# of Persons performing
the operation per shift
"D"
Calculated Ranking
(AxBxCxD)
2/19/11 3/22/11 3 2 2 1 12
Figure 6: Refigured FMEA following audit-driven process improvements
Jennifer:
Established an interdiciplinary process to bring in new chemicals. See QAR #1011. Personnel in Design have been trained to the new process, and its forms for the process have been installed in Documentum and linked in the Document Control home page.
Likelihood reduced based on a process existing; re-audit to verify it is being followed consistently and possibly lower frequency to 1.
Global Performance Auditing 7 of 14
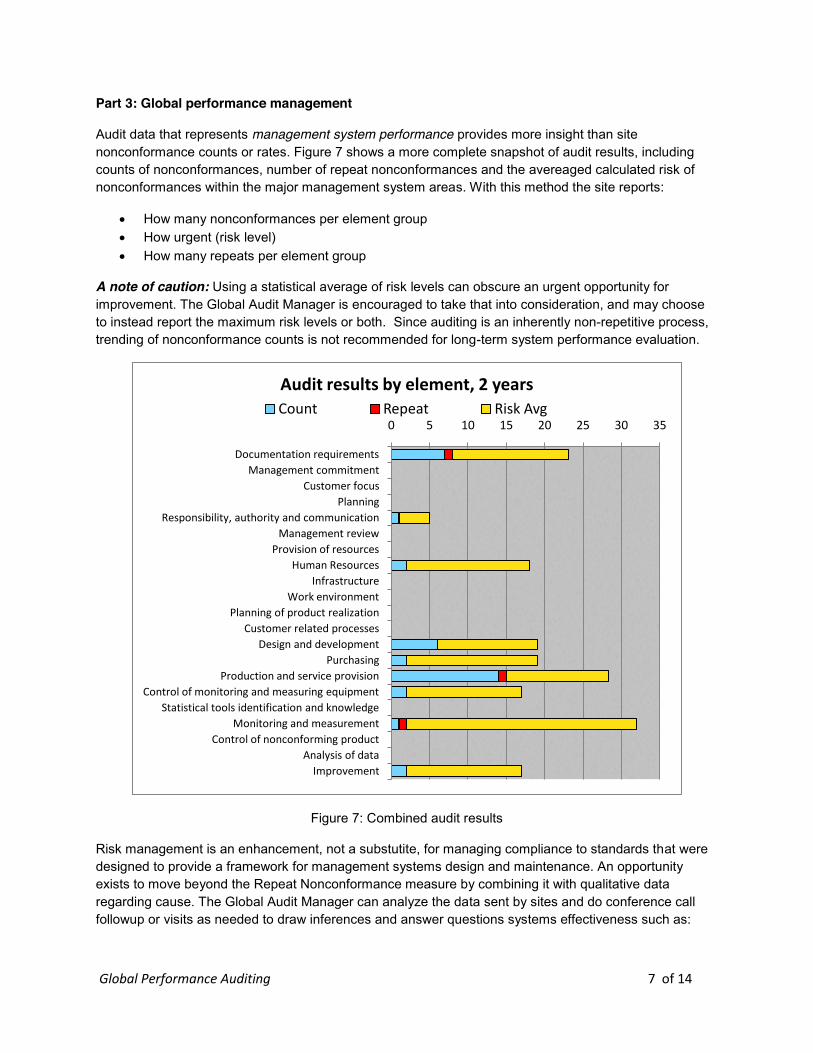
Part 3: Global performance management
Audit data that represents management system performance provides more insight than site nonconformance counts or rates. Figure 7 shows a more complete snapshot of audit results, including counts of nonconformances, number of repeat nonconformances and the avereaged calculated risk of nonconformances within the major management system areas. With this method the site reports:
How many nonconformances per element group How urgent (risk level) How many repeats per element group
A note of caution: Using a statistical average of risk levels can obscure an urgent opportunity for improvement. The Global Audit Manager is encouraged to take that into consideration, and may choose to instead report the maximum risk levels or both. Since auditing is an inherently non-repetitive process, trending of nonconformance counts is not recommended for long-term system performance evaluation.
Figure 7: Combined audit results
Risk management is an enhancement, not a substutite, for managing compliance to standards that were designed to provide a framework for management systems design and maintenance. An opportunity exists to move beyond the Repeat Nonconformance measure by combining it with qualitative data regarding cause. The Global Audit Manager can analyze the data sent by sites and do conference call followup or visits as needed to draw inferences and answer questions systems effectiveness such as:
0 5 10 15 20 25 30 35
Documentation requirementsManagement commitment
Customer focusPlanning
Responsibility, authority and communicationManagement review
Provision of resourcesHuman Resources
InfrastructureWork environment
Planning of product realizationCustomer related processes
Design and developmentPurchasing
Production and service provisionControl of monitoring and measuring equipment
Statistical tools identification and knowledgeMonitoring and measurement
Control of nonconforming productAnalysis of data
Improvement
Audit results by element, 2 yearsCount Repeat Risk Avg
Global Performance Auditing 8 of 14
1) Are resources being adequately requested and provided when needed? Would important issues be properly dealt with using a new piece of equipment or software? If so, why haven’t the needs been met?
2) Do the CAR owners understand how to do a good root cause analysis? If CAR owners do not understand how to do a good root cause analysis - and it's not easy to know when one has reached the "last Why" – management may decide the Global Audit Manager needs to further investigate and determine if a strategic appropriate.
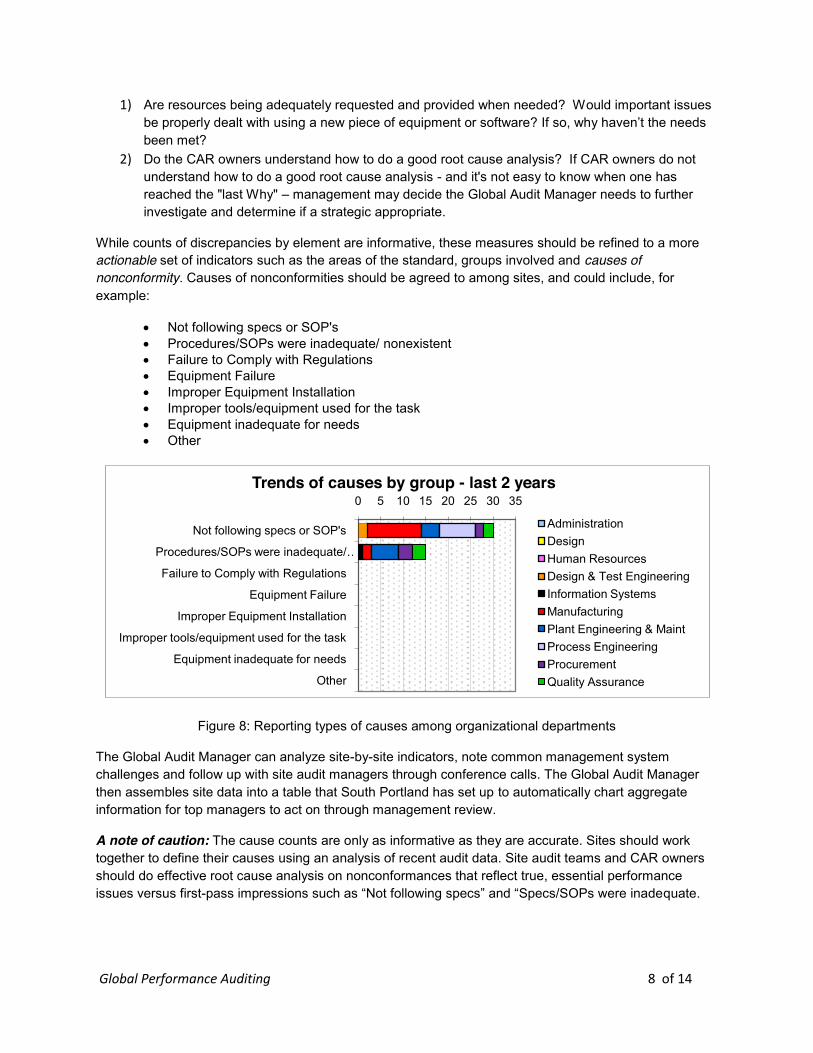
While counts of discrepancies by element are informative, these measures should be refined to a more actionable set of indicators such as the areas of the standard, groups involved and causes of nonconformity. Causes of nonconformities should be agreed to among sites, and could include, for example:
Not following specs or SOP's Procedures/SOPs were inadequate/ nonexistent Failure to Comply with Regulations Equipment Failure Improper Equipment Installation Improper tools/equipment used for the task Equipment inadequate for needs Other
Figure 8: Reporting types of causes among organizational departments
The Global Audit Manager can analyze site-by-site indicators, note common management system challenges and follow up with site audit managers through conference calls. The Global Audit Manager then assembles site data into a table that South Portland has set up to automatically chart aggregate information for top managers to act on through management review.
A note of caution: The cause counts are only as informative as they are accurate. Sites should work together to define their causes using an analysis of recent audit data. Site audit teams and CAR owners should do effective root cause analysis on nonconformances that reflect true, essential performance issues versus first-pass impressions such as “Not following specs” and “Specs/SOPs were inadequate.
0 5 10 15 20 25 30 35
Not following specs or SOP's
Procedures/SOPs were inadequate/ …
Failure to Comply with Regulations
Equipment Failure
Improper Equipment Installation
Improper tools/equipment used for the task
Equipment inadequate for needs
Other
Trends of causes by group - last 2 years
AdministrationDesignHuman ResourcesDesign & Test EngineeringInformation SystemsManufacturingPlant Engineering & MaintProcess EngineeringProcurementQuality Assurance
Global Performance Auditing 9 of 14
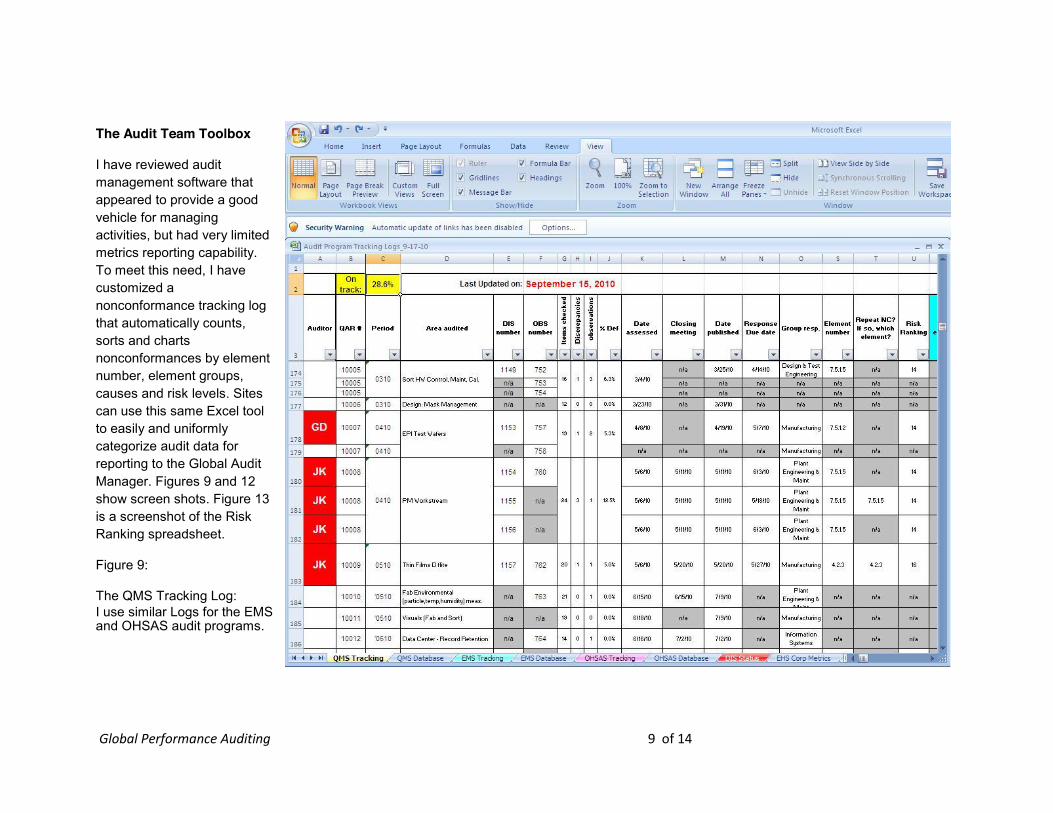
The Audit Team Toolbox
I have reviewed audit management software that appeared to provide a good vehicle for managing activities, but had very limited metrics reporting capability. To meet this need, I have customized a nonconformance tracking log that automatically counts, sorts and charts nonconformances by element number, element groups, causes and risk levels. Sites can use this same Excel tool to easily and uniformly categorize audit data for reporting to the Global Audit Manager. Figures 9 and 12 show screen shots. Figure 13 is a screenshot of the Risk Ranking spreadsheet.
Figure 9:
The QMS Tracking Log: I use similar Logs for the EMS and OHSAS audit programs.
Global Performance Auditing 10 of 14
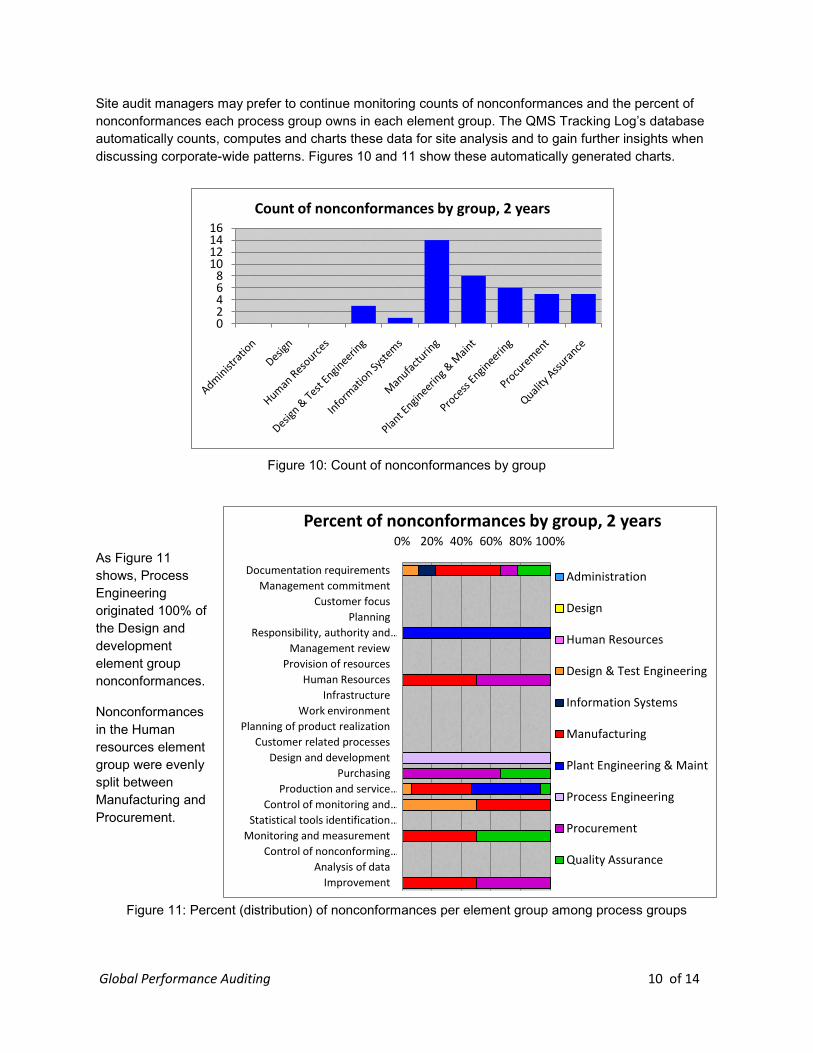
Site audit managers may prefer to continue monitoring counts of nonconformances and the percent of nonconformances each process group owns in each element group. The QMS Tracking Log’s database automatically counts, computes and charts these data for site analysis and to gain further insights when discussing corporate-wide patterns. Figures 10 and 11 show these automatically generated charts.
Figure 10: Count of nonconformances by group
As Figure 11 shows, Process Engineering originated 100% of the Design and development element group nonconformances.
Nonconformances in the Human resources element group were evenly split between Manufacturing and Procurement.
Figure 11: Percent (distribution) of nonconformances per element group among process groups
02468
10121416
Count of nonconformances by group, 2 years
0% 20% 40% 60% 80% 100%
Documentation requirementsManagement commitment
Customer focusPlanning
Responsibility, authority and …Management review
Provision of resourcesHuman Resources
InfrastructureWork environment
Planning of product realizationCustomer related processes
Design and developmentPurchasing
Production and service …Control of monitoring and …
Statistical tools identification …Monitoring and measurement
Control of nonconforming …Analysis of data
Improvement
Percent of nonconformances by group, 2 years
Administration
Design
Human Resources
Design & Test Engineering
Information Systems
Manufacturing
Plant Engineering & Maint
Process Engineering
Procurement
Quality Assurance
Global Performance Auditing 11 of 14
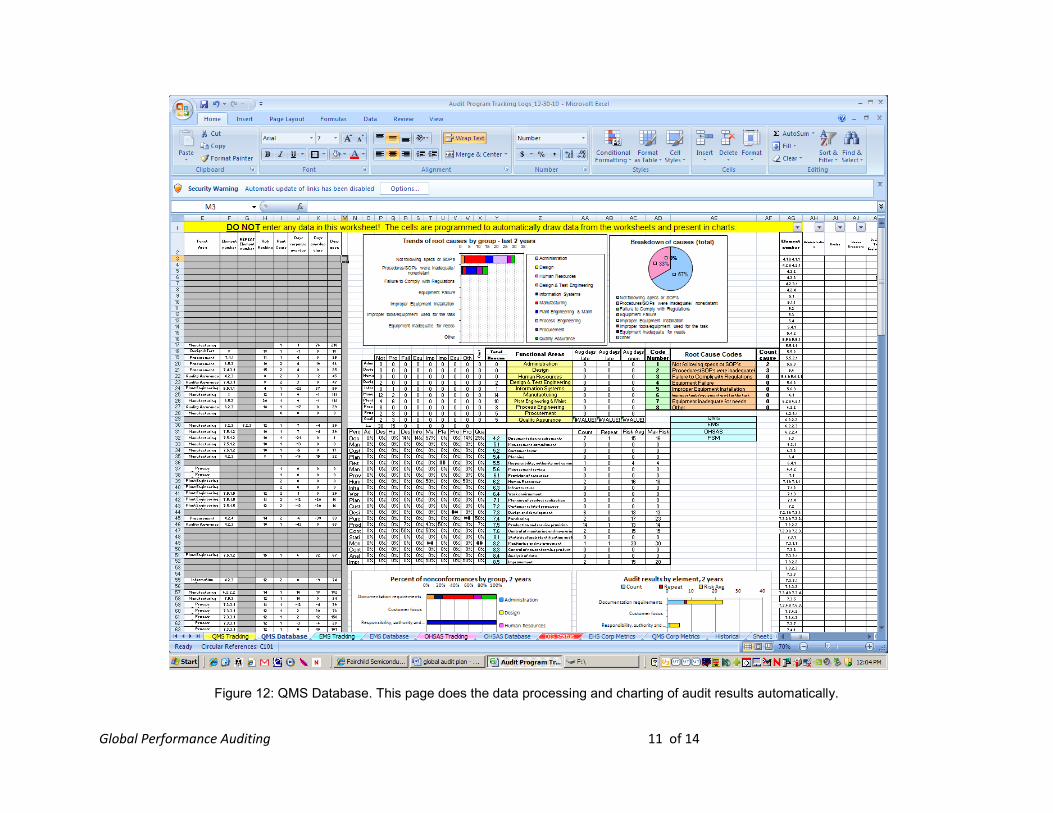
Figure 12: QMS Database. This page does the data processing and charting of audit results automatically.
Global Performance Auditing 12 of 14
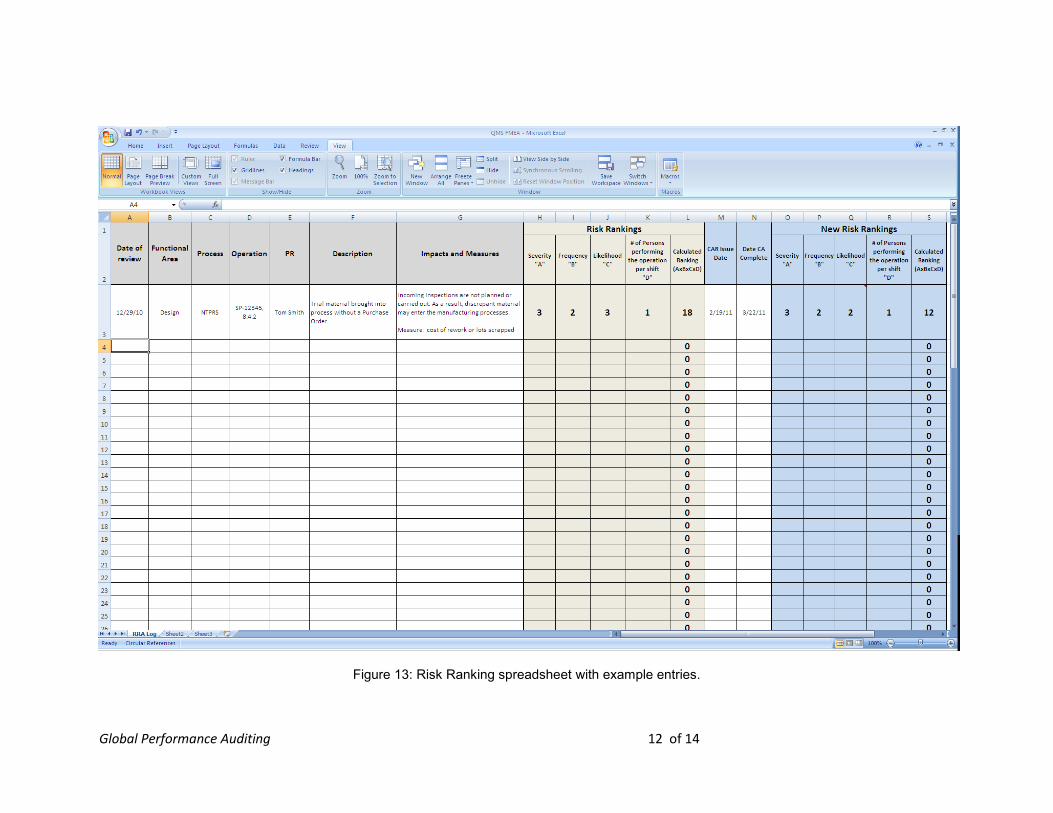
Figure 13: Risk Ranking spreadsheet with example entries.
Global Performance Auditing 13 of 14
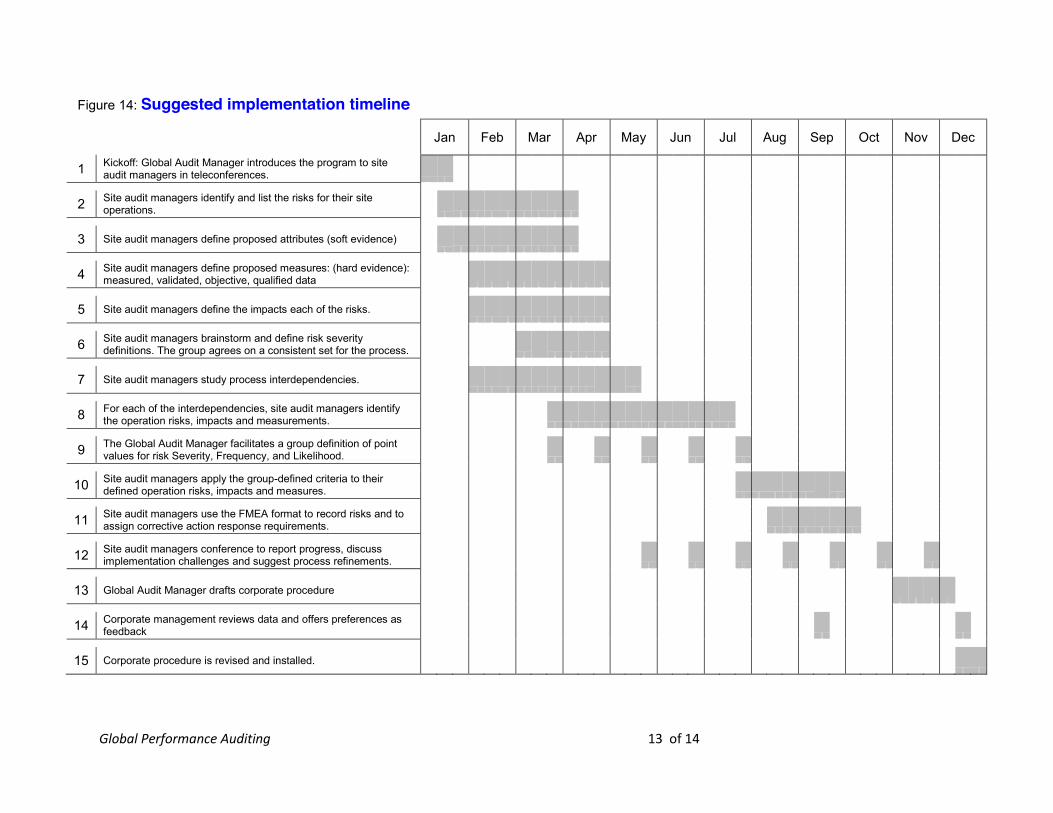
Figure 14: Suggested implementation timeline Jan Feb Mar Apr May Jun Jul Aug Sep Oct Nov Dec
1 Kickoff: Global Audit Manager introduces the program to site audit managers in teleconferences.
2 Site audit managers identify and list the risks for their site operations.
3 Site audit managers define proposed attributes (soft evidence)
4 Site audit managers define proposed measures: (hard evidence): measured, validated, objective, qualified data
5 Site audit managers define the impacts each of the risks.
6 Site audit managers brainstorm and define risk severity definitions. The group agrees on a consistent set for the process.
7 Site audit managers study process interdependencies.
8 For each of the interdependencies, site audit managers identify the operation risks, impacts and measurements.
9 The Global Audit Manager facilitates a group definition of point values for risk Severity, Frequency, and Likelihood.
10 Site audit managers apply the group-defined criteria to their defined operation risks, impacts and measures.
11 Site audit managers use the FMEA format to record risks and to assign corrective action response requirements.
12 Site audit managers conference to report progress, discuss implementation challenges and suggest process refinements.
13 Global Audit Manager drafts corporate procedure
14 Corporate management reviews data and offers preferences as feedback
15 Corporate procedure is revised and installed.
Global Performance Auditing 14 of 14
Summary
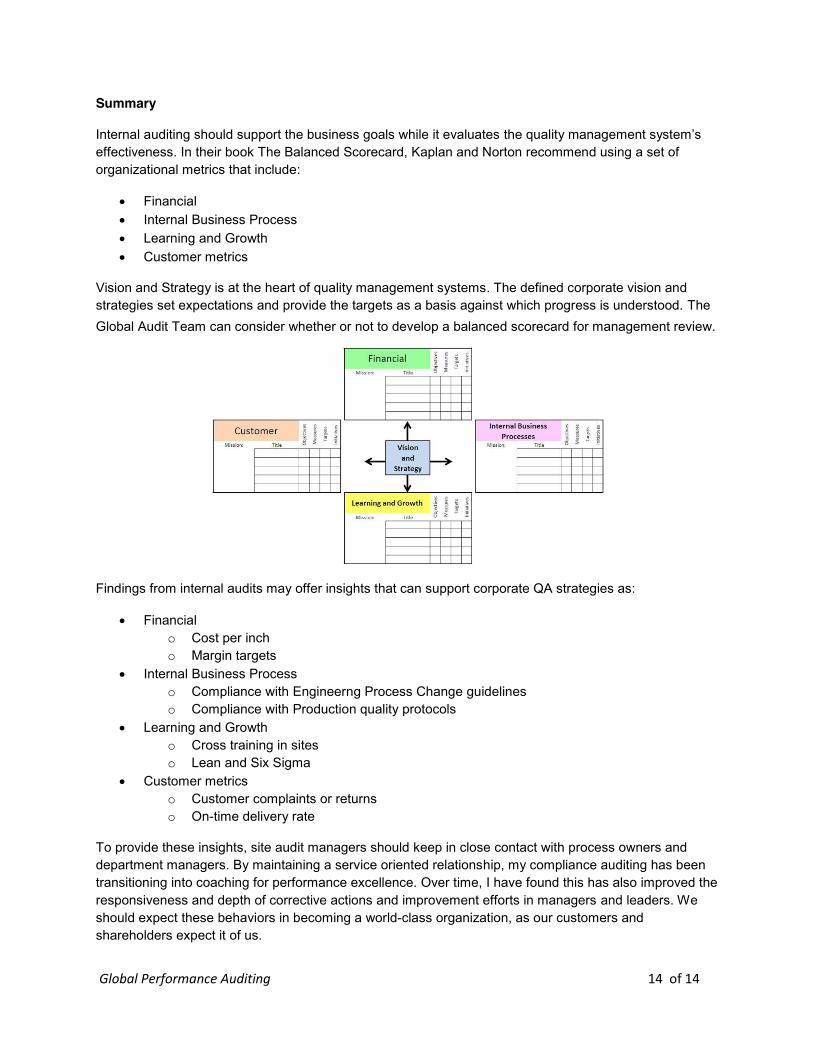
Internal auditing should support the business goals while it evaluates the quality management system’s effectiveness. In their book The Balanced Scorecard, Kaplan and Norton recommend using a set of organizational metrics that include:
Financial Internal Business Process Learning and Growth Customer metrics
Vision and Strategy is at the heart of quality management systems. The defined corporate vision and strategies set expectations and provide the targets as a basis against which progress is understood. The Global Audit Team can consider whether or not to develop a balanced scorecard for management review.
Findings from internal audits may offer insights that can support corporate QA strategies as:
Financial o Cost per inch o Margin targets
Internal Business Process o Compliance with Engineerng Process Change guidelines o Compliance with Production quality protocols
Learning and Growth o Cross training in sites o Lean and Six Sigma
Customer metrics o Customer complaints or returns o On-time delivery rate
To provide these insights, site audit managers should keep in close contact with process owners and department managers. By maintaining a service oriented relationship, my compliance auditing has been transitioning into coaching for performance excellence. Over time, I have found this has also improved the responsiveness and depth of corrective actions and improvement efforts in managers and leaders. We should expect these behaviors in becoming a world-class organization, as our customers and shareholders expect it of us.