value-based purchasing program overview - scripps.org · an annual market basket update with a 2.0...
TRANSCRIPT
Value-Based Purchasing Program Overview
Maida Soghikian, MDGrand Rounds
Scripps Green Hospital November 28, 2012
IQR and VBP Evolution and History
• Background and Introduction– Inpatient Quality Reporting Program– Value-Based Purchasing Program
• CMS FY13 VBP Final Scores• Process Measures Analysis
– Core Measure All or None Bundles– Value-Based Purchasing Program Measures
• Status of FY14 VBP Performance– Current data collection– Addition of Outcome Measures
• CMS VBP in FY16 and Beyond
Presentation Overview
2

Background and Introduction
3
IQR and VBP Evolution and History
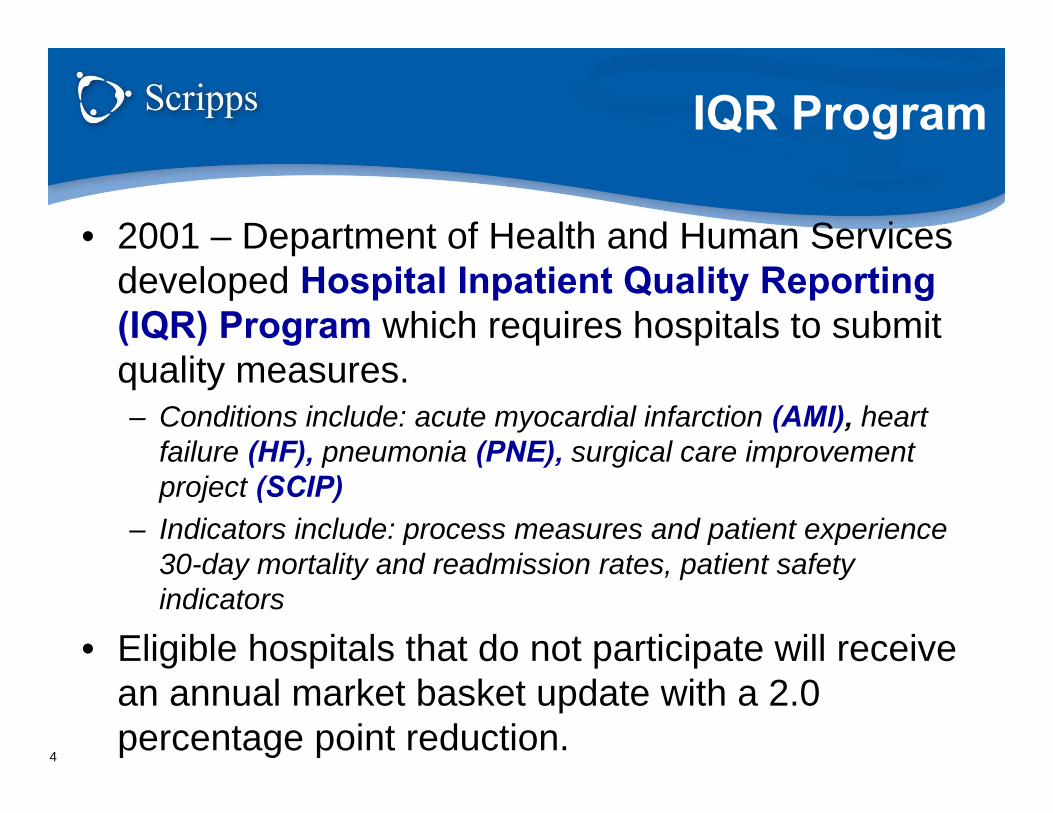
• 2001 – Department of Health and Human Services developed Hospital Inpatient Quality Reporting (IQR) Program which requires hospitals to submit quality measures.– Conditions include: acute myocardial infarction (AMI), heart
failure (HF), pneumonia (PNE), surgical care improvement project (SCIP)
– Indicators include: process measures and patient experience 30-day mortality and readmission rates, patient safety indicators
• Eligible hospitals that do not participate will receive an annual market basket update with a 2.0 percentage point reduction.
IQR Program
4

VBP Program:Background
5
• Congress authorized the hospital inpatientValue-Based Purchasing (VBP) Programthrough the Affordable Care Act.– Built on the Hospital IQR measure reporting
infrastructure. – Uses Hospital IQR measures that have had results
published on Hospital Compare* for at least one year– Funded by a 1% reduction from participating hospitals’
base operating diagnosis-related group (DRG) payments for FY 2013, increasing to 2% by FY 2017
* http://www.hospitalcompare.hhs.gov/

VBP Program:Purpose
6
• VBP Program seeks to encourage hospitals to improve the quality and safety of care for Medicare beneficiaries and all patients receive during acute-care inpatient stays by:
1) Eliminating or reducing occurrence of adverse events2) Adopting evidence-based care standards and
protocols that result in the best outcomes for the most patients
3) Improve patients’ experience of care
7
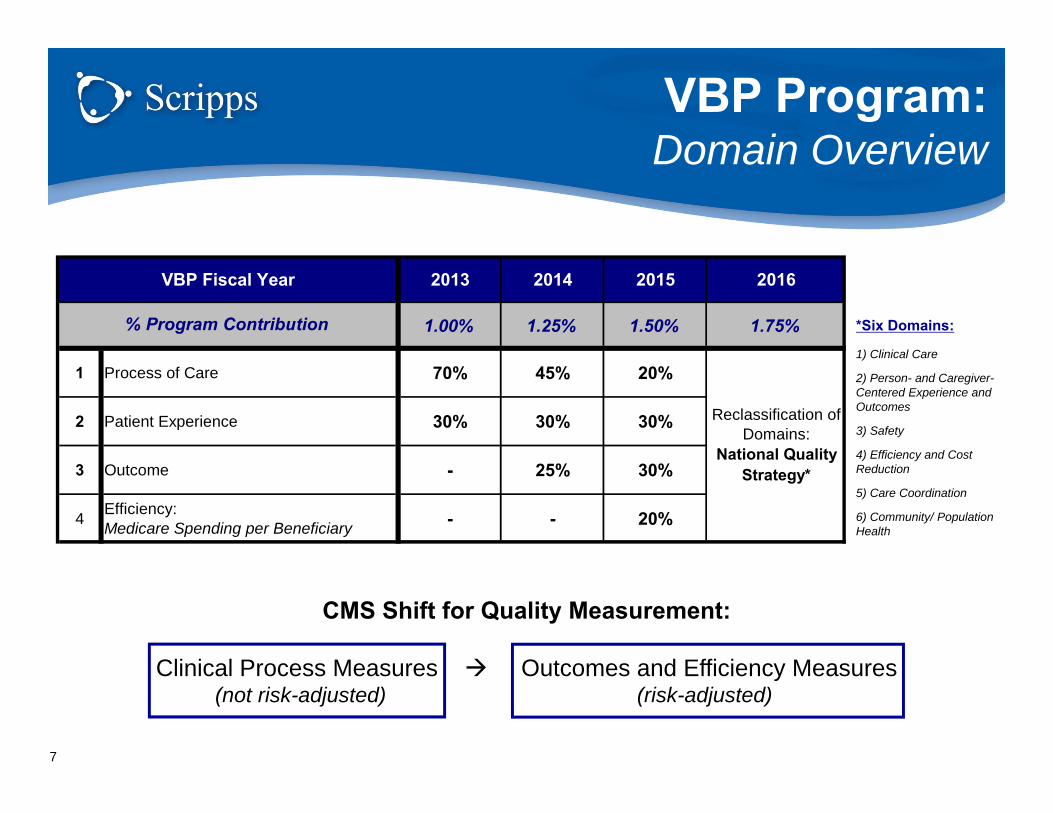
*Six Domains:
1) Clinical Care
2) Person- and Caregiver-Centered Experience and Outcomes
3) Safety
4) Efficiency and Cost Reduction
5) Care Coordination
6) Community/ Population Health
CMS Shift for Quality Measurement:
Clinical Process Measures Outcomes and Efficiency Measures(not risk-adjusted) (risk-adjusted)
2013 2014 2015 2016
1.00% 1.25% 1.50% 1.75%
1 Process of Care 70% 45% 20%
2 Patient Experience 30% 30% 30%
3 Outcome - 25% 30%
4 Efficiency:Medicare Spending per Beneficiary - - 20%
VBP Fiscal Year
Reclassification of Domains:
National Quality Strategy*
% Program Contribution
VBP Program:Domain Overview
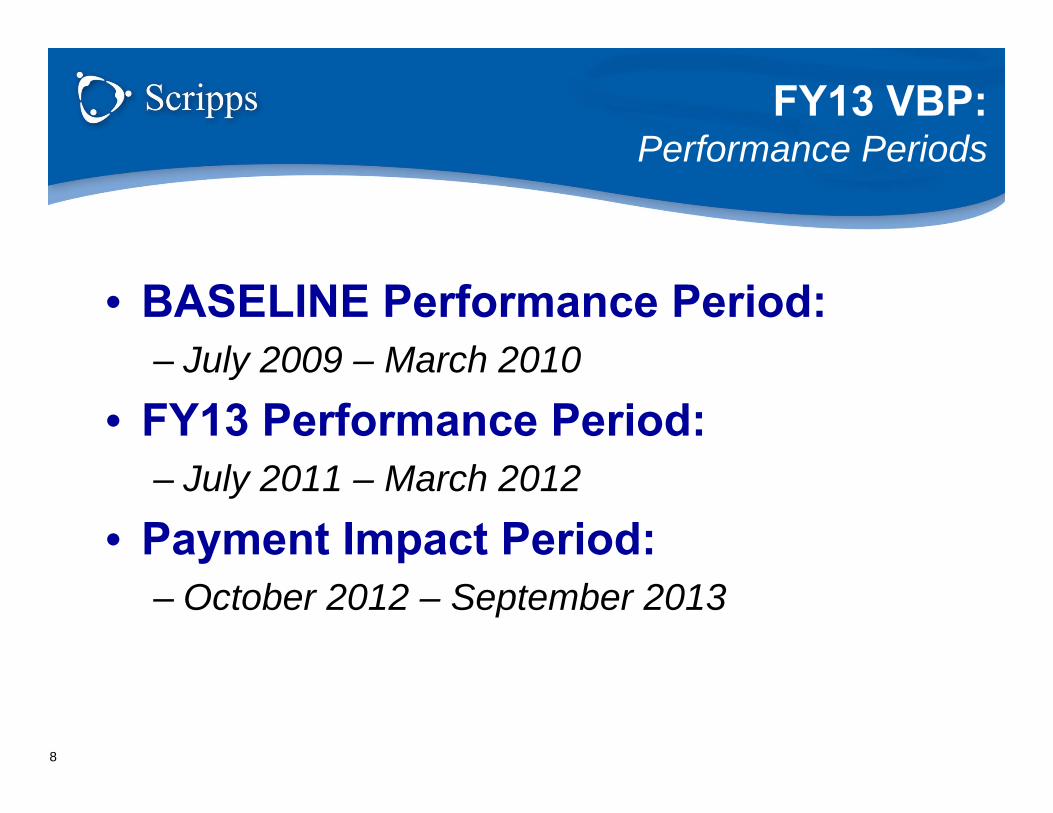
• BASELINE Performance Period:– July 2009 – March 2010
• FY13 Performance Period:– July 2011 – March 2012
• Payment Impact Period:– October 2012 – September 2013
FY13 VBP: Performance Periods
8
National Targets
9
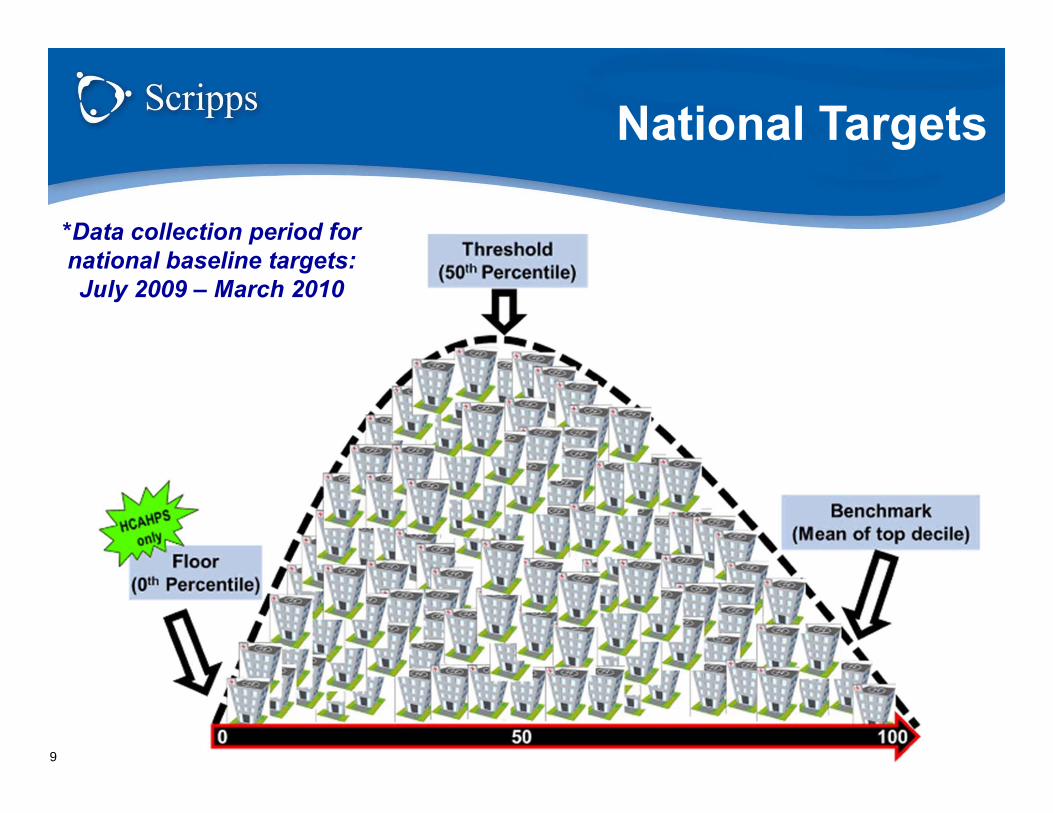
*Data collection period for national baseline targets: July 2009 – March 2010
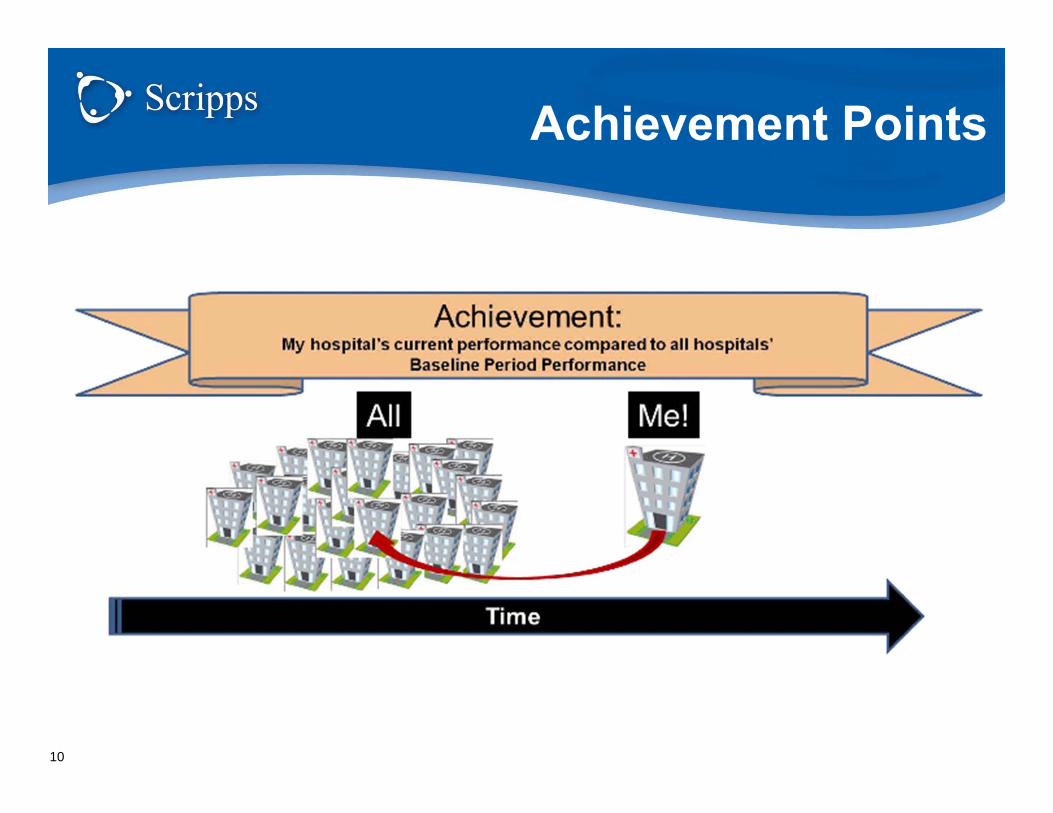
Achievement Points
10

Achievement Points
11
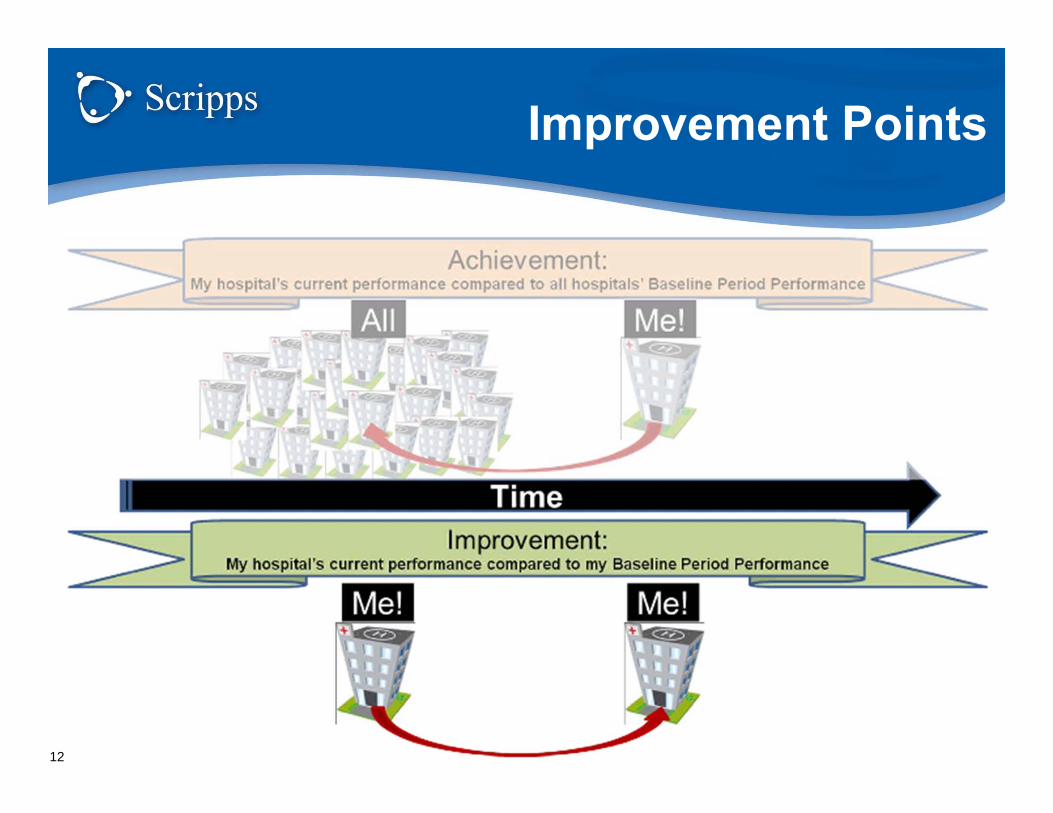
Improvement Points
12

Improvement Points
13
Final Points
14
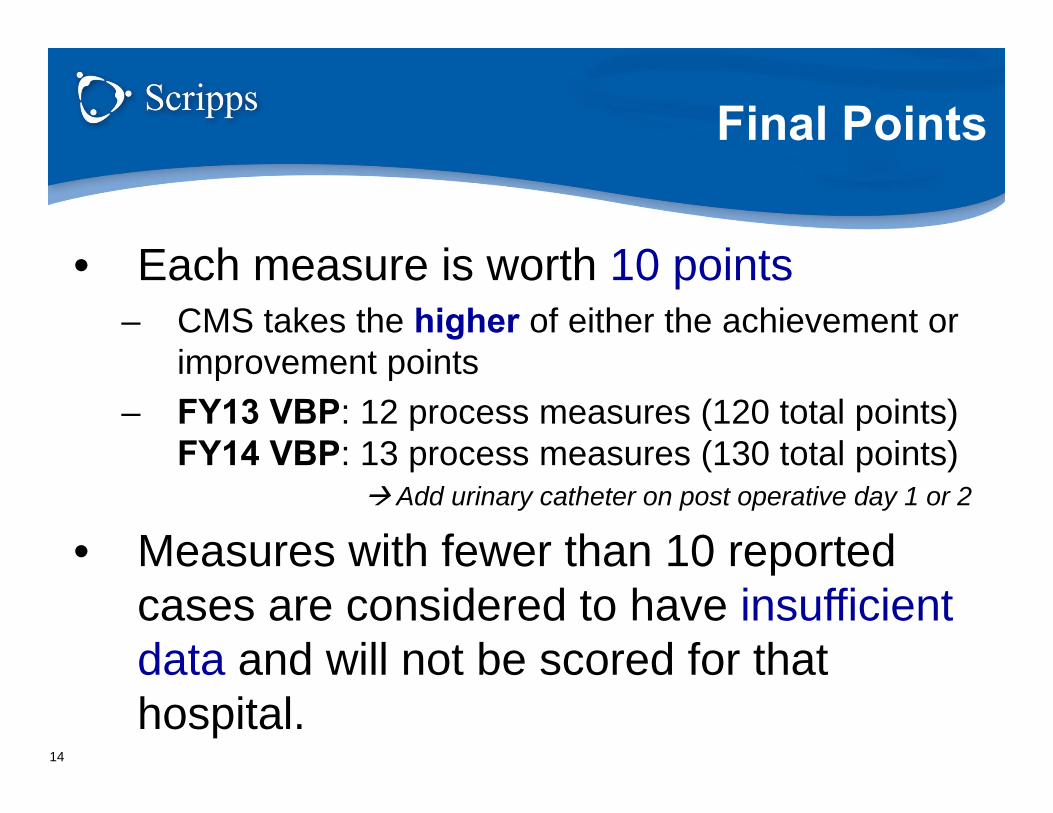
• Each measure is worth 10 points– CMS takes the higher of either the achievement or
improvement points – FY13 VBP: 12 process measures (120 total points)
FY14 VBP: 13 process measures (130 total points) Add urinary catheter on post operative day 1 or 2
• Measures with fewer than 10 reported cases are considered to have insufficient data and will not be scored for that hospital.
CMS FY13 VBP Final Scores
15
16
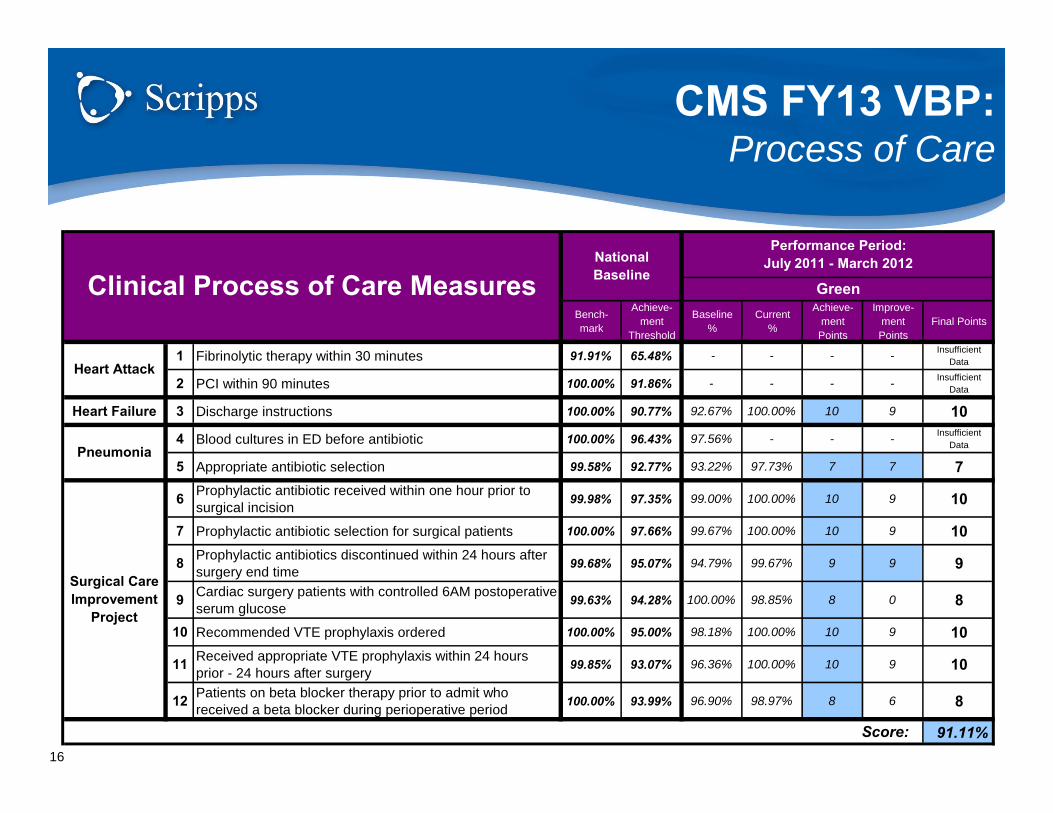
CMS FY13 VBP:Process of Care
Bench-mark
Achieve-ment
Threshold
Baseline %
Current%
Achieve-ment Points
Improve-ment Points
Final Points
1 Fibrinolytic therapy within 30 minutes 91.91% 65.48% - - - - Insufficient Data
2 PCI within 90 minutes 100.00% 91.86% - - - - Insufficient Data
Heart Failure 3 Discharge instructions 100.00% 90.77% 92.67% 100.00% 10 9 10
4 Blood cultures in ED before antibiotic 100.00% 96.43% 97.56% - - - Insufficient Data
5 Appropriate antibiotic selection 99.58% 92.77% 93.22% 97.73% 7 7 7
6 Prophylactic antibiotic received within one hour prior to surgical incision 99.98% 97.35% 99.00% 100.00% 10 9 10
7 Prophylactic antibiotic selection for surgical patients 100.00% 97.66% 99.67% 100.00% 10 9 10
8 Prophylactic antibiotics discontinued within 24 hours after surgery end time 99.68% 95.07% 94.79% 99.67% 9 9 9
9 Cardiac surgery patients with controlled 6AM postoperative serum glucose 99.63% 94.28% 100.00% 98.85% 8 0 8
10 Recommended VTE prophylaxis ordered 100.00% 95.00% 98.18% 100.00% 10 9 10
11 Received appropriate VTE prophylaxis within 24 hours prior - 24 hours after surgery 99.85% 93.07% 96.36% 100.00% 10 9 10
12 Patients on beta blocker therapy prior to admit who received a beta blocker during perioperative period 100.00% 93.99% 96.90% 98.97% 8 6 8
91.11%
Clinical Process of Care MeasuresNational Baseline
Performance Period: July 2011 - March 2012
Green
Heart Attack
Pneumonia
Surgical Care Improvement
Project
Score:
17
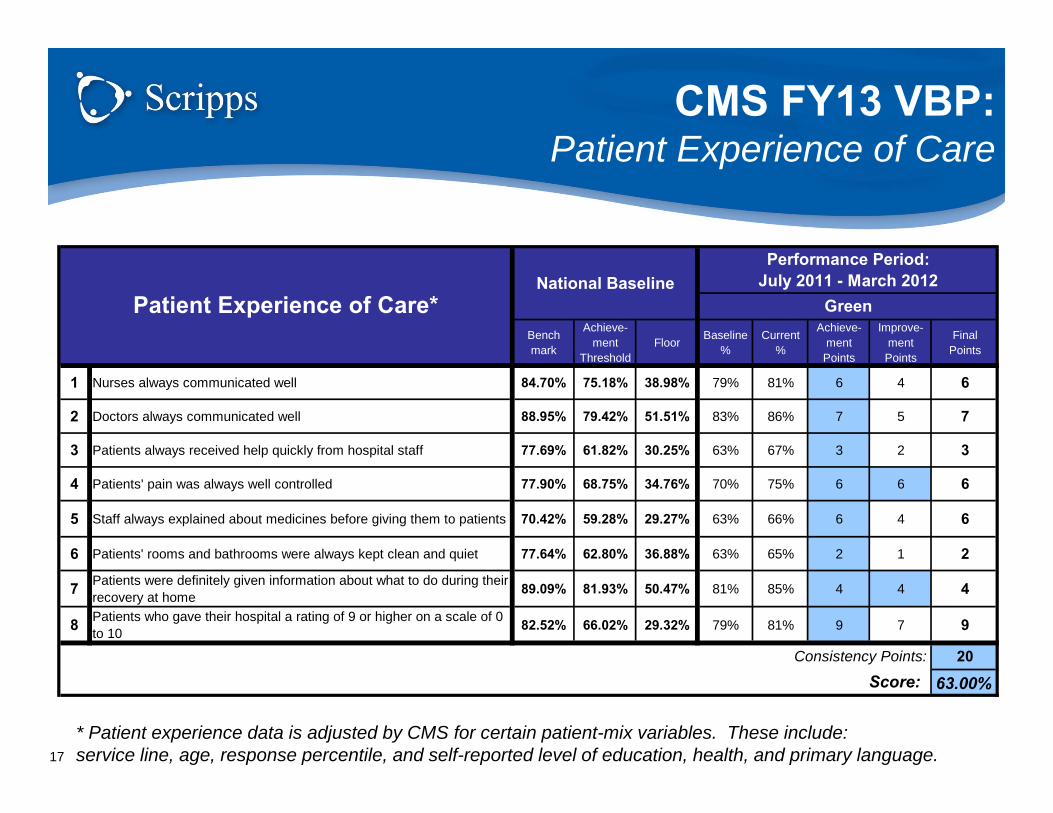
* Patient experience data is adjusted by CMS for certain patient-mix variables. These include: service line, age, response percentile, and self-reported level of education, health, and primary language.
CMS FY13 VBP:Patient Experience of Care
Benchmark
Achieve-ment
ThresholdFloor Baseline
%Current
%
Achieve-ment Points
Improve-ment Points
Final Points
1 Nurses always communicated well 84.70% 75.18% 38.98% 79% 81% 6 4 6
2 Doctors always communicated well 88.95% 79.42% 51.51% 83% 86% 7 5 7
3 Patients always received help quickly from hospital staff 77.69% 61.82% 30.25% 63% 67% 3 2 3
4 Patients' pain was always well controlled 77.90% 68.75% 34.76% 70% 75% 6 6 6
5 Staff always explained about medicines before giving them to patients 70.42% 59.28% 29.27% 63% 66% 6 4 6
6 Patients' rooms and bathrooms were always kept clean and quiet 77.64% 62.80% 36.88% 63% 65% 2 1 2
7 Patients were definitely given information about what to do during their recovery at home 89.09% 81.93% 50.47% 81% 85% 4 4 4
8 Patients who gave their hospital a rating of 9 or higher on a scale of 0 to 10 82.52% 66.02% 29.32% 79% 81% 9 7 9
20
63.00%
Patient Experience of Care*National Baseline
Performance Period: July 2011 - March 2012
Green
Score: Consistency Points:
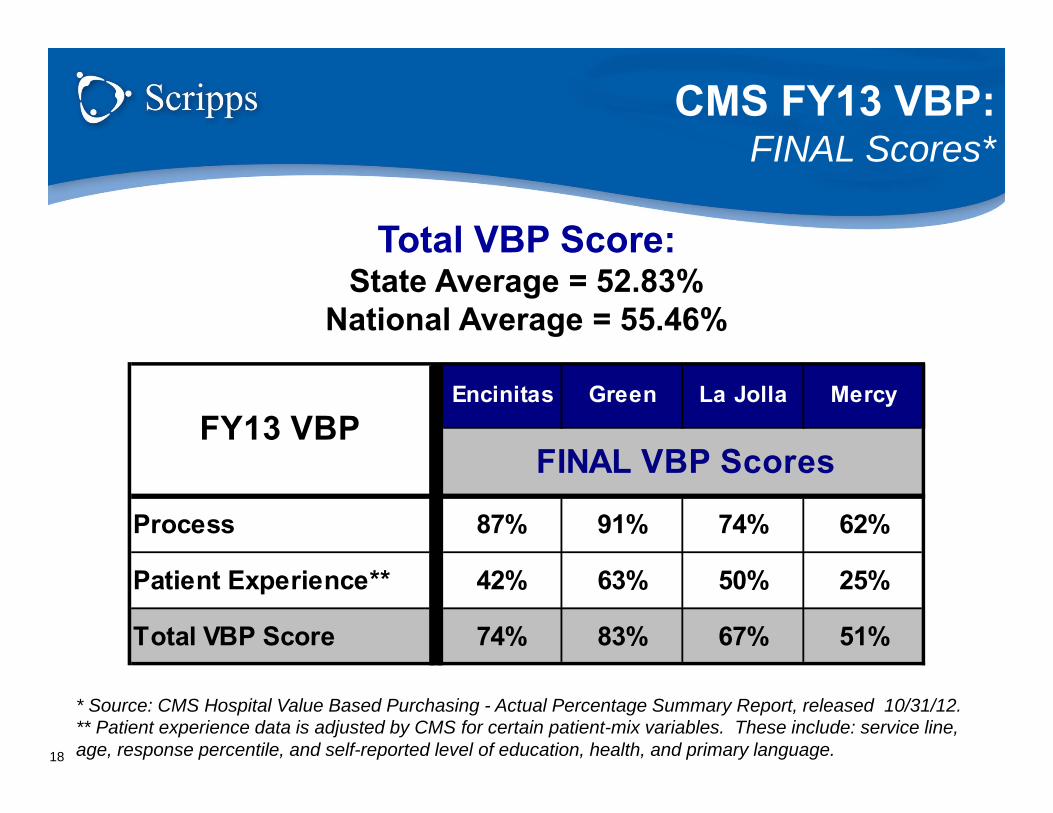
CMS FY13 VBP:FINAL Scores*
Total VBP Score:State Average = 52.83%
National Average = 55.46%
18
Encinitas Green La Jolla Mercy
Process 87% 91% 74% 62%
Patient Experience** 42% 63% 50% 25%
Total VBP Score 74% 83% 67% 51%
FINAL VBP ScoresFY13 VBP
* Source: CMS Hospital Value Based Purchasing - Actual Percentage Summary Report, released 10/31/12. ** Patient experience data is adjusted by CMS for certain patient-mix variables. These include: service line, age, response percentile, and self-reported level of education, health, and primary language.

• FY13 VBP Data Collection Periods:– Baseline Performance: July 2009 – March 2010– Current Performance: July 2011 – March 2012
• October 31, 2012: – CMS sent hospitals the Actual Payment Percentage
Summary Report
• January 1, 2013: – Incorporate 1% reduction and value-based incentive
payment simultaneously
CMS FY13 VBP: Performance Periods and Timeline
19
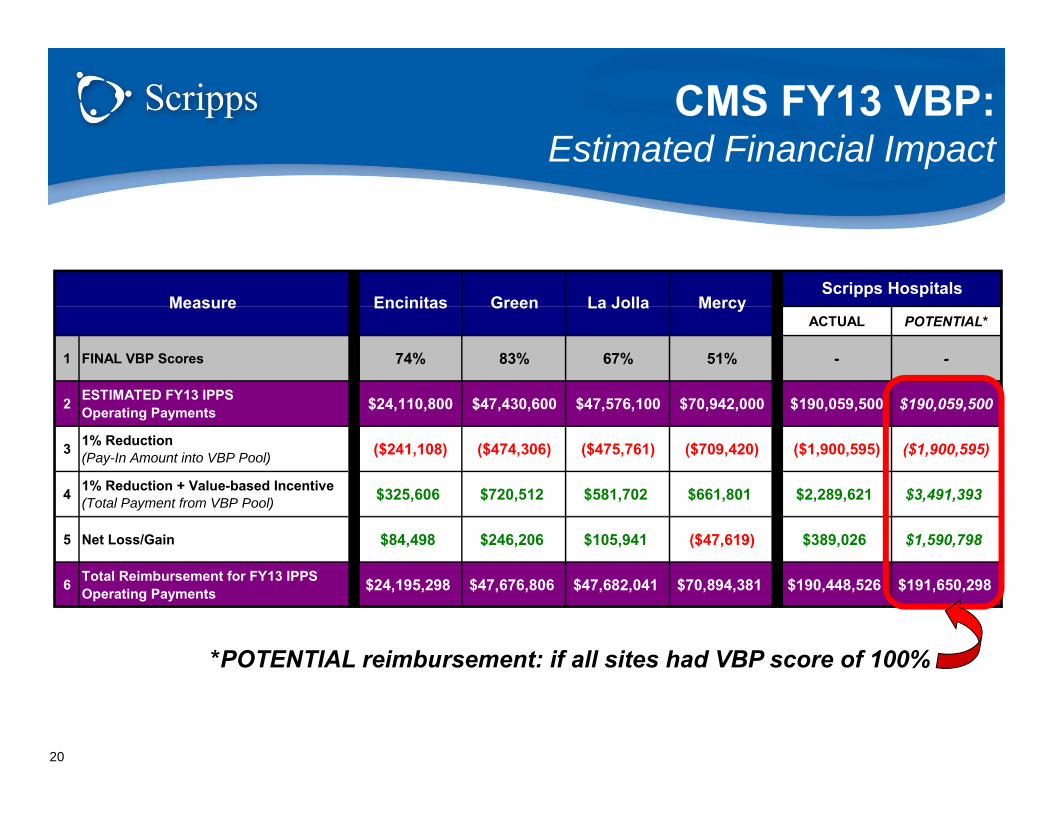
ACTUAL POTENTIAL*
1 FINAL VBP Scores 74% 83% 67% 51% - -
2 ESTIMATED FY13 IPPS Operating Payments $24,110,800 $47,430,600 $47,576,100 $70,942,000 $190,059,500 $190,059,500
3 1% Reduction (Pay-In Amount into VBP Pool) ($241,108) ($474,306) ($475,761) ($709,420) ($1,900,595) ($1,900,595)
4 1% Reduction + Value-based Incentive(Total Payment from VBP Pool) $325,606 $720,512 $581,702 $661,801 $2,289,621 $3,491,393
5 Net Loss/Gain $84,498 $246,206 $105,941 ($47,619) $389,026 $1,590,798
6 Total Reimbursement for FY13 IPPS Operating Payments $24,195,298 $47,676,806 $47,682,041 $70,894,381 $190,448,526 $191,650,298
Scripps HospitalsMeasure Encinitas Green La Jolla Mercy
CMS FY13 VBP:Estimated Financial Impact
*POTENTIAL reimbursement: if all sites had VBP score of 100%
20
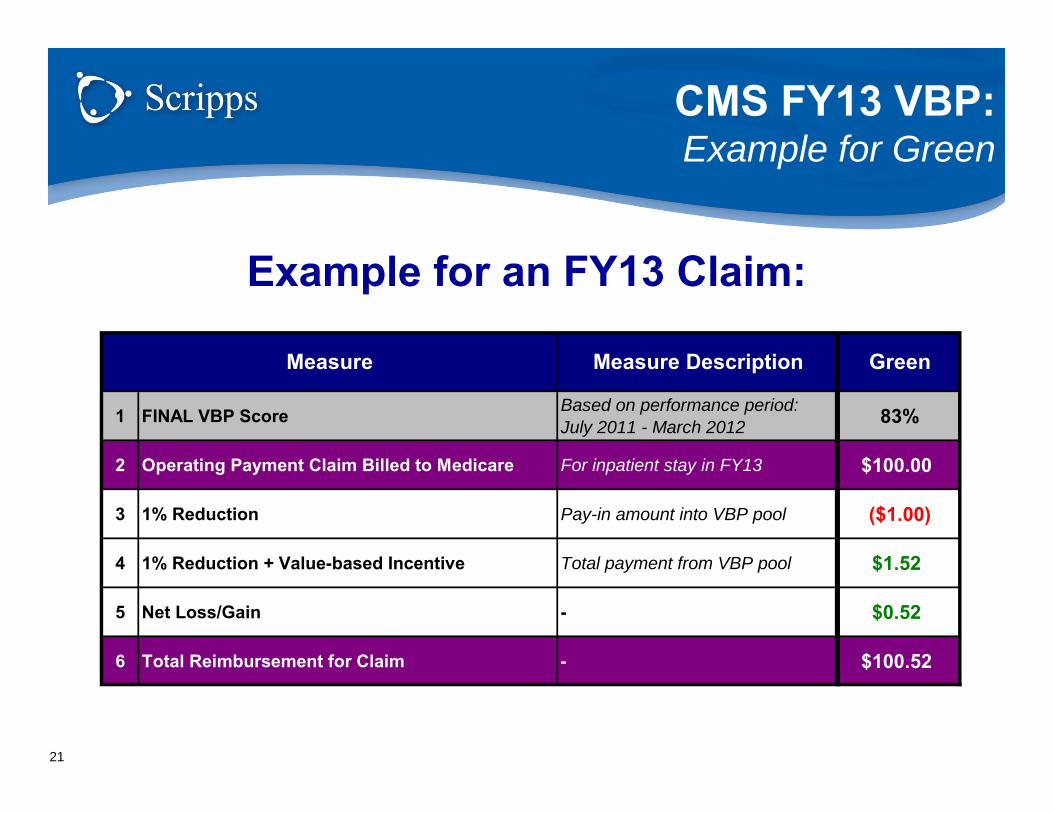
Example for an FY13 Claim:
1 FINAL VBP Score Based on performance period: July 2011 - March 2012 83%
2 Operating Payment Claim Billed to Medicare For inpatient stay in FY13 $100.00
3 1% Reduction Pay-in amount into VBP pool ($1.00)
4 1% Reduction + Value-based Incentive Total payment from VBP pool $1.52
5 Net Loss/Gain - $0.52
6 Total Reimbursement for Claim - $100.52
GreenMeasure Measure Description
21
CMS FY13 VBP:Example for Green
Process Measures Analysis
22
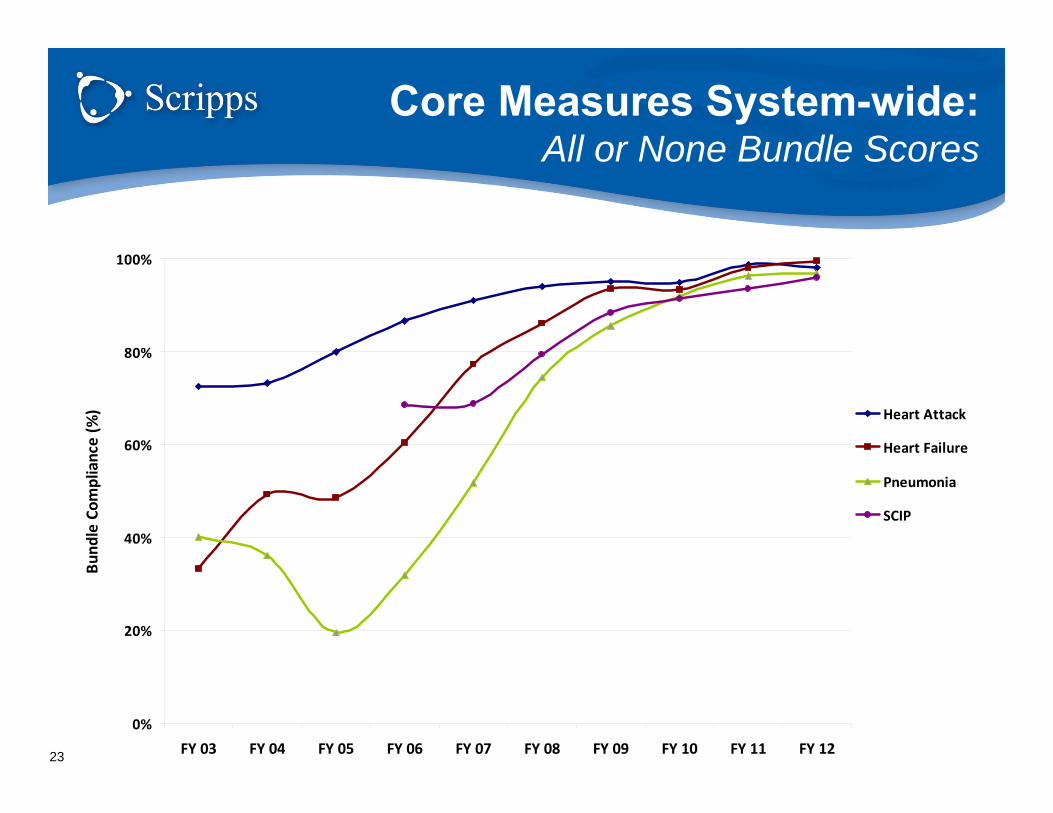
Core Measures System-wide:All or None Bundle Scores
0%
20%
40%
60%
80%
100%
FY 03 FY 04 FY 05 FY 06 FY 07 FY 08 FY 09 FY 10 FY 11 FY 12
Bund
le Com
pliance (%
) Heart Attack
Heart Failure
Pneumonia
SCIP
23

Core Measures System-wide:Heart Attack Bundle Scores
50%
60%
70%
80%
90%
100%
2005 2006 2007 2008 2009 2010 2011 2012
Bund
le Com
pliance (%
) Scripps
Top Decile
Top Quartile
Median
Bottom Quartile
Bottom Decile
24
# Hospitals for percentile ranks
= 540

Core Measures System-wide: Heart Failure Bundle Scores
0%
20%
40%
60%
80%
100%
2005 2006 2007 2008 2009 2010 2011 2012
Bund
le Com
pliance (%
)
Scripps
Top Decile
Top Quartile
Median
Bottom Quartile
Bottom Decile
25
# Hospitals for percentile ranks
= 582
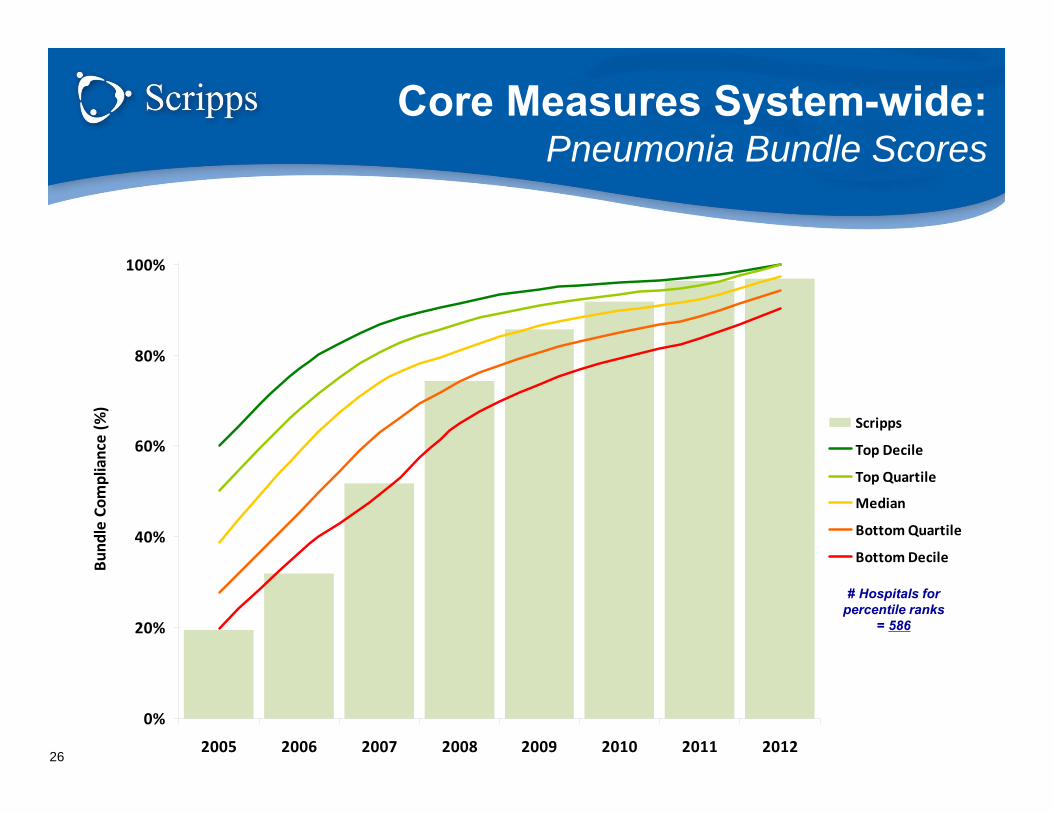
Core Measures System-wide: Pneumonia Bundle Scores
0%
20%
40%
60%
80%
100%
2005 2006 2007 2008 2009 2010 2011 2012
Bund
le Com
pliance (%
)
Scripps
Top Decile
Top Quartile
Median
Bottom Quartile
Bottom Decile
26
# Hospitals for percentile ranks
= 586

Core Measures System-wide: SCIP Bundle Scores
20%
40%
60%
80%
100%
2006 2007 2008 2009 2010 2011 2012
Bund
le Com
pliance (%
)
Scripps
Top Decile
Top Quartile
Median
Bottom Quartile
Bottom Decile
27
# Hospitals for percentile ranks
= 588
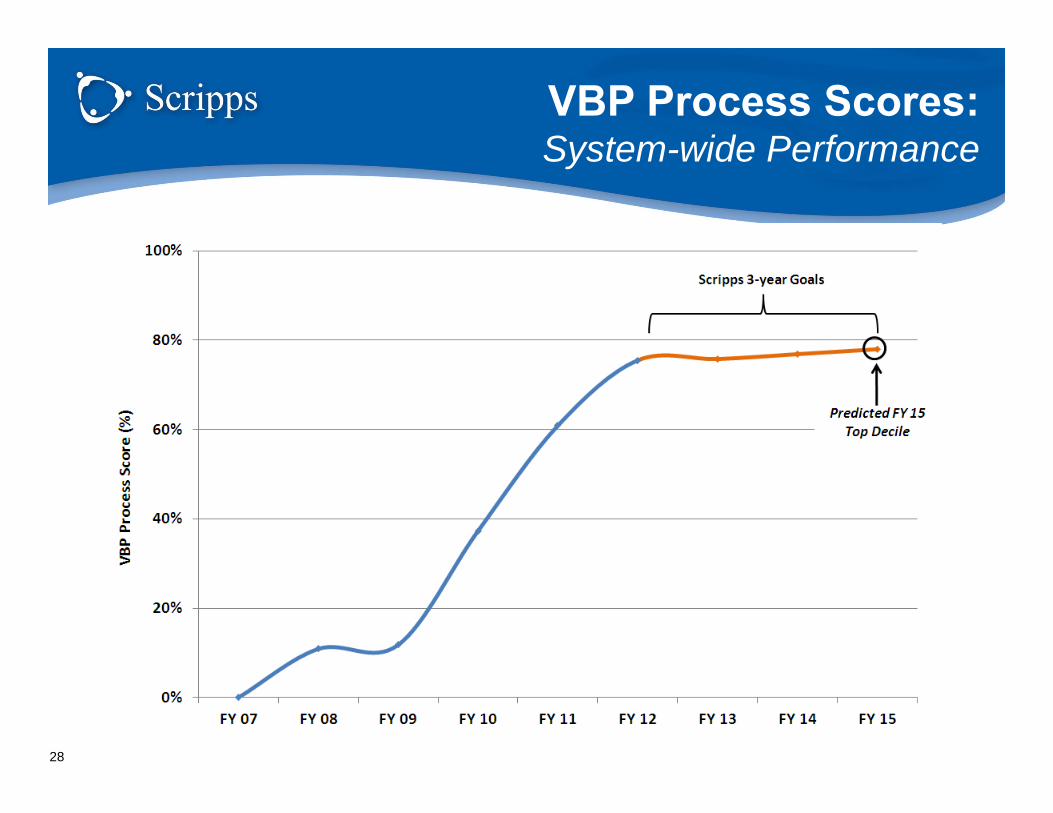
VBP Process Scores:System-wide Performance
28

Scripps Health Yearly Goals
Baseline performance*
(FY14 VBP Benchmarks)
FY13 Goal
(FY14 VBP Benchmarks)
72.5% 75.3% 76.6% 78%
3-year Goal = 78% Systemwide (National Predicted Top Decile)
FY14 Goal
(FY15 VBP Benchmarks)
FY15 Goal
(FY16 VBP Benchmarks)
29 *Based on system aggregate scores for the performance period of April to July 2012.
VBP Process Scores:System-wide Performance Objectives

30
Process Scores:Site Performance
National top decile for process bundle FY13 VBP

Legend:= M aximum of either achievement or improvement points= Current performance meeting FY12 Value-Based Purchasing Goal= Current performance below FY12 Value-Based Purchasing Goal
FY12 VBP Board Objective(using CMS FY13 Targets)
Bench-mark
Achieve-ment
Threshold
Current%
Current n
Final Points
Current%
Current n
Final Points
Current%
Current n
Final Points
Current%
Current n
Final Points
Current%
Current n
Final Points
1 Fibrinolytic therapy within 30 minutes 91.9% 65.5% - 0 Insuff icient Data
- 0 Insuff icient Data
- 0 Insuff icient Data
- 0 Insuff icient Data
- 0 Insuff icient Data
2 PCI within 90 minutes 100.0% 91.9% 95.4% 151 6 97.1% 34 6 100.0% 7 Insuff icient Data 97.0% 33 6 94.0% 84 6
Heart Failure 3 Discharge instructions 100.0% 90.8% 99.3% 1018 9 98.8% 171 8 100.0% 221 10 99.5% 187 9 99.1% 439 9
4 Blood cultures in ED before antibiotic 100.0% 96.4% 99.2% 770 8 99.5% 216 8 100.0% 8 Insuff icient Data 100.0% 148 10 98.8% 406 6
5 Appropriate antibiotic selection 99.6% 92.8% 99.0% 480 9 99.0% 99 9 98.2% 55 8 98.8% 85 9 99.2% 241 9
6Prophylactic antibiotic received within one hour prior to surgical incision 100.0% 97.4% 99.6% 1984 8 100.0% 313 10 99.8% 406 9 99.8% 538 9 99.2% 727 7
7Prophylactic antibiotic selection for surgical patients 100.0% 97.7% 99.5% 1991 8 99.4% 314 7 100.0% 407 10 99.1% 540 6 99.7% 730 8
8Prophylactic antibiotics discontinued within 24 hours after surgery end time 99.7% 95.1% 99.1% 1895 8 99.7% 297 9 99.0% 399 8 99.2% 503 9 98.9% 696 8
9Cardiac surgery patients with controlled 6AM postoperative serum glucose 99.6% 94.3% 96.0% 446 3 - 0 Insuff icient
Data99.2% 123 9 96.5% 173 4 92.7% 150 1
10 Recommended VTE prophylaxis ordered 100.0% 95.0% 99.1% 1948 8 100.0% 387 10 100.0% 368 10 98.3% 470 6 98.6% 723 7
11Received appropriate VTE prophylaxis within 24 hours prior - 24 hours after surgery 99.9% 93.1% 98.5% 1948 8 100.0% 387 10 100.0% 368 10 97.2% 470 7 97.8% 723 7
12Patients on beta blocker therapy prior to admit who received a beta blocker during perioperative period 100.0% 94.0% 98.7% 797 8 100.0% 91 10 99.3% 139 8 99.6% 266 9 97.3% 301 6
Surgical Care Improvement
Project
FY12 Score Goal
FY12-to-date Score 91.1% 76.4% 67.3%
National Baseline
Heart Attack
Performance Period: FY12 (August 2011 - July 2012)
Scripps Hospitals Encinitas Green La Jolla Mercy
75.5%
65.9% 65.9%67.7%90.6%67.0%
87.0%
Value-Based Purchasing Measures:Clinical Process of Care
Pneumonia
31
Bench-mark
Achieve-ment
Threshold
Current%
Current n
Final PointsBench-mark
Achieve-ment
Threshold
Current%
Current n
Final Points
1 Fibrinolytic therapy within 30 minutes 91.91% 65.48% - 0 Insuff icient Data 96.30% 80.66% - 0 Insuff icient
Data
2 PCI within 90 minutes 100.00% 91.86% 100.00% 7 Insuff icient Data 100.00% 93.44% - 0 Insuff icient
Data
Heart Failure 3 Discharge instructions 100.00% 90.77% 100.00% 221 10 100.00% 92.66% 100.00% 22 10
4 Blood cultures in ED before antibiotic 100.00% 96.43% 100.00% 8 Insuff icient Data 100.00% 97.30% - 0 Insuff icient
Data
5 Appropriate antibiotic selection 99.58% 92.77% 98.18% 55 8 100.00% 94.46% 100.00% 7 10
6Prophylactic antibiotic received within one hour prior to surgical incision 99.98% 97.35% 99.75% 406 9 100.00% 98.07% 96.88% 32 0
7 Prophylactic antibiotic selection for surgical patients 100.00% 97.66% 100.00% 407 10 100.00% 98.13% 100.00% 32 10
8Prophylactic antibiotics discontinued within 24 hours after surgery end time 99.68% 95.07% 99.00% 399 8 99.96% 96.63% 96.88% 32 1
9Cardiac surgery patients with controlled 6AM postoperative serum glucose 99.63% 94.28% 99.19% 123 9 100.00% 96.34% 100.00% 8 10
10Postoperative urinary catheter removal on post operative day 1 or day 2
n/a n/a n/a n/a n/a 99.89% 92.86% 100.00% 34 10
11 Recommended VTE prophylaxis ordered 100.00% 95.00% 100.00% 368 10 100.00% 95.65% 100.00% 8 10
12Received appropriate VTE prophylaxis within 24 hours prior - 24 hours after surgery 99.85% 93.07% 100.00% 368 10 100.00% 94.62% 100.00% 33 10
13Patients on beta blocker therapy prior to admit who received a beta blocker during perioperative period 100.00% 93.99% 99.28% 139 8 99.83% 94.92% 100.00% 33 10
Heart Attack
Pneumonia
Surgical Care Improvement
Project
90.6%
National Baseline
Green
91.1%
Value-Based Purchasing Measures:Clinical Process of Care
National Baseline
Green
FY13 Score ACTUAL
Performance Period: FY12 (August 2011 - July 2012)
Performance Period: FY13 (August 2012)
FY12 Score ACTUAL
FY12 Score GOAL 91.00%
81.00%
FY13 Score GOAL
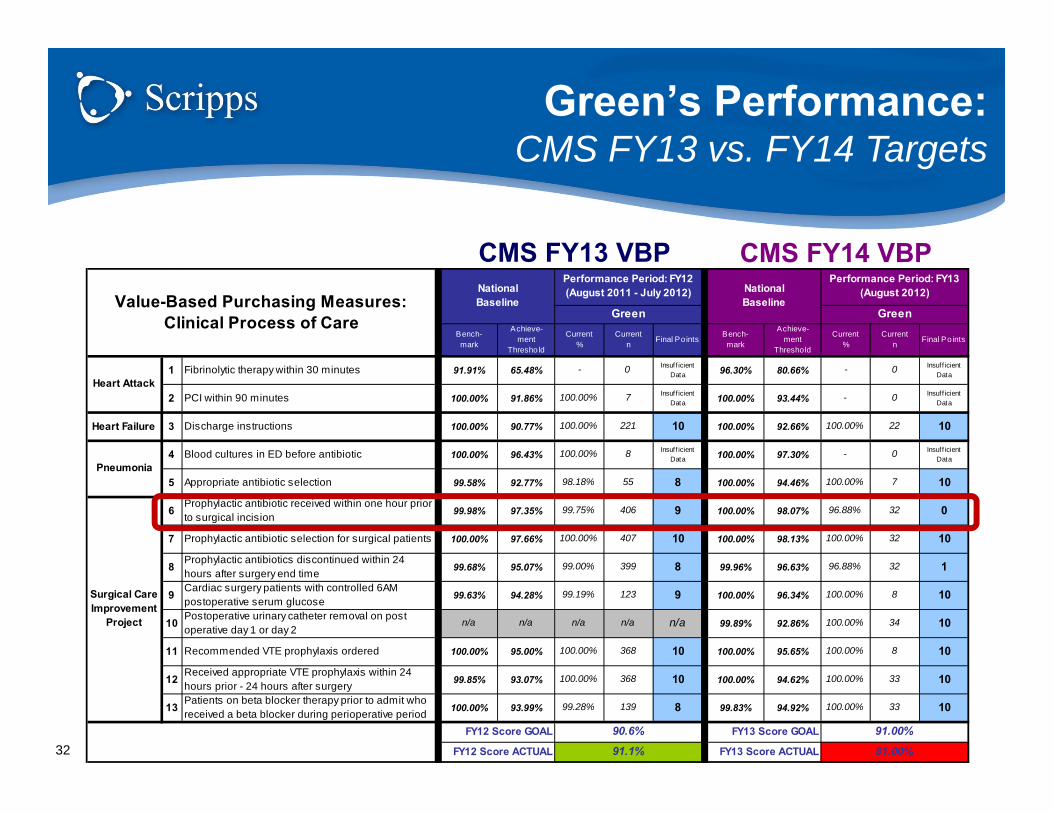
Green’s Performance:CMS FY13 vs. FY14 Targets
CMS FY13 VBP CMS FY14 VBP
32
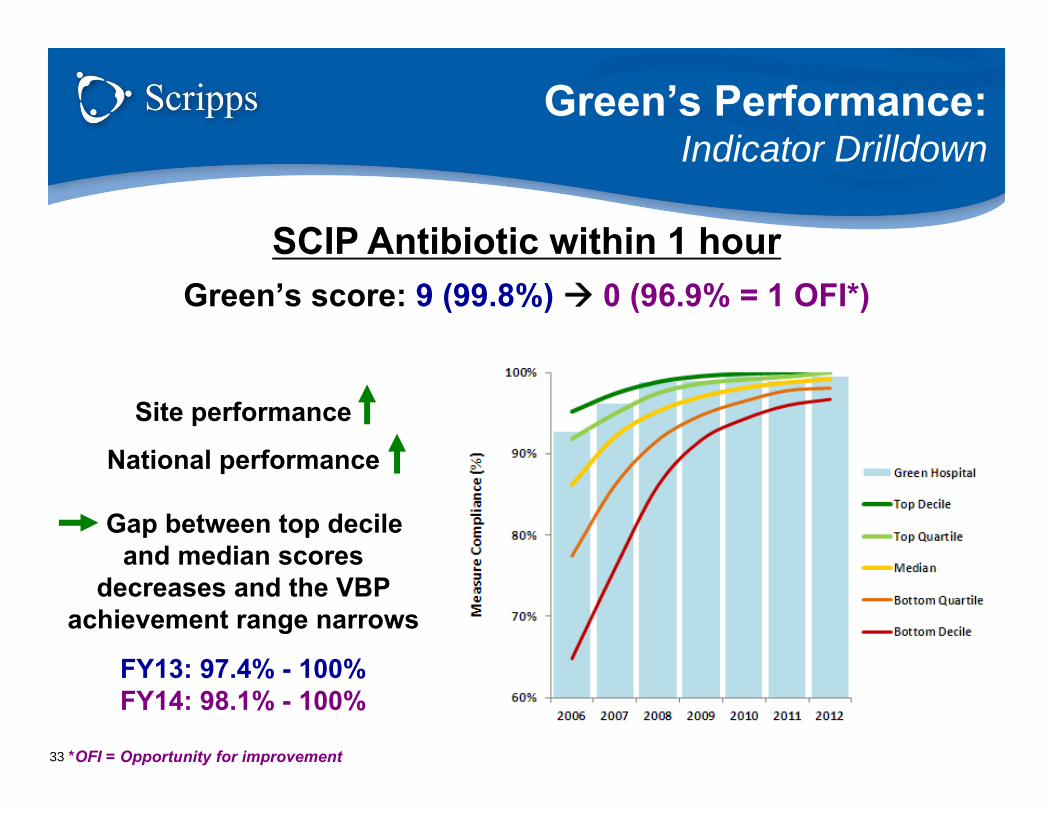
Green’s Performance:Indicator Drilldown
Site performance
National performance
Gap between top decile and median scores
decreases and the VBP achievement range narrows
FY13: 97.4% - 100%FY14: 98.1% - 100%
SCIP Antibiotic within 1 hourGreen’s score: 9 (99.8%) 0 (96.9% = 1 OFI*)
33 *OFI = Opportunity for improvement
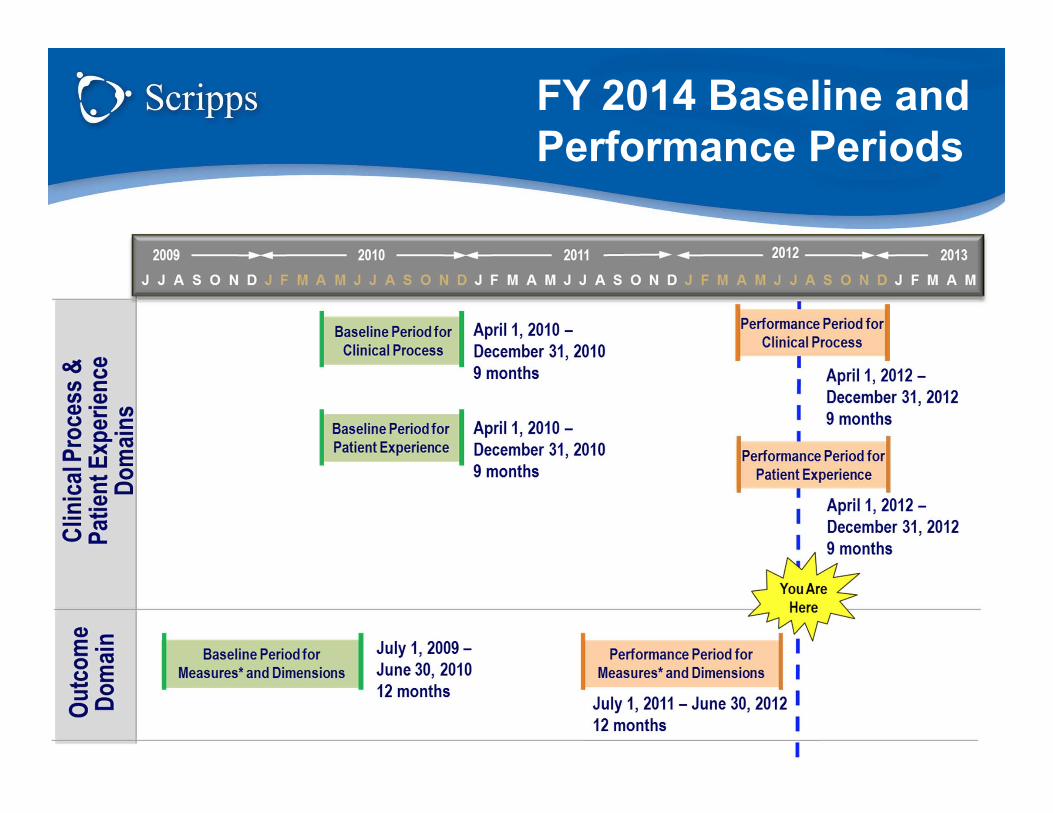
FY 2014 Baseline and Performance Periods
ACTUAL Performance Period: Apr 2012 – Dec 2012 CURRENT Performance Period: Apr 2012 – Sep 2012
35
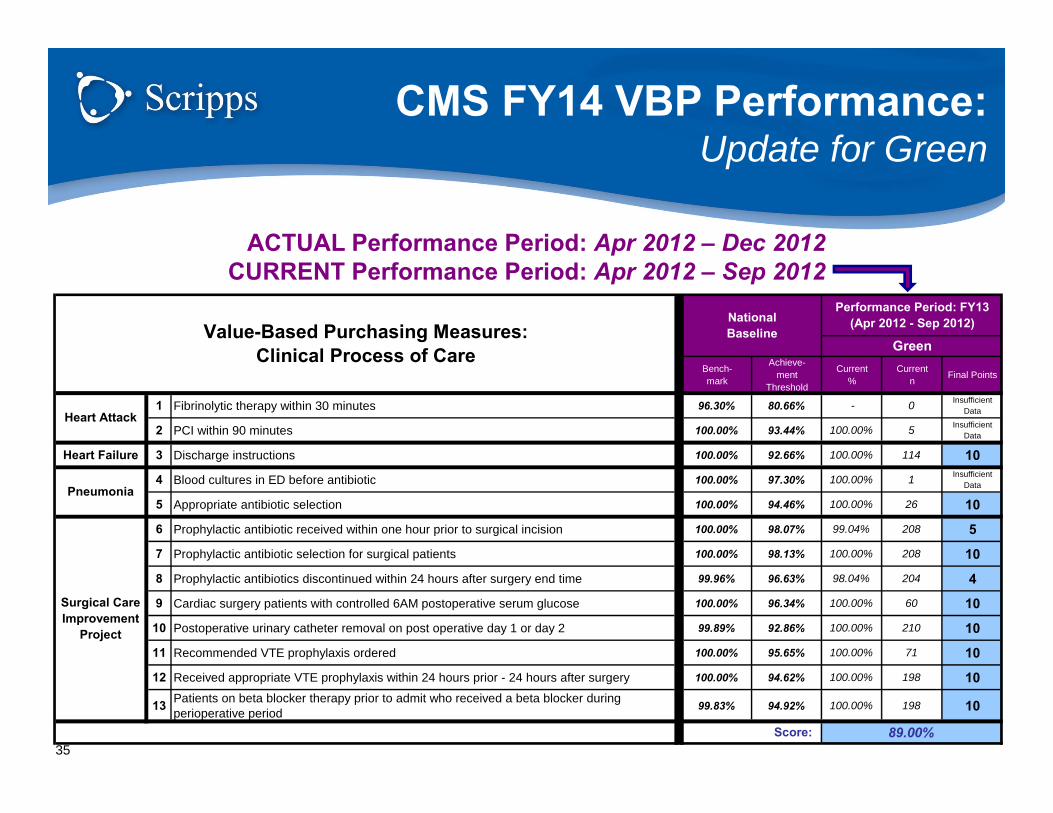
CMS FY14 VBP Performance:Update for Green
Bench-mark
Achieve-ment
Threshold
Current%
Current n Final Points
1 Fibrinolytic therapy within 30 minutes 96.30% 80.66% - 0 Insufficient Data
2 PCI within 90 minutes 100.00% 93.44% 100.00% 5 Insufficient Data
Heart Failure 3 Discharge instructions 100.00% 92.66% 100.00% 114 10
4 Blood cultures in ED before antibiotic 100.00% 97.30% 100.00% 1 Insufficient Data
5 Appropriate antibiotic selection 100.00% 94.46% 100.00% 26 10
6 Prophylactic antibiotic received within one hour prior to surgical incision 100.00% 98.07% 99.04% 208 5
7 Prophylactic antibiotic selection for surgical patients 100.00% 98.13% 100.00% 208 10
8 Prophylactic antibiotics discontinued within 24 hours after surgery end time 99.96% 96.63% 98.04% 204 4
9 Cardiac surgery patients with controlled 6AM postoperative serum glucose 100.00% 96.34% 100.00% 60 10
10 Postoperative urinary catheter removal on post operative day 1 or day 2 99.89% 92.86% 100.00% 210 10
11 Recommended VTE prophylaxis ordered 100.00% 95.65% 100.00% 71 10
12 Received appropriate VTE prophylaxis within 24 hours prior - 24 hours after surgery 100.00% 94.62% 100.00% 198 10
13 Patients on beta blocker therapy prior to admit who received a beta blocker during perioperative period 99.83% 94.92% 100.00% 198 10
Score: 89.00%
Heart Attack
Pneumonia
Surgical Care Improvement
Project
Value-Based Purchasing Measures:Clinical Process of Care
National Baseline
Performance Period: FY13 (Apr 2012 - Sep 2012)
Green
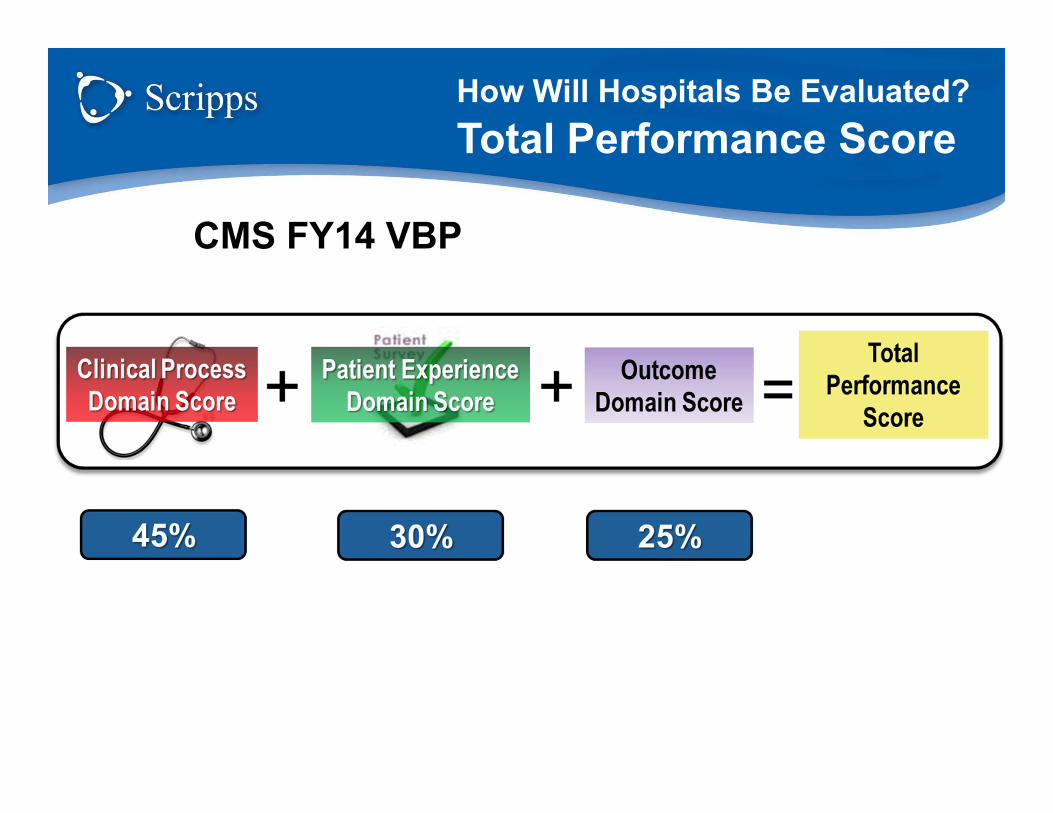
How Will Hospitals Be Evaluated?Total Performance Score
CMS FY14 VBP
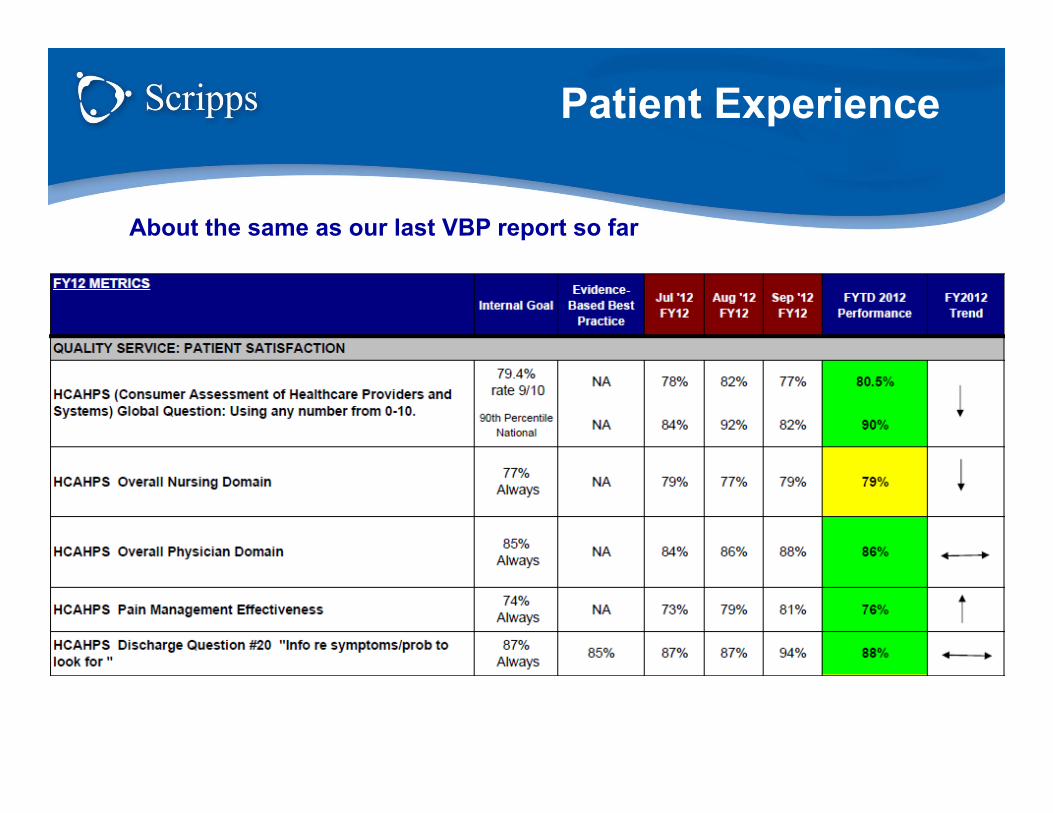
Patient Experience
About the same as our last VBP report so far
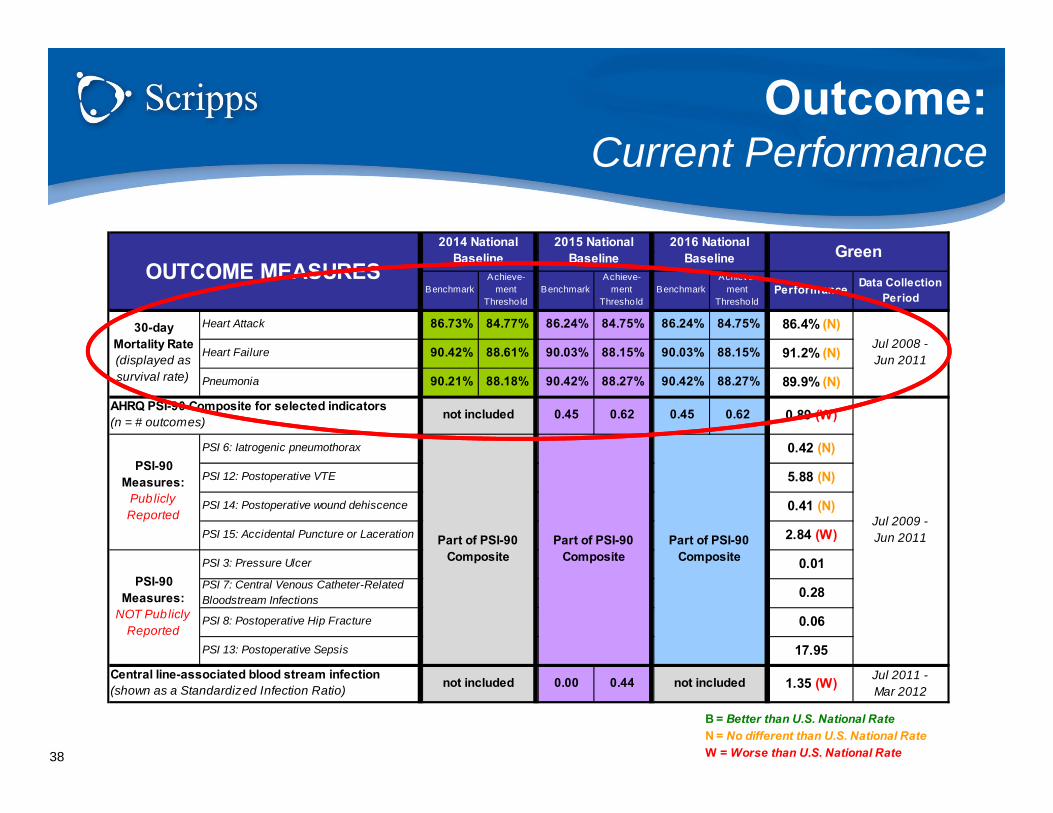
Outcome:Current Performance
38
B = Better than U.S. National RateN = No different than U.S. National RateW = Worse than U.S. National Rate
Performance Data Collection Period
Heart Attack 86.4% (N)
Heart Failure 91.2% (N)
Pneumonia 89.9% (N)
0.89 (W)
PSI 6: Iatrogenic pneumothorax 0.42 (N)
PSI 12: Postoperative VTE 5.88 (N)
PSI 14: Postoperative wound dehiscence 0.41 (N)
PSI 15: Accidental Puncture or Laceration 2.84 (W)
PSI 3: Pressure Ulcer 0.01PSI 7: Central Venous Catheter-Related Bloodstream Infections 0.28
PSI 8: Postoperative Hip Fracture 0.06
PSI 13: Postoperative Sepsis 17.95
1.35 (W) Jul 2011 - Mar 2012
AHRQ PSI-90 Composite for selected indicators(n = # outcomes)
30-day Mortality Rate (displayed as survival rate)
Central line-associated blood stream infection (shown as a Standardized Infection Ratio)
Green
Part of PSI-90 Composite
Part of PSI-90 Composite
Part of PSI-90 Composite
PSI-90 Measures:
NOT Publicly Reported
PSI-90 Measures:
Publicly Reported
not included 0.00 0.44 not included
Jul 2009 - Jun 2011
0.62not included 0.45 0.62 0.45
90.21% 88.18% 90.42% 88.27% 90.42% 88.27%
Jul 2008 - Jun 201190.42% 88.61% 90.03% 88.15% 90.03% 88.15%
BenchmarkAchieve-
mentThreshold
86.73% 84.77% 86.24% 84.75% 86.24% 84.75%
Achieve-ment
ThresholdBenchmark Benchmark
OUTCOME MEASURES2014 National
Baseline2015 National
Baseline2016 National
BaselineAchieve-
mentThreshold

VBP in FY16 and Beyond
39

40
*Six Domains:
1) Clinical Care
2) Person- and Caregiver-Centered Experience and Outcomes
3) Safety
4) Efficiency and Cost Reduction
5) Care Coordination
6) Community/ Population Health
CMS Shift for Quality Measurement:
Clinical Process Measures Outcomes and Efficiency Measures(not risk-adjusted) (risk-adjusted)
2013 2014 2015 2016
1.00% 1.25% 1.50% 1.75%
1 Process of Care 70% 45% 20%
2 Patient Experience 30% 30% 30%
3 Outcome - 25% 30%
4 Efficiency:Medicare Spending per Beneficiary - - 20%
VBP Fiscal Year
Reclassification of Domains:
National Quality Strategy*
% Program Contribution
VBP Program:Domain Overview

VBP FY16:Example of Reclassification
PROPOSED FY 2015 Domain
PROPOSED FY 2016 Domain
Clinical Care
Care Coordination
Clinical Care
Clinical Care
Patient Experience of Care
Person- and Caregiver-Centered Experience
and Outcomes
Clinical Care
Safety
Safety
Efficiency Efficiency and Cost Reduction
Pneumonia
Heart Failure - Discharge instructions
Heart Attack
30-day Mortality - Heart Attack, Heart Failure, Pneumonia
Clinical Process of Care
OutcomePSI-90 Composite - Patient safety for selected indicators
Central line-associated blood stream infection
Medicare spending per beneficiary
PROPOSED FY 2015 Measures
HCAHPS Questions
Surgical Care Improvement Project
41

SUMMARY
• The CMS VBP is how Medicare is paying us from here on out
• The top performers make money the poor performers have money taken away
• SGH is performing well but did not receive full opportunity payment
• Even 1 OFI impacts our final score• The bar keeps increasing as the nation
improves and as the measures evolve
Appendix
43
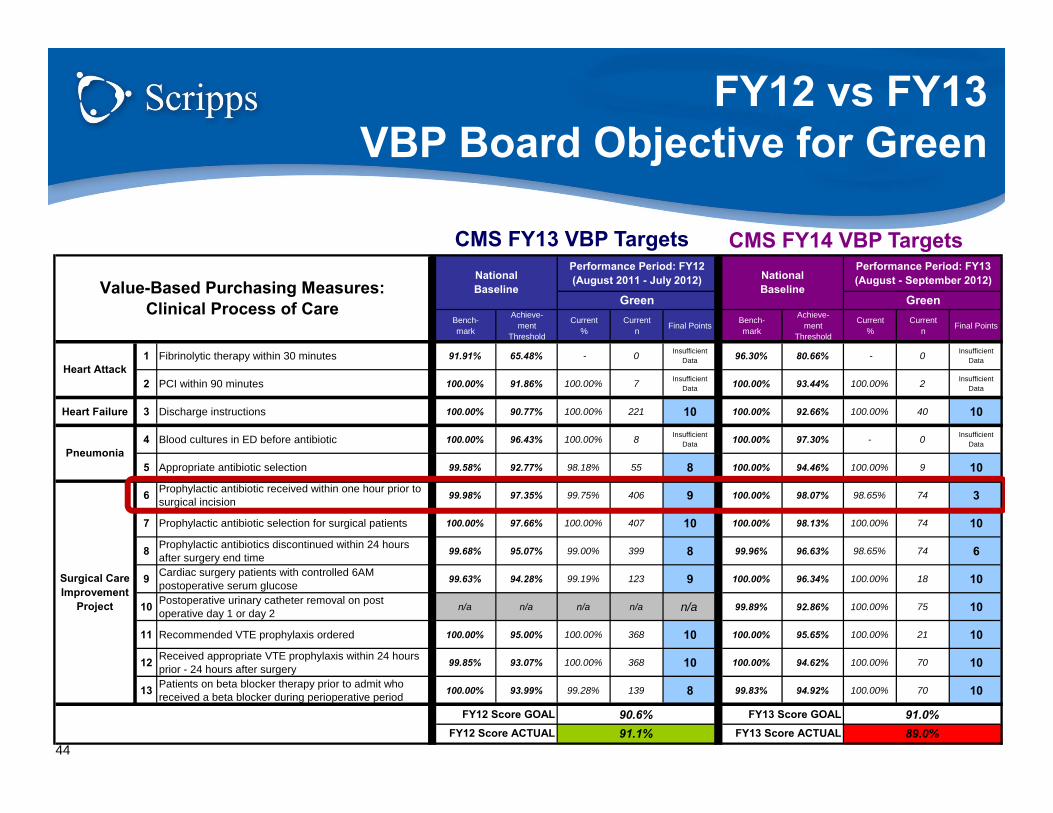
Bench-mark
Achieve-ment
Threshold
Current%
Current n Final Points Bench-
mark
Achieve-ment
Threshold
Current%
Current n Final Points
1 Fibrinolytic therapy within 30 minutes 91.91% 65.48% - 0 Insufficient Data 96.30% 80.66% - 0 Insufficient
Data
2 PCI within 90 minutes 100.00% 91.86% 100.00% 7 Insufficient Data 100.00% 93.44% 100.00% 2 Insufficient
Data
Heart Failure 3 Discharge instructions 100.00% 90.77% 100.00% 221 10 100.00% 92.66% 100.00% 40 10
4 Blood cultures in ED before antibiotic 100.00% 96.43% 100.00% 8 Insufficient Data 100.00% 97.30% - 0 Insufficient
Data
5 Appropriate antibiotic selection 99.58% 92.77% 98.18% 55 8 100.00% 94.46% 100.00% 9 10
6 Prophylactic antibiotic received within one hour prior to surgical incision 99.98% 97.35% 99.75% 406 9 100.00% 98.07% 98.65% 74 3
7 Prophylactic antibiotic selection for surgical patients 100.00% 97.66% 100.00% 407 10 100.00% 98.13% 100.00% 74 10
8 Prophylactic antibiotics discontinued within 24 hours after surgery end time 99.68% 95.07% 99.00% 399 8 99.96% 96.63% 98.65% 74 6
9 Cardiac surgery patients with controlled 6AM postoperative serum glucose 99.63% 94.28% 99.19% 123 9 100.00% 96.34% 100.00% 18 10
10 Postoperative urinary catheter removal on post operative day 1 or day 2 n/a n/a n/a n/a n/a 99.89% 92.86% 100.00% 75 10
11 Recommended VTE prophylaxis ordered 100.00% 95.00% 100.00% 368 10 100.00% 95.65% 100.00% 21 10
12 Received appropriate VTE prophylaxis within 24 hours prior - 24 hours after surgery 99.85% 93.07% 100.00% 368 10 100.00% 94.62% 100.00% 70 10
13 Patients on beta blocker therapy prior to admit who received a beta blocker during perioperative period 100.00% 93.99% 99.28% 139 8 99.83% 94.92% 100.00% 70 10
National Baseline
Green
Heart Attack
Pneumonia
Surgical Care Improvement
Project
Value-Based Purchasing Measures:Clinical Process of Care
National Baseline
Green
FY13 Score ACTUAL
Performance Period: FY12 (August 2011 - July 2012)
Performance Period: FY13 (August - September 2012)
FY12 Score ACTUAL
FY12 Score GOAL 91.0%89.0%
FY13 Score GOAL
91.1%90.6%
CMS FY13 VBP Targets CMS FY14 VBP Targets
44
FY12 vs FY13 VBP Board Objective for Green

VBP Board Objective:Indicator Drilldown for Green
Site performance
National performance
Gap between top decile and median scores
decreases and the VBP achievement range narrows
FY13: 97.35% - 100%FY14: 98.07% - 100%
SCIP Antibiotic within 1 hourGreen’s score: 9 (99.75%) 3 (98.65% = 1 OFI*)
45 *OFI = Opportunity for improvement

46
VBP Program:Performance Periods Overview
2013 VBP 2014 VBP 2015 VBP
1.00% 1.25% 1.50%weight 70% 45% 20%
All except AMI-10 Jul 1, 2011 - Mar 31, 2012 Apr 1, 2012 - Dec 31, 2012 Jan 1, 2013 - Dec 31, 2013
Only AMI-10 - - Apr 1, 2013 - Dec 31, 2013
weight 30% 30% 30%HCAHPS Jul 1, 2011 - Mar 31, 2012 Apr 1, 2012 - Dec 31, 2012 Jan 1, 2013 - Dec 31, 2013
weight 0% 25% 30%Mortality - Jul 1, 2011 - Jun 30, 2012 Oct 1, 2012 - Jun 30, 2013
AHRQ - - Oct 15, 2012 - Jun 30, 2013
CLABSI - - Jan 26, 2013 - Dec 31, 2013
weight 0% 0% 20%MSPB - - May 1, 2013 - Dec 31, 2013
Efficiency
VBP Fiscal Year
Outcome
Patient Experience of Care
Process of Care
% Program Contribution
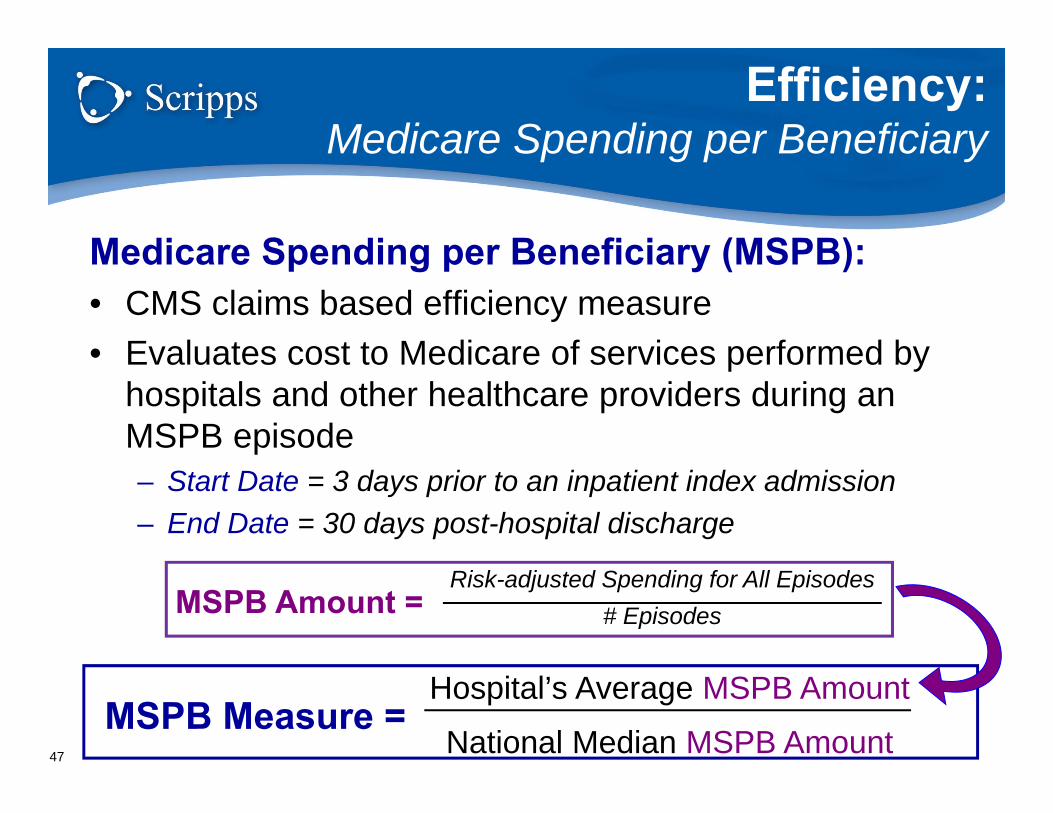
Medicare Spending per Beneficiary (MSPB):• CMS claims based efficiency measure• Evaluates cost to Medicare of services performed by
hospitals and other healthcare providers during an MSPB episode– Start Date = 3 days prior to an inpatient index admission– End Date = 30 days post-hospital discharge
MSPB Measure =Hospital’s Average MSPB Amount
National Median MSPB Amount
Risk-adjusted Spending for All Episodes# Episodes MSPB Amount =
Efficiency:Medicare Spending per Beneficiary
47

• Price-standardization– Removes sources of variation that are due to
geographic payment differences– Variables: wage index, geographic practice
cost differences, disproportionate share hospital (DSH) payments for the poor and uninsured population
• Risk-adjustment– Accounts for variation due to patient health
status– Variables: age and severity of illness
Efficiency:Measure Methodology
48
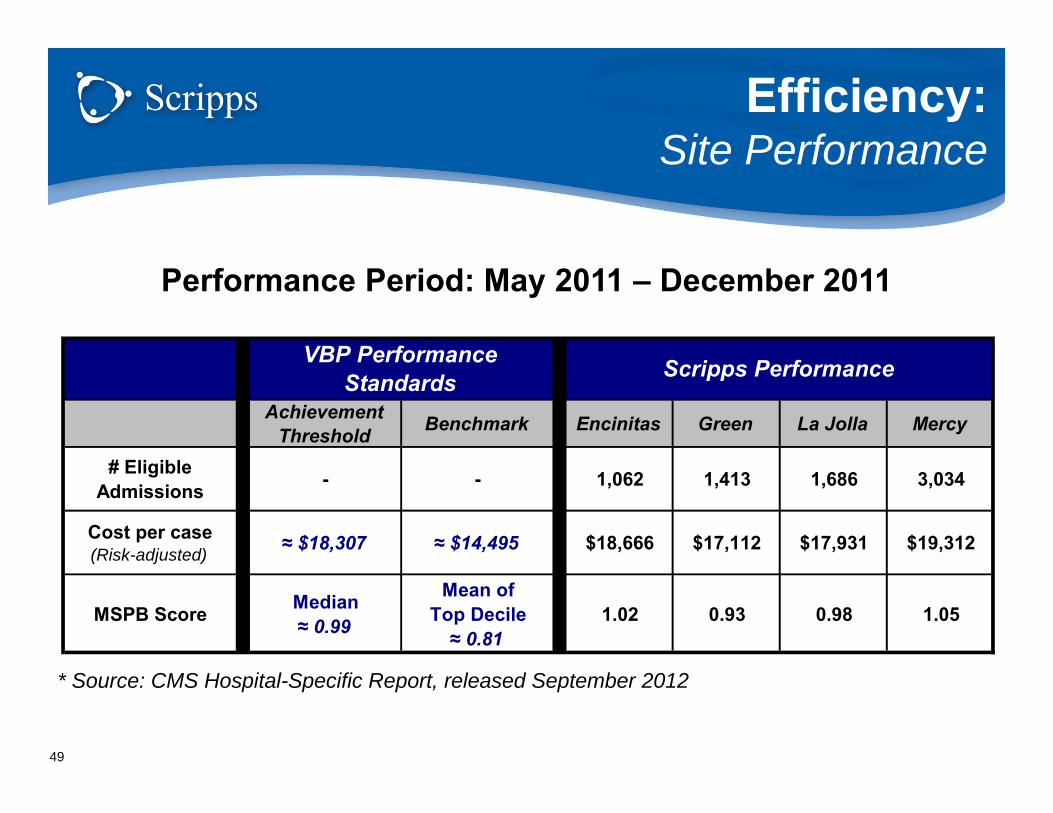
Performance Period: May 2011 – December 2011
* Source: CMS Hospital-Specific Report, released September 2012
AchievementThreshold Benchmark Encinitas Green La Jolla Mercy
# Eligible Admissions - - 1,062 1,413 1,686 3,034
Cost per case(Risk-adjusted) ≈ $18,307 ≈ $14,495 $18,666 $17,112 $17,931 $19,312
MSPB Score Median ≈ 0.99
Mean of Top Decile ≈ 0.81
1.02 0.93 0.98 1.05
Scripps PerformanceVBP Performance Standards
Efficiency:Site Performance
49
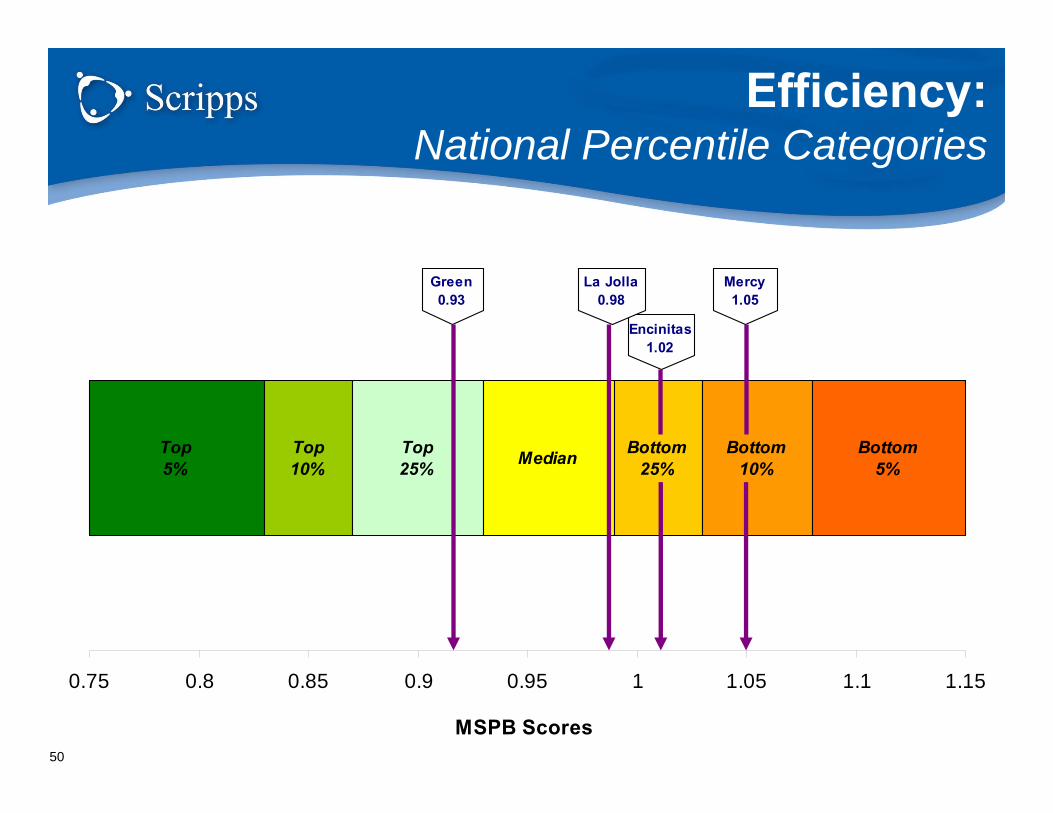
Top 5%
Top 10%
Top 25% Median Bottom
25% Bottom
10%Bottom
5%
0.75 0.8 0.85 0.9 0.95 1 1.05 1.1 1.15
MSPB Scores
Mercy1.05
Encinitas1.02
La Jolla0.98
Green0.93
Efficiency:National Percentile Categories
50