value chain analysis and identification of upgrading
TRANSCRIPT

VALUE CHAIN ANALYSIS AND IDENTIFICATION OF UPGRADING OPTIONS FOR EUCALYPTUS POLES AND FUELWOOD IN SIDAMA. THE CASE OF HAWASSA
ZURIA DISTRICT, SOUTHERN ETHIOPIA
In the fulfillment of the requirements for the academic degree of
Master of Science (MSc.)
In Tropical Forestry and Management By: Asabeneh Alemayehu Munuyee
Supervisor: Dr. rer. nat. Eckhard Auch
Institute of International Forestry and Forest Products, Faculty of Environmental Sciences
Technische Universität Dresden, Germany
Co-supervisor: Prof. Dr. Tsegaye Bekele
Hawassa University, Wondo Genet College of Forestry and Natural Resources, Wondo
Genet, Ethiopia
Faculty of the Environmental Sciences, Department of Forest Sciences, Institute of International Forestry
and Forest Products, Technische Universität Dresden.
Date of submission: November 09, 2018
Permitted/not permitted for lending
Dresden, ............................... ………………………………………
Head of the Examination Boar

i
Declaration
I hereby assert that this thesis entitled ‘The Value Chain Analysis and Identification of Upgrading Options
for Eucalyptus Pole and Fuelwood in Sidama, the case of Hawassa Zuria District, Southern Ethiopia’ is my
own work and that all sources of materials used for this thesis have been duly acknowledged. This thesis
is submitted in partial fulfillment of the requirements for MSc. Degree in Tropical Forestry at Technische
Universität Dresden (TUD). I solemnly declare that this thesis is not submitted to any other institution
anywhere for the award of an academic degree, diploma, or certificate.
In agreement with the supervisors, the connection with the enterprise, state organs or institutions, etc. was
only created in the cases referred to in the thesis.
Place and date ........................................... Signature................................

ii
SLUB using permission
Herewith I entitle the Library Saechsische Landesbibliothek – Staats- und Universitaetsbibliothek Dresden,
Zweigbibliothek Forstwesen, to make available in their premises my Master thesis for all kind of library
usage including reference library.
…………………. ……………………………………..
Date Signature

iii
ACKNOWLEDGMENT
First of all, I would like to thank the Almighty God and Saint Marry, for giving me the aptitude, endurance,
determination, and guidance throughout the ups and downs of my life.
My profound sense of gratitude goes to my supervisor Dr. rer. nat. Eckhard Auch, TU Dresden for his
continuous support, encouragement and patient instructions which have always boosted my confidence. I
humbly thank for his illuminating guidance, perceptual interest, valuable suggestions and ever helping mind
at every step throughout my study. I am also much indebted to my co-advisors Prof. Dr. Tsegaye Bekele,
Hawassa University Wondo Genet College of Forestry and Natural Resource for his constructive comments
throughout the study period and proper guidance and practical suggestions during field research at
Chefasine kebele, Sidama zone that enabled me to collect relevant data for my thesis. Similarly, I would
like to thank Dr. Jude N. Kimengsi (Postdoc student - TU Dresden), Mr. Christopher Chesire and Mr. Hingi
Ombeni, Tropical Forestry master students, for their genuine suggestions and critical comments.
I extend my sincerest thanks to Deutsche Akademische Austauschdienst e.V (DAAD) for providing an
opportunity to study Tropical Forestry and for their both financial and logistic support. It is my great
pleasure to thank the WoodCluster project and all staffs of the project (Prof. Dr. rer. nat. Jürgen Pretzsch,
Dr. Maxi Domke and others) from TU Dresden for the coordination and follow-up. I am grateful to all the
professors, lecturers, and Tropical Forestry coordinators for their invaluable support throughout my study
period here in Germany.
My thank also goes to Chefasine kebele administrators, development agents and expertise, Tulla and
Hawassa traders, tree growers, constructors, carpenters, Hawassa Environment, Forest and Climate change
ministry and Hawassa Revenue and Customs Authority officials for their willingness and support during
my filed stay. Special thank goes to Mr. Taffesse and Mr. Belayneh for their assistance and guidance during
my data collection. Without their help and cooperation, the thesis would not be finalized. I also take this
opportunity to extend my sincerest thanks to all of my friends who showed collaboration when I was
collecting data and writing up the thesis.
Last but not least, I wish to express my highest gratitude to my families for their love, support, and
encouragement throughout my life. Special thanks go to my uncle Mr. Tadesse Belay and his wife Mrs.
Bayushe for their great advice and encouragement for my success.

iv
LIST OF ACRONYMS
CBA Commercial Bank of Ethiopia
Cm Centimeter
CSA Central Statistical Agency of Ethiopia
DA’s Developmental Agents
DAAD Deutsche Akademische Austauschdienst e.V
DBH Diameter at Brest Height
ETB Ethiopian Birr
FAO Food and Agriculture Organization
ha Hectare
HAF’s Homestead Agroforestry systems
HCRCA Hawassa City Revenue and Custom Authority
HEFRC Hawassa Environment and Forest Research Center
HMEFCC Hawassa Ministry of Environment, Forest and Climate Change
ILO International Labour Organisation
m Meter
NGO’s Non-Governmental Organizations
OECD Organization for Economic Co-operation and Development
PIP Participatory Innovative Platform
SIDA Swedish International Development Cooperation Agency
SNNP South Nation Nationalities and peoples of Ethiopia
SPSS Statistical Package for Social Sciences
TGA’s Tree grower associations
UNSO United Nations Statistical Office
TUD Technische Universität Dresden
US $ United States of America currency
VA Value Added
VCA Value Chain Analysis
WFP World Food Program

v
CONTENTS PAGE
ACKNOWLEDGMENT ........................................................................................................................... iii
LIST OF ACRONYMS ............................................................................................................................. iv
LIST OF FIGURES AND TABLES......................................................................................................... ix
ABSTRACT................................................................................................................................................ xi
CHAPTER ONE ......................................................................................................................................... 1
1 INTRODUCTION .............................................................................................................................. 1
1.1 Background of the study ............................................................................................................... 1
1.2 Problem of the statement .............................................................................................................. 3
1.3 Research objective and questions of the study ............................................................................. 4
1.4 Limitation of the study .................................................................................................................. 5
1.5 Organization of the thesis ............................................................................................................. 6
CHAPTER TWO ........................................................................................................................................ 7
2 LITERATURE REVIEW AND THEORETICAL FRAMEWORK ............................................. 7
2.1 Historical development and current status of Eucalyptus plantation in Ethiopia ......................... 7
2.2 Products and services from Eucalyptus woodlot .......................................................................... 9
2.3 Socio economic benefits of Eucalyptus species in Ethiopia ....................................................... 11
2.4 Eucalyptus and government in Ethiopia ..................................................................................... 11
2.5 Theoretical Framework ............................................................................................................... 12
2.5.1 Understanding the concept of value chain .......................................................................... 12
2.5.2 Theory of access ................................................................................................................. 14
2.5.3 Value chain governance (Coordination) ............................................................................. 14
2.5.4 Upgrading the value chain .................................................................................................. 16
2.6 Conceptual framework ................................................................................................................ 16
CHAPTER THREE .................................................................................................................................. 19
3 RESEARCH METHODOLOGY .................................................................................................... 19
3.1 Description of the study area ...................................................................................................... 19
vi
3.2 Agriculture and land holding size ............................................................................................... 20
3.3 Research design .......................................................................................................................... 21
3.4 Sources and methods of data collection ...................................................................................... 24
3.4.1 Primary data collection ....................................................................................................... 24
3.4.2 Secondary data collection ................................................................................................... 26
3.5 Sampling method and sampling procedures ............................................................................... 27
3.6 Reliability and validity of data .................................................................................................... 29
3.7 Analysis and presentation of data ............................................................................................... 29
3.7.1 Value chain mapping of Eucalyptus products .................................................................... 30
3.7.2 Quantifying the value chain ................................................................................................ 30
3.7.3 Economic analysis of the value chain ................................................................................. 30
3.7.4 Role of Eucalyptus pole and fuelwood for actor’s livelihood strategies ............................ 32
3.7.5 Regulating and supporting environment ............................................................................. 32
3.7.6 Mechanism of access .......................................................................................................... 33
3.7.7 Mechanisms of governance ................................................................................................ 33
3.7.8 Identifying options for upgrading ....................................................................................... 33
3.7.9 Data presentation ................................................................................................................ 33
CHAPTER FOUR .................................................................................................................................... 34
4 RESULTS .......................................................................................................................................... 34
4.1 Demographic characteristics of respondents. ............................................................................. 34
4.2 Eucalyptus woodlot and its status ............................................................................................... 35
4.3 Eucalyptus products from Chefasine .......................................................................................... 37
4.4 Eucalyptus products and their flow ............................................................................................ 40
4.5 Activities in the value chain of Eucalyptus products .................................................................. 42
4.6 Eucalyptus product value chain map and its linkages in the value chain ................................... 42
4.7 Value chain actors, characteristics and their function ................................................................ 47
4.8 Eucalyptus pole and fuelwood value added and its distribution along the chain ....................... 52
4.8.1 Quantifying flows of Eucalyptus pole value chain ............................................................. 52

vii
4.8.2 Quantifying the Eucalyptus fuelwood value chain ............................................................. 53
4.8.3 Economic calculation of Eucalyptus poles and fuelwood .................................................. 54
4.8.4 Value added and its distribution of Eucalyptus poles and fuelwood .................................. 60
4.9 The roles of Eucalyptus pole and fuelwood business to actor's livelihood strategies ................. 66
4.9.1 The livelihood strategies of actors ...................................................................................... 66
4.9.2 Contribution of Eucalyptus pole and fuelwood for the livelihood of actor’s ..................... 67
4.10 Regulating and supporting environment of Eucalyptus poles and fuelwood value chain .......... 72
4.11 Access and governance of the value chains ................................................................................ 74
4.11.1 Mechanisms of access control and maintenance................................................................. 74
4.11.2 Coordination and power distribution of the value chain. .................................................... 77
4.11.3 Value chain governance ...................................................................................................... 78
4.12 Options for upgrading and improving the value chain ............................................................... 80
4.12.1 Constraints and challenges of tree growers ........................................................................ 80
4.12.2 Constraints and challenges of traders ................................................................................. 80
4.12.3 Problems, challenges and constraints identified through PIP workshop at Hawassa ......... 81
4.12.4 Option to upgrade the chain from the PIP workshop .......................................................... 82
4.12.5 The role of cooperatives in upgrading the chain ................................................................. 84
CHAPTER FIVE ...................................................................................................................................... 85
5 DISCUSSION .................................................................................................................................... 85
5.1 Discussion of Methodology ........................................................................................................ 85
5.2 General discussion of results ...................................................................................................... 86
5.3 Upgrading options ...................................................................................................................... 90
CHAPTER SIX ......................................................................................................................................... 94
6 CONCLUSIONS AND RECOMMENDATIONS .......................................................................... 94
6.1 Conclusion .................................................................................................................................. 94
6.2 Recommendation ........................................................................................................................ 95
BIBLIOGRAPHY ..................................................................................................................................... 98
APPENDICES ......................................................................................................................................... 106

viii
Appendix I: Questionnaires for the in-depth interview, key informant and focus group discussion .... 106
Appendix II: Benefit, cost and margin of Eucalyptus pole and fuelwood at each actor level per hectare
per year. ................................................................................................................................................ 117
Appendix III: Gross margin of selected crops in Chefasine. ................................................................ 122
Appendix IV: Eucalyptus poles assortment and their respective price at different marketing places .. 128
Appendix V: Photos from the field survey ........................................................................................... 129

ix
LIST OF FIGURES AND TABLES
List of Figures
FIGURE 1. HISTORICAL DISTRIBUTION OF EUCALYPTUS IN ETHIOPIA ------------------------------------------------------------- 8 FIGURE 2. LAND ALLOCATION TREND FOR EUCALYPTUS PRODUCTION PER HECTARE PER HECTARE PER YEAR ----------- 9 FIGURE 4: CONCEPTUAL FRAMEWORK OF VALUE CHAIN ANALYSIS ADOPTED FROM ---------------------------------------- 18 FIGURE 5. MAP OF EUCALYPTUS PRODUCTION AND MARKETING AREAS, ORIGINATING FROM CHEFASINE KEBELE ---- 20 FIGURE 6. EUCALYPTUS COPPICE STANDS (LEFT) AND COMBINED GROWING OF KHAT, ENSET AND EUCALYPTUS (RIGHT). -------------------------------------------------------------------------------------------------------------------------------------------- 21 FIGURE 7: A SCHEMATIC DIAGRAM OF THE RESEARCH METHODOLOGIES APPLIED ------------------------------------------ 23 FIGURE 8. TYPES OF EUCALYPTUS PLANTATION DESIGNS AT CHEFASINE ----------------------------------------------------- 35 FIGURE 9. CURRENT WOODLOT PLANTATION AREAS IN CHEFASINE VILLAGE ----------------------------------------------- 36 FIGURE 10. MOTIVATION OF TREE GROWERS OF CHEFASINE TO PLANT AND MANAGE EUCALYPTUS. --------------------- 36 FIGURE 11. VOLUME DISTRIBUTION OF EUCALYPTUS AT THE AGE OF FIVE FOR DIFFERENT ROTATION PERIODS -------- 37 FIGURE 12. EUCALYPTUS PRODUCTS FLOW MAP FROM CHEFASINE TREE GROWER TO CONSUMER ------------------------ 41 FIGURE 13. EUCALYPTUS POLE VALUE CHAIN MAP ORIGINATED FROM CHEFASINE KEBELE.43FIGURE 14. EUCALYPTUS FUELWOOD VALUE CHAIN MAP ORIGINATED FROM CHEFASINE KEBELE. ----------------------------------------------------- 44 FIGURE 15. EUCALYPTUS COPPICE STAND (LEFT) AND NEWLY ESTABLISHED STAND (RIGHT). ----------------------------- 47 FIGURE 16. WORKERS AT HAWASSA POLE WHOLESALER AND RETAILERS MARKET, ARRANGING AND LOADING OF WOOD -------------------------------------------------------------------------------------------------------------------------------------------- 50 FIGURE 17. PROCESSING OF EUCALYPTUS FROM TREE GROWER TILL CONSUMERS. ----------------------------------------- 54 FIGURE 18. COST AND MARGIN DISTRIBUTION BY ACTORS AND SEGMENTS FOR EUCALYPTUS POLES FROM CHEFASINE TO TULLA (LINE 1) AND CHEFASINE TO HAWASSA TOWN (LINE 2). ---------------------------------------------------------------- 59 -------------------------------------------------------------------------------------------------------------------------------------------- 60 FIGURE 19. COST AND MARGIN DISTRIBUTION ACROSS DIFFERENT ACTORS IN EUCALYPTUS FUELWOOD VALUE CHAIN. -------------------------------------------------------------------------------------------------------------------------------------------- 60 FIGURE 20. VALUE ADDED AND ITS COMPOSITION OF EUCALYPTUS POLE ACTORS OF CHEFASINE TO TULLA (LINE 1) AND CHEFASINE TO HAWASSA (LINE 2). ------------------------------------------------------------------------------------------------- 62 -------------------------------------------------------------------------------------------------------------------------------------------- 63 FIGURE 21. DISTRIBUTION OF VALUE ADDED AND COST ALONG THE CHAIN FOR LINE ONE AND LINE TWO. ------------- 63 -------------------------------------------------------------------------------------------------------------------------------------------- 65 FIGURE 22. VALUE ADDED AND ITS COMPOSITION OF EUCALYPTUS FUELWOOD AT DIFFERENT LEVELS ALONG THE CHAIN. -------------------------------------------------------------------------------------------------------------------------------------------- 65 FIGURE 23. DISTRIBUTION OF VALUE ADDED AND COST ALONG THE CHAIN FOR EUCALYPTUS FUELWOOD. ------------- 65 FIGURE 24. LIVELIHOOD STRATEGIES OF CHEFASINE TREE GROWER. --------------------------------------------------------- 67 FIGURE 25. CONTRIBUTION OF EUCALYPTUS FOR CHEFASINE TREE GROWERS LIVELIHOOD. ------------------------------- 68 FIGURE 26. GROSS MARGIN, REVENUE AND VARIABLE COST OF SELECTED CROPS IN CHEFASINE. ------------------------ 69 FIGURE 27. THE AVERAGE INCOME DISTRIBUTION OF DIFFERENT LIVELIHOOD PORTFOLIOS OF CHEFASINE TREE
GROWERS. ------------------------------------------------------------------------------------------------------------------------------- 70 FIGURE 28. THE LIVELIHOOD CONTRIBUTION OF INCOME GENERATED FROM THE SALE OF EUCALYPTUS TO CHEFASINE TREE GROWERS ------------------------------------------------------------------------------------------------------------------------- 71 FIGURE 29. THE CONTRIBUTION OF INCOME FROM THE SALE OF EUCALYPTUS POLE AND FUELWOOD FOR TRADER’S LIVELIHOOD. ---------------------------------------------------------------------------------------------------------------------------- 71 FIGURE 30. PROBLEMS AND CHALLENGES TO TREE GROWERS FOR THE PRODUCTION OF EUCALYPTUS ------------------ 80 FIGURE 31. PROBLEMS AND CHALLENGES OF TRADERS FOR EUCALYPTUS MARKETING. ------------------------------------ 81 FIGURE 32. PROBLEMS AND CHALLENGES OF TREE GROWERS AND TRADERS ------------------------------------------------ 82 FIGURE 33. INTERVENTIONS OPTIONS FOR THE UPGRADING OF EUCALYPTUS POLE AND FUELWOOD VALUE CHAIN DEVELOPED FROM THE INTERVIEW AND PIP WORKSHOP ------------------------------------------------------------------------ 92
x
List of tables
TABLE 1: EUCALYPTUS PRODUCTS AND SERVICES IN ETHIOPIA. ..................................................................................... 9 TABLE 2. VALUE CHAIN GOVERNANCE TYPES AND THEIR DETERMINANTS. ................................................................. 15 TABLE 3. AVERAGE SELLING PRICE OF EUCALYPTUS POLES AT DIFFERENT NODS OF EUCALYPTUS POLES VALUE CHAIN. .................................................................................................................................................................................... 25 TABLE 4. SPACING USED FOR PLANTATION ESTABLISHMENT OF EUCALYPTUS WOODLOT. ........................................... 27 TABLE 5: SUMMARY TABLE FOR THE NUMBER OF RESPONDENTS FOR EUCALYPTUS POLE AND FUELWOOD ORIGINATED
FROM CHEFASINE KEBELE. .......................................................................................................................................... 28 TABLE 6. CHARACTERISTIC OF TREE GROWERS AND TRADERS FOR EUCALYPTUS PRODUCTS VALUE CHAIN ORIGINATED FROM CHEFASINE ........................................................................................................................................................ 34 TABLE 7. RANKED EUCALYPTUS PRODUCTS FROM CHEFASINE KEBELE. ...................................................................... 38 TABLE 8. DIFFERENT ASSORTMENT OF EUCALYPTUS POLES AND THEIR EXPECTED HARVESTING TIME FOR PLANTING AND
COPPICING STAND. ....................................................................................................................................................... 39 TABLE 9. ACTORS INVOLVED IN EUCALYPTUS PRODUCTION AND MARKETING ORIGINATING FROM CHEFASINE KEBELE. .................................................................................................................................................................................... 45 TABLE 10. SUMMARY OF BENEFIT AND COST OF POLE VALUE CHAIN FOR DIFFERENT ACTORS ORIGINATED FROM CHEFASINE (US $ PER HA). .......................................................................................................................................... 56 TABLE 11. SUMMARY OF BENEFIT, COST AND MARGIN DISTRIBUTION FROM FIVE LOADS OF FUELWOOD (1.06M3) FOR DIFFERENT ACTORS ALONG THE CHAIN (US $). ............................................................................................................ 57 TABLE 12. DISTRIBUTION OF COSTS AT DIFFERENT ACTOR LEVELS FOR POLE FROM CHEFASINE TO TULLA (LINE 1) AND CHEFASINE TO HAWASSA (LINE 2) (US $). .................................................................................................................. 58 TABLE 13. DISTRIBUTION OF COSTS AT DIFFERENT ACTOR LEVELS FOR EUCALYPTUS FUELWOOD VALUE CHAIN (US $ PER
5 DONKEY CARTLOADS). .............................................................................................................................................. 59 TABLE 14. VALUE ADDED AT DIFFERENT LEVELS ALONG THE CHAIN AND ITS DISTRIBUTION FOR CHEFASINE TO TULLA (LINE 1) AND CHEFASINE TO HAWASSA (LINE 2) (US $). ............................................................................................. 61 TABLE 15. COMMERCIALISATION MARGIN OF EUCALYPTUS POLE FOR DIFFERENT ACTORS ALONG THE CHAIN AT LINE ONE AND LINE TWO. ............................................................................................................................................................ 63 TABLE 16. VALUE ADDED OF EUCALYPTUS FUELWOOD AT DIFFERENT LEVELS ALONG THE CHAIN AND ITS DISTRIBUTION (US $). ......................................................................................................................................................................... 64 TABLE 17. COMMERCIALISATION MARGIN OF EUCALYPTUS FUELWOOD FOR DIFFERENT ACTORS ALONG THE CHAIN (2.4 TONE). ......................................................................................................................................................................... 66 TABLE 18. EXPECTED PRODUCTIVE LIFESPAN OF DIFFERENT CROPS. ........................................................................... 69 TABLE 19. EXISTING BUSINESS ENVIRONMENT FOR THE VALUE CHAIN OF EUCALYPTUS POLE AND FUELWOOD FROM CHEFASINE. ................................................................................................................................................................. 72 TABLE 20. MECHANISMS OF ACCESS MAINTENANCE AND CONTROL IN THE EUCALYPTUS POLE AND FUELWOOD VALUE CHAIN. ......................................................................................................................................................................... 74 TABLE 21. CHARACTERISTICS OF TREE GROWERS ........................................................................................................ 77 TABLE 22. VARIABLES AND INDICATORS FOR VALUE CHAIN GOVERNANCES ............................................................... 78 TABLE 23. MARKET VALUE CHAIN GOVERNANCE OF EUCALYPTUS POLE AND FUELWOOD VALUE CHAIN FROM CHEFASINE .................................................................................................................................................................................... 79 TABLE 24. GROUPED PROBLEMS AND CHALLENGES RANKED BY THE PARTICIPANTS ................................................... 81 TABLE 25. SOLUTION FOR THE IDENTIFIED PROBLEMS TO UPGRADE THE CHAIN. ......................................................... 83

xi
Title: Value Chain and Identification of Upgrading Options for Eucalyptus Poles and Fuelwood in Sidama Zone, Hawassa Zuria District, Southern Ethiopia.
Asabeneh Alemayehu1, Eckhard Auch1, Tsegaye Bekele2
ABSTRACT The increasing gap between the demand and supply of wood products is linked to large-scale forest conversions to agricultural land and high population growth. Fast growing tree species like Eucalyptus have been popularised and planted by many farmers in different parts of Ethiopia to reduce the enormous supply gap. The objective of the study was to examine the value chain and identification of upgrading options for Eucalyptus poles and fuelwood in Sidama zone, Hawassa Zuria District, southern Ethiopia. The study applied value chain analysis, the theory of access, value chain governance and upgrading as well as gross margin to explores explicitly Eucalyptus products and their lines, chain actors, their function and interaction, estimate cost and value-added distribution, identify the role of Eucalyptus pole and fuelwood for actor’s livelihood strategy, mechanisms and structure of access to benefit and governance type, explore supporting and enabling environments along the value chain and finally to identify options for upgrading the value chain. For the collection of primary data key informant interviews, in-depth interviews, focus group discussions, market assessment and direct observations were used and complemented by secondary data. A total of 49 actors along the chains including tree growers, middlemen, transporters, wholesalers and retailers of pole and fuelwood, workers, brokers, as well as the customers for instance constructors and carpenters, were interviewed. SPSS and excel solver was used to analyse the data and presented in graphs, tables, and descriptive texts. The results of the study revealed that tree growers, workers, middlemen, transporters, Tulla and Hawassa wholesalers and retailers of the pole, large fuelwood wholesalers and retailers, small fuelwood retailers and consumers are direct actors. Government, brokers and service providers were considered to be indirect actors in the value chain of Eucalyptus poles and fuelwood from Chefasine kebele. Among the different products produced in the kebele, Eucalyptus poles were the most traded (85%) products at Tulla and Hawassa towns followed by fuelwood (5%) traded mostly at Tulla town along the chain. The chain has two major lines for pole (line one: Chefasine to Tulla and Line two: Chefasine to Hawassa) and one major line for fuelwood. Very limited processing takes place at the tree growers’ level for both pole and fuelwood and the major proportion of value addition occurs at the middlemen level for line two of pole and fuelwood, and at Tulla pole wholesalers and retailers’ level for line one of Eucalyptus poles. Production, processing, marketing and consumption were the four main functional activities along the chain. The trade of Eucalyptus products was financially profitable for all actors in the chain. However, the benefit distribution was unequal and commercialization margin was increasingly distributed towards the downstream actors for poles while for fuelwood, middlemen grasped the higher benefit and commercialization margin. Eucalyptus was the second profitable livelihood option next to homestead agroforestry but was the first profitable as compared individually with khat, coffee, enset and other activities. Apart from income provision, Eucalyptus was used for conservation of degraded land, construction, firewood, shading, and a form of saving among other uses in the study area. The income from Eucalyptus was also among others used for education fees, house renting and purchase household consumption goods (food, cloth, equipment) and others. Supporting services were almost non-existent for Eucalyptus production and marketing. Access to finance, market information, relationships building, capital, labour opportunity, license and Eucalyptus products were the means of controlling and maintaining market dynamics. Market types of value chain governance with a low level of horizontal and vertical coordination as well as low level of explicit coordination was observed for the value chain of Eucalyptus poles and fuelwood. Disease, lack of market information, lack of support, lack of road access, lack of storage space and limited technologies as well as inadequate land were the major constraints identified from the focus group discussion and Participatory Innovative Platform (PIP). Organising tree growers for marketing and information sharing, organising traders for storage, provision of market infrastructures, easing credit access, training on silvicultural management, technologies adoption, implementing the existing policies and enforcing rules and regulations were some of the options identified for the upgrading of the product's chain.
Keywords: value chain; smallholder; Eucalyptus; actor; benefit distribution; value added; commercialization margin; access mechanisms; governances; upgrading.
1
CHAPTER ONE
1 INTRODUCTION
1.1 Background of the study
Value chain is a concept and a framework for organizing and analyzing information on how inputs and
services are brought together and then used to grow, transform, or manufacture a product and then how the
product moves from the producer to the consumer as well as how value is increased along the way. It is
defined by Trienekens (2011: p:59) as “a network of horizontally and vertically related companies that
jointly aim at/work towards providing products or services to a market”. Similarly, according to Kaplinsky
and Morris (2001), value chain is all functional activities and firms involved in producing and distributing
a product or service, from input supply and product design through to its final disposal by the consumer.
The value chain approach is used to capture the interactions of increasingly dynamic and complex markets
in developing countries and to examine the inter-relationships between diverse actors involved in all stages
of the marketing channel (Kaplinsky and Morris 2001; Trienekens 2011). It provides the basic
understanding needed for designing and implementing appropriate development programs and policies and
helps to improve the livelihood of the poor by providing the market channel, market information and
identifying marketing problems which are important to reduce transaction costs and to ensure proper
benefits shares that are rarely seen in most of the developing countries (Earthscan 2011; Aoudji et al. 2012)
for most of the agricultural and forest products.
Nowadays, in developing countries, smallholder forestry; the management of woodlots by smallholder
farmers, has been gaining more and more importance (Harrison et al. 2002) due to the high and increasing
demands for wood for both constructions as well as fuelwood needs. The smallholder farmers are often
opting to plant fast growing, highly utilizable, and exotic tree species. This is proved by many countries
that have shown interest in Eucalyptus and have planted from 0.7 million ha in 1955 to more than 20 million
ha in 2009 worldwide outside its natural range, Australia (Shi et al. 2012).
Eucalyptus, a fast-growing tree, is found in tropical and sub-tropical climates. It is a native tree in
Australia and is one of the most planted genera of trees in the tropics (Teketay 2000; Gil et al. 2010). There
are about 800 species of Eucalyptus in the world. In Africa, about 100 Eucalyptus species are grown as
exotic species (Dessie and Erkossa 2011). The East African countries like Ethiopia, Rwanda, Kenya, Sudan
and Somalia have started to introduce the species during the second half of the 19th century and the
beginning of the 20th century. In Ethiopia, Eucalyptus was first introduced in 1895 with the objectives of
meeting the steadily increasing demand for construction poles and fuelwood in Addis Ababa (Gil et al.

2
2010). During that time, Emperor Menelik II was advised/supported by the French railway engineer and
philologist Mondon-Vidaille (Breitenbach 1961).
Eucalyptus plantations have expanded greatly throughout Africa and particularly in Ethiopia, because
of its both very high yield and its ability to adapt to a long range of environmental conditions. This rapid
growth and adaptability to a range of conditions have made it more preferable than any other exotic species
grown in the country (Bekele 2015). It grows well in various ecological zones, especially, on the dryer and
degraded lands, poor soils, farmland boundaries, around homesteads, on roadsides, and along borders and
riverbanks (Mekonnen et al. 2007; Mengist 2011; Bekele 2015). The physiological characteristics of the
species including the leaves and shoots being not easily palatable to animals, it's high resistance to stress
with less risk of pest attack and damage made it spread and success various environmental conditions. High
coppicing potential and fewer management needs have also contributed a lot to the spread and success of
the species (Teketay 2000; Jagger and Pender 2003; Mengist 2011). In addition, the growing demand for
construction material and fuelwood, caused by the growing population, has led to the increased plantation
of Eucalyptus by smallholder farmers.
Currently, Eucalyptus is the most utilized tree species in Ethiopia. It is one of the most commonly
planted tree species for construction and Wood fuel (fuelwood and charcoal purposes) (Bekele et al. 2013).
In the past, the utilization of Eucalyptus was restricted to farmers domestic demands such as fuelwood,
house construction, crafting farm implements, fencing, heating and other related activities (Selamyihun
2004; Selamyihun et al. 2005; Gil et al. 2010; Zerihun 2010; Dessie and Erkossa 2011). Nowadays farmers
grow Eucalyptus as a cash crop and it constitutes an important element in their livelihood strategy.
Moreover, Eucalyptus has the potential to substitute endogenous tree species and supply the wood product
demand in Ethiopia, particularly the industrial demand for the wood product such as lumber, plywood
veneer, poles and pulp (Abebe and Tadesse 2010; Bekele 2011). According to Bekele (2015), the major
wood factories in Ethiopia are using Eucalyptus mostly, E. globulus as raw materials to produce sawn
timber. The total consumption of the wood products is growing as the population is growing. With the
increasing population growth in Ethiopia, the demand for fuelwood and construction material at the
household level cannot anymore be supplied by natural forest and by state-owned plantations. Ethiopia
must access new sources of wood supply like from private and smallholder forest plantations. Since
Eucalyptus has become a commodity with high demand and market, some farmers started to convert parts
of their cropland into Eucalyptus woodlots, especially on the Ethiopian highlands (Zerihun 2010; Kebebew
and Ayele 2010; Bekele 2015). It is also believed that because of nutrient mining agriculture, land
degradation and erosion the income from agricultural products has become reduced and this leads the
farmers to convert their land into plantation forest. According to Jenbere et al. (2012), in Arsi zone, Oromia
region, about 90% of the respondents planted Eucalyptus, and 52% of them were engaged in planting since
the late 1990s. About 11% of the cropland was cultivated with Eucalyptus. This implies that Ethiopia needs

3
not only crop but also wood for survival. Thus, improving the production of Eucalyptus plantation and the
value of its products such as pole and fuelwood helps to sustain the rural households with food security,
reduces poverty and adapt the changing climate. To achieve this, there is a need to identify different
upgrading options. According to Gereffi (1999), upgrading is particularly seen as an opportunity for actors
in the developing countries to improve capabilities such as, innovations and market access and receive more
power through the flow of knowledge from buyers to producers in the upstream.
1.2 Problem of the statement
In Ethiopia, there is a huge gap between the supply and demand for wood products, which results from
large-scale forest conversion and degradation as well as from population increment. In 2013, the wood
supply gap in Ethiopia was on a level of 38.8 million m3 per year, with an increasing trend (Bekele 2011).
Besides, a recent report by the World Bank (2017) showed that Ethiopia's total wood demand will increase
from 4.1 million m3 in 2013 to 16.7 million m3 in 2040, with a supply gap of 13.3 million m3. In addition,
the increasing supply gap is currently filled by the destructive utilization of natural forests and partly
covered by timber and wood products imports. To minimize the gap and supply the growing wood product
demand with sustainable domestic production, significant investments in plantations and improved wood-
processing technologies are required.
In Ethiopia wood, charcoal, agricultural residues and animal dung are the most common cooking fuel
types. The traditional biomass from wood, charcoal and dung in households account for 90% of the total
energy consumption (Azemeraw et al. 2013). The contribution of wood for cooking covers the higher
percentage (63% for urban and 91 % for rural households). The contribution of Eucalyptus for this biomass
production is higher as many reports showed. For example, Mekonnen et al. (2007) showed that 78% of the
fuelwood and 20% charcoal are from Eucalyptus in Ethiopia. Bewket (2005) found that 75% of the
fuelwood demand is covered by Eucalyptus in Chemoga watershed. In addition, according to Kelemu and
Tadesse (2010), more than 90% of the population's energy supply comes from Eucalyptus biomass in
Ethiopia. In the study area, Chefasine kebele, Eucalyptus woodlot has been practiced since a long time for
the purpose of fuelwood and construction and the majority of the household meet their wood demand from
the Eucalyptus woodlots (Shibrie 2017). Which means, it has a crucial role in the supply of the much-
needed energy in the country as well in the study area.
However, several scientists and communities undermined the potential of the species instead of
enhancing and upscaling its production. They argue that it has negative environmental externalities which
are associated with its effects in terms of depletion of nutrients, acidification, allelopathic effects caused by
litter which suppress other vegetations and excessive water utilization, cause of erosion and other adverse

4
effects on nutrient cycling (Zhang and Fu 2009; Rassaeifar et al. 2013; Bekele 2015). However, it is fact
that other drivers like large-scale forest conversion, nutrient mining agriculture, overgrazing etc. have led
to the problems, and Eucalyptus plantation is now rather the consequence as the cause of run-down land
and water resources. Eucalyptus grows rapidly, and as a result, it prevents deforestation and serves as a
saviour of natural forest resources. In the face of growing economy, population, and increased demand for
wood products, Eucalyptus remains to be the desired species that grow fast and produce wood to meet the
current demand for construction, fuel and furniture materials (Zerfu 2002; Mekonnen et al. 2007; Bekele
2015). Besides the opportunities for processing and adding value, Eucalyptus needs to be investigated so
that its contribution to poverty alleviation can be enhanced and negative ecological impacts can be
minimized.
Thus, attention to adding value to the Eucalyptus products should have a great role to enhance the value
of Eucalyptus and improve the livelihood of the communities. In the study kebele, Chefasine, studies on
Eucalyptus woodlot profitability and woodlot performance were conducted (Shibire 2017; Thiem 2018).
However, research on value chain analysis of Eucalyptus products and upgrading options has received little
attention. Information on how to improve and sustain the production and marketing system of Eucalyptus
pole and fuelwood is lacking in the current literature. In this regard, the value chain of Eucalyptus pole and
fuelwood can be an important input for policies, decision-makers, farmers and practitioners. Therefore, this
study examined the value chain of Eucalyptus products (pole and fuelwood) in Chefasine kebele, Hawassa
Zuria District, Sidama zone. The study maps the Eucalyptus product value chains, identified actors involved
in the chain, the benefit shared and destinations of the Eucalyptus products, the role of Eucalyptus pole and
fuelwood for actor’s livelihood strategies, supporting and enabling environments as well institutional access
and governance.
1.3 Research objective and questions of the study
In Ethiopia, where forest resources are highly fragmented and continuously converted, securing the benefits
of forestry through value chain upgrading for the local people's livelihood is an important concept. It helps
them to engage in the sustainable management and conservation of the resources. The main objective of
the study was to analyse the value chain of Eucalyptus products (pole and fuelwood) and identify upgrading
options from the producer to the end users in Sidama zone, Hawassa Zuria District of Southern Ethiopia.
Specific objectives and related research questions are:
1. To map the product flow of Eucalyptus from production to end user based on smallholder
Eucalyptus plantations in Chefasine Kebele, Sidama zone, Southern Ethiopia.
1. What are the products of Eucalyptus and how is the product line from producer to consumer?

5
2. What are the main activities carried out in the value chain of Eucalyptus products?
3. Who are the main actors in the Eucalyptus pole and fuelwood value chain?
2. To characterize Eucalyptus pole and fuelwood actor’s interactions, functions and linkages in the
value chains
1. How do value chain actors interact and what are their functions in the chain?
3. To identify the value added and its distribution along the chain and determine the role of Eucalyptus
pole and fuelwood business to actor's livelihood strategies and contribution to actor's incomes.
1. How much is the added value in each node?
2. How is the added value distributed along the chain?
3. What are the roles of Eucalyptus pole and fuelwood business to actor's livelihood strategies
and its contribution to actor's income?
4. To examine the regulating and supporting environment of Eucalyptus pole and fuelwood value
chain and describe how actor groups are affected.
1. What are the factors that affect the value chain of Eucalyptus pole and fuelwood?
2. How are the actor groups affected?
5. To assess coordination, power distribution and governance of the value chains.
1. Who determines the prices, how negotiation and exchange take place, what and who controls
the power, where is power concentrated and how access to Eucalyptus product is maintained
and controlled?
2. What type of governance exists in the value chain?
6. To identify options for upgrading and improving the value chain focusing on cooperation amongst
producer.
1. What gaps and weaknesses, constraints and problems exist for the value chain?
2. What are the options for upgrading and improving the value chain?
3. What are the opportunities for future cooperation among producer farmers?
1.4 Limitation of the study
The study overviews the value chain and upgrading options of Eucalyptus poles and fuelwood originating
from Chefasine kebele, Hawassa Zuria District, Sidama zone, and traded at Tulla and Hawassa towns. The
study was confined in only Chefasine kebele and covers Tulla and Hawassa town wholesalers and retailers.
Due to the limited time in data collection, this study considered cost and margin as financial analysis,
governance and linkage, the enabling and supportive environment as the structural element but does not
embrace the developmental and environmental aspects for the whole value chain.

6
During data collection, some of the principal actors including transporters, middlemen, wholesalers and
retailers were unwilling to answer some of the questions in the questionnaire due to their worry of the
government to come and allocate tax on their products and replace their vending /marketing area into other
areas. Answers were given depending on their memory recall especially for farmers, customers and traders,
because most of them did not keep records. Thus, the researcher had to probe the respondent and used
different means of triangulation methods through, for example, data from governmental official and market
observation. Moreover, estimations of average annual crop yield and income were based on what
interviewed tree growers could recall on the study year, which may not be representative years. Despite the
above limitations, the data collected was reliable and adequate to address the objectives set in the study.
1.5 Organization of the thesis
The thesis consists of six different chapters. Chapter one was about the introductory chapter and provides
general information about the study followed by problems, justification, objectives and questions of the
study. It also covers the limitation of the study. Chapter two reviews the history, importance and products
of Eucalyptus in Ethiopia. It was followed by an extensive review of value chain analysis (VCA) and then
a conceptual framework for the study was outlined. In chapter three, descriptions of the study area, the
design of the research and detailed methodological procedures on how the study was carried out were
described and given. Moreover, it provided detailed information on how data was analyzed and presented.
The results and their presentations were given in chapter four. This chapter begins with the overview of the
characteristics of respondents and status of Eucalyptus plantation in Chefasine. In this chapter, the products
and their flow, functional activities, detailed value chain maps, functions and interactions of actor’s groups
were briefly described. Then the cost, margin and value added of actors were presented. Also, the enabling
and supporting environment, the role of Eucalyptus on the livelihood strategy of actors and its income
contribution, access mechanisms of Eucalyptus products and governance types of the chain were given in
detail. At last, the information on challenges, problems and constraints and options to upgrade the chain
were provided from both the survey and Participatory Innovative Platform (PIP) workshop. Chapter five
provided the discussion of the methodology and the results. Conclusions and recommendations were
described and forwarded under chapter six. Finally, bibliographies, questionnaires for the interview and the
detail on the calculation of the revenue, cost, margin and profit margin of Eucalyptus pole and fuelwood,
as well as gross margin of selected crops were given. In the end, pictures from the field were provided.

7
CHAPTER TWO
2 LITERATURE REVIEW AND THEORETICAL FRAMEWORK
This part is intended to critically review the literature of the past research work of relevance to the present
study objective so that theoretical views and empirical evidence of the reviews enables a better
understanding of the subject. It includes summaries on the certain concepts used in this study.
2.1 Historical development and current status of Eucalyptus plantation in Ethiopia
Tree planting activities in Ethiopia has a long history. According to historical records, afforestation started
in the early 1400s by the order of King Zera-Yakob (1434-1468) but modern tree planting using introduced
tree species (Australian Eucalyptus) was started when Emperor Menellik II (1889-1913) investigated
solutions for alleviating shortage of firewood and construction wood in the capital, Addis Ababa (Melaku
1992; Gil et al. 2010). In addition to the shortage of firewood and construction, the loss of agricultural
productivity resulted from overutilization of the forest without proper management was another challenge
for the government of Ethiopia. Ethiopia lost most of its forest resources especially during the 20th century
(Melaku 1992).
Thus, introducing and planting of fast-growing species like Eucalyptus were among the options for the
government of Ethiopia to overcome the problems of land degradation and a shortage of fuel and
construction wood. Eucalyptus is one of the most planted woody species in the world next to Pinus and
Cunninghamia, (Oballa et al. 2010). It belongs to the family Myrtaceae, subfamily Myrotideae. It is one of
the diverse genus of flowering plants in the world and comprises eight hundred species (Mengist 2011). It
is native to Australia and Tasmania with a small number of species also found in New Guinea, the
Philippines and Indonesia (Gil et al. 2010). Eucalyptus planting has a long history in Ethiopia, dating back
to the late 1800s, intensive plantations surrounding Addis Ababa (Jagger and Pender 2000). Some years
after the introduction, farmers showed great interest to plant the species as woodlots, home gardens,
boundary demarcations and as roadside plants in the country. Beside this, missionaries planted Eucalyptus
in a different area of the country namely, Ghimbi, Debre Tabor and Harar areas (Birru et al. 2013). In the
beginning of the 20th century, farmers in and around Addis Ababa received incentives such as tax-free land,
seedlings and seeds from the government as an encouragement to plant the species.
The first Eucalyptus plantation survey was conducted from 1935 to 1940 by Italians and 4,500 to 5,000
ha of Eucalyptus were found (Pohjonen and Pukkala 1990). Then in between 1975 and 1994, additional
new plantations were planted mainly in peri-urban areas with support from international donors such as
UNSO, SIDA, and WFP (FAO 2006). Eucalyptus plantation covered 477,000 ha (Amare 2000) in the 2002

8
and currently, over 500,000 ha of the land is covered by Eucalyptus plantations (Abebe and Tadesse 2014)
(fig. 1). Nowadays, Eucalyptus is the most planted tree species in the country and made Ethiopia among
the ten major Eucalyptus growing countries in the world. Eucalyptus plantation spreads widely through
small holder’s woodlot plantations (Jaleta et al. 2016).
FIGURE 1. HISTORICAL DISTRIBUTION OF EUCALYPTUS IN ETHIOPIA, BASED ON DATA FROM POHJONEN AND PUKKALA (1990), AMARE (2002); GESSESSE AND TEKELU (2011) AND ABEBE AND TADESSE (2014).
Moreover, farmers are converting parts of their agricultural lands into Eucalyptus woodlots (fig. 2) to meet
the increased demand for wood and wood products. The change of crops is triggered by the reduced
agricultural crop yields, unaffordability of fertilizer and the failure of annual and perennial crops like coffee
and potato due to diseases and pests. Also the need for high management inputs, low price of agricultural
crops and livestock, and high market demand with a lower production cost of Eucalyptus woodlot has
encouraged households to convert their crop and grazing lands to Eucalyptus woodlots (Gil et al. 2010;
Gizachew 2017). Besides, studies from the different parties of the country such as Tigray, Gondar, Wollo,
Wolayita, South and Central Ethiopia confirms the increasing trend of Eucalyptus plantations (Mekonnen
et al. 2007, Dereje 2009; Jaleta et al. 2016 and Gizachew 2017). However, despite this increasing trend,
some scientists and community leaders undermined the potential of the species instead of enhancing and
upscaling its production and marketing (Zhang and Fu 2009; Rassaeifar et al. 2013). But there is a need to
develop an appropriate management system, minimize its negative effects and enhance the value of
Eucalyptus and improve the livelihood of the communities.

9
FIGURE 2. LAND ALLOCATION TREND FOR EUCALYPTUS PRODUCTION PER HECTARE PER HECTARE PER YEAR (SOURCES: GIL ET AL. (2010)).
2.2 Products and services from Eucalyptus woodlot
Currently, Ethiopia holds the largest portions of Eucalyptus plantation in East Africa. Smallholder farmers
in Ethiopia grow Eucalyptus mainly for fuelwood, charcoal, construction wood, poles and furniture making.
According to Amare (2002), Eucalyptus trees are suitable for the two key functions, namely for the
household fuelwood needs of both urban and rural households and pole (for construction and fencing).
Some of the many products and services of Eucalyptus in Ethiopia are shown below in Table 1. It can be
used for fuelwood, building and fencing, plywood, telephone transmission poles, pulp, medicine,
perfumery, environmental conservation and honey production (Davidson 1989; Pohjonen and Pukkala
1990; Jagger and Pender 2000; Teketay 2000; Amare 2002; Zerfu 2002; Hailu et al. 2003; Mekonnen et al.
2007; FAO 2009; Gessesse and Erkossa 2011; Gebrekidan et al. 2012; Jaleta et al. 2016; Daba 2016).
Table 1: Eucalyptus products and services in Ethiopia.

10
Eucalyptus product and services
Description
Fuelwood and charcoal The most important benefit of Eucalyptus in Ethiopia is for fuelwood, as
household energy. Also, charcoal is produced from Eucalyptus.
Transmission Poles Almost all power and telephone line use Eucalyptus transmission poles
Pole (Building, fencing) Almost all wooden houses and wooden fences are built from Eucalyptus.
Scaffolding The construction boom in the country including skyscrapers, bridges, dams and
roads use Eucalyptus scaffolding
Pulp and Paper Important sources of raw material for pulp and paper.
Lumber Not produced commercially, but at the household level, done by pitsaw.
Perfume The essential oil is produced from leaves of E. globulus and E. citriodora
Plywood There are few plywood plants using Eucalyptus in the country.
Medicine
Eucalyptus is used as a medicine at household and community e.g. E. globulus
leaves are used to treat common cold and flus.
Honey production Eucalyptus flowers pollen are important for bee forage.
Environmental services
Environmental
conservation
Eucalyptus trees are planted for gully stabilizations, soil conservation and road
embankments strengthening.
Nurse tree Experiences showed that some indigenous trees such as Juniperus procera,
Podocarpus falcatus can regenerate well under Eucalyptus stands.
Socioeconomic services
Livelihood Contribute positively to income/food security. Growing of Eucalyptus is
considered a grower’s green bank account.
Economic Eucalyptus is a high-value cash crop. In Ethiopia, about 25% of a farmer’s
income is from Eucalyptus.
Social significance Owning Eucalyptus stand is considered a sign of affluence/wealth.
Land tenure Farmer's plant Eucalyptus to ensure land tenure security in case of dispute or
if the landowner cannot cultivate the land for some reason.
Sources: Davidson (1989); Pohjonen and Pukkala (1990); Jagger and Pender (2000); Teketay (2000); Amare (2002); Zerfu (2002); Hailu et al. (2003); Mekonnen et al. (2007); FAO (2009); Gessesse and Erkossa (2011); Gebrekidan et al. (2012); Abebe and Tadesse (2014); Bekele (2015); Jaleta et al. (2016) and Daba (2016).

11
2.3 Socio economic benefits of Eucalyptus species in Ethiopia
Eucalyptus has various socio-economic uses such as employment, security and financial benefit, not only
in the rural production systems but also for the urban energy (charcoal) and construction (scaffolding)
sector. It also played a significant role in improving the livelihoods of rural communities, poverty reduction
and reducing the pressure from remnant native forests especially in the highlands of the country (Tadele et
al. 2014; Daba 2016). Eucalyptus plantation has significantly contributed to the household income
improvement that leads to poverty reduction (Mekonnen et al. 2007; Kelemu and Tadesse 2010). It is the
largest non-agricultural source of household income in many areas of Ethiopia (Jagger and Pender 2000;
Kelemu and Tadesse 2010). According to Mekonnen et al. (2007), the income from Eucalyptus contributes
up to 72% of total household annual cash income for farm household in the central highlands of Ethiopia.
Correspondingly, Kebebew and Ayele (2010) revealed that Eucalyptus can increase the income from
cultivating land up to 90% and reversely substituting the Eucalyptus covered land by important crops such
as teff and barley may reduce the income from this land by 125%.
Eucalyptus plantations are highly preferred and appreciated by the local people than other indigenous
or exotic tree species, because of its high biomass production and rapid growth rate. They produce valuable
construction poles and fuelwood in a reasonably short period of time for the local market, thus providing
cash income for local village communities (Hailu et al. 2003). Leaves, twigs and barks of Eucalyptus are
ranked by women and children in many regions of the country for fuelwood. Apart from its financial and
economic gains some farmers also give emphasis to other values of Eucalyptus woodlot management (Gil
et al. 2010). Having Eucalyptus woodlot increased the confidences of cultivators on their livelihood cash
income. Some of the farmers consider their Eucalyptus plantation as a green bank account. Besides, the
species has got a special value from the cultural viewpoint of society. In some societies, it has great prestige
value.
2.4 Eucalyptus and government in Ethiopia
Eucalyptus is one of the most successful exotic species in Ethiopia, however, it has been criticized by
different professionals, interest groups and government policymakers. According to (Selamyihun et al.
2005; Gil et al. 2010; Bekele 2015; Daba 2016), the species provides a range of benefits particularly for the
rural peoples and generally for the countries wood demand. However, most of the criticisms are out of the
impact of the environment. For example, a study by Selamyihun et al. (2005) revealed a reduction of crop
yield on areas that Eucalyptus trees were planted, while the good financial benefit of the species could be
taken as a good compensation. Also, the availability of wood biomass from Eucalyptus will reduce the
demand for dung and crop residues for fuel, which on the other way used to improve the soil fertility and

12
crop production. Dessie and Erkossa (2011) also proves some of the criticisms of the Eucalyptus but argue
that only some species, mainly the deep-rooted types, drain water resources, and that poor forestry practices,
like high planting densities and short crop rotations, are primarily responsible for depletion of the soil’s
nutrients, increased soil erosion, and suppression of the undergrowth.
However, some of the criticisms are not rational (Davidson 1989). According to Davidson, Eucalyptus
is not an exceptional exotic tree species that have all the impacts and argued that other species have similar
effects. Until now arguments are continued among experts and professionals, while farmers are converting
their cropland into Eucalyptus woodlots (Gil et al. 2010; Zerihun 2010; Gizachew 2017). The reason for
the farmers are different, some are impressed by the current market price, some need it to fill the gap for
their shortage of fuel and construction wood demand, and other planted it because of their low land
productivity and to secure their tenure right (Gil et al. 210; Zerihun 2010; Daba 2016). Some authors
(Mekonnen et al. 2007; Bekele 2015) argue that planting of Eucalyptus could be the best option to minimize
the current wood demand of the country, with a special focus on species selection, proper matching of
species to the site and proper management. A recent study also shows Eucalyptus spp. forests favor the
selection of woody plants if it is managed well, with the appropriate species-to-site establishment (Alem
and Nakhooda 2017).
2.5 Theoretical Framework
2.5.1 Understanding the concept of value chain
Value chain analysis is originated from the discussion of two distinct traditions, namely the French ‘filière
concept’ and Wallerstein’s concept of a commodity chain (Faße et al. 2009). The filière approach emerged
in France in the 1960s to address industrial economic problems with the main emphasis on the economies
of scale, transaction cost, and input-output relationships (Raikes et al. 2000). In the 1970s, Wallerstein
(1976) developed the concept of commodity chains. Commodity chain tries to explain the dynamics of the
distribution of value chain activities in a capitalist world economy (Raikes et al. 2000). From this two
concepts emerged Porter’s concept of the value chain, Gereffi’s global commodity chain, and Humphrey’s
world economic triangle, whereas the last two were joined to the concept of the global value chain (Faße et
al. 2009).
In the mid-1980s, Porter developed the concept of the value chain, in the context of his work on
competitive advantage (Porter 1998). He developed the concept to analyse a specific activity through which
companies may create value by breaking down their activities into value-added. It is a concept and a
framework for organising and analysing information and defined by Kaplinsky and Morris (2001) as “full
range of activities which are required to bring a product or service passing through the intermediate phases

13
of production (transformation and producer services inputs) to delivery to consumers and final disposal
after use". It defines a set of enterprises that perform the business activities i.e. the producers, processors,
traders and distributors of the product. Enterprises are linked by a series of business transactions by which
the product is passed on from primary producers to consumers in end markets (Springer-Heinze 2017).
In the past decades, several extensive theories have been built in the field of value chains. These theories
were reflected in many definitions and approaches; which vary mainly in their objectives, in the activity
that is underlined, and in the pathway in which they have been applied (Trienekens 2011). According to
Trienekens (2011), value chain analysis in developing countries are characterized by its network structure,
its governance form and the way value is added. These approaches underlined value chains, as a production
network, in which actors exploit competitive resources and function within an organized environment
(Trienekens 2011).
The structure of the value chain network has two dimensions; the vertical and horizontal dimension.
The vertical dimension of value chain refers the flow of products from the initial producer up to the last
consumer, while the horizontal dimension reflects the relationship between stakeholders in the same chain
link such as farmer to farmer (Kaplinsky and Morris 2001; Trienekens 2011; Islam 2014). The shape of the
vertical relationship may follow many stages or may not, while horizontal relationships have various shapes
between the stakeholders such as farmer cooperatives or price agreements between wholesalers. Therefore,
the value chain network structure is the principle dynamics of all sectors of the economy. Value added is
“the difference between the sale price of goods sold and the cost of materials and supplies used in the
production” (Klemperer 1996: p.573) cited by Auch (2017) in his lecture note. It is decided by the last level
of consumers’ willingness to pay in the value chain (Islam 2014). The value chain governance discussed
the power and bargaining power position of value chain actors, and related distribution of value added
between economic actors. It also explains the policy matter and access to the market by the actors
(Trienekens 2011; Hulusjö 2013; Islam 2014 ).
To address the problem of rural community information regarding on production, marketing and
distribution, regulating and supporting environment, coordination, power distribution and governance of
the value chains are very important. Value chain is an effective approach in tracing the product flows,
showing the value-adding stages, identifying key actors in the chain and the entire power relationship and
linkage between the actors, assessing market dynamics and governance issues (Kaplinsky and Morris 2001;
Schure et al. 2014). A typical value chain follows the basic steps outlined in figure 3. The steps include
production, processing, transport and trade, distribution and retail, and consumption.

14
FIGURE 3: BASIC STEPS OF A TYPICAL VALUE CHAIN (SOURCE: SCHURE ET AL. (2014: P.4)).
2.5.2 Theory of access
Institutions such as property rights are very important to determine the use of the resources and to influence
the behaviour of the basic resource’s user. Access is used frequently by property right analysts. However,
Ribot (1998) and Ribot and Peluso (2003) argue that access differs from a property in multiple ways. They
defined the theory of access as the “ability to benefits from things”, including material objects, persons,
institutions, and symbols. Access analysis helps to understand why some people (actors) or institutions
benefit from resources, whether they have rights to them. This theory justifies that property is not the only
means, but access is also very important to reap benefit from the resources. It shows the distribution of
benefits and the mechanisms, structures, and processes that lead to the control and maintenance of access
to benefit (Ribot 1998; Ribot and Peluso 2003) and it indicates that the theory of access is broader than the
properties defined as ‘the right to benefit from things’.
As contrasting to property as a ‘bundle of rights’ access is viewed as a ‘bundle of power’ (Ostrom and
Schlager 1996). Access includes both de jure and de facto mechanisms that govern resource use whereas
property rights are de jure that does not allow total benefit (Ribot 1998). Ribot and Peluso (2003) mentioned
a number of factors that influence benefits from a given resource including infrastructure, access to
technology, capital, markets, labour, skill and knowledge, authority, identity, and social relations. They
argue that the access approach is more helpful for analysing how different actors generate benefit from the
things whether or not they hold the right to them.
2.5.3 Value chain governance (Coordination)
Governance in a value chain refers to the structure of relationship and coordination mechanisms that exist
amongst dispersed but linked production system (Velde et al. 2006). Value chain governance determines
the allocation of resources and gains and their flow within the chain. It includes the institutional mechanisms
set by the actors themselves in the chain and the external rules set by the government or other standard
setting organizations. Very often it is understood as the power to define who and who does not participate
in the chain, the setting of rules of inclusion, assisting chain participants to achieve the standards set, and
monitoring their performance (Kaplinsky and Morris 2001). The main concern of value chain governance

15
covers how actors are organized, where power is concentrated among actors, how prices are set and how
financial, material and human resources are allocated and flow within a chain.
Two different types of governance in value chain namely, ‘producer-driven’ and ‘buyer-driven’
governance were introduced initially by Gereffi (1999). In buyer-driven value chains governance, buyers
undertake coordination, control negotiation and production, while in producer-driven value chains
producers play a key role. Later, Gereffi et al. (2005) used three different variables to elaborate and
distinguished five types of governance; namely markets, modular value chain, relational value chain,
captive value chain and hierarchy (Table 2). The three variables are: complexity of information and
knowledge transfer which is required to sustain a particular transaction particularly with respect to product
and process specifications, codification of information and knowledge, the extent to which this information
and knowledge can be codified and, therefore, transmitted efficiently and without transaction-specific
investment between the parties to the transaction and capabilities of actual and potential suppliers in relation
to the requirements of the transaction.
Table 2. Value chain governance types and their determinants.
Governance
type
Complexity of
transaction/information
Ability to codify
transaction/information
supplier’s
capability
Power
exerted
Degree of explicit
coordination and
power asymmetry
Market Low High High Price Low
Modular High High High
Turnkey
supplier
Relational High Low High
Relational
supplier
Captive High High Low lead firm
Hierarchy High Low Low lead firm High
Sources: Gereffi et al. (2005 p:90).
In the market value chain, many suppliers and buyers are interacting, and this results in low power
asymmetry between the actors involved. In this type of government, the conditions of the exchanging goods
and services are negotiated daily based on the market price. Modular value chain arises when the ability to
codify specifications extends to complex products. In this value chain, suppliers make products to a
customer's specifications and take responsibility for competencies surrounding process technology and
incur few transaction-specific investments. In relational value chains, there are complex interactions
between buyer and seller and creates mutual dependence and asset specificity. The relationship is regulated
by reputation, social and spatial proximity, family and ethnic ties, etc. In captive value chains, small
suppliers depend on much larger buyers for their transactions and face significant switching costs. These
16
networks are frequently characterized by a high degree of monitoring and control by the lead firm, creating
dependence on the suppliers. The last one is the hierarchy value chain governance structure. This implies
vertical integration with managerial control. In captive and hierarchy value chains, power is exerted directly
from the lead firm as in the case of administrative control of top management to its subordinates. Thus, the
degrees of asymmetry and explicit coordination is high for captive and hierarchy governance types resulted
from direct control (Gereffi et al. 2005).
2.5.4 Upgrading the value chain
Upgrading the value chain is “a process that enables a firm or any other actor of the chain to take more
value intensive functions in the chain. Kaplinsky and Morris (2001) defined upgrading as a means that
individuals, firms or even a whole country improve its original situation through “changes in the nature and
mix of activities, both within each linkage in the chain and in the distribution of intra-chain activities”.
Upgrading the chain relates to any change, adoption and adaptation processes. This may require innovation
by forest owners, researchers and institutional or policy actors (Weiss et al. 2011). Innovation system is a
set-up where institutions and stakeholders, like private firms, research institutions, governmental agencies
and legal regulations, provide an enabling environment and synergetic interactions towards innovations in
their various forms. It encompasses product innovation (including goods and services) and process
innovations (including technological and organisational innovations) (Rametsteiner et al. 2005). In addition
to the four categories, which are a product, process, marketing and organization (OECD 2005), process and
institutional innovations are important to provide enabling environment and change the livelihood of each
actor (Weiss et al. 2011).
2.6 Conceptual framework
The value chain framework of Kaplinsky and Morris (2001) is the base for the conceptual framework of
the present study. Marketing systems especially access plays a significant role in enhancing the production
and consumption of agricultural and forestry products (Islam 2014). Value chain analysis analyses the
organization and behaviour of all the actors, factors, and the relationship of commodity chains in the value
chain, and also delivers the distribution of value added over various actors (Ribot 1998; Kaplinsky and
Morris 2001; Ribot and Peluso 2003; Islam 2014). The method is best examined through the combination
of theories of the value chain governance and access (Islam 2014).
As stated above (section 2.5.1), the value chain of developing countries is charactersied by its network
structure, its governance form and the way value is added (Trienekens 2011). These componets of the value

17
chain were illustrated in Figure 4 below. The horizontal and vertical structure of the chain characterizes the
network structure. A good value chain governance ensures that interactions between firms along the value
chain are efficient (Gereffi et al. 2005). There are five types of governance, from low coordination level to
high coordination level, including market, modular, relational, captive, and hierarchy (Gereffi et al. 2005).
Value added is created at different stages and by different actors throughout the value chain. The schematic
(conceptual) framework of the value chain analysis in Figure 4 generally demonstrates the main
components of the value chains from the tree producer (farmer in this case) to the end consumer, which
could be national or international consumer and their integration in the system (i). It starts from the tree
grower and then goes through a process of harvesting, cutting, processing, and transporting to the local and
national markets. It also clearly shows how governance and mechanisms of access (iii) shape the
transformations of products, value added, and benefit distributions (ii) in the chain. The performance of the
value chain is influenced by the immediate environment and the wider environment (iv). The immediate
environment directly interacts with the chain actors or the system and affect its performance. It includes the
basic inputs, existing regulations and interventions carried out by public service providers or development
agencies. While the wider environment interacts indirectly with the chain actors and greatly influence the
ability to compete in the markets.
The basic input resource includes land, labour, financial capital, knowledge, technologies, information,
and materials and equipment. Regulating environment includes laws, taxation, license and permits, informal
rules and regulations and standards. Public funded intervention includes business development services,
financial services and promotional activities. On the other hand, the wider environment includes monetary
and fiscal policies that determine the availability of low-interest credits and prices stability, infrastructure
which greatly influences the availability, delivery times and costs of products, education and training,
information etc. Analysing the immediate and wider environment helps to understand the opportunities and
the underlying constraints in the chain. This, on the other hand, helps to understand and analyse the options
that need to upgrade the chin process (v). Within the market system, different market players are directly
engaged in business transactions. Many of the actors in the chain involved in the whole production and
marketing process are subjected to the influence of power, relationship, linkage, regulatory laws, policies
and informal rules. The presence and absent of different functional supports and services like training,
promotional activities, incentives and others into the system through Government, NGO`s, and other private
companies affect the chain process.

18
FIGURE 4: CONCEPTUAL FRAMEWORK OF VALUE CHAIN ANALYSIS ADOPTED FROM (RIBOT (1998), KAPLINSKY AND MORRIS (2001), RIBOT AND PELUSO (2003),
GEREFFI ET AL. (2005), HERR (2007), TRIENEKENS (2011), ISLAM (2014), ILO (2015).

19
CHAPTER THREE
3 RESEARCH METHODOLOGY
3.1 Description of the study area
The Federal Democratic Republic of Ethiopia is administratively divided into nine regional states and two
administrative councils. Southern Nations, Nationalities and Peoples Region (SNNPR) is one of the nine
regional states. SNNPR is again divided into fourteen administrative zones, one of which is Sidama (Abele
and Tewodros 2017). Sidama zone is again divided into 19 Woredas (Lower administration areas) for
administrative purpose. They are namely: Hawassa Zuria, Malga, Wondo-Genet, Gorche, Wonsho, Chuko,
Loka-Abaya, Bursa, Bona-Zuria. Chire, Shebedino, Dale, Aleta-Wondo, Dara, Hula, Aroresa, Bansa,
Arbegona and Borecha Woredas. Sidama is located in the North-Eastern part of the region and bounded by
Gedio zone in the South, Wolaita zone in the West and Oromia in the North East and South East (Abele
and Tewodros 2017).
Based on projection population data made by the central statistical agency, the District had a total
population of. 148,175 in 2017 (CSA 2007). Hawassa Zuria District has an area of 22,843 ha. It is divided
into 23 kebeles (smallest administrative area) and among them is Chefasine kebele, which this research
focused on. Chefasine kebele is located at 6o55’58.6”N latitude and 38o29’48.8”E longitude, North Eastern
part of Sidama zone (fig. 5). The kebele covers an area of 1,040 ha with an estimated population size of
12,366 people living in 1,110 households and among these, 97% are male-headed (Shibire 2017). Its mean
altitude ranges from 1,820 to 1,870 meters above sea level and the average annual rainfall ranges between
900-1400 mm. The mean annual temperature varies from 23-270C. The area is categorized under dry
Woina-Dega (mid-altitude) Agro-climatic zone and the rainy season extends from March to September
(Shibire 2017). The study area (Chefasine kebele) was selected due to the high involvement of tree growers
in Eucalyptus planting by converting their farming lands of khat, coffee and enset (fig. 6). The past research
conducted by Shibire (2017) found out a gap of research on the value chain aspect and recommended a
study on the value chain of Eucalyptus product in the area for the improvement of the value of Eucalyptus
and ensure equal benefit sharing in the value chain. Besides, value chain studies of wood products were the
focus of the WoodCluster project1 in Chefasine to narrow the supply and demand gaps of wood products.
The reason for the focus of the project at Chefasine was the demand for wood and the presence of small-
1 WoodCluster is a joint project of TU Dresden and three institutions in East Africa: Ethiopia (HU-WGCF & NR), Tanzania (Sokoine University of Agriculture) and Uganda (Makerere University). It has the objective of reducing the wood demand gap of these three east African countries by elucidating sustainable solutions for the problems.

20
scale farms with woodlots. Therefore, all this and other factors like the accessibility of the kebele have
initiated the researcher to select the study area.
FIGURE 5. MAP OF EUCALYPTUS PRODUCTION AND MARKETING AREAS, ORIGINATING FROM CHEFASINE KEBELE
(SOURCE: AUTOR (2018)).
3.2 Agriculture and land holding size
In the Southern region, agricultural production is the predominant activity, which includes both plant
growing and livestock rearing. The main farming practices in this area are diverse, intensive and well-
established traditional farming (agroforestry). In every Woredas of the Sidama zone including Chefasine
kebele, enset, coffee and khat production activities for household consumption as well as for commercial
purposes are the main practices that local farmers depend on. A significant area of the Sidama land produces
coffee and enset. Coffee (Coffea arabica) is the major cash crop in the region and the leading coffee
producing area in the country, contributing significantly to the foreign exchange of the country (CSA 2007).
Enset (Ensete ventricosum (Welw.) Cheesman) is the single most important root crop grown and the bulk
of the population depends heavily on it for survival. Khat (Catha eduli) is an important cash crop which is
the second largest export commodity and replacing coffee and generating high revenue for the farmers
(Woldu et al. 2015). Because of population size, the landholding size of the individual peasants in most
parts of the Sidama zone is small. According to Abele and Tewodros (2017), about 53 percent of the farmers
own less than one hectares of land, 42 percent of the farmers own one to two hectares of land and only 5

21
percent own two hectares and more. The average landholding size in Chefasine kebele is 0.8 ha where the
minimum and maximum land size owned by the household is 0.25 and 4 ha, respectively (Shibire 2017).
In Chefasine kebele both annual and perennials crops such as maize, barley, enset, haricot bean and coffee
are produced. Eucalyptus is the dominant tree species planted as a woodlot in Chefasine kebele (Shibire
2017) and currently highly planted on areas of khat, coffee and enset (fig 6).
FIGURE 6. EUCALYPTUS COPPICE STANDS (LEFT) AND COMBINED GROWING OF KHAT, ENSET AND EUCALYPTUS (RIGHT).
3.3 Research design
Value chain analysis depends on multiple sources of data, for a deeper understanding and investigation of
the whole process, for actors involved, and for complex issues in the system. The case study approach is an
effective approach to conduct such types of research (Zainal 2007). According to Yin (2003), a case study
research method provides holistic and meaningful information about the characteristics of real-life events.
Besides, the approach helps to find intensive qualitative and quantitative data sets. Therefore, this study
was conducted as a case study, for the exploration of the value chain of Eucalyptus pole and fuelwood in
Chefasine kebele, Sidama zone. This research work was done in three different phases including pre-field,
during field and post field stages. In the pre-field stage, different desk-based activities such as problem
identification, objective formulation, and developing the overall proposal including approval of the
proposal were undertaken. The second phase was the main fieldwork process. The major activity in this
phase was field data collection in the study area and was carried out from the first week of March to the
beginning of May 2018. Before the fieldwork, different discussions aiming to address the objectives and
importance of the research work was carried out with the Chefasine kebele administration and agricultural
office and WoodCluster project coordinator in Ethiopia. After consultation and getting permission from the
concerned body, a reconnaissance survey was done for the selection of potential tree growers. The third
Khat and enset

22
phase of this research was data analysis and presentation. Different methodologies were used for the
analysis and presentations of data. Figure 7 shows an outline of the steps followed during the research
process.

23
FIGURE 7: A SCHEMATIC DIAGRAM OF THE RESEARCH METHODOLOGIES APPLIED (SOURCE: AUTHOR, 2018)

24
3.4 Sources and methods of data collection 3.4.1 Primary data collection
To collect the primary data, various tools were used. These include: key informants’ interview, in-depth
interview, direct field observation, market assessmentt, focused group discussions and Participatory
Innovative platform (PIP). Both quantitative and qualitative data were gathered. Semi-structured
questionnaires (Appendix I) were developed to conduct the interviews. Semi-structured questionnaires give
the interviewees a chance to express themselves as much as possible (Montello and Sutton 2006). Prior to
the interview, pre-testing was done on randomly selected tree growers. Besides, a consultation was made
with the representatives from the village and development agent workers (DA’s) about the general condition
of the village before the real data collection starts. This ensured a common understanding of all questions
among interviewers. Then, the initial questionnaires were revised by considering the information provided
by a few selected tree growers for pre-testing.
Key informant interview: Key informant interview was done with structured questionnaires, semi-
structured questionnaires and unstructured talks. A key informant who had a general knowledge about the
farming practices of Eucalyptus plantation, poles and fuelwood production and marketing were given
priority for selection. Chefasine kebele agricultural experts were visited to provide first-hand information
about Eucalyptus plantation, poles and fuelwood production and marketing in the study area. A total of 10
key informants’ interviews, three from Chefasine kebele agricultural expertise, two from pole wholesalers
and retailers and one from a middlemen who have more than 10 years of trading experience, one from
Hawassa Ministry of Environment, Forest and Climate Change, one from wood product factory at Hawassa
and two from the tree growers, who have long standing experience in production and marketing of
Eucalyptus were contacted.
In-depth interview: The in-depth interviews were used to collect primary data from value chain actors.
The interview was based on the semi-structured questionnaires. Both open and closed-ended questionnaires
were used and tailored accordingly, targeting the different actors. A total of 49 respondents along the chain
were interviewed including tree growers, middlemen, broker, transporter, constructor, carpenter and
wholesalers and retailers of the pole at Tulla and Hawassa. Also, workers, brokers, large and small fuelwood
wholesalers and retailers were interviewed (Table 5). The characteristics, function, organization and chain
of the actors, quantity, cost and price of inputs and outputs, process at each stage of the chain, the role of
Eucalyptus pole and fuelwood business for actor’s livelihood strategy and challenges and constraints for
Eucalyptus business was the focus of the in-depth interview (questionaries’ for the in-depth interview were
found under Appendix I).

25
Market assessment: To capture the price of selected crops a market survey was conducted, in addition to
the key informant and in-depth interviews. To determine the buying and selling price of a tree: First, the
number of trees per area of Eucalyptus stands for each tree grower were estimated from the total trees per
hectare. Second, the amount of revenue that the tree growers have received from the specified area of
Eucalyptus stands recorded (here, the actual money that they received has applied If they sold within the
past two years, if not, with the help of Chefasine pole retailers, the price of the stand was estimated). Then,
price per tree was estimated by dividing the amount of revenue that they gained from the specified area of
Eucalyptus woodlot with the number of trees per area of Eucalyptus stand. Moreover, the amount of income
that they received from the Eucalyptus stands was divided by the average number of trees per specified area
of Eucalyptus and then the value was expressed per hectare. Besides, pole wholesalers and retailers and
middlemen, brokers as well as constructors were interviewed about the cost of a hectare of Eucalyptus and
cross-checked. Market price was used to estimate the selling price of the traders (wholesalers and retailers
of pole and fuelwood). The summary of the average market price of Eucalyptus poles was given in Table 3
and the detailed was provided in Appendix IV. The market price of truck loads of poles and donkey
cartloads of fuelwood was assessed to determine the selling price of the middlemen and buying cost of
wholesalers and retailers of pole and fuelwood. It means, the selling price of the former actors were
considered as the buying cost of the succeeding actors.
On average a pole costs US $ 0.48 (13 ETB2), 1.03 (28 ETB), 1.36 (37 ETB) and 1.76 (48 ETB) at the
tree growers level, Chefasine kebele, Tulla and Hawassa towns, respectively. A truck of poles (550 poles)
valued US $ 514 (14,000) to 734 (20,000 ETB) (Appendix II), depending on the quality of wood, season,
market demand and cost of transportation. On average a truck of poles was valued at US $ 624 (17,000
ETB), which means US $ 1.12 (31 ETB).
Table 3. Average selling price of Eucalyptus poles at different nods of Eucalyptus poles value chain.
Nods Tree
growers
Chefasine
retailers
Middlemen Tulla pole
wholesalers
and realises
Hawassa pole
wholesalers and
retailers
Average selling price of
pole at each nod (ETB)
13 28 31 37 48
2 ETB (Ethiopian Birr) is the currency of Ethiopian (1 ETB =0.0367 US $ or 1 US $=27.2501 ETB) on 24th of May 2018. (https://www.currencystats247.com/currencies/etb-usd/2018: 24 May, 2018).

26
Direct (field) observation: It is the process of recording the behavioural patterns of people, objects and
events in a systematic manner. In this method, many different process and activities of production and trade
of Eucalyptus products more emphasis on pole and fuelwood were directly observed on the field. The
observation was unstructured and undisguised in the pole and fuelwood selling and production sites and
photos were taken using a digital camera. The record includes the process of pole and fuelwood production,
harvesting, storing, the process of transportation, selling etc.
Focus group discussion: Focus group discussion was conducted at tree grower and trader levels. A total
of two focus group discussions, one at the tree growers’ level and the other at the wholesalers and retailers’
level of pole and fuelwood was conducted. A total of 10 tree growers were involved, from men, women
and youth groups at the tree grower level. The second focus group discussion was carried out with five
wholesalers and retailers of pole and fuelwood at Hawassa town. The discussion was focused on the
production of Eucalyptus pole and fuelwood, the status of Eucalyptus woodlot management in the area, the
role of Eucalyptus pole and fuelwood for livelihood activities (income, education, healthcare etc.), the types
of governance and coordination that existed in the chain and constraints and challenges facing actors in the
chain and possible future options to upgrade the chain. Focus group discussion of the wholesalers and
retailers were conducted in the marketplace by using their free time. Woreda agricultural experts (extension
agents) were participated in the discussion and were asked to select the people for discussion.
Participatory Innovative platform (PIP): Participatory innovative platform workshop, which was
organised by the WoodCluster project at Hawassa town, from on June 04, 2018 were used as one of the
primary data collection methods. PIP is a participatory approach, which helps to make the value chain actors
part of an innovation system (Asmamaw and Auch 2016). Actors from tree grower, middlemen, wholesaler
and retailer of poles and fuelwood, transporter, broker, constructor and carpenter as well as government
representative from Chefasine kebele, researchers from Wondo Genet College of Forestry and Natural
Resource and wood processing experts from Hawassa town participated in the workshop. In this method,
discussion was made on the survey results as well as problems and challenges. Alongside, the possible
options to solve the identified problems and challenges for each actor level in the chain were proposed.
3.4.2 Secondary data collection
Literature and data collections: Secondary data were collected from literature and other researchers’
findings. Chefasine village administrators, Hawassa Ministry of Environment, Forest and Climate Change
(HMECC) and Hawassa City Revenu and Customs Authority (HCRCA), were contacted to gather
information about trade and production of Eucalyptus pole and fuelwood and possible options for upgrading
the chain. Moreover, results from the PIP workshop were used for the identification of the upgrading option.

27
The record also includes taxes, fees, prices and other related matters. Besides, published reports and
previous research works were used to gather information.
Woodlot structure and performance: Data for the woodlot structure and performances such as growth
dynamics (DBH and height) and others were sourced from the research conducted by Thiem (2018), on
woodlot performance of Eucalyptus from Chefasine kebele.
The number of Eucalyptus trees per hectare was estimated in different ways. Firstly, locations of
Eucalyptus trees belonging to interviewed farmers were marked using a GPS device in order to quantify
the overall stand. Then, Eucalyptus trees belonging to eight farmers were randomly measured to determine
the spacing. The result founds different and irregular spacing types (Table 4). Then, the number of trees per
unit area of the tree growers and then per hectare estimated.
Table 4. Spacing used for plantation establishment of Eucalyptus woodlot.
No Spacing used during woodlot establishment Area per tree (m2)
1 0.25 0.25 0.06 2 0.70 0.75 0.53 3 0.50 1.50 0.75 4 0.75 1.50 1.13 5 1.50 1.00 1.50 6 0.25 0.50 0.13 7 0.50 0.50 0.25 8 1.70 0.50 0.85 Mean 0.77 0.81 0.62
In addition to this, middlemen and pole wholesalers and retailers in Tulla gave information of the number
of truck-loads of Eucalyptus poles obtained from a woodlot as well as the number of different poles assorted
to cross-check the number of trees per hectare.
3.5 Sampling method and sampling procedures
Value chain is a network of activities carried out by different agents in the chain. It is a framework used for
organising and analysing information to create value in a network of activities carried out by different
actors. To undertake such types of research Mccormick and Schmitz (2002) used snowball and purposive
sampling methods to identify actors and informants. Thus, this study employed nonprobability sampling
for identifying informants for the interviews. Tree growers from Chefasine kebele were selected
purposively, if they had a Eucalyptus plantation. The selection of tree growers was done in a
reconnaissance’s survey with the help of the agricultural expertise. During the reconnaissance survey, the
name of active tree growers on production and marketing were recorded. For value chain study, the point

28
of entry is a crucial stage as the value chain is a network and series of different activities and actors
(Kaplinsky and Morris 2001). Tree growers were the point of entry for this study and thus filed work was
started from the tree grower and continued up to the consumers (contractor and carpenter). In social survey
research studies, the richness of the data collected is much more important than the number of respondents
or participants (Tuckett 2004). A common range of the number of participants in qualitative studies is
somewhere from 8 to 15 participants, and occasionally it varies both inside and outside of this range. For
example, Creswell (2007) recommends 3–5 participants for a case study, 10 for a phenomenological study
and 15–20 for grounded theory study. This research followed a case study research approach and by
considering the limitation of time and financial constraints, a total of 49 respondents were interviewed
(Table 5). Among these, 20 of the respondents were tree growers from Hankemo (3), Belamo (6), Argeta
(5), Butelo (4) and Ura (2) sub-villages. Although samples for the tree growers were selected purposively
and the richness of the data is much more important than the sample size used, however, in this study, the
sample was considered acceptable as it represents more that 10% of the total tree growers (150 tree growers)
in the village.
Table 5: Summary table for the number of respondents for Eucalyptus pole and fuelwood originated from
Chefasine Kebele.
Value chain node Estimated number. of actors
Number of respondents
Sampling method Remark
Producer/woodlot/tree growers)
150 20 Purposive selection Reconnaissance survey
Brokers 2 2 Referral from the tree grower
Snowball sampling
Middlemen (2 poles and one fuelwood)
3 3 Referral from the tree grower and brokers
Snowball sampling
Tulla pole wholesalers and retailers
7 7
Referral from the middlemen, tree grower and broker
Snowball sampling
Hawassa pole wholesalers and retailers
≥45 6 Referral from the middlemen
Snowball sampling
Large fuelwood wholesalers and retailers
4 3 Referral from the middlemen
Snowball sampling
Small fuelwood retailers 2 2 Referral from the large fuelwood wholesalers
Snowball sampling
Labourers - 4 Referral from traders Snowball sampling Transporters and
constructors 4 2 Referral from traders Snowball sampling
Total >126 49

29
The actors after the tree grower were selected based on snowball sampling method. Snowball sampling also
called chain referral or networking is a non-probabilistic sampling in which persons will deliberately be
chosen for sampling are used as informants to locate other persons having necessary characteristics making
them eligible for the sample (Bernard 2011; Drăgan and Isaic-Maniu 2012). In this method, the initial
respondents were asked to recommend the names of the other possible respondents who have similar
activities and related to the subject area. The idea is that a bond or link might exist in between the initial
sample and others in the chain. Because of the lack of a sampling frame in snowball sampling, selection of
sample was based on referrals. Therefore, in this research, the interview of the succeeding step was the
referrals of the preceding step.
3.6 Reliability and validity of data
For the sake of quality, testing both the validity and reliability of the data collected is very important. A
combination of different methods of data collection tools and multiple sources enables triangulation of the
data and thus, ensures reliability and validity of the results. In this research data was collected from various
sources and from different actors by using multiple tools and was triangulated adequately. Consultation and
discussion with the concerned government offices (Chefasine kebele administrator, Ministry of
Environment, Forest and Climate Change and Hawassa City Revenue and Customs Authority) were held
to produce reliable information and data for cross-checking information to confirm validity. The data on
the product flow, revenue, cost and actors, mechanism of access, regulating and supporting environment,
coordination and linkages were collected from different sources through different methods of key informant
interview, in-depth interview, direct observation (products, processing and marketing) and focus group
discussions at producer and trader level. As well results from the Participatory Innovative Platform
conducted by the WoodCluster project and the author were integrated. Besides, market survey (observation
when the traders and buyers negotiate and measurement on pole and fuelwood) at Tulla and Hawassa towns
were conducted and triangulated to verify the validity and reliability of the data.
3.7 Analysis and presentation of data
Both qualitative and quantitative analysis methods were employed to analyze and present the data. Value
chain analysis, the theory of access and value chain governance was adopted for the analysis of the
information (Kaplinsky and Morris 2001; Gereffi et al. 2005). Value chain analysis as a tool is essential in
understanding the sequence of related business activities from production to consumption of Eucalyptus
products in general and pole and fuelwood in particular. Detailed explanations for the analysis methods
used are found hereafter.

30
3.7.1 Value chain mapping of Eucalyptus products
Chain mapping is the first step of a value chain analysis (Faße et al. 2009; Springer-Heinze 2017). At this
stage, the sector was illustrated in a map-like-fashion tracing the product flows within the chain. The
objective is to give an illustrative representation of the identified chain actors and the related product. The
mapped value chain shows the actors, their characteristics, relationships, and economic activities at each
stage (Faße et al. 2009; Kaplinsky and Morris 2001).
3.7.2 Quantifying the value chain
The next step after agreeing upon the actors was quantifying the value chains in detail. It helps to the better
understanding of the overall economic significance and to identify intervention priorities and opportunities.
Quantifying the value chain indicates the addition of quantifiable data about volumes and turnover, prices
paid at each chain link between stages, shares of product flow of the different chains or distribution
channels, the chain supporters and suppliers, and the employees (Faße et al. 2009).
3.7.3 Economic analysis of the value chain
The third step focused on economic analysis of the value chains and it complemented and deepened the
quantification with more emphasis on economic efficiency. In this stage, the flow of revenues accumulating
at various stages of the value chain was examined in regard to (i) income and margin, price and quantities
of the poles and fuelwood handled by the different actors (ii) distribution of revenue and margin among and
within the groups along the value chain (Bockel and Tallec 2005; Marshall et al. 2006). Meanwhile,
assessing the cost structure allows the identification of critical points that need an investigation (Springer-
Heinze 2017). The main emphasis here was to compare the distribution of costs, revenue, value-added, and
margin among actors. At each stage of the chain gross profit margin was used to evaluate the benefits of
the commodity chain and calculated by the following formula
(https://www.investopedia.com/terms/g/gross_profit_margin.asp#axzz1ukMcMM9q, 30 June, 2018).
…………………………………..equ. 1
Where Revenue = Sale volume x Unit price; and cost (the cost of goods sold) = Variable cost + Fixed cost
Variable costs are those cost which varies with production volume and included seed, fertilizer, seedling,
labor, transport costs etc. On the other hand, fixed costs are those costs which do not vary with production
volume and depreciated. For example, tools, interest, tax etc. Besides, product cost, processing cost, official
fees, and other unofficial charges were used in the cost function. Product costs are the costs of products of
Eucalyptus (poles and fuelwood) per truck and donkey cart loads. Processing costs included transportation
and communication costs (mobile balance).
𝐺𝑟𝑜𝑠𝑠 𝑝𝑟𝑜𝑓𝑖𝑡 𝑚𝑎𝑟𝑔𝑖𝑛 (%) =𝑅𝑒𝑣𝑒𝑛𝑢𝑒 − 𝐶𝑜𝑠𝑡
𝑅𝑒𝑣𝑒𝑛𝑢𝑒 𝑥 100

31
The market price was used to determine the cost of some of the resource. However, for family labour,
which is difficult or not possible to price using the market, the opportunity cost of the labour was used. The
opportunity cost of labour is the income foregone by not working on the farm or by not using farm labour
in some alternative enterprise on the farm. According to Harberger (1971), the measure of opportunity cost
is "the supply price of marginal units of labour for given skill characteristics and labour market areas where
the workers will work and live." For this study, the cost of a unit of unpaid labour used in the farm measured
by the supply price or market price of labour for a similar task in hired employment. Next, to this, the value
added in each stage was calculated. It is the “difference between the sale price of goods sold and the cost
of materials and supplies used in the production” (Klemperer 1996: p.573) (cited by Auch (2017) in his
lecture note).
VA = Y – II ………………………………………………………………. ……. ………...equ. 2
Where VA= value added, Y= sell price of goods sold and II= cost of intermediate input (cost of materials
and inputs used in the production process).
The value added at each stage (VAi) of the value chain was calculated by subtracting the value of
intermediate inputs used at each respective stage (IIi) of the chain from the value of a product at a given
stage (Yi)
VAi = Yi – IIi ………………………………………………………………………………..equ. 3
Where VAi = value added at the ith stage; Yi = output from segment/stage i; and IIi = intermediate material
used in stage excluding the product from the previous stage, used in stage i.
Therefore, the total value added in the entire chain was the summation of the value added for each step of
the chain or node (Faße et al. 2009). Which is express by the formula as follow.
VA chain = ∑(VA1 + VA2 + VA3 … VAn)………………………………………………. eqn. 4
Where VA chain= total value added in the entire chain and VA is the value added at each node of the chain.
Value added distribution is used to understand the contribution of the system in the local economy and
employment generation (Auch 2017; lecture note). Thus, the value-added distribution is depicted by
separating into the net benefit of actors, the wages and salaries and taxes and other fees. However, the
accurate value-added calculation at a given nod (actor) requires detailed information from bookkeeping
(Auch 2017; lecture note). By considering the above definition, the following formula was used to estimate
the distribution of the value added.
Equ.5
Commercialization Margin: Commercialisation margin was calculated as an indicator for the distribution
of benefit along the chain. It indicates how much of the final sales price is obtained by an actor in the value
Value added (VA) = margin + wages + taxes

32
chain. It also shows the proportion of the last unit price received by a given actor in the chain, giving a
sense of how equitably the profit is divided (Marshall et al. 2006). It is expressed as follows: -
…………………………… equ. 6
3.7.4 Role of Eucalyptus pole and fuelwood for actor’s livelihood strategies
The data for livelihood activities were collected using livelihood portfolio. The assessment based on how
Eucalyptus pole and fuelwood production, processing and marketing influence the wellbeing of the actors
in the chain. Gross margin was used to analyse the income contribution of different livelihood strategies.
Besides, the resilient strategy of the livelihood was used to understand the role of Eucalyptus pole and
fuelwood for actor’s livelihood.
Gross margin calculations: Gross Margin (GM) is a method used to assess the profitability of a business.
It is obtained by finding the difference between the gross income accumulated and the variable costs
incurred. ...…………………………………….......................... equ. 7.
Where: Gross income is obtained by multiplying the gross output (yields) by the “farm-gate” price received
for the product. The costs for the establishment of perennial crops were obtained from the entire expected
lifespan of the crop using the formula given by Upton (1973) cited by (Ndegwa 2010).
……………………………………………. eqn. 8
Where: CA= constant annuity, Q=Quantity (number of trees), P = Price per unit, r = interest rate, n = Life
expectancy of the crop in years. The lending or borrowing rate of Ethiopia (7%) as by May 2018 was used
as an interest rate.
3.7.5 Regulating and supporting environment
The regulating environments including formal regulations like permits, tax etc and informal rules like norms
and supporting environments including all kinds of support like state extension, research, NGO,
associations etc of the chain was elaborated and described based of the information collected through in-
depth interview, key informant interview and focus group discussions. In this stage, the critical points of
the business environment affecting the performance of the value chain were identified and analysed by
listing the limits and chances in the chain.
Commercialisation margin =Sale price − Purchase price
final product price 𝑥 100
Gross margin = Gross income – Variable Costs

33
3.7.6 Mechanism of access
Here, different mechanisms of access used by different actor groups to gain control and maintain access to
benefit from the Eucalyptus pole and fuelwood business analysed by using information from focus group
discussion and in-depth interviews.
3.7.7 Mechanisms of governance
For the analysis of the governance pattern of chain actors in the Eucalyptus business, information's on the
coordination, linkage and regulation was collected and analysed. The information gathered included aspects
such as: who determines the price, how power is maintained and controlled, how the negotiations and
exchanges take place, how are the relationship and linkages, and what are the factors that determine the
relationships and linkages in the chain? (Gereffi et al. 2005; Abtew et al. 2012). Locally set indicators such
as (degree of task complexity, knowledge of product and process, degree of dependency, easiness of
information flow, mode of price determination, mode of communication, simplicity of exchange of
products, ability of basic market infrastructure, market information, access to capital, service feeding in to
the system etc) were considered to evaluate the three variables of governances (complexity of transaction,
ability to codify transaction, and the capabilities of suppliers as defined by Gereffi et al. (2005). Then the
five types of governance, namely; markets, modular value chain, relational value chain, captive value chain
and hierarchy were elaborated, and the governance type of Eucalyptus pole and fuelwood distinguished
based on the three variables of governance.
3.7.8 Identifying options for upgrading
The option to upgrade and improve the chain was analysed first by describing the problems, challenges and
constraints in the chain through interviews, observations and group discussions. Then, the obtained results
were discussed with the focus group discussion carried at the tree growers’ level as well as the traders’ level
for the identification of upgrading options. The Participatory Innovative Platform (PIP) discussion has been
used for the identification of the problems, challenges and possible options for upgrading the chain. Here
the issues identified were prioritized and solutions for the determined and prioritized impediments have
discussed and documented.
3.7.9 Data presentation
The finding of the study was presented and interpreted by using descriptive statistics through tabulation,
graphics, empirical data, description of facts and mathematical calculations, using MS Excel, and statistical
package for social sciences (SPSS) software windows version 19.0.

34
CHAPTER FOUR
4 RESULTS
4.1 Demographic characteristics of respondents.
Table 6 provides a summary of key socio-economic and demographic characteristics of the tree growers
and traders interviewed in Chefasine village, Tulla and Hawassa towns. The age of most of the tree
growers (60%) and traders (67%) was in between 18 and 40 years and the rest 40% of the tree growers
and 33% of the traders was above 40 years old. Male headed tree growers and traders accounted for
95% and 76%, respectively. This high percentage of male participants in the household survey of tree
growers could be attributed to the sampling process, which required that the potential interviewees
should involve in Eucalyptus production, processing and marketing. It is because the involvement of
female-headed households in tree growing was low as compared to male headed households. It is
because of the agricultural division of labour (a cultural factor) (Ayele 2008) that exist in the study
village and elsewhere in Ethiopia. Accordingly, the requirement could have locked out female-headed
households from participating in the survey. However, the participation of female traders (24%)
outweighs the proportion of tree grower females (5%). It is because female households do most of the
fuelwood wholesaler and retailer jobs. The average household size is about six persons, although the
figure ranges from 1 to 12 persons per household. Smaller household sizes are from younger tree
growers who have participated in Eucalyptus production and marketing but still are not married and
therefore without families while other traders had families. In general, about 55% of the tree growers
and 72% of traders have attained up to primary school level of education, and 30% of tree growers and
14% of traders have attained secondary education and the rest 15% of tree growers and 14% of traders
have attained secondary education.
Table 6. Characteristic of tree growers and traders for Eucalyptus products value chain originated from
Chefasine
Characteristics
Tree grower (20 respondents) Pole and fuelwood wholesalers and retailers (21 respondents)
Frequency Percentage (%) Frequency Percentage (%) Gender M 19 95 16 76
F 1 5 5 24 Age ≥ 18 and < 40 12 60 14 67
≥ 40 8 40 7 33 Marital status
Single 1 5
Married 18 90 21 100 Widow 1 5
Educational status
Primary education
11 55 15 72
Secondary education
6 30 3 14
More than secondary education
3 15 3 14

35
4.2 Eucalyptus woodlot and its status
The survey result shows, the majority (70%) of the tree growers started planting Eucalyptus in the past
20 years. A Eucalyptus tree dating 30 years back was recorded by Thiem (2018). Different ways of
Eucalyptus planting were observed: (1) boundary plantation including roadside and boundaries of
homesteads and around farmland, (2) woodlots on grazing land, unproductive and degraded land. The
survey result shows that 50% of the respondents have planted Eucalyptus on the boundaries of
homesteads and around farmland (fig. 8). The high percentage of a plantation in boundaries is in
agreement with a report made by Duguma and Hager (2010) and Abiyu et al. (2015) that boundaries
are the favourite tree planting niches. The inclination to plant trees on boundaries of farmland could be
the result of low land holding size and fragmentation of lands which will increase boundary areas and
respond to the changed tenure system (Abiyu et al. 2015). The other 25% and 20% of tree growers
planted Eucalyptus on the road side and degraded and unproductive lands, respectively. Only 5% of
tree growers plant Eucalyptus on their grazing lands. According to the respondent’s response and
explanation, tree growers planted Eucalyptus near to their homestead because of the shortage of land,
as land is a limited resource for most of the farmers.
FIGURE 8. TYPES OF EUCALYPTUS PLANTATION DESIGNS AT CHEFASINE (SOURCE: THIEM, 2018)
For the kebele, the average total land size of households is estimated at 0.8 hectares, although the size
ranges from 0.2 ha to 4.0 ha. It is small as compared to the other farmers in the country, e.g., 1.54 ha
per household for the Wogera District in Northern Ethiopia (Oduol and Nang 'ole 2012). It means tree
growers are limited by land shortage to expand their Eucalyptus stand and obtain a benefit. The average
size of a Eucalyptus woodlot was 0.36 ha and ranged from 0.1 ha (minimum) to 1.25 ha (maximum).
Planting Eucalyptus on and around homestead helps the tree growers to monitor the stand frequently
and manage it easily. Allocating their limited land for Eucalyptus is an indicator of the strong motivation
of farmers for planting and managing Eucalyptus. Eucalyptus woodlots are also located far from a
homestead, especially in the case where a larger land area is held and unproductive and degraded land
which cannot be used to grow khat, coffee or enset. Currently, most of the woodlots are placed on areas
that are not productive for khat and coffee and have been becoming degraded (fig. 9).
0%
10%
20%
30%
40%
50%
Road side Grazing land Unproductive anddgreaded lands
Boundaries ofhomestead and
around farmland
25%5%
20%
50%
Perc
enta
ge o
f res
pond
ents
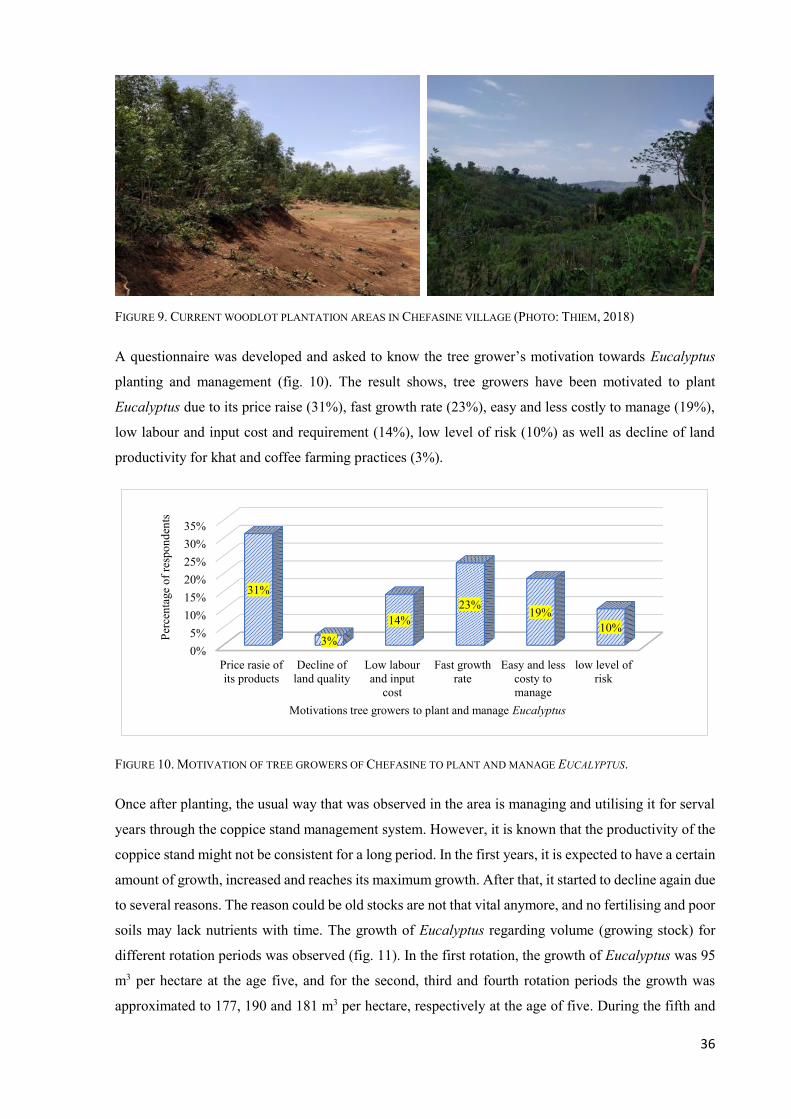
36
FIGURE 9. CURRENT WOODLOT PLANTATION AREAS IN CHEFASINE VILLAGE (PHOTO: THIEM, 2018)
A questionnaire was developed and asked to know the tree grower’s motivation towards Eucalyptus
planting and management (fig. 10). The result shows, tree growers have been motivated to plant
Eucalyptus due to its price raise (31%), fast growth rate (23%), easy and less costly to manage (19%),
low labour and input cost and requirement (14%), low level of risk (10%) as well as decline of land
productivity for khat and coffee farming practices (3%).
FIGURE 10. MOTIVATION OF TREE GROWERS OF CHEFASINE TO PLANT AND MANAGE EUCALYPTUS.
Once after planting, the usual way that was observed in the area is managing and utilising it for serval
years through the coppice stand management system. However, it is known that the productivity of the
coppice stand might not be consistent for a long period. In the first years, it is expected to have a certain
amount of growth, increased and reaches its maximum growth. After that, it started to decline again due
to several reasons. The reason could be old stocks are not that vital anymore, and no fertilising and poor
soils may lack nutrients with time. The growth of Eucalyptus regarding volume (growing stock) for
different rotation periods was observed (fig. 11). In the first rotation, the growth of Eucalyptus was 95
m3 per hectare at the age five, and for the second, third and fourth rotation periods the growth was
approximated to 177, 190 and 181 m3 per hectare, respectively at the age of five. During the fifth and
0%5%
10%15%20%25%30%35%
Price rasie ofits products
Decline ofland quality
Low labourand input
cost
Fast growthrate
Easy and lesscosty tomanage
low level ofrisk
31%
3%
14%23% 19%
10%
Perc
enta
ge o
f res
pond
ents
Motivations tree growers to plant and manage Eucalyptus
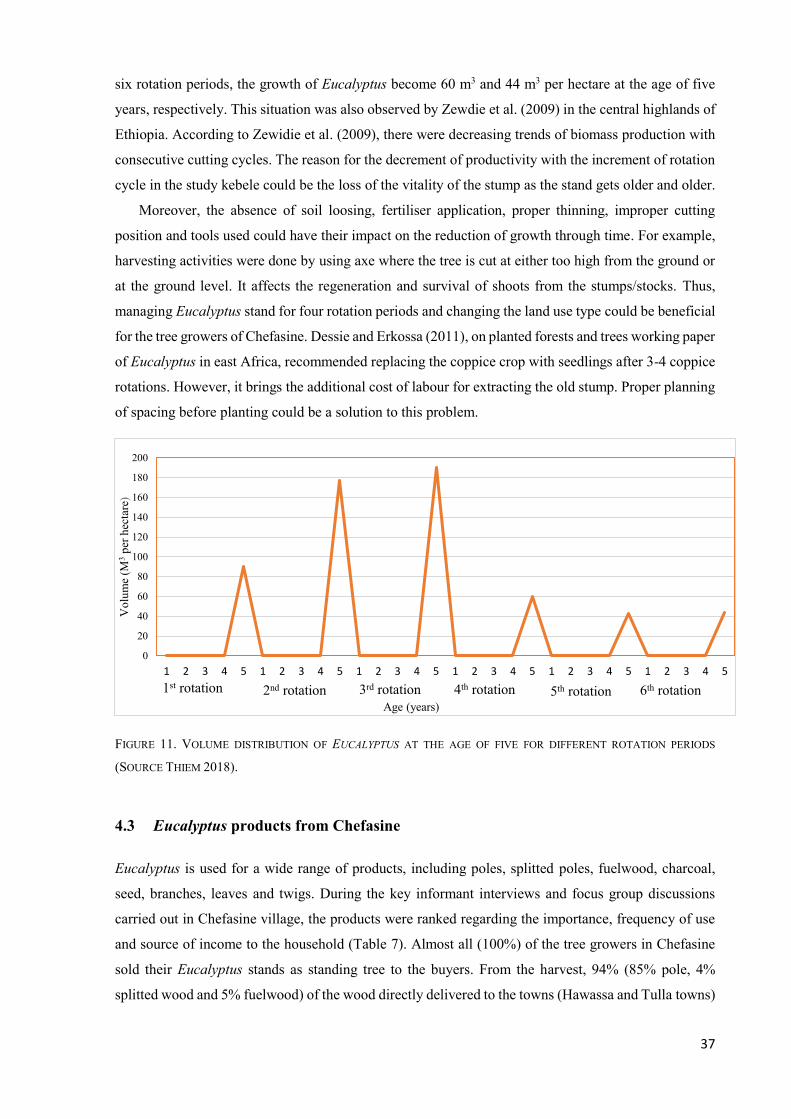
37
six rotation periods, the growth of Eucalyptus become 60 m3 and 44 m3 per hectare at the age of five
years, respectively. This situation was also observed by Zewdie et al. (2009) in the central highlands of
Ethiopia. According to Zewidie et al. (2009), there were decreasing trends of biomass production with
consecutive cutting cycles. The reason for the decrement of productivity with the increment of rotation
cycle in the study kebele could be the loss of the vitality of the stump as the stand gets older and older.
Moreover, the absence of soil loosing, fertiliser application, proper thinning, improper cutting
position and tools used could have their impact on the reduction of growth through time. For example,
harvesting activities were done by using axe where the tree is cut at either too high from the ground or
at the ground level. It affects the regeneration and survival of shoots from the stumps/stocks. Thus,
managing Eucalyptus stand for four rotation periods and changing the land use type could be beneficial
for the tree growers of Chefasine. Dessie and Erkossa (2011), on planted forests and trees working paper
of Eucalyptus in east Africa, recommended replacing the coppice crop with seedlings after 3-4 coppice
rotations. However, it brings the additional cost of labour for extracting the old stump. Proper planning
of spacing before planting could be a solution to this problem.
FIGURE 11. VOLUME DISTRIBUTION OF EUCALYPTUS AT THE AGE OF FIVE FOR DIFFERENT ROTATION PERIODS
(SOURCE THIEM 2018).
4.3 Eucalyptus products from Chefasine
Eucalyptus is used for a wide range of products, including poles, splitted poles, fuelwood, charcoal,
seed, branches, leaves and twigs. During the key informant interviews and focus group discussions
carried out in Chefasine village, the products were ranked regarding the importance, frequency of use
and source of income to the household (Table 7). Almost all (100%) of the tree growers in Chefasine
sold their Eucalyptus stands as standing tree to the buyers. From the harvest, 94% (85% pole, 4%
splitted wood and 5% fuelwood) of the wood directly delivered to the towns (Hawassa and Tulla towns)
0
20
40
60
80
100
120
140
160
180
200
1 2 3 4 5 1 2 3 4 5 1 2 3 4 5 1 2 3 4 5 1 2 3 4 5 1 2 3 4 5
Vol
ume
(M3
per h
ecta
re)
Age (years)1st rotation 2nd rotation 3rd rotation 4th rotation 5th rotation 6th rotation

38
and 6% of the products consumed locally (fig. 12). The data suggest that among the Eucalyptus products
produced by the tree grower, seed, branches and twigs including leaves are not sold.
Table 7. Ranked Eucalyptus products from Chefasine Kebele.
Poles: are the most important products of Eucalyptus and has a variety of functions including
construction, scaffolding, fencing, making different farm and household tools and power lines. It is
used for both local and modern (scaffolding) construction, fencing, and creating different farm tools.
Immediately after the delivery of this products to the pole wholesalers and retailers, poles are assorted
in different pole types (Table 8) depending on the size (diameter and length) and quality of the wood as
well as on the function of the wood. The different assortments in Amharic includes: Ye Wuch Gedegeda
Mager (የዉጭ ግድግዳ ማገር), Ye Wuste Gedgeda Mager (የዉስጥ ግድግዳ ማገር), Qesete (ቅስጥ), Weraje (ወራጅ),
Gureshume (ጉርሹም), Ye Qoreqoro Magere (የቆርቆሮ ማገር), Teshegagari (ተሸጋጋሪ), Felete (ፍልጥ),
Aerecho/Chefeka (ጨፈቃ) and Bark and Branch in bundles (ባርክ/ቅርፊት). The different parts of
Eucalyptus poles have distinct functions as illustrated in Table 8. From the survey, it is confirmed that,
in the village, there is no standard to determine the rotation period of Eucalyptus stand. Tree growers
in Chefasine start to sell their stand from age 3, depending on the immediate cash need of the tree
growers. According to Zerihune Gezahegn (2010) in Ethiopia, Eucalyptus species starts to generate
income to farmers from the age of 3-4 years onward. In the study area, tree growers sell their stand at
the age of 3 and 4 years for construction (Aerecho/Chefeka, Ye Wuch Gedegeda Mager, Ye Wuste
Gedgeda Mager and Ye Qoreqoro Mager) purpose and at the age of 5 - 8 years for commercial and
construction poles like Gureshume, Qesete, Weraje and Teshegagari.
No. Eucalyptus products Rank based on income and frequency of use.
1 Poles 1 2 Splitted poles 2 3 Fuelwood 3 4 Branches and twigs including leaves 4 5 Seeds 5

39
Table 8. Different assortment of Eucalyptus poles and their expected harvesting time for planting and
coppicing stand.
Different assortment of Eucalyptus
(Amharic Name) Use to fix or connect Length Diameter Quantity Years after
M Cm Stem Kg Planting Coppicing Ye Wuch Gedegeda Mager (የዉጭ ግድግዳ ማገር)
Construction wall from outside 6.5 5.73 1
3 - 4 2
Ye Wuste Gedgeda Mager (የዉስጥ ግድግዳ ማገር)
Construction wall from inside 5.6 4.22 1 3 2 – 3
Qesete (ቅስጥ) Top of the wall and the roof 8.1 6.37 1 4 - 8 3 – 5
Weraje (ወራጅ) The roof and the wall 8.65 8.28 1 4 - 8 3 – 6
Gureshume (ጉርሹም) Inside and outside corner of the house 8.25 9.55 1 5 - 7 4
Ye Qoreqoro Magere (የቆርቆሮ ማገር)
The roof with the Weraje 6.85 7.16 1 3-6 3 – 5
Teshegagari (ተሸጋጋሪ) A long pole, two said of the roof 9.9 12 1 >7 >6
Felete (ፍልጥ) Used for wall making 2.45 6.73 1 >6 >4 Aerecho/Chefeka (ጨፈቃ)
Traditional/cottage construction 4.2 1.98 1 2 - 3 1 – 2
Bark and Branch in bundles (ቅርፊት)
Broken branches and bark for fuelwood - -
50-60
- -
Splitted poles: It is a Eucalyptus product that has a diameter of 6.73 cm and length of 2.45 m on
average (Table 8). It is called Felete (ፍልጥ) in Amharic and mainly used for making a wall of a
construction (local), fencing and fuelwood. Although it is the second important and ranked product,
harvesting of Eucalyptus stand and using or selling as splitted pole is not a common practice of
Chefasine tree growers. Tree growers harvest and split Eucalyptus when there will be a need for splitted
pole for home consumption (construction). According to the discussion with the key informant
interviews, splitted poles covers approximately 4% of the total wood sold to Hawassa and Tulla Towns.
It is sold directly to constructors or carpenters and service providers (firewood, heating and cooking).
Fuelwood: It is the third-ranked Eucalyptus product in Chefasine following pole and splitted wood
(Table 7). Chefasine tree growers were rarely harvested and sold Eucalyptus stand as fuelwood. It
covers only 5% of the total wood sold to the traders (middlemen and wholesalers and retailers of
fuelwood). It is mostly sold to Tulla town, as it is near to the Chefasine kebele. Tulla and Hawassa pole
wholesalers and retailers sold their poles for fuelwood to the service providers and retailers at the same
or reduced price. It happened when the pole was not sold, and the quality started to deteriorate. It was
observed that Chefasine village traders have bought fuelwood from other villages (Moricho village,
Shebedino District) and sold it to the Chefasine residents including tree growers. The reason was that
in Moricho there are a lot of middlemen who are involved in fuelwood marketing and has better
financial bases that allowed them to buy the stand of Eucalyptus and sold as fuelwood.
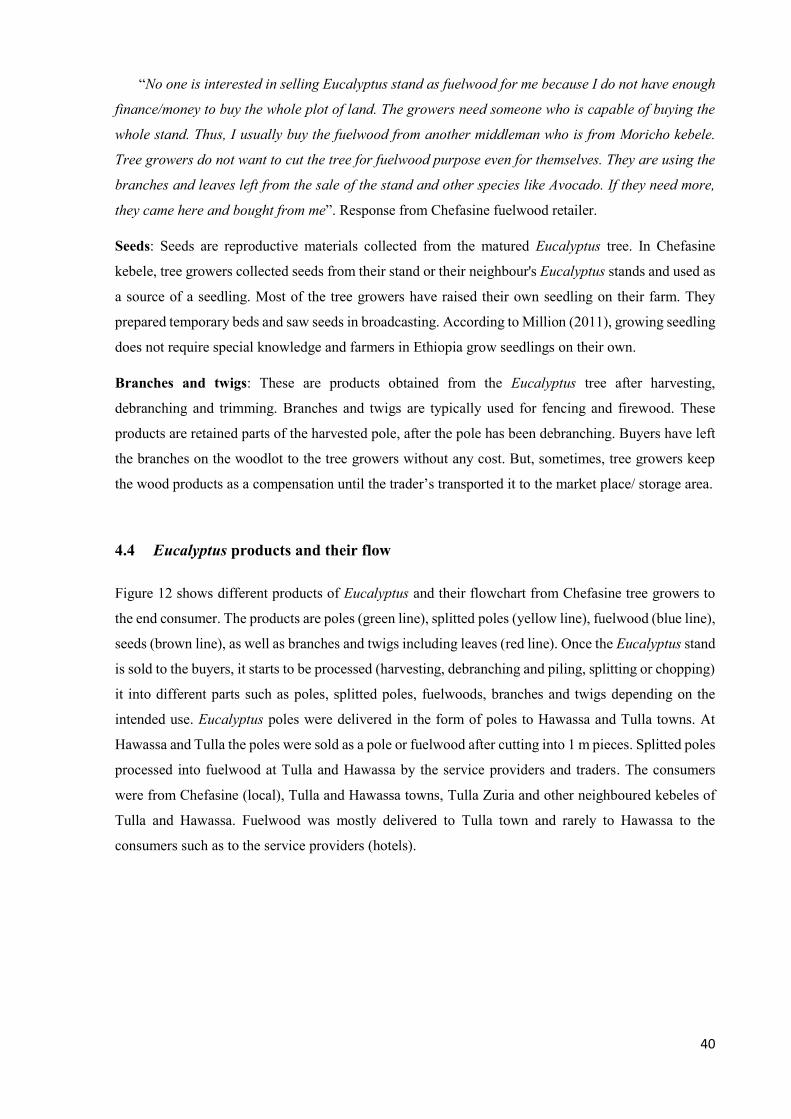
40
“No one is interested in selling Eucalyptus stand as fuelwood for me because I do not have enough
finance/money to buy the whole plot of land. The growers need someone who is capable of buying the
whole stand. Thus, I usually buy the fuelwood from another middleman who is from Moricho kebele.
Tree growers do not want to cut the tree for fuelwood purpose even for themselves. They are using the
branches and leaves left from the sale of the stand and other species like Avocado. If they need more,
they came here and bought from me”. Response from Chefasine fuelwood retailer.
Seeds: Seeds are reproductive materials collected from the matured Eucalyptus tree. In Chefasine
kebele, tree growers collected seeds from their stand or their neighbour's Eucalyptus stands and used as
a source of a seedling. Most of the tree growers have raised their own seedling on their farm. They
prepared temporary beds and saw seeds in broadcasting. According to Million (2011), growing seedling
does not require special knowledge and farmers in Ethiopia grow seedlings on their own.
Branches and twigs: These are products obtained from the Eucalyptus tree after harvesting,
debranching and trimming. Branches and twigs are typically used for fencing and firewood. These
products are retained parts of the harvested pole, after the pole has been debranching. Buyers have left
the branches on the woodlot to the tree growers without any cost. But, sometimes, tree growers keep
the wood products as a compensation until the trader’s transported it to the market place/ storage area.
4.4 Eucalyptus products and their flow
Figure 12 shows different products of Eucalyptus and their flowchart from Chefasine tree growers to
the end consumer. The products are poles (green line), splitted poles (yellow line), fuelwood (blue line),
seeds (brown line), as well as branches and twigs including leaves (red line). Once the Eucalyptus stand
is sold to the buyers, it starts to be processed (harvesting, debranching and piling, splitting or chopping)
it into different parts such as poles, splitted poles, fuelwoods, branches and twigs depending on the
intended use. Eucalyptus poles were delivered in the form of poles to Hawassa and Tulla towns. At
Hawassa and Tulla the poles were sold as a pole or fuelwood after cutting into 1 m pieces. Splitted poles
processed into fuelwood at Tulla and Hawassa by the service providers and traders. The consumers
were from Chefasine (local), Tulla and Hawassa towns, Tulla Zuria and other neighboured kebeles of
Tulla and Hawassa. Fuelwood was mostly delivered to Tulla town and rarely to Hawassa to the
consumers such as to the service providers (hotels).
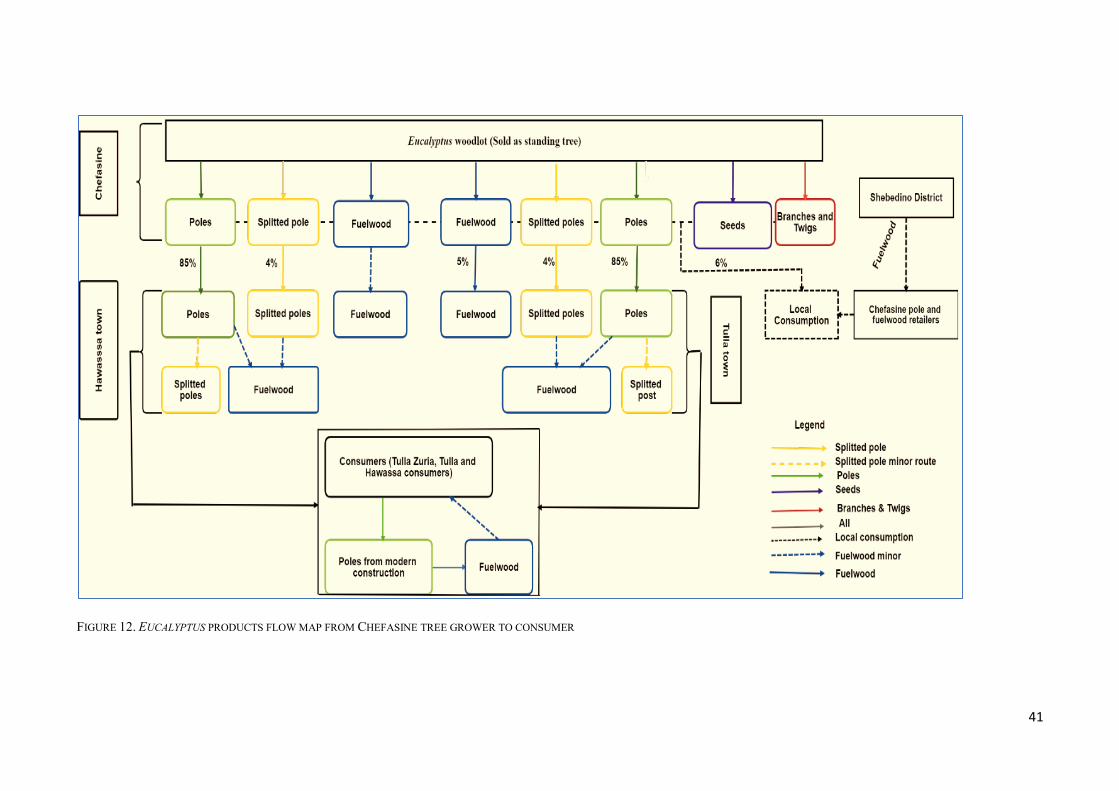
41
FIGURE 12. EUCALYPTUS PRODUCTS FLOW MAP FROM CHEFASINE TREE GROWER TO CONSUMER

42
4.5 Activities in the value chain of Eucalyptus products
Eucalyptus pole and fuelwood value chain in the Chefasine kebele has mainly four functional activities
and segments namely production, processing, marketing or distribution that includes traders in the local
and urban area such as local retailers, middlemen and wholesalers and retailer and consumers.
Production of Eucalyptus pole and fuelwood was focused on the growth of Eucalyptus trees and is done
by tree growers. The activities done by tree growers are land preparation, planting, weeding and hoeing,
thinning and fencing. Processing is the second functional activity in the value chain of Eucalyptus
products. It includes harvesting, debranching, splitting into small pieces of wood (Chopping), loading
and unloading and storing. This activity is done by labourers who are living in Chefasine kebele. The
third major function or activity is marketing or distribution. Eucalyptus products produced in the study
area is marketed at rural (6%), and urban (94%) areas and different actors are involved. The product
enters the local market where it is collected by Chefasine village retailers and urban areas where
wholesalers and retailers and middlemen collect it. The middlemen and wholesalers and retailers
transported the product to the urban market (Tulla and Hawassa town). At the local markets, local
retailers buy a standing tree and sell it to the local consumers. Local retailers were used their garden to
sell the products. Pole and fuelwood wholesalers and retailers of Tulla used their garden and areas
nearby roadsides for vending their products. However, pole wholesalers and retailers of Hawassa have
handled the marketing area provided by the government. The wholesalers and retailers assort poles in
different sizes and store, sell or distribute them to the consumers. Consumption is the final functional
activity carried out by local and urban consumers including constructors (traditional and modern) as
well as service providers (hotels and restaurants).
4.6 Eucalyptus product value chain map and its linkages in the value chain
A value chain map is a map that allows one to depict all the activities, actors, their relationships and
interactions within and among the chain. The value chain map of Eucalyptus poles and fuelwood that
show a schematic presentation of actors, their process, function, the flow of the market, money as well
as information is shown below (fig. 13 and 14). The value chain pattern of Eucalyptus poles originating
from Chefasine kebele is intricate and involves a wide range of actors with their specific function and
process at each node of the chain. As stated above, production, processing, marketing and consumption
are the four functional activities of Eucalyptus value chain in the study area. These functions are
undertaken in sequential order by tree growers, middlemen and wholesalers and retailers of Tulla and
wholesalers and retailers of Tulla and Hawassa and consumers.

43
FIGURE 13. EUCALYPTUS POLE VALUE CHAIN MAP ORIGINATED FROM CHEFASINE KEBELE.

44
FIGURE 14. EUCALYPTUS FUELWOOD VALUE CHAIN MAP ORIGINATED FROM CHEFASINE KEBELE.

45
The study found 150 tree growers (having approximately 50 ha of woodlots), three Chefasine pole and
fuelwood retailers (1 pole and two fuelwood), 7 Tulla pole wholesalers and retailers, four large fuelwood
wholesalers and retailers and three small fuelwood retailers. Besides, three middlemen (two of them are
from Morichio kebele, Shebedino District), 45 and above Hawassa pole wholesalers and retailers, two
brokers, three transporters, one constructor and carpenters, workers and input and service providers
(government institutions) were recorded (Table 9).
Table 9. Actors involved in Eucalyptus production and marketing originating from Chefasine kebele.
Actor group Number Remark Tree growers 150 Chefasine pole and fuelwood retailers 3 Two poles and three fuelwoods Tulla pole wholesalers and retailers 7 Large fuelwood wholesalers and retailers 4 Small fuelwood retailers 3
Middlemen 3 2 for pole and 1 for fuelwood (for pole from
Tulla and Morchio, fuelwood from Chefasine) Broker 2 Transporter 3 Constructor and carpenter 1 Worker Several Hawassa pole wholesalers and retailers >45
Diverse marketing lines characterised the chain. Marketing line is the sequence through which the whole
product passes from producers to consumers (Mendoza 1995) and is intended to provide a systematic flow
of goods and services from their origin to the final destination. In this study, a total of seven different
marketing lines for Eucalyptus pole and four marketing lines for Eucalyptus fuelwood were identified (fig
13 and 14). The marketing line for Eucalyptus poles are:
➢ Line 1: Tree grower to Tulla pole wholesaler and retailer to consumer.
➢ Line 2: Tree grower to middlemen to Hawassa pole wholesaler and retailer to consumer.
➢ Line 3: Tree grower to middlemen to Tulla pole wholesalers and retailer to consumer.
➢ Line 4: Tree grower to Hawassa pole wholesaler and retailer to consumer.
➢ Line 5: Tree grower to middlemen to consumer.
➢ Line 6: Tree grower to Chefasine pole retailers to consumer (local house constractor).
➢ Line 7: Tree grower to consumer.
Eucalyptus poles and fuelwood produced by the tree growers were sold to consumers (constructors; modern
and local, carpenters and service providers), village level retailers, and district or regional level traders. The
two lines (line 1: tree grower to Tulla pole wholesaler and retailer to consumer and line 2: tree grower to
middlemen to Hawassa pole wholesaler and retailer to consumer) are the major lines that the tree growers

46
of Chefasine used to sell their Eucalyptus stand. Tulla pole wholesalers and retailers and middlemen have
processed the stand of Eucalyptus after buying from the tree growers and delivered to the consumers and
Hawassa pole wholesalers and retailers, respectively. The other lines are not common and happened
occasionally. For example, line 4 (tree grower to Hawassa pole wholesaler and retailer to consumer)
occurred for those pole wholesalers and retailers of Hawassa who have relatives or families at Chefasine.
Hawassa pole wholesalers and retailers are highly dependent on middlemen. In line 3, middlemen delivered
the product to Tulla pole wholesalers and retailers occasionally, when the wholesalers and retailers are not
able to go and buy it or when the demand is high in the town. Line 7 (tree grower to consumer: constructors;
modern and local, carpenters and service providers) was the shortest line in which tree growers and
consumers met together. The Eucalyptus fuelwood value chain market line includes the following:
➢ Line 1: Tree grower to consumer. ➢ Line 2: Tree grower to large fuelwood wholesaler and retailer to consumer.
➢ Line 3: Tree grower to large fuelwood wholesaler and retailer to small fuelwood retailer to consumer.
➢ Line 4: Tree grower to middlemen to large fuelwood wholesaler and retailer to small fuelwood retailer
to consumer
Among the four lines, line 4 (tree grower to middlemen to large fuelwood wholesaler and retailer to small
fuelwood retailer to consumer: home consumption and service provider) was the most common and
essential that connects tree growers, middlemen, large fuelwood wholesalers and retailers, small fuelwood
retailers and consumers. The other lines are occasional and occurred rarely in the value chain.
Value chain map is a useful tool that indicated how value chain actors relate to one another. The black
arrow in the map (fig. 13 and 14) indicates the structured nature of the supply of Eucalyptus poles and
fuelwood and implies strong and persistent links in the overall chain. For pole 1) tree growers to Tulla pole
wholesalers and retailers and 2) tree growers, middlemen and Hawassa pole wholesalers and retailers are
the leading and persistent lines. While for fuelwood tree growers, middlemen, large fuelwood wholesalers
and retailers and small fuelwood retailers (flyers) are the common lines. According to the key informant
interview, 85% and more of the pole and 5% and more of fuelwood passed through this line and reached to
the final consumers.
On the other hand, the dotted arrow indicated in the value chain map represents an irregular supply of
raw material, flow of Eucalyptus products (poles and fuelwood) and suggests a weak link and relationship
in between and among the actors. These lines are best stated as an occasional/seasonal chain. Information
for the availability of the resources (Eucalyptus stand ready for sale) flows from the tree grower to the
consumer, whereas, monetary values including demand and price of the products and method of payment
have emanated from the consumer to the tree growers. Payment in all cases are carried out through cash;
there is no any advanced payment.

47
4.7 Value chain actors, characteristics and their function
Eucalyptus products (pole and fuelwood) value chain originating from Chefasine kebele has connected and
engaged various direct and indirect actors. Regarding to the position, place and function of actors in the
value chain of Eucalyptus pole and fuelwood, a total of 12 groups of actor, 9 direct (major) groups of actors
including Eucalyptus tree growers, middlemen, transporters, workers, Tulla pole wholesalers and retailers,
Hawassa pole wholesalers and retailers, large fuelwood wholesalers and retailers, small fuelwood retailers
(flyers), consumers (constructors, carpenters and service providers) and 3 minor actors government, input
providers and brokers were identified. Details on each agent (actors) and their respective functions in the
value chain are provided and characterised hereafter.
Tree growers: Tree growers are those households or farmers who are involving in Eucalyptus production
activities. Tree growers have motivated by several reasons to plant and manage Eucalyptus trees. The price
rise of the products (especially Eucalyptus poles), its fast growth, easy and less cost of management, the
low requirement of input as well as the decline of land quality for khat and coffee production are some of
them. In the village there are no restrictions that prohibit farmers from planting Eucalyptus tree; thus, the
decision on whether to plant or not to pant Eucalyptus depends on demands of Eucalyptus products in the
market and own consumption.
The function of Eucalyptus tree growers at Chefasine kebele is limited to land preparation, planting and
tending of Eucalyptus stand. As compared to other crops or farming systems Eucalyptus plantation is less
labour intensive by its nature. Most of the demanding labour work confined to the establishment and
harvesting works. However, in Chefasine, harvesting is not the work of the tree growers, as they sell the
standing tee. Besides, pruning, thinning and using proper spacing is not a common practice for Chefasine
tree growers (fig. 15). Tree growers fence their stand to protect the newly established or coppicing shoot
from damage by any domestic animals.
FIGURE 15. EUCALYPTUS COPPICE STAND (LEFT) AND NEWLY ESTABLISHED STAND (RIGHT).

48
Transporters: Transportation involves the transfer of Eucalyptus poles and fuelwood from plantation area
(tree grower) to the consumer and market (sell) area. It has performed with trucks containing 500 to 600
poles and donkey cart load carrying 800 pieces of fuelwood. Trucks and donkey-pulled carts are the two
most transportation systems used by different actors. The distance of transportation, the road condition and
amount (pole and fuelwood) were the main factors for the determination of this transportation means. For
instance, transportation from the tree growers to the Chefasine retailers and all fuelwood transportations
from Chefasine to Tulla and Hawassa have done by using donkey cartload, while transportation of pole
from Chefasine to Tulla and Hawassa towns by the Tulla pole wholesalers and retailers and middlemen
have done by using trucks. Transporters are independent entrepreneurs transporting 500 to 600 Eucalyptus
poles on average US $ 18.35 to 25.68 (500 to 700 ETB) to Tulla and US $ 29.36 to 51.37 (800 to 1,400
ETB) to Hawassa town. They transport 800 pieces of fuelwood (one load) US $ 1.47 to 1.83 (40 to 50 ETB)
to Tulla and US $ 1.83 to 2.57 (50 to 70 ETB) to Hawassa. Although this is the average cost, the cost of a
truck of pole and donkey cartloads of fuelwood is dependent on many other factors such as season, distance
from the stand to the main road, location of the stand and accessibility of the road. Few, and occasionally,
Hawassa pole wholesalers and retailers transported their product themselves and rendered transport service
to the other traders (transporter). However, according to the key informant interview, transporting
Eucalyptus pole is not the main job of the transporter, the customer (buyer) called to them when they need
and planned before a month.
Middlemen: Middlemen are important actors of Eucalyptus pole and fuelwood business in Chefasine, and
their main function is buying Eucalyptus stand from tree grower and delivering the harvested, debranched
and split wood mainly to Hawassa pole wholesalers and retailers and rarely to Tulla pole wholesalers and
retailers and consumers. Middlemen offered the processed and finished fuelwood mostly to Tulla fuelwood
wholesalers and retailers and rarely to consumers (service providers). They connect tree growers with
wholesalers and retailers and consumers. These actors are small in number (three), and two of them are
from Moricho kebele, Shebedino District. Most of the time they used a rented vehicle including the driver
for the transportation of pole and donkey cart for the transport of fuelwood and utilised labourers for
harvesting, debranching, splitting, piling, loading and unloading wood in to and out of the truck and donkey
carts. Knowledge of the identification of quality stand, guessing the stand value and marketing Eucalyptus
are their futures and characteristics.
Tulla pole wholesalers and retailers: These are actors of Eucalyptus pole value chain from Chefasine to
Tulla town. They are located in Tulla town. The primary function of this actors is storing and selling of
Eucalyptus pole at Tulla town and to the neighbouring villages. In addition to selling and distributing
Eucalyptus pole, they are involved in harvesting, debranching, loading and unloading and transporting
functions of the chain. These characteristics made them similar to the actors of middlemen. They are better

49
off than middlemen regarding capital and market range. In a rare case, they buy processed and semi-
processed Eucalyptus pole from middlemen. For this actor’s Eucalyptus pole is the leading business, while
few actors were processed the pole into fuelwood and used fuelwood as a secondary business. They also
assort Eucalyptus pole in different pole types based on the size and quality of the pole. In addition to
Eucalyptus trading, a few of these actors are involved in farming activities and trading of goods and
commodities.
Hawassa pole wholesalers and retailers: These are actors lived in Hawassa and Eucalyptus pole trading
is their main job. The main function of this actors is storing, selling and assorting of Eucalyptus pole that
they received from the middlemen. The main difference between these actors from Tulla pole wholesalers
and retailers is that they are highly dependent on middlemen for Eucalyptus pole as they are far from
Chefasine kebele. Besides, lack of relations with tree growers makes them dependent on the middlemen.
They were afraid of their product to be stolen if they go and buy the stand. However, they are better off than
middlemen and Tulla pole wholesalers and retailers regarding capital and market spaces. Those who have
families in the village in a rear time did the harvesting, loading and unloading and transporting functions of
the chain. They all are educated and were jobless before they start this business.
Large fuelwood wholesalers and retailers: These actors are common fuelwood agents whose primary
function is distributing and vending fuelwood to small fuelwood retailers and consumers. Fuelwood is their
primary business. They used the road said of their home for selling of fuelwood and as they stated storage
space is the main problem of their business.
Small retailers of fuelwood (Flyers): These are another familiar actor of fuelwood value chain and the
main function of these actors are transporting, distributing and selling of fuelwood to the urban consumers
by moving around the town. These actors are from the city and have their own donkey cart. They do not
have their own fixed space for vending and have low capital than the large fuelwood wholesalers and
retailers. They distributed 2 to 4 donkey cartloads of fuelwood per day.
Labourers: Labourers are a critical component in most of the stages of the value chain of Eucalyptus pole
and fuelwood production and marketing. Most of the works of Eucalyptus production and processing are
done manually. The function of the labourer in the Eucalyptus pole and fuelwood production and marketing
includes planting, weeding and hoeing, harvesting of Eucalyptus, removal and separation of branches and
twigs. Besides, transporting to the roadsides or stacking in one area, loading and unloading, chopping large
size woods into a smaller sized wood and fuelwood (1 meter) and assorting different heterogenous class of
poles based on the size, length, quality and function of the pole among others. The labourers were found
working without any safety measures (fig. 16). They were not equipped with any protective equipment.

50
FIGURE 16. WORKERS AT HAWASSA POLE WHOLESALER AND RETAILERS MARKET, ARRANGING AND LOADING OF WOOD
The workers in the production area are from Chefasine village. Most of them were students but not
continuing with their education and depending on their families. The workers in Tulla and Hawassa towns
for loading and unloading, sorting and splitting are from the city of Tulla and Hawassa. They are young
workers and do not have other jobs at all. The work has done in a group of 5 to 10 labourers. The workers
asserted that they were not satisfied with the wage that they are getting. It is because of the increment of
populations in the village and the labourer used for felling, debranching, piling, loading and other activities
are from tree growers and their neighbours. Sometimes only family labourers and their relatives have
participated in the work. Moreover, according to their statement, the work is seasonal, for example, from
June to the end of September none of the tree growers are involved in selling Eucalyptus. The participation
of female worker was found to be almost non-existent. Only a few female labourers have participated in
weeding and hoeing of Eucalyptus stands. The reason is Eucalyptus production and marketing are mainly
set aside for man in the village.
Brokers: These actors are farmers lived in Chefasine kebele. They intervened in the sale of Eucalyptus
woodlots by bringing together tree growers, traders (middlemen, wholesaler and retailer) and consumers.
Their main aim was bringing together and negotiating tree growers and buyers for the marketing of
Eucalyptus stand. In a rare case, they bought the stand of Eucalyptus and sold it to the buyers. However,
because of their financial limitation, buying the stands of Eucalyptus were not a typical job for them. They
were characterised by their mobility, from place to place, to search for information about Eucalyptus
plantations. They were also in contact with many traders of Eucalyptus (middlemen and wholesalers). The
payment for the broker is through negotiation and depend on the way that they interven. They captured on
average, from 100 to 250 ETB (US $ 3.67 to 9.17) per hectare if they negotiate tree growers and traders and
500 to 1500 ETB (US $ 18.35 to 55.05) if they buy and sold the Eucalyptus stand to the buyers. Broking is
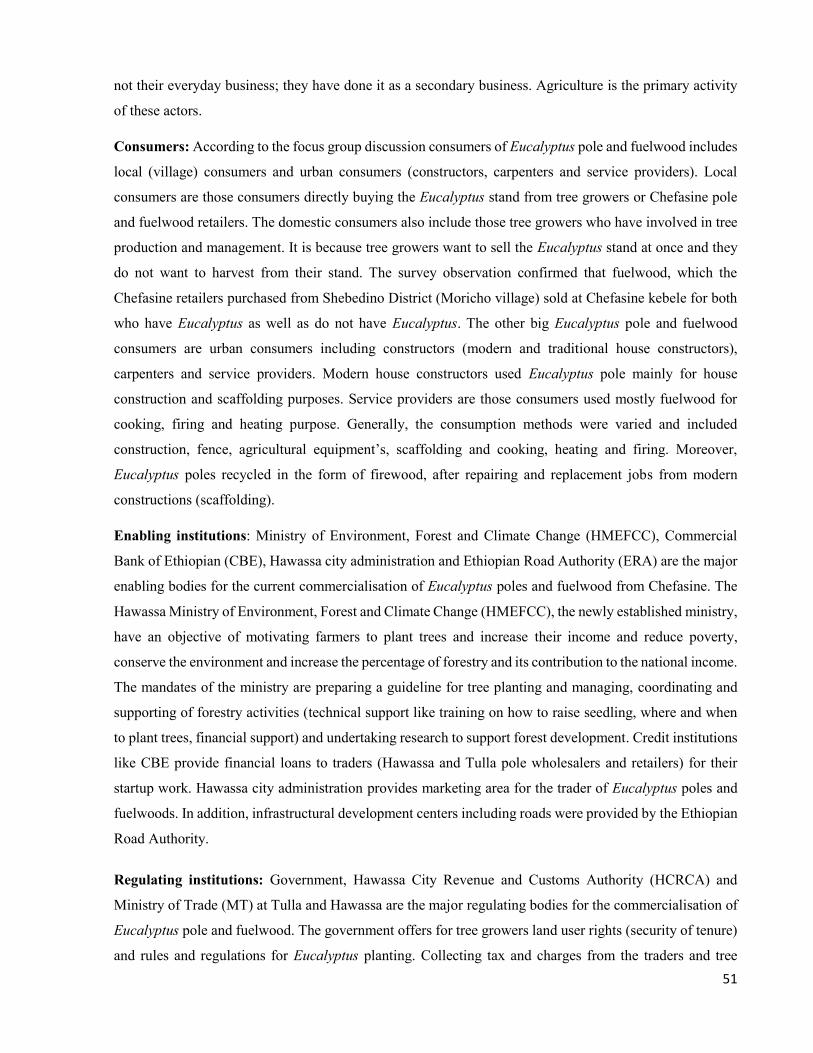
51
not their everyday business; they have done it as a secondary business. Agriculture is the primary activity
of these actors.
Consumers: According to the focus group discussion consumers of Eucalyptus pole and fuelwood includes
local (village) consumers and urban consumers (constructors, carpenters and service providers). Local
consumers are those consumers directly buying the Eucalyptus stand from tree growers or Chefasine pole
and fuelwood retailers. The domestic consumers also include those tree growers who have involved in tree
production and management. It is because tree growers want to sell the Eucalyptus stand at once and they
do not want to harvest from their stand. The survey observation confirmed that fuelwood, which the
Chefasine retailers purchased from Shebedino District (Moricho village) sold at Chefasine kebele for both
who have Eucalyptus as well as do not have Eucalyptus. The other big Eucalyptus pole and fuelwood
consumers are urban consumers including constructors (modern and traditional house constructors),
carpenters and service providers. Modern house constructors used Eucalyptus pole mainly for house
construction and scaffolding purposes. Service providers are those consumers used mostly fuelwood for
cooking, firing and heating purpose. Generally, the consumption methods were varied and included
construction, fence, agricultural equipment’s, scaffolding and cooking, heating and firing. Moreover,
Eucalyptus poles recycled in the form of firewood, after repairing and replacement jobs from modern
constructions (scaffolding).
Enabling institutions: Ministry of Environment, Forest and Climate Change (HMEFCC), Commercial
Bank of Ethiopian (CBE), Hawassa city administration and Ethiopian Road Authority (ERA) are the major
enabling bodies for the current commercialisation of Eucalyptus poles and fuelwood from Chefasine. The
Hawassa Ministry of Environment, Forest and Climate Change (HMEFCC), the newly established ministry,
have an objective of motivating farmers to plant trees and increase their income and reduce poverty,
conserve the environment and increase the percentage of forestry and its contribution to the national income.
The mandates of the ministry are preparing a guideline for tree planting and managing, coordinating and
supporting of forestry activities (technical support like training on how to raise seedling, where and when
to plant trees, financial support) and undertaking research to support forest development. Credit institutions
like CBE provide financial loans to traders (Hawassa and Tulla pole wholesalers and retailers) for their
startup work. Hawassa city administration provides marketing area for the trader of Eucalyptus poles and
fuelwoods. In addition, infrastructural development centers including roads were provided by the Ethiopian
Road Authority.
Regulating institutions: Government, Hawassa City Revenue and Customs Authority (HCRCA) and
Ministry of Trade (MT) at Tulla and Hawassa are the major regulating bodies for the commercialisation of
Eucalyptus pole and fuelwood. The government offers for tree growers land user rights (security of tenure)
and rules and regulations for Eucalyptus planting. Collecting tax and charges from the traders and tree

52
growers are the main function of Hawassa City Revenue and Customs Authority. Tax is collected from tree
growers in the form of land tax and not determined by Eucalyptus woodlot or land size. Ministry of trade
at Hawassa and Tulla provides transport and trade licenses to Eucalyptus poles and fuelwood traders
(middlemen, pole and fuelwood wholesalers and retailers). The enabling and supporting environments are
more elaborated under section 2.8 (regulating and supporting environment).
Input providers: These are actors who are providing inputs such as seedling and farming equipment for
tree growers. These input providers may or may not be tree growers and from Chefasine village. The
knowledge of tree growers for Eucalyptus trees seedling production, planting, spacing, rotation length,
harvesting, marketing, pest identification and control is traditional and from their experiences. According
to Bekele (2011), tree growers in Ethiopia have good traditional knowledge and long experience without
access to extension services to collect seeds, grow seedlings, and plant and tend the crop. However, this
knowledge and experiences do not entail the technical and important knowledge for plantation
establishment and management. Smallholder tree growers in Tanzania, received tree planting and
management knowledge from support organizations (Hingi 2018). Hingi further urged that woodlots
performance was better for supported than unsupported ones. That means for improved woodlots
development, support of tree growers in the study area, in terms of training to enrich knowledge about tree
planting, spacing, rotation length, harvesting and how to act in case of pest occurrence is crucial.
4.8 Eucalyptus pole and fuelwood value added and its distribution along the chain
4.8.1 Quantifying flows of Eucalyptus pole value chain
In Sidama zone generally and Chefasine particularly, Eucalyptus stand is sold as a standing tree from the
tree growers to any potential buyers through bargaining and negotiation (fig. 17). During the bargaining
and negotiation, tree growers used their experience to estimate the price of their Eucalyptus stand. It is
because, knowledge for stand value calculation among tree growers is lacking. In addition, no specialized
forestry extension officers to train tree growers in the study village. While buyers (middlemen and Tulla
pole wholesalers and retailers) used their experiences as well as market information for negotiation. After
a lengthy discussion and talk, they reached a point of consensus about the price of the Eucalyptus stand. In
addition to the experiences and market information of buyers, the price given to the stand is affected by
many factors including distance from the main road, the quality of the stand, the size and age of the stand.
Middlemen and wholesalers and retailers estimate the stand value and set price which favors their profit on
the basis of market information (e.g. demand and supply) which the tree growers do not have. A retailer
and wholesaler in Tulla town, namely Murka, even possess a unique skill to estimate to a high degree of
accuracy, the number of trees of different pole types in a stand. Economic status and income need of tree

53
growers influenced their decision. If they need money for a specific purpose, they do not argue a lot with
the buyers. One of the interviewed tree growers noticed that, he sold his good stand lower than the price he
sold before three years to cover the treatment cost of his son as well the cost for education fees and house
rent.
On average, it was estimated that a total of 16,129 poles could exist in one hectare. According to the
note from the middlemen, from a Kada3, seven trucks of poles were obtained. They usually load a truck 500
to 600 numbers of poles. From section 2.4 (fig. 12) it was observed that about 85% of the poles has delivered
to Hawassa and Tulla towns. It means 13,710 trees per ha per 5 years of rotation or 2,742 trees per ha per
year as poles from a tree grower was supplied to Tulla or Hawassa towns. However, it was not possible to
estimate the quantity of the pole provided to Tulla and Hawassa towns, separately. This is due to four
possible reasons. First, the trader has bought Eucalyptus poles from different villages and did not have a
record, how much is from Chefasine. Secondly, most of the tree growers did not know precisely whether
the Eucalyptus poles delivered to Hawassa or Tulla. Thirdly, there are off and on middlemen and
wholesalers and retailers and finally, pole wholesalers and retailers of Hawassa do not know the specific
area that they received the products. Thus, an equal number of poles (2,742) per hectare per year were
assumed to be supplied for both at Tulla and Hawassa towns.
4.8.2 Quantifying the Eucalyptus fuelwood value chain
For the quantification and estimation of fuelwood, a tree stand sold during the date of data collection were
considered. The calculation is just an estimate based on the information obtained from tree growers and
middlemen since most farmers sell standing trees and the final price is determined by their ability to bargain
with the potential buyer. In this case, a farm-gate price which is about US $ 11 (300 ETB) for a tree, paid
by the middlemen to a tree grower was used for the estimation of revenue, cost, margin and value added.
The middlemen bought a Eucalyptus tree with the age of more than seven years (approximated to 0.11 m3)
to obtain a high amount of donkey cartloads of fuelwood. The middlemen have to negotiate the final price
with the tree growers, and this varies significantly regarding the season, age of the tree, size of the tree and
even the area that the tree grows. After harvesting, the tree is de-branched and split into pieces of 1-meter
log fuelwood. The split fuelwood transported to the larger fuelwood wholesalers and retailers in the urban
centers. Donkey cartloads were having 800 pieces of wood on average (fig. 17).
3 Kada (Bulek in Amharic) is the local unit of land in Sidamagna, which is equal to a quarter of a hectare.
.

54
FIGURE 17. PROCESSING OF EUCALYPTUS FROM TREE GROWER TILL CONSUMERS.
4.8.3 Economic calculation of Eucalyptus poles and fuelwood
The third step following mapping and quantification was the economic analysis of the value chains. In this
stage, the flow of revenues accumulating at various stages of the value chain was analysed based on the
following aspects: 1) income, margin and quantities of pole and fuelwood handled by the different actors,
2) distribution of costs and margin among and within the actors. Thus, the value chain of Eucalyptus pole
and fuelwood has analysed regarding revenue, cost and margins created at different stages/segments of the
chain. The calculation was done based on the purchase, sale and expenses data collected during field visits.
The product price denotes the sale price of unit products. The cost consists of money spent on the product
purchase, labour cost, transpiration cost, tax and fees and other expenses. A margin is an actual money that
an actor receives (revenue) minus total expenses. The cost of items involved was presented in a way to
make it easy to differentiate between value adding and non-value adding costs. Formal taxes and fees and
labour costs (wages) contributed to the value addition. Labour cost includes the cost of family and hired
labourers. Other cost includes transaction costs (communication cost), cost of brokers and seedlings.
Transportation cost is the cost paid for transporting the product and included the costs of the driver for the
pole value chain. As it was seen from the map of Eucalyptus pole and fuelwood (fig. 13 and 14), the value
chain process is not straightforward, due to the participation of many actors along the chain. The result
shows two different main marketing lines for pole and one main marketing line for fuelwood (fig. 13 and
14). These main marketing lines were used for the economic analysis of Eucalyptus pole and fuelwood.

55
Main marketing line for Eucalyptus pole (Line 1: tree grower to Tulla pole wholesaler and retailer to
consumer and Line 2: tree grower to middlemen to Hawassa pole wholesaler and retailer).
Main marketing line for Eucalyptus fuelwood (Tree grower to middlemen to large fuelwood wholesaler
and retailer to small fuelwood wholesaler and retailer to consumer).
4.8.3.1 Price structure of Eucalyptus pole value chain at different levels
Tree grower (producer) level: The price structure at the Eucalyptus tree grower level for 2,742 number of
poles per ha per year is presented in Table 10. The costs involved were the cost of labourers, seedling
purchase and production, and transportation as well as tax for land. Labourer costs are the main component
of all these costs. Using hired labour for Eucalyptus is uncommon in the study area. On average each tree
grower receives US $ 1,308 (35,646 ETB) per hectare per year from the selling of 2,742 poles, which
accounts a profit margin of 93%. The higher profit margin is due to the absence of the product cost. Also,
it indicates the need for lower input requirement for Eucalyptus production. On average, tree growers spent
844 ETB to purchase seedling.
Tulla pole wholesalers and retailers: These are actors who purchased Eucalyptus stand from tree growers
directly and for vending it at Tulla town, which is approximately 7 km further from the Chefasine Kebele.
The price, cost and margin structure of Eucalyptus pole for Tulla Eucalyptus pole wholesalers and retailers
is presented in Table 10. These actors were involved in Eucalyptus pole market through different value-
added activities. They are transforming the Eucalyptus products into semi-processed pole from the standing
tree and transported it to the town and distributed to consumers. The costs involved are product cost
(Eucalyptus pole), harvesting cost, transporting costs, loading and unloading costs, costs of assorting poles
in the landing and taxes and fees. From 2,742 poles, they received a margin of US $ 2,207 (60,133 ETB)
per year which accounted for a profit margin of 59%. The total cost that they spend accounted for US $
1,526 (41,321 ETB).
Middlemen: The price structure of the middlemen is presented in Table 10. In this chain level, similar cost
structure was observed as Tulla pole wholesalers and retailers. The fundamental difference is the
transportation cost from Chefasine to Hawassa town and the cost for the assortment of poles. The cost of
transportation on average was US $ 40 (1,100 ETB) per truck containing 550 Eucalyptus poles. They
received a total of US $ 624 (17,000 ETB) from a truck of poles on average. The total revenue from one
hectare of Eucalyptus pole accounts 85,002 ETB which accounts a gross profit margin of 48%. A total cost
of US $ 1,615 (43,996 ETB) was involved in receiving US $ 3,120 (85,002 ETB) as a revenue.
Hawassa pole wholesalers and retailers: Hawassa pole wholesalers and retailers buy semi processed poles
from middlemen. They received one truck of Eucalyptus poles from middlemen at an average cost of US $

56
624 (17,000 ETB). Entirely they received US $ 4,830 per 2,742 poles per year from Chefasine kebele which
accounts for a profit margin of 34%. The profit margin of this actor is lower than another actor. It is due to
the involvement of higher product purchase cost. They paid a total fee of US $ 8,233 from this US $ 8,183
was used for the purchase of Eucalyptus pole. A summary table for revenue, costs involved, margin and
profit margin of all actors of Eucalyptus poles were presented in Table 10 and the detailed in Appendix II.
Table 10. Summary of benefit and cost of pole value chain for different actors originated from Chefasine
(US $ per ha).
Actors Chefasine tree growers
Middlemen Tulla pole wholesalers and retailers
Hawassa pole wholesalers and retailers
Revenue Quantity 2,742 2,742 2,742 2,742 Unit price 0.48 1.14 1.36 1.76 Total 1,308 3,120 3,723 4,830
Costs
Product 0.00 1,308 1,308 3,119 Family labour 53.00 0.00 0.00 0.00 Hired labour 0.00 73.41 73.39 23.85 Tax and fees 2.39 12.84 11.01 21.1 Transport cost 0.00 202.00 110.09 0.00 Other costs 30.98 18.34 13.75 4.59 Total cost 86 1,615 1,516 3,169
Margin
1,222 1,506 2,207 1,661 Profit Margin (%)
93 48 59 34
4.8.3.2 Price structure of Eucalyptus fuelwood value chain at different levels.
A summary of the breakdown of the benefit, cost, and margin of actors for fuelwood value chain was given
in Table 11, and the detailed analysis found in Appendix II. The main actors of the Eucalyptus fuelwood
value chain are tree growers, middlemen, large fuelwood wholesalers and retailers and small fuelwood
retailers (flyers). For this analysis, a tree (1.06 m3) which costs, on the average US $ 11 (300 ETB) for the
middlemen and revenue for the tree growers were used. The middlemen get five donkey cartloads from the
US $ 11 priced trees. One donkey cartload contains on average 800 pieces of fuelwood. Each part of
fuelwood was sold at US $ 0.03 (1 ETB). So, the middlemen earn revenue of US $ 11 from one donkey
cartloads and US $ 147 from a stand. The large fuelwood wholesalers and retailers resell a piece of fuelwood
at a price of US $ 0.04 (1.10 ETB) to the small fuelwood retailers and US $ 0.05 (1.25 ETB) for consumers
who come to their vending site. The price difference is because small fuelwood retailers buy a higher
quantity of fuelwood, at least a full of donkey cartloads. Then the small fuelwood retailers again resell the
fuelwood directly to the consumer by moving around the town at a price of US $ 0.05 (1.25 ETB) per pieces.

57
Table 11. Summary of benefit, cost and margin distribution from five loads of fuelwood (1.06m3) for
different actors along the chain (US $).
Actors Tree growers Middlemen
Large fuelwood wholesalers and
retailers
Small fuelwood retailers (Flyers)
Revenue Quantity (Cartload) 5.00 5.00 5.00 5.00 Unit price 2.20 29.34 32.29 36.69 Total price 11.00 146.79 161.47 183.49
Costs
Product cost 0.00 11.00 146.79 161.47
Family labour 1.60 0.00 0.00 2.94
Haired labour 0.00 18.71 1.83 0.00
Tax and fees 0.00 0.00 0.92 0.00
Transportation cost 0.40 11.01 0.00 3.67
Total cost 2.00 40.72 149.54 168.08
Margin 9.00 106.07 11.93 15.41
Profit margin (%) 82 72 7 8
The above table shows that tree growers and middlemen were received US $ 11 (300 ETB) and 146.79
(4,000 ETB), respectively from 5 loads of fuelwood accounting for 82% and 72% of the profit margin,
respectively. The cost involved for the tree growers are labour and seedling costs and for the middlemen
are product cost (cost of 5 cartloads of fuelwood), labour cost (felling, splitting, loading and unloading and
transporting) and communication cost (mobile calling). Large fuelwood wholesalers and retailers and small
fuelwood retailers received an average of US $ 162 (4,400 ETB) and 184 (5,000 ETB) and a margin of US
$ 12 (327 ETB) and 15 (400 ETB) per 5 loads, respectively. Large fuelwood wholesalers and retailers have
a profit margin of 7% while small fuelwood retailers have 8% of a load of fuelwood. The costs involved for
small fuelwood retailers are product cost (cost of loads of fuelwood), transportation cost and labour cost.
4.8.3.3 Cost distribution of Eucalyptus poles and fuelwood
Eucalyptus poles cost distribution: The basic structure of costs involved per 2,742 trees per hectare or 5
trucks of Eucalyptus pole for the identified lines and respective different actor’s level was presented in
Table 12. A total cost of US $ 1,602 (43,654 ETB) and US $ 4,869 (132,680 ETB) for pole at line 1 (from
Chefasine to Tulla) and line 2 (from Chefasine to Hawassa), respectively was incurred as a whole from the
tree growers up to the pole wholesalers and retailers of each lines of Eucalyptus pole.

58
Table 12. Distribution of costs at different actor levels for pole from Chefasine to Tulla (Line 1) and
Chefasine to Hawassa (line 2) (US $). Li
ne
Actors Product cost
Labour cost Tax and fees
Transport cost
Other costs
Total cost
Family Hired
Line
1
Chefasine tree growers 0 53 0 2 0 31 86 (5.36%)
Tulla pole wholesalers
and retailers
1,308 0 73 11 110 14 1,516 (94.63%)
Accumulated value 1,308 53 73 13 110 45 1,602
Line
2
Chefasine tree growers 0 53 0 2 0 31 86 (1.76%)
Middlemen 1,308 0 73 13 202 18 1,615 (33.17%)
Hawassa pole
wholesalers and retailers
3,119 0 24 21 0 5 3,169 (65.07%)
Accumulated value 4,427 53 97 36 202 54 4,869
Of the total cost of US $1,602 Eucalyptus poles at line one, Tulla pole wholesalers and retailers incur the
highest cost of US $ 1,516 (94.63%) while tree growers bear the lowest direct cost US $ 86 (5.36%) of the
total cost. At line two, from the total cost of US $ 4,869, Hawassa pole wholesalers and retailers incur the
highest cost of US $ 3,169 (65.07%) followed by middlemen US $ 1,615 (33.17%) and tree growers US $
86 (1.76%) of the total cost. Product purchase cost alone accounts a total of US $ 1,308 (81.65%) and
exclusively covered by Tulla pole wholesalers and retailers (100%) for line 1 and for line 2 it accounts for
US $ 4,427 of the total cost with the higher proportion at Hawassa pole wholesalers and retailers level
(70.45%) followed by middlemen US $ 1,308 (29.55%). Transportation cost comprises US $ 110 (6.86%)
for line 1 and US $ of 202 (4.15%) for line 2. Other costs (communication costs, seedling purchase cost and
payment for brokers) comprise US $ 45 (2.80%) and US $ 54 (1.11%) for line 1 and line 2, respectively.
Labour costs and tax and fees accounted for US $ 126, 150, 13 and 36, for line 1 and 2, respectively. The
contribution of costs and margins at Figure 18 indicated the accumulation of higher cost and margin as the
level moves from tree grower to consumers for line one and two.

59
FIGURE 18. COST AND MARGIN DISTRIBUTION BY ACTORS AND SEGMENTS FOR EUCALYPTUS POLES FROM CHEFASINE TO
TULLA (LINE 1) AND CHEFASINE TO HAWASSA TOWN (LINE 2).
Cost distribution of Eucalyptus fuelwood: The basic structure of costs involved per 5 donkey cartloads
of fuelwood at different actor’s level was presented in Table 13. A total cost of US $ 360 (9,810 ETB)
incurred for the entire chain from the tree growers up to the small fuelwood retailers level. Of the total cost
of US $ 360, small fuelwood retailers incurred the highest cost US $ 168.08 (46.64%). Tree growers, large
fuelwood wholesalers and retailers and middlemen incurred the cost by 0.55%, 41.41%, and 11.30% of the
total cost respectively.
Table 13. Distribution of costs at different actor levels for Eucalyptus fuelwood value chain (US $ per 5
donkey cartloads).
Actors Product
cost Labour cost Tax and
fees Transport
cost Total cost
Family Hired Tree growers 0.00 1.60 0.00 0.00 0.40 2.00 (0.55%)
Middlemen 11.00 0.00 18.71 0.00 11.01 40.72 (11.30%) Large fuelwood wholesalers and retailers
146.79 0.00 1.83 0.92 0.00 149.54 (41.41%)
Small fuelwood retailers (Flyers)
161.47 2.94 0.00 0.00 3.67 168.08 (46.64%)
Accumulated value 319.26 4.54 20.54 0.92 15.08 360.34

60
The product purchase cost alone accounts for US $ 319 (88.59%) of the total cost with almost similar
structure at large and small fuelwood actor levels. This is followed by formal wages by 6.96% transportation
cost by 4.18%. Tax and fees accounted for about 0.25% of the total cost. It indicates the contribution of
fuelwood from Chefasine as a revenue for the government is almost negligible. The cost accrued as wages
to labourer’s level is highest at the middlemen level, accounted for 61.59% of the total cost. The highest
margin US $ 106 was accrued at the middlemen level with the lower product cost of US $ 11. However, the
large fuelwood wholesalers and retailers, incurred high product cost and received a lower profit (margin)
(fig. 19).
FIGURE 19. COST AND MARGIN DISTRIBUTION ACROSS DIFFERENT ACTORS IN EUCALYPTUS FUELWOOD VALUE CHAIN.
4.8.4 Value added and its distribution of Eucalyptus poles and fuelwood
The value added at each level is the total revenue minus the cost of all the intermediary inputs and services
coming outside the chain. The intermediary cost includes product purchase cost, transportation and
transaction costs (communication cost). In other way value added is described as the sum of the margin
(revenue less expense) of actors, the labour wages and taxes and fees. A detailed description and
interpretation of the value added and its distribution for Eucalyptus pole and fuelwood value chain is given
here below.

61
4.8.4.1 Value added and its distribution for Eucalyptus poles
The total value added for the value chain of Eucalyptus poles was calculated from Chefasine village up to
Tulla and Hawassa pole wholesalers and retailers’ level and provided under Table 14 for line 1: Chefasine
to Tulla and line 2: Chefasine to Hawassa. The value addition starts from the tree grower level. The total
value added was US $ 3,568 (97,228 ETB) and US $ 4,575 (124,669 ETB) for line 1 and line 2, respectively
for 5 trucks (approximately 60 m3) of Eucalyptus poles. From line 1, Tulla pole wholesalers and retailers
realize US $ 2,291 (64.21%) of the value addition, while Chefasine tree growers added value by US $ 1,277
(35.79%) of the value addition. Thus, the highest value addition lies in the production and marketing of
Eucalyptus pole at the Tulla pole wholesalers and retailers’ level. For line 2, Hawassa pole wholesalers and
retailers grasp US $ 1,706 (37.30%) of the value addition indicating the highest value addition followed by
middlemen accounting US $ 1,592 (34.79%). Tree growers add value by 27.91% (US $ 1,277) in line 1.
The lower the value addition at tree growers level indicates the limited value-added processing of
Eucalyptus production and marketing.
Table 14. Value added at different levels along the chain and its distribution for Chefasine to Tulla (line 1)
and Chefasine to Hawassa (Line 2) (US $).
Actors Labour cost Tax and fees
Margin Value added Family Hired
Line
1 Chefasine tree growers 53 0 2 1,222 1,277 (35.79%)
Tulla pole wholesalers and retailers 0 73 11 2,207 2,291(64.21%) Chain total 53 73 13 3,429 3,568
Line
2
Chefasine tree growers 53 0 2 1,222 1,277(27.91%) Middlemen 0 73 13 1,506 1,592 (34.79%) Hawassa pole wholesalers and retailers 0 24 21 1,661 1,706 (37.30) Chain total 53 97 36 4,389 4,575
Figure 20 shows the value added and its composition of Eucalyptus pole actors of Chefasine for line 1 and
line 2, respectively. From line 1, Tulla pole wholesalers and retailers and tree growers reaped profit by
96.33% and 95.66%, respectively. About 3.19% and 4.15% of the value added at Tulla pole wholesalers
and retailers and tree growers level goes as a wage of labourers. From line 2, Hawassa pole wholesalers and
retailers reaped a profit (97.36%) followed by Chefasine tree growers (95.66%) and middlemen (94.61%).
From the total value created in line 2 about 4.59% from the middlemen, 4.15% from the tree growers and
3.28% from the entire chain were delivered as a wage to the labourers whereas the lower proportion was
from Hawassa pole wholesalers and retailers accounted only 1.4% from the total value added. From the
total value created, the direct actors including tree growers and Tulla pole wholesalers and retailers for line
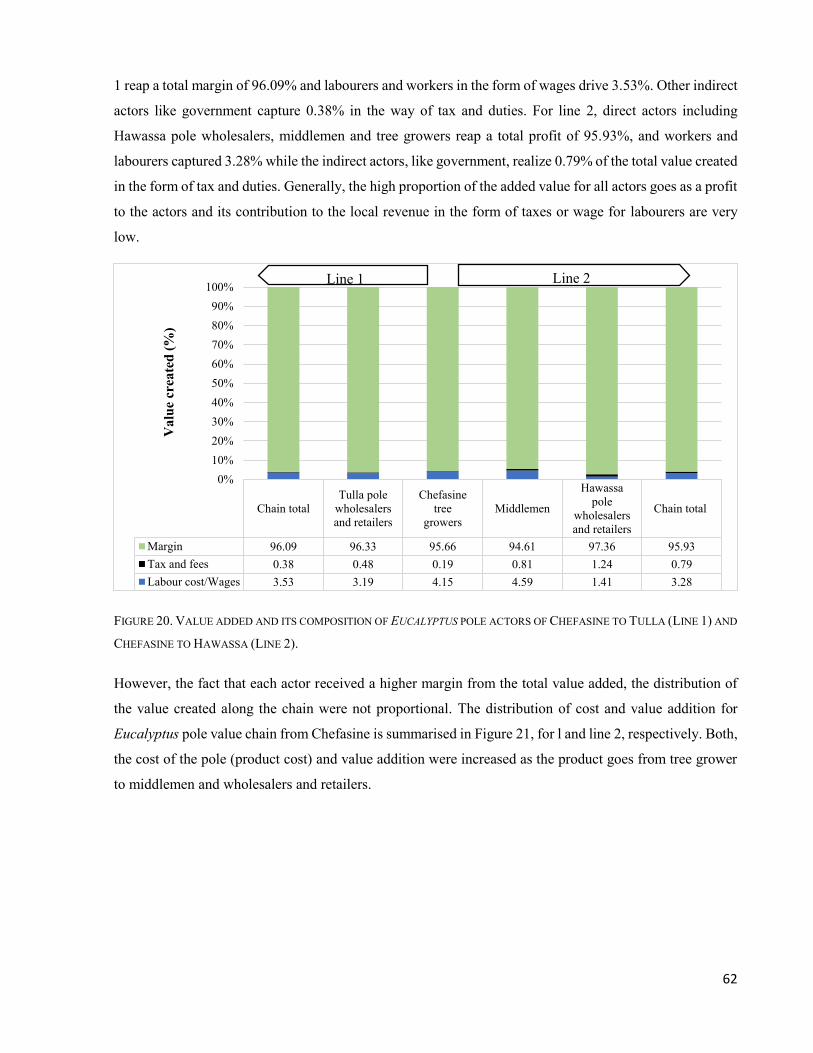
62
1 reap a total margin of 96.09% and labourers and workers in the form of wages drive 3.53%. Other indirect
actors like government capture 0.38% in the way of tax and duties. For line 2, direct actors including
Hawassa pole wholesalers, middlemen and tree growers reap a total profit of 95.93%, and workers and
labourers captured 3.28% while the indirect actors, like government, realize 0.79% of the total value created
in the form of tax and duties. Generally, the high proportion of the added value for all actors goes as a profit
to the actors and its contribution to the local revenue in the form of taxes or wage for labourers are very
low.
FIGURE 20. VALUE ADDED AND ITS COMPOSITION OF EUCALYPTUS POLE ACTORS OF CHEFASINE TO TULLA (LINE 1) AND
CHEFASINE TO HAWASSA (LINE 2).
However, the fact that each actor received a higher margin from the total value added, the distribution of
the value created along the chain were not proportional. The distribution of cost and value addition for
Eucalyptus pole value chain from Chefasine is summarised in Figure 21, for l and line 2, respectively. Both,
the cost of the pole (product cost) and value addition were increased as the product goes from tree grower
to middlemen and wholesalers and retailers.
Chain totalTulla pole
wholesalersand retailers
Chefasinetree
growersMiddlemen
Hawassapole
wholesalersand retailers
Chain total
Margin 96.09 96.33 95.66 94.61 97.36 95.93Tax and fees 0.38 0.48 0.19 0.81 1.24 0.79Labour cost/Wages 3.53 3.19 4.15 4.59 1.41 3.28
0%10%20%30%40%50%60%70%80%90%
100%
Val
ue c
reat
ed (%
)
Line 2 Line 1

63
FIGURE 21. DISTRIBUTION OF VALUE ADDED AND COST ALONG THE CHAIN FOR LINE ONE AND LINE TWO.
The commercial margin of the actors was also estimated to know the distribution of gains for each actor
and presented under Table 15 for line 1 and 2. The calculation of the commercial margin revealed that the
total marketing margin is 64.86% and 72.92% for line 1 and 2, respectively, indicating that tree growers
who own the tree catch an equivalent of only 35.14% and 27.08% from line 1 and 2, respectively of the
final price of the product. In line 1, Tulla pole wholesalers and retailers are the only one competing with the
tree growers and captured higher value from the value added. From the second line middlemen and Hawassa
pole wholesalers and retailers reap 37.52% and 35.40%, respectively, indicating higher commercialisation
margin at the middlemen level.
Table 15. Commercialisation margin of Eucalyptus pole for different actors along the chain at line one and
line two.
Actors Average price Commercialisation margin Purchase Sale US $ %
Line
1 Chefasine tree grower 1,308
Tulla pole wholesaler and retailer 1,308 3,723 2,415 64.86
Total value 3,723 100
Line
2
Chefasine tree grower 1,308
Middlemen 1,308 3,120 1,812 37.52 Hawassa pole wholesaler and retailer 3,120 4,830 1,710 35.40 Total value 3,522 72.92 4,830 100

64
4.8.4.2 Eucalyptus fuelwood value added and its distribution
In this section, Eucalyptus fuelwood value added, and its composition was presented and discussed from
the tree grower up to small fuelwood retailer level (Table 16 and fig. 22.). The total value added realised
per 5 donkey cartloads of fuelwood from the entire chain was US $ 168.41 (4,539 ETB). Of the total US $
168.41 value added, middlemen accrued US $ 124.78 (74.09%) while tree growers, large fuelwood
wholesalers and retailers and small fuelwood retailers accumulated US $ 10.60 (6.29%), 14.68 (8.72%) and
18.35 (10.90%), respectively. These indicate, the limited and low level of value addition processing at the
level of tree growers, large fuelwood wholesalers and retailers and small fuelwood retailers. The highest
value addition lies in the production and marketing of Eucalyptus fuelwood at the middlemen level. Felling,
debranching, splitting, loading and unloading and transporting are the value addition processing activities
performed by the middlemen.
Table 16. Value added of Eucalyptus fuelwood at different levels along the chain and its distribution (US
$).
Actors Wages Tax and fees Margin Total value added
Tree growers 1.60 0.00 9.00 10.60 (6.29%)
Middlemen 18.71 0.00 106.07 124.78 (74.09%)
Large fuelwood wholesalers and retailers 1.83 0.92 11.93 14.68 (8.72%)
Small fuelwood retailers (Flyers) 2.94 0.00 15.41 18.35 (10.90%)
Chain total 25.08 0.92 142.41 168.41
From Figure 22, it was observed that a high proportion of the added value goes to the actor’s tree growers,
middlemen, large and small fuelwood wholesalers and retailers as margin. From the total value created in
the chain (US $ 168.41), US $ 142.41 (84.56%), US $ 25.08 (14.89%) and US $ 0.92 (0.55%) goes as
margin, a wage for labourers and as government revenue in the form of tax. From the total value added,
middlemen, large fuelwood wholesalers and retailers, small fuelwood retailers and tree growers realised
(US $ 106.07 (85.01%), 11.93 (81.27%), 15.41 (83.98%) and 9 (84.91%)) of margin, respectively. The
small proportion of revenue for the government could be due to the lack of controlled and systematic tax
collection system. Labourers captured 15% of the value created at the middlemen level.

65
FIGURE 22. VALUE ADDED AND ITS COMPOSITION OF EUCALYPTUS FUELWOOD AT DIFFERENT LEVELS ALONG THE CHAIN.
Unlike the Eucalyptus pole, in Eucalyptus fuelwood value chain, higher value addition was created at the
middlemen level (US $ 124.78, 3,400 ETB) and lower at the wholesalers and retailers’ level (US $ 14.68
(400 ETB) and 18.35 (500 ETB)), respectively. But, the product cost increase along the chain (fig. 23).
FIGURE 23. DISTRIBUTION OF VALUE ADDED AND COST ALONG THE CHAIN FOR EUCALYPTUS FUELWOOD.
The analysis of the relative commercialisation margin of the actors in Table 17 shows 94% of the domestic
consumer price captured by the traders and therefore the equivalent value captured by tree growers
Tree growers MiddlemenLarge fuelwoodwholesalers and
retailers
Small fuelwoodretailers (Flyers) Chain total
Margin 84.91 85.01 81.27 83.98 84.56Tax and fees 0.00 0.00 6.27 0.00 0.55Labour cost 15.09 14.99 12.47 16.02 14.89
0%10%20%30%40%50%60%70%80%90%
100%
Val
ue a
dded
com
post
ion
(%)

66
(producers) is about 6%. Middlemen level is the main segment of the Eucalyptus fuelwood marketing chain,
with 74% commercialisation margin, followed by small fuelwood retailers (12%) and large fuelwood
wholesalers and retailers (8%). From this, it can be seen that the market characteristics limit producers’
share in the final price of the product.
Table 17. Commercialisation margin of Eucalyptus fuelwood for different actors along the chain (2.4 Tone).
Actors Average price Commercialisation margin Purchase Sale US $ %
Tree grower 11 Middlemen 11 147 136 74 Large fuelwood wholesaler and retailer 147 162 15 8 Small fuelwood retailers (flyers) 162 184 22 12
173 94 Total value 184 100
4.9 The roles of Eucalyptus pole and fuelwood business to actor's livelihood strategies
4.9.1 The livelihood strategies of actors
Tree growers. Chefasine farmers have been practicing different livelihood strategies for a long-time
including homestead agroforestry (HAF’s) such as vegetables, enset, coffee and khat, plating of fruit trees
like banana, avocado and gesho and trees like cordia, crop farming like haricot bean and maize, livestock
keeping (animal and animal products) and woodlot (fig. 24). Moreover, non-farm activities including
training, remittance others are additional sources of livelihood for the Chefasine farmers. HAF's is the
dominant livelihood strategy practised in the village whereby the traditional home garden of enset-coffee-
based agroforestry system dominated. All the respondents have practised homestead agroforestry-based
farming system of coffee enset and khat farming.

67
FIGURE 24. LIVELIHOOD STRATEGIES OF CHEFASINE TREE GROWER.
Traders: The main livelihood activity of the traders are pole and fuelwood trading; transporting,
distribution and vending. About 88% of the respondents confirmed that Eucalyptus poles and fuelwood
marketing are their main livelihood activity. Farming and transporting other products as well as trading of
goods and commodities were the additional source of their livelihood strategies for the few of Tulla pole
wholesalers and retailers, transporters and middlemen. However, the livelihood strategies of all the large
fuelwood wholesalers and retailers, small fuelwood retailers and Hawassa pole wholesalers and retailers
were 100% composed by Eucalyptus pole and fuelwood business activities.
4.9.2 Contribution of Eucalyptus pole and fuelwood for the livelihood of actor’s
4.9.2.1 Eucalyptus pole and fuelwood contribution for the livelihood of Chefasine tree growers.
Woodlots in Chefasine have several contributions for the livelihood of the farmers. Tree growers in
Chefasine has planted Eucalyptus for income generation (16%), construction (15%), fuelwood (14%), for
fencing and shading (9%), for soil conservation (8%) as well as to make farming equipment’s (5%) (fig.
25). In addition to this, tree growers were mentioned other functions (24%) including shelter or windbreak,
reduce deforestation, saving, seed production, bonfire (Demera), storage facilities, scaffolding, furniture
making and job creation.
0 5 10 15 20 25
Khat
Coffee
Enset
Vegetable
Cordia
fruit tree
Maize
Haricot bean
Eucalyptus
Remittance
Training
Animal and Animal products
HA
F'S
Crop
farm
ing
Woo
dlot
Non
-farm
activ
ities
Live
stoc
kre
arin
g
Frequency of respondents

68
FIGURE 25. CONTRIBUTION OF EUCALYPTUS FOR CHEFASINE TREE GROWERS LIVELIHOOD.
Thus. Eucalyptus pole and fuelwood contributed for tree growers of Chefasine mainly for income
generation, construction, fuelwood, fencing, saving and others.
4.9.2.2 Income contribution of Eucalyptus products to tree grower’s livelihood
Since in the last decades there has been a massive drive by the government to improve the benefits of
smallholder farmers through intensified farming (supply of fertiliser and improved seeds) system. Chefasine
kebele was one of the beneficiaries of this drive to increase the productivity of crops like coffee, khat, enset,
maize and others. There is also high demand for Eucalyptus in the area mostly for construction and
fuelwood. Therefore, it was found to be interesting to do the economic analysis of different livelihood
strategies of Chefasine tree growers to know if it is profitable to grow Eucalyptus as compared to other
crops livelihood portfolios. When carrying out the investigation, assumptions 1) a farmer who invests in
khat production will collect two times in a year; hence the gross margin of khat was estimated by doubling
the seasonal amount 2) farmers have adopted the intensified farming methods guaranteeing them high yields
under favourable weather conditions and 3) the perennial crops will remain productive for the expected
lifespan were considered. Table 18 shows the expected productive lifespan for the analysed perennial crops
in Chefasine kebele which were used to amortise the establishment costs. All the costs before the perennial
crops gave any yields treated as establishment costs. The expected lifespan of each perennial crops has
decided during the key informant interview with Chefasine village experts and development agency.
Construction(15%)
Firewood (14%)
Income generation(16%)
Soil conservation(8%)
Fencing (9%)
Shading (9%)
Others (24%)
Farming equipment (5%)

69
Table 18. Expected productive lifespan of different crops.
No. Perennial crop Expected lifecycle 1 Coffee 25 2 Khat 30 3 Enset 6 4 Eucalyptus 5 5 Fruit trees 15 6 Cordia 20
Source: Discussion with key informant interview of village expertise and development agents.
A summary of the benefit, cost and gross margin analysis for all the selected crops per hectare per year was
shown in Figure 26, and the calculations for individual crops were found in the appendices part (Appendix
III). The cost of land and capital over the years for the perennial crops were not included for the calculation
of gross margin. As it was seen from Figure 26 clearly, Eucalyptus production has a higher gross margin of
on the average US $ 1,489 (40,575) per year per hectare followed by khat US $ 1,211 (32,999 ETB) and
coffee and 1,008 (27,468 ETB) per year per hectare. The lowest gross margin was observed from vegetables,
Cordia africana, enset, fruit trees and haricot bean farming systems US $ of 5, 55, 10, 42 and 89,
respectively.
FIGURE 26. GROSS MARGIN, REVENUE AND VARIABLE COST OF SELECTED CROPS IN CHEFASINE.
The average income percentage distributions of different livelihood portfolios of Chefasine tree grower
were found under Figure 27. Home-based agroforestry practice were the leading sources of revenue for the
tree growers (55%) followed by Eucalyptus (35%). Crop farming, animal and their products and non-farm
0
500
1,000
1,500
2,000
2,500
Eucalyptus
production
Khat Coffee Enset Cordia Fruittrees
Vegetables
Haricotbean
Maize
Revenue 1,539 2,046 1,243 200 31 73 16 124 489Variable costs 49 834 245 145 52 31 11 34 379Gross margin 1,489 1,211 1,008 55 10 42 5 89 110
Val
ues i
n U
S $

70
activities cover the lowest percentage of gross income sources (5%, 3% and 2%), respectively. It implies
that, although tree growers have different income-earning livelihood strategies, woodlot is the second
leading and dominant sources of income following HAF’s. However, when the contribution of each crop
was analysed separately, the gross margin from Eucalyptus (US $ 1,489) becomes higher than the other
followed by khat (US $ 1,211) and coffee (US $ 1,008) (fig. 26). It is due to the lower variable cost, incurred
for the production of Eucalyptus (US $ 39) (fig. 26). Several studies in Ethiopia (Demamu 2002; Mekonnen
et al. 2007; Zerihun 2010; Mekonnen 2013 and Abiyu et al. 2015), proved the profitability of Eucalyptus
plantation as compared to other production option (crops and animals) of the smallholder farmers.
FIGURE 27. THE AVERAGE INCOME DISTRIBUTION OF DIFFERENT LIVELIHOOD PORTFOLIOS OF CHEFASINE TREE
GROWERS.
The income generated from the sale of Eucalyptus products has used for purchasing household consumption
materials (clothes, food and other equipment) (17%), input material for farming (such as: improved seed
(11%) and fertiliser (12%)), livestock’s (7%), for medical and health cares (11%), school fees and house
rent (15%) and for purchasing of construction materials like steel (10%). Also, tree growers used the income
from Eucalyptus to purchase a house in towns, motorcycle, land, to return credit as well as to buy
agricultural input supplements and for social events such as equb and edir (fig 28).
Eucalyptus production
35%
Home based Agroforestry (HAFs)55%
Crop production5%
Animal and animal products
3%
Non-farm activities2%
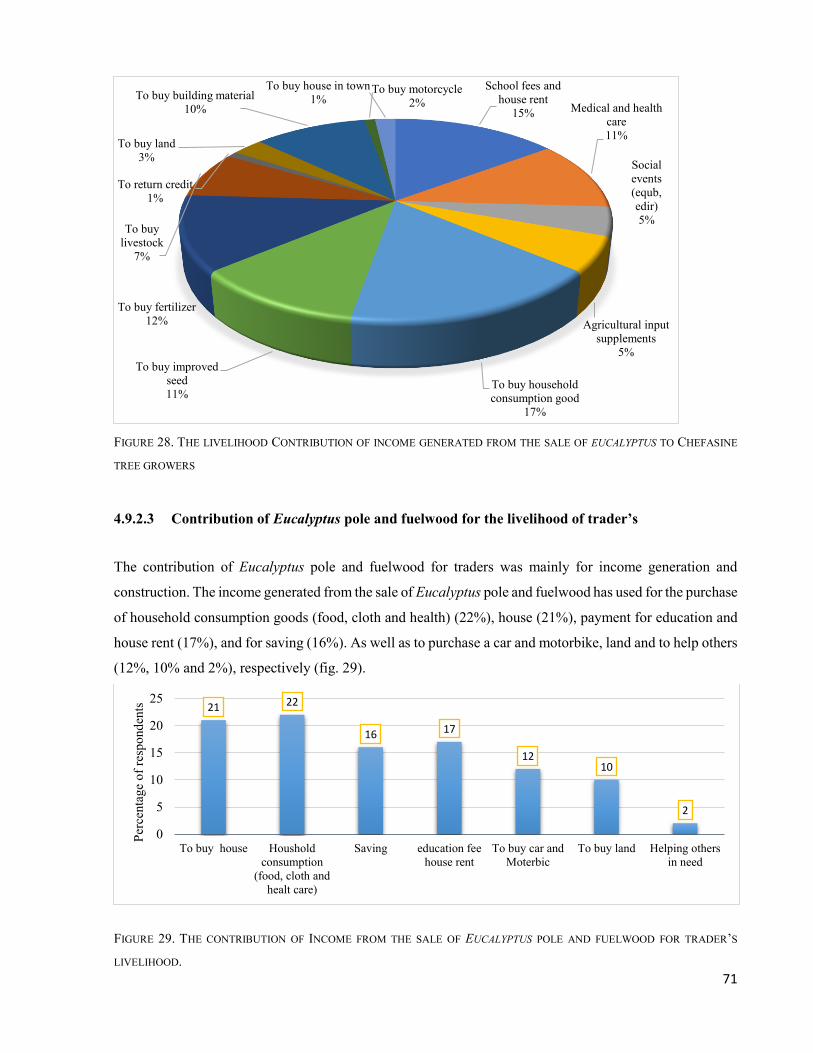
71
FIGURE 28. THE LIVELIHOOD CONTRIBUTION OF INCOME GENERATED FROM THE SALE OF EUCALYPTUS TO CHEFASINE
TREE GROWERS
4.9.2.3 Contribution of Eucalyptus pole and fuelwood for the livelihood of trader’s
The contribution of Eucalyptus pole and fuelwood for traders was mainly for income generation and
construction. The income generated from the sale of Eucalyptus pole and fuelwood has used for the purchase
of household consumption goods (food, cloth and health) (22%), house (21%), payment for education and
house rent (17%), and for saving (16%). As well as to purchase a car and motorbike, land and to help others
(12%, 10% and 2%), respectively (fig. 29).
FIGURE 29. THE CONTRIBUTION OF INCOME FROM THE SALE OF EUCALYPTUS POLE AND FUELWOOD FOR TRADER’S
LIVELIHOOD.
School fees and house rent
15% Medical and health care11%
Social events (equb, edir)5%
Agricultural input supplements
5%
To buy household consumption good
17%
To buy improved seed 11%
To buy fertilizer12%
To buy livestock
7%
To return credit1%
To buy land3%
To buy building material10%
To buy house in town1%
To buy motorcycle2%
21 22
16 17
1210
2
0
5
10
15
20
25
To buy house Housholdconsumption
(food, cloth andhealt care)
Saving education feehouse rent
To buy car andMoterbic
To buy land Helping othersin need
Perc
enta
ge o
f res
pond
ents
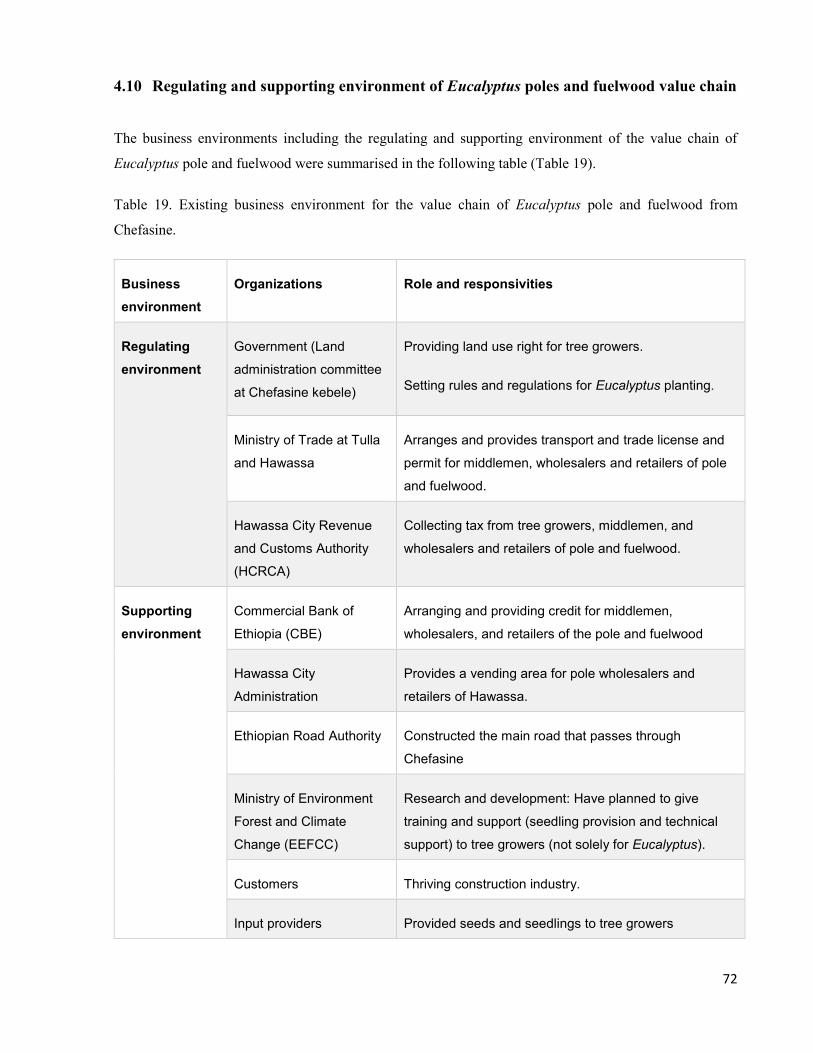
72
4.10 Regulating and supporting environment of Eucalyptus poles and fuelwood value chain
The business environments including the regulating and supporting environment of the value chain of
Eucalyptus pole and fuelwood were summarised in the following table (Table 19).
Table 19. Existing business environment for the value chain of Eucalyptus pole and fuelwood from
Chefasine.
Business environment
Organizations Role and responsivities
Regulating environment
Government (Land
administration committee
at Chefasine kebele)
Providing land use right for tree growers.
Setting rules and regulations for Eucalyptus planting.
Ministry of Trade at Tulla
and Hawassa
Arranges and provides transport and trade license and
permit for middlemen, wholesalers and retailers of pole
and fuelwood.
Hawassa City Revenue
and Customs Authority
(HCRCA)
Collecting tax from tree growers, middlemen, and
wholesalers and retailers of pole and fuelwood.
Supporting environment
Commercial Bank of
Ethiopia (CBE)
Arranging and providing credit for middlemen,
wholesalers, and retailers of the pole and fuelwood
Hawassa City
Administration
Provides a vending area for pole wholesalers and
retailers of Hawassa.
Ethiopian Road Authority Constructed the main road that passes through
Chefasine
Ministry of Environment
Forest and Climate
Change (EEFCC)
Research and development: Have planned to give
training and support (seedling provision and technical
support) to tree growers (not solely for Eucalyptus).
Customers Thriving construction industry.
Input providers Provided seeds and seedlings to tree growers

73
The regulating environments included: formal regulations such as trade and transport permits, tax, land use
right and regulations on Eucalyptus planting are exiting in the value chain of Eucalyptus poles and
fuelwood. Informal regulations such as rules and norms which were not in place for this case. Government
(Land administration committee at Chefasine kebele) regulates the chain by allowing or granting land user
rights (tenure security) to the tree growers. It enables them to plant, utilise and benefit from the Eucalyptus
trees plantation. Ministry of Trade at Tulla and Hawassa arranges and provides transport and trade
permission or license for the middlemen and wholesalers and retailers of Eucalyptus pole and fuelwood.
The Commercial Bank of Ethiopia arranges and provides a financial loan to traders for their startup
work, however, most of the traders, particularly wholesalers and retailers are not interested and happy for
the service. It is because traders have to pay the loan to the bank after two years whether they are profitability
or not. Tree growers did not receive any financial support from anybody. The absences of any credit
institution for tree growers in need of money enforces them to harvest the stand in an earlier age such as at
the age of three.
Collecting tax and charges from the middlemen and wholesalers and retailers of pole and fuelwood is
regulated by Tulla and Hawassa City Revenue and Customs Authority. Supporting environments including
state extension, research, NGO’s and associations are not functioning in the village for Eucalyptus
production and marketing. The extension workers, researchers and NGO’s are focussing on coffee, enset
and other crops. The agricultural extension workers of Chefasine, Mr. Agiso Hassen, stated that ‘in the past,
there was a tree nursery for Eucalyptus by government and NGO’s producing and providing free
Eucalyptus seedlings to tree growers, but currently they are not producing and providing, as the support
stopped from both government and NGO’s. According to the newly established, Hawassa Ministry of
Environment, Forest and Climate Change, there is no particular plan for Eucalyptus, however, has planned
to produce and disseminate seedlings and provide training to farmers in the region. Moreover, the
government has enacted a law to encourage forest investment through mechanisms such as lease-free land,
better access to land use and forest ownership certificates and tax grace until the initial harvest (for private
investors and associations) and the second harvest (for smallholders and communities).
Most of the tree growers (70%) did not have market information about Eucalyptus marketing. The lack
of market information and knowledge together with the absence of a support organisation for example on
technical aspects and financial aspects limit their value addition processing activities like harvesting and
transporting to the market. In turn, it reduces the share of profit from the final sale of their products. On the
other hand, the small financial support and availability of licenses for traders (middlemen for pole and
fuelwood and pole wholesalers and retailers) helped them to have high benefit sharing from the final sale
of the products.
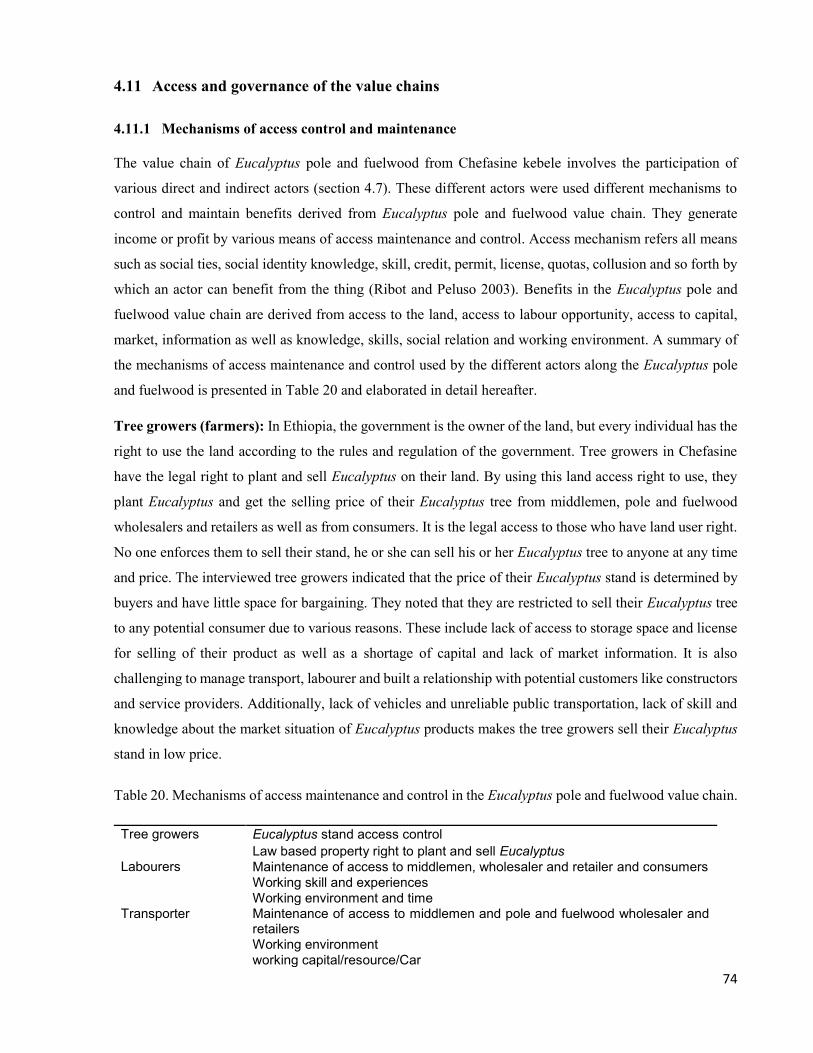
74
4.11 Access and governance of the value chains
4.11.1 Mechanisms of access control and maintenance
The value chain of Eucalyptus pole and fuelwood from Chefasine kebele involves the participation of
various direct and indirect actors (section 4.7). These different actors were used different mechanisms to
control and maintain benefits derived from Eucalyptus pole and fuelwood value chain. They generate
income or profit by various means of access maintenance and control. Access mechanism refers all means
such as social ties, social identity knowledge, skill, credit, permit, license, quotas, collusion and so forth by
which an actor can benefit from the thing (Ribot and Peluso 2003). Benefits in the Eucalyptus pole and
fuelwood value chain are derived from access to the land, access to labour opportunity, access to capital,
market, information as well as knowledge, skills, social relation and working environment. A summary of
the mechanisms of access maintenance and control used by the different actors along the Eucalyptus pole
and fuelwood is presented in Table 20 and elaborated in detail hereafter.
Tree growers (farmers): In Ethiopia, the government is the owner of the land, but every individual has the
right to use the land according to the rules and regulation of the government. Tree growers in Chefasine
have the legal right to plant and sell Eucalyptus on their land. By using this land access right to use, they
plant Eucalyptus and get the selling price of their Eucalyptus tree from middlemen, pole and fuelwood
wholesalers and retailers as well as from consumers. It is the legal access to those who have land user right.
No one enforces them to sell their stand, he or she can sell his or her Eucalyptus tree to anyone at any time
and price. The interviewed tree growers indicated that the price of their Eucalyptus stand is determined by
buyers and have little space for bargaining. They noted that they are restricted to sell their Eucalyptus tree
to any potential consumer due to various reasons. These include lack of access to storage space and license
for selling of their product as well as a shortage of capital and lack of market information. It is also
challenging to manage transport, labourer and built a relationship with potential customers like constructors
and service providers. Additionally, lack of vehicles and unreliable public transportation, lack of skill and
knowledge about the market situation of Eucalyptus products makes the tree growers sell their Eucalyptus
stand in low price.
Table 20. Mechanisms of access maintenance and control in the Eucalyptus pole and fuelwood value chain.
Tree growers Eucalyptus stand access control Law based property right to plant and sell Eucalyptus
Labourers Maintenance of access to middlemen, wholesaler and retailer and consumers Working skill and experiences Working environment and time
Transporter Maintenance of access to middlemen and pole and fuelwood wholesaler and retailers Working environment working capital/resource/Car

75
Middlemen Maintenance of access to tree grower, labourer, transporter and wholesaler and retailers of pole and fuelwood Access to capital Social identity working environment Access to labourer Local knowledge and skill to deal with the farmers
Pole wholesaler and retailer
Maintenance of access to middlemen’s Trading license and permit Access to capital Credit arrangement Social identity and tie with tree growers and states officials Working environment and proximity to Chefasine
Fuelwood wholesaler and retailer
Maintenance of access to middlemen Working environment
Government Control of access to regulatory tax and maintenance of access to the middlemen’s and Tulla and Hawassa pole wholesalers and retailers and large fuelwood wholesalers and retailers Low based right to tax
Labourers: are an essential group of actors in the value chain of Eucalyptus pole and fuelwood value chain
in the study area, although Eucalyptus production is not a labour-intensive work. Labourers in the kebele
include students and low-income farmers who also have limited access to credit and capital to invest in
another investment. Also, Tulla and Hawassa town labourers are not a permanent resident in the town and
do not have access to credit and capital. It prohibited them to have a license or permission of Eucalyptus
business (marketing). Thus, they used the labour opportunities to gain access to the resource and the benefit
from production and marketing. According to Ribot and Peluso (2003), access to labour opportunity
embraces the ability to maintain access to employment with others. Due to their main skill and experiences
in harvesting, debranching and pilling, splitting, loading and unloading they are involved in the processing
of Eucalyptus pole and fuelwood products. All the labourers in the village are from the village and are
readily available at any time when the buyer needs labourer.
Middlemen: These actors have some exposure to the market and hold knowledge about the availability of
products. Social identity, social relationship, access to capital and labourers and their link to the Hawassa
pole wholesalers and retailers help them to enter the chain and maintain access from Eucalyptus. Besides,
they stated that they have a unique skill to deal and keep good social relation as well as the particular ability
for bargaining. It was observed that, to work independently, at least US $ 624 (17,000 ETB) is required as
capital to deal a truck of Eucalyptus pole.
Pole wholesalers and retailers: These actors have different means of maintenance and access from
Eucalyptus pole and fuelwood resource originated from Chefasine. They gain access through trading
permits and licenses. They also used their social relationship and ties to the tree growers, access to capital,
working environment and proximity to Chefasine to get into the Eucalyptus pole trading business and reap

76
the benefit. Tulla pole wholesalers and retailers are from the Chefasine villages now lived in the town. Most
of them have recognised by the tree growers and have access to capital and license for marketing of
Eucalyptus products. The proximity to Chefasine, social tie with the tree grower and the opportunity to
obtain license helped them to maintain access to the resource and reap the benefit. Hawassa pole
wholesalers and retailers use access to capital, social tie with government bodies and working environment
to get in the business and receive benefit. Like Tulla pole wholesalers and retailers, access to capital and
permanent residence in Hawassa helped them to have a license for Eucalyptus trading and grape benefit
from the products. Besides, the better information and know-how on Eucalyptus marketing helps them to
compete well with the newcomers and maintain their access and control over benefit from Eucalyptus pole
and fuelwood.
Transporters: Transporters used the resource like trucks to reap benefit from Eucalyptus pole and
fuelwood value chain. Most of the middlemen, pole and fuelwood wholesalers and retailers do not have
their own truck for transportation, and thus transporters control access to Eucalyptus products by
transporting. Also, they maintain access to middlemen, pole and fuelwood wholesalers and retailers as well
as to the customers. However, ttransport of Eucalyptus products is not the main job of the transporters thus,
the competition between them is minimal.
Large fuelwood wholesaler and retailer: These actors used their working environment and social tie to
the middlemen and consumers to reap benefit from Eucalyptus fuelwood value chain.
Government agency: For the marketing of Eucalyptus pole and fuelwood permission and licensing
documents are required from the government agencies. Thus, they have a legal right based to access benefit
from Eucalyptus resource through taxes and other fees. Fuelwood wholesalers and retailers paid 5 ETB (US
$ 0.18) per donkey cartload. However, they are controlled by the customs authority during market days
only. Three donkey cartloads per day were received by the large fuelwood wholesalers and retailers,
according to the survey result. It means, in a week, large fuelwood wholesalers and retailers can have 21
donkey cartloads and 90 donkey cartloads per month. Thus, it is possible to earn US $ 198 (5,396 ETB) per
year from fuelwood market. Middlemen and wholesalers and retailers of pole indicated that they are paying
US $ 1.84 to US $ 3.67 (50 ETB to 100 ETB) per truck. It means, they have contributed US $ 9 to 20 (245
to 545 ETB) per year from a hectare. Apart from the legal government official charges, unofficial charges
and fees for the maintenance of good access and linkage between the government agents and traders were
observed.

77
4.11.2 Coordination and power distribution of the value chain.
The coordination and power distribution of Eucalyptus pole and fuelwood value chain from Chefasine
kebele were assessed by using information on the price determination, control and concentration of power
as well as the ways of negotiation and exchange. As stated above (fig. 17) Eucalyptus marketing was carried
out with negotiation and bargaining. Information about the price of Eucalyptus flows from the trader to the
tree growers, while for the availability of Eucalyptus products information flows from the tree growers to
the traders. During negotiation tree growers are the first price cutters for their stand using their experience
and information from their relatives and neighboured (80%) (Table 21). It is because they did not have
enough market information about Eucalyptus marketing. The in-depth interview confirmed that from 20
tree growers only six (30%) of them have access to market information. However, this discussion and
negation, the power of bargaining are still in the hands of the buyers and they determine the final price. Tree
growers have low bargaining power (15%). Also, the lack of collaboration in and among tree growers to
market their product made them dependent on the buyer’s decision. The survey result confirms, the absences
of cooperation (horizontal coordination) (100%) for Eucalyptus production and marketing in and among
tree growers, while traders organised for getting permission and a license from the government. However,
after they have the permit, they are not more cooperated in the business. It leads the financially incapable
traders to leave the market and those with enough capital to stay in the market and grasp benefit. Moreover,
80% of the tree growers mentioned that lack of license and vending area limited them to sell the products
in the market.
Table 21. Characteristics of tree growers
Tree grower Characteristics Respondents Percentage
Market information about Eucalyptus Yes 6 30 No 14 70
From whom Friends 6 30
Direct visit from the market 4 20
Experience 10 50 The way of selling Through bargaining 100 Bargaining power Yes 3 15 No 17 85 Collaboration Yes 20 100 No 0 0
Reason not to sell to the market No License 1 5 No place 2 10 Lack of skill and knowledge 1 5 Both (no license and place) 16 80

78
4.11.3 Value chain governance
This section examines the governance type of the Eucalyptus pole and fuelwood value chains. At stated
above in the access mechanism, the middlemen and wholesalers and retailers have the privilege for access
to finance and market information through which they can easily establish a relationship with other actors
and can gain higher power by dealing with large volume of products. Gereffi (1999) made a distinction
between two types of value chains under his discussion of value chain governance. These are producer
driven and buyer-driven value chains. In the trade of Eucalyptus pole and fuelwood, both middlemen and
wholesalers and retailers are leaders. Their strategic information and financial dominancy keep them in the
leading position and control the power of bargaining. As stated in the literature review part, Gereffi et al.
(2005) described the three factors that are important to explain the types of governance of value chains.
These are the complexity of the interfirm transaction, potential of codifying transaction and the capabilities
of suppliers. These variables are measured based on the locally set indicators provided in Table 22 below.
Table 22. Variables and indicators for value chain governances
Variables Indicators
Complex of transaction The degree of task complexity and asset specificity
Potential of codifying
information
Easiness of information flow, mode of price determination, simplicity of
exchange, mode of communication
Capability of suppliers Access to Eucalyptus land, access to input resource like a seedling, capital
etc.
Source: Gereffi et al. (2005).
Complexity of transaction: Since the transactions between tree growers and traders (middlemen and pole
wholesalers and retailers) is based on the stumpage price of the woodlot, the degree of complexity of the
task for the tree grower is relatively simple. Buyers do not have a specific requirement and did not seek
more complex output and service from the tree growers. Thus, tree growers were confined to production
activities alone such as seedling production, planting, weeding and hoeing and thinning. Therefore, the
complexity of the interfirm knowledge for the value chain of Eucalyptus pole and fuelwood from Chefasine
kebele is relatively simple as compared with other products.
Potential of codifying transaction/information: Middlemen and Tulla pole wholesalers and retailers have
market information on product demand and price and thus it is relatively straightforward to them to
communicate this to tree growers. All the transactions were done by negotiation. For example, consumers
buy Eucalyptus products from wholesalers, if they do not find the type of a product they want from one
actor or they do not agree with the price they go to another actor, do all the transactions and leave. This
type of relationship was observed when consumers were buying both semi-processed poles from

79
wholesalers and retailers. Middlemen sale Eucalyptus products, for those who provide a better price. They
do all the transactions including negotiation on price and quantity. Once they agree on the price, wholesalers
buy the product and the relationship ends there. It is also the same when middlemen and wholesalers want
to buy the woodlots from the tree growers. They negotiate until they agree on the price of the woodlots.
The key informant interviews of the tree growers and traders assured that trust is lacking in between and
among tree growers and traders as well as with customers. Because, there were not any contractual
arrangements in between the value chain agents. Lack of contractual agreement indicates the low level of
coordination from the buyers in terms of product specification and price determination. The exchange
between the actors is straightforward. They specify quantity and price in cash. There is no advanced
payment due to the lack of trust in between actors. Thus, considering the above explanation, the potentiality
to codify transaction for the value chain of Eucalyptus pole and fuelwood from Chefasine kebele is high.
Capability of suppliers: The key factors determining whether a tree grower can meet the requirements of
a buyer are their access to the land and inputs such as financial capital and seedlings. Tree growers in the
study area have a land tenure right to grow Eucalyptus. They raise seedlings by their own for their planation
establishment. Eucalyptus planting is also financially cheaper to invest as compared to other crops (fig. 26).
Therefore, tree growers can grow Eucalyptus with little support in terms of inputs from the buyers. Thus,
the capability of suppliers to grower Eucalyptus and provide to buyers as stumpage is relatively high.
Table 23. Market value chain governance of Eucalyptus pole and fuelwood value chain from Chefasine
SOURCES, AUTOR ANALYSIS BASED ON GEREFFI ET AL. (2005).
Generally, transactions between tree growers and buyers are easily codified, product specifications are
relatively simple, and tree growers have the capability to grow Eucalyptus with little input from buyers.
This type of relationship between supplier and buyer indicates a low degree of explicit ties and power
asymmetry. As a result, regarding the Gereffi typology of governance, the value chain of Eucalyptus pole
and fuelwood originating from Chefasine kebele, Sidama zone, can be portrayed to be market as illustrated
in Table 23.
Transaction complexity
Potentiality of codifying transaction
Capability of
suppliers
Degree of explicit coordination and power
asymmetry
Eucalyptus poles and fuelwood middlemen and wholesalers and
retailers
Low High High Low
Market value chain

80
4.12 Options for upgrading and improving the value chain 4.12.1 Constraints and challenges of tree growers
Tree growers have faced many problems on the course of their Eucalyptus production. Land shortage was
the primary challenge (28.14%) for their Eucalyptus expansion. Almost all tree growers (96%) obtained
their land from their families. It can be noticed that no one is interested in selling or renting land for
Eucalyptus plantation. The occurrence of disease was the second mentioned constraint and challenge for
tree production (15.15%) followed by lack of market information (12.12%), road access (11.40%) and
transport (9.96%). In addition, financial problem, woodlot competition with other projects, problem of
Eucalyptus (absorption of more water and reduction of productivity of land around Eucalyptus), shortage
of seed and seedling availability, as well as difficulty of changing Eucalyptus stand to other crops were the
constraints and challenges of tree growers in the study area (fig.30).
FIGURE 30. PROBLEMS AND CHALLENGES TO TREE GROWERS FOR THE PRODUCTION OF EUCALYPTUS.
4.12.2 Constraints and challenges of traders
Traders (middlemen, wholesalers and retailers of poles and fuelwood and transporters) have faced different
problems and difficulties during their Eucalyptus business. The results from the interviewed respondents
revealed that 35% of the challenges and constraints were related to the lack of storage area, 24% to the
shortage of capital and 10% to the lack of road access. Their business was also constrained by the absences
of government support (e.g., training, providing fixed marketing places) (10%), administrative problems
such as long bureaucracy (7%) and lack of access to credit (7%). A small proportion (7%) of the
interviewers did not have constraints and challenges (fig. 31).
0.005.00
10.0015.0020.0025.0030.00
28.14
15.1512.12 11.40 9.96
6.933.90 4.33
1.88
6.20
Perc
enta
ge o
f res
pond
ents

81
FIGURE 31. PROBLEMS AND CHALLENGES OF TRADERS FOR EUCALYPTUS MARKETING.
4.12.3 Problems, challenges and constraints identified through PIP workshop at Hawassa
The result from PIP workshop discussion for problems, challenges, and constraints of tree growers and
traders (middlemen, wholesalers and retailers, transporters etc) were summarised in Figure 32. All of the
problems, challenges and constraints mentioned, were categorized into five main groups. These are: 1)
Eucalyptus production and competition with other farming 2) harvesting technology 3) transport and road
access 4) market information and 5) marketing place/area. The grouped problems and challenges were then
prioritised following participants selection and later on ranked (Table 24).
Table 24. Grouped problems and challenges ranked by the participants
No. Problems and challenges Points that participant was given Rank 1 Eucalyptus production and competitions
with other farming
2 4th
2 Harvesting technology 4 3rd
3 Transport and road access 9 1st
4 Market information 6 2nd
5 Marketing area 4 3rd
Problems related to transport and road access were ranked first, indicating the major problems and
challenges that constrain the production and marketing of Eucalyptus for tree growers and traders in the
study area. Lack of market information for the tree growers was ranked as the second problem of the actors.
Lack of harvesting technology and area for marketing Eucalyptus products was ranked the third. Lack of
harvesting technology and area for marketing were the common problem of middlemen, transporters, and
0
5
10
15
20
25
30
35
Capitalshortage
Access tocredit
Administrativeproblems
Absences ofgovernment
support
StorageFacilities
Road problem No problem
24
7 7
10
35
10
7
Perc
enta
ge d
istri
butio
n of
resp
onde
nts

82
wholesalers and retailers of Eucalyptus poles and fuelwood. The fourth ranked problem and challenges
were related to Eucalyptus production and its associated effect on other crops.
FIGURE 32. PROBLEMS AND CHALLENGES OF TREE GROWERS AND TRADERS (SOURCES: PIP 2018).
4.12.4 Option to upgrade the chain from the PIP workshop
Solutions for the identified problems and challenges for improvement of the value chain of Eucalyptus
pole and fuelwood along the chain were discussed and identified with the participants. The solution for
the identified problems and challenges were summarised in Table 25.
Tree growers
•Scarcity of land•Lack of market information on price of Eucalyptus products •Lack of support from government and any other body •Low quality production of Eucalyptus•Presence of useless land surrounding Eucalyptus planation (4 to 5 m)•Reduction of crop productivity in around Eucalyptus plantation•Problem or absence of forage under Eucalyptus plantation•Drying of land due to Eucalyptus water absorption behaviour•Discouragement of planting Eucalyptus (no motivation for Eucalyptus from government)• Information is on the negative side of Eucalyptus•Leads to segregation of land•Low quality and insufficient production of Eucalyptus•Low quality of wood products (e.g. firewood) and•Disease which cause drying of Eucalyptus leaves
Traders
•Lack of road access and transport problem•Lack of vending place •Unfair benefit distribution•Lack of long term contract•Lack of support•Lack of technical training for sawmilling (harvesters and saw millers) •Lack of technology for harvesting•Low quality of wood (e.g. price fluctuation for dry and wet fuelwood).
In between tree growers and traders
•Lack of long term contract •Unfair benefit distribution•Lack of transport and road access•Lack of trust in between tree growers and middlemen•Insufficient production of Eucalyptus products and absences of market place for marketing and selling of Eucalyptus products.

83
Table 25. Solution for the identified problems to upgrade the chain.
Suggested solutions Remark
Access to credit To tree growers and traders
From government, NGO’s etc.
Developing a standard system
for Eucalyptus products
A standard like other crops, for marketing (different products types
by using criterion for example length, diameter and quality)
Record keeping Recording day to day activities, the associated costs and revenues.
Cooperative for selling and
marketing
Organising in the group to sell Eucalyptus products, reduced
transaction cost; Tree growers
Media for information
dissemination
Information dissemination marketing and production of products
through radios, televisions, and even Facebooks (done by the
government)
A permanent marketplace for
traders and tree growers:
Organise in groups like cooperatives and ask the government for
the permanent marketplace and/or buy or rent plots of land from
individuals or municipality
Institution (regulating and
supporting) for planting and
marketing of Eucalyptus
Rules for planting and marketing (e.g. where to plant), supported by
training and provision of seedlings
Land segregation or
specialization and mass
production
Identification of areas for Eucalyptus planting with the help of
forestry expertise and specialised areas for different products (e. g
for different pole types, fuelwood, split wood etc)
Planting Eucalyptus in proper
spacing
Using recommended spacing for the intended products (for different
types of poles, fuelwood and others)
Product warehousing Constructing product warehousing for storage (traders). Helps to
avoid product deterioration and damage particularly for wholesalers
in case of less demand for products (e.g. summer season).
Training for development agents
and tree growers
Training on production, harvesting and processing of Eucalyptus
(harvesting and processing machines)
Product diversification Production of briquette and cement boards from residuals (leaves,
branches, barks, sawdust etc) to diversify products from Eucalyptus
Gravel road construction from
plantation to the main road.
Organising and asking the government for gravel road construction.
Sources: PIP workshop (2018)
84
4.12.5 The role of cooperatives in upgrading the chain
According to the International Cooperative Alliance definition, a co-operative is an autonomous association
of persons united voluntarily to meet their common economic, social, and cultural needs and aspirations
through a jointly-owned and democratically-controlled enterprise (Zeulie and Cropp 2004). In the study
area, there are no cooperative groups for Eucalyptus production or marketing as for other crops. Tree
growers were not selling their products in the towns, due to the limited market information, lack of
knowlegde, trading licenses, marketing place, shortage of capital and others.
A tree grower, Mr. Samuel Sermiso stated that “we have an association for other crops, but we do not
have for Eucalyptus. We do not have support from the government. No one trained us on how to manage
and sell our Eucalyptus stand. We do not have available credit institutions so that we are enforced to sell
our stand at the lower price when we need money. In my opinion, we would be profitable if we organised
into groups and helped each other. However, the challenge here in our village is that we do not have free
land for Eucalyptus plantation. Organising in groups for marketing will make us become performed well
in the market”. The geographic location of the village (near to Tulla and Hawassa town), the increasing
demand of Eucalyptus products, the establishment of the new Ministry of Environment, Forest and Climate
Change at Hawassa are the some of the opportunities to cooperate.
The result from the value chain governance and commercialisation margin also confirmed that tree
growers in Chefasine have relatively little power or influence on middlemen and wholesalers and retailers
that purchase their Eucalyptus products. Therefore cooperatives for marketing of their products can help
tree growers to have market power and improve their marketing share. The marketing cooperative
established would be a business organisation owned by tree growers to sell their products collectively. It
allows the tree growers to accomplish functions together that they could not achieve on their own. Joining
with other tree growers in a cooperative can give them greater power in the marketplace. Also, cooperatives
can provide tree growers more control over their products as they make their way to consumers by allowing
them to bypass the middlemen in the market channel and capture more of the returns that may otherwise go
to the others actors. Additionally, cooperatives would bring the tree growers one step closer to the final
consumer with their products, and both of them will be eventually benefited (Islam et al. 2014).
The idea was also supported from the PIP workshop carried out at Hawassa that, cooperative can help
the tree growers to benefit from their woodlot through the reduction of the cost of transactions and increase
efficiency as well as improvement of production and market information. Having market information rises
their negotiation power and which can make them equally benefit in the business. Besides, cooperative can
help tree growers to get access for market information, credit as well as training from both government and
other stakeholders to improve their position and benefit in the chain.

85
CHAPTER FIVE
5 DISCUSSION
5.1 Discussion of Methodology
This research study was focused on a case study of the value chain of Eucalyptus poles and fuelwood based
in Chefasine kebele, Hawassa Zuria District in Ethiopia. The study used both quantitative and qualitative
research methods. The focus on case study as a research method in this research was because of the concern
of the limitation of quantitative methods in providing holistic and in-depth explanations of the social and
behavioural problems. For example, on issues like actor’s coordination, linkage, mechanisms of actors and
control and maintain access from the resource, how the system of the value chain works as well as the
constraints, challenges of actors along Eucalyptus value chain. Through case study methods, the researcher
was able to go beyond the quantitative statistical results and understand the behavioural conditions through
the actor’s perspective. Majority of development studies utilise qualitative approach due to the complexity
of the issues (e.g. Ponte 2001; Abtew 2012). Abtew (2012) used a case study approach to analyse the
commodity chain of frankincense from the dry woodlands of the Nuba Mountains, South Kordofan State of
Sudan.
According to Ryan (1995), several useful questions, for example, does the sampling frame represent
the population? Would be raised concerning the process of sampling. In this study, a total of 150 active
woodlot growers were identified from Chefasine kebele. From these, 20 tree growers (30%) were used for
the collection of the primary data. Abtew et al. (2012), has used 30 interviews and triangulated to make sure
the reliability and validity of the data. The samples used in this study was representative to the kebele level,
and moreover, different data collection methods including key informant interview, market assessment,
direct observation, participatory innovative platform, and focus group discussion were applied to make sure
the validly and reliability of the collected data. The participatory innovative platform is an innovative way
of problem-solving approach and important tool for the actors to know each other, discuss openly on their
problems and solution for the problems. The opened discussion helps actors to gain a significant change on
their knowhow, improve their interconnectedness and trust.
However, the method lacks generalisation for the total region or Sidama zone. Although the study area
has been involved in Eucalyptus production, management and marketing, it was observed that Shebedino
District has much more potential for Eucalyptus plantation and marketing; this is attributed to its geographic
location; as the main road passes through this District, availability of land and attitude towards Eucalyptus
business.
Information on woodlot data of height and diameter at breast height (DBH) were taken from Thiem
(2018). In this study area, 20 Eucalyptus stands from nine boundaries, and eleven woodlots were used to
86
collect height and (DBH) measurement (Thiem 2018). For these study measurements only from the
woodlots were used to analyse the relationship between growth (volume) with age for different rotations. It
means the analysis was done solely from eight sampled Eucalyptus woodlots and which may not be
representative for the whole stand.
5.2 General discussion of results
Eucalyptus is grown by many smallholder farmers in Ethiopia mainly for the production of fuelwood,
charcoal, construction wood, poles and furniture making. According to Mekonnen et al. (2007) and
Hailemicael (2012), poles, fuelwood, branches, roots and leaves are common products of Eucalyptus. In the
study area, Chefasine kebele, Eucalyptus pole, fuelwood, splitted poles, branches including (leaves and
twigs) and seeds were the products of Eucalyptus. Poles, splitted poles and fuelwood were the current
marketable products in the study area. Marketing of branches including leaves, twigs, and seeds was not
common in Chefasine. However, in other parts of Ethiopia, for instance, in the towns of Sendafa and Sululta,
around Addis Ababa city (Chiche and Kelemu, 2010), one bundle of Eucalyptus leaves and branches with
an estimated weight of 30 kg were sold at 50 ETB (US $ 1.84). Similarly, marketing of Eucalyptus branches
for firewood and fencing was a common practice in Wogera Districts of North Ethiopia (Betelhem 2017).
Of all products, Eucalyptus poles were the main core marketable products in the study area. Some reasons
to account for this are: 1) the multiple purposes of poles or unmet demand for Eucalyptus poles owing to
the thriving construction industry both locally and regionally and 2) the majority, that is about 70% of the
woodlots sold in the area were five and fewer rotation periods, which means, are not profitable if sold as
splitted poles or fuelwood due to their smaller size. Besides, lack of substitution of Eucalyptus poles for
construction materials is the reason for the high demand of Eucalyptus poles. This finding was congruent
with the finding of Betelhem (2017) that, among the Eucalyptus products, Eucalyptus poles (Mager and
Weraj) had the highest contribution to wood supply to the market by volume from smallholder farmers in
Wogera District of Northern Ethiopia. The price given to a single pole of Eucalyptus was different in
different places, for instance, the average price recorded by Betelehem (2017) for a single pole was 2 times
(26 ETB) more than the price given in the current finding (13 ETB).
Products of Eucalyptus has been assorted in different types depending on the length, quality and
diameter of the products. Betelhem (2017) identified five types of Eucalyptus product assortments in
Wogera District, Northern Ethiopia. These included: Woraje, Mager, Kirsti, Yebet filt, and fire wood. In
this study, 10 different types of assortments were recorded (see Table 8). Almost similar assortments were
observed by Hailemicael (2012) in Sendafa town, Central Ethiopia. In the study area, poles that are straight
and has 12 to 14cm base diameter and 7 to 15m length were assorted as Teshegagari, large poles used to fix
two sides of the roof) while, poles that have 1 to 2cm base diameter and 3 to 5m length were assorted as

87
Chefeka, applied for small traditional cottage building. Smallholders have used different marketing line to
deliver their product in to the market, based on a smallholder’s access to trader and trader contact to
smallholders. Betelhem (2017) had identified seven marketing lines for Eucalyptus marketing from Wogera
District of Northern Ethiopia. Likewise, this study found seven different marketing lines for poles while
four different lines for fuelwood. Of these lines, two lines (from Chefasine to Tulla: Line 1 and from
Chefasine to Hawassa: Line 2) for pole and one line (tree growers to middlemen to large fuelwood
wholesalers and retailers to small fuelwood retailers to consumers) for fuelwood were found to be the main
marketing lines of Eucalyptus from Chefasine.
Eucalyptus business is financially profitable for all actors (Table 10 and 11). However, the benefit
distribution showed an increasing distribution from the tree growers to wholesalers and retailers (see Figure
18) except for fuelwood (see Figure 19). Studies conducted by Abtew et al. (2012) on the commodity chain
of frankincense, and Tahir et al. (2015) on marketable natural products showed an analogous situation of
upward benefit distribution as the value chain moves from producer to wholesaler and retailer. In contrary
to this, the finding of Betelhem (2017), on Eucalyptus value chain, showed the increasing share of the
benefit distribution to the producers. It might be due to the difference in value addition and processing
activities done by the producers. Tree growers in Wogera District of Northern Ethiopia, do functional
activities including land preparation, nursery seedlings production, planting, fencing, weeding, harvesting
(cutting) and post-harvest handling as well as marketing (Betelhem 2017). While, most of these functional
activities such as harvesting, post harvesting and marketing activities were not carried out by the tree
growers of Chefasine, basically due to the lack of market information, knowledge, licence for trading, and
technical support. In the case of fuelwood, the higher margin was recorded at the middlemen level due to the lower cost
of Eucalyptus from the stand. The large fuelwood wholesalers and retailers and small fuelwood retailers
reap lower margin as compared to the middlemen. For poles, the incurred expenses and value added are
almost proportionally related among the actor’s levels as indicated in Table 12 and Table 14, respectively
meaning that proportional distribution of input and output by actor’s segments. For fuelwood, the expense
and value-added had not proportionally related as the middlemen have high value-added with lower cost.
While, fuelwood wholesalers and retailers incurred a high cost but created low value (see Figure 23). The
price of Eucalyptus poles at each actor level is very high as compared to the other actor’s inputs. The product
(poles) cost accounts almost 86%, 81% and 98% for Tulla pole wholesalers and retailers, middlemen and
Hawassa pole wholesalers and retailers, respectively. For fuelwood, it accounts for 27%, 98% and 98% for
middlemen, large fuelwood wholesalers and retailers and small fuelwood retailers, respectively. The largest
proportion of the value was created by middlemen and pole wholesalers and retailers of Tulla as profit (See
and Figure 20). The percentage distributed for labourer as wage and government in form of tax and fees
accounted very small. This finding was not inline with the finding of Betelhem (2017). According to

88
Betelhem, from the total value created, 53% of the value added goes to the tree growers as profit, 12% to
the wage and 15 government in the form of tax and duties.
The annual commercialization margin, for the middlemen and Tulla and Hawassa pole and fuelwood
wholesalers and retailers were exceptionally high as they deal with a large quantity even in a short time.
However, tree growers, as opposed to traders had to wait for at least five years of rotation (average rotation
period) for the commercial utilisation of Eucalyptus and thus received lower margin. The distribution of the
commercialization margin for the value chain of Eucalyptus pole and fuelwood in Chefasine supports the
frequent claim of unfair and excessive margins captured by middlemen at local markets in developing
countries (Poudel et al. 2009; Chakma 2011; Abtew et al. 2012; Sanga 2016). However, it was contrary to
the finding of Betelhem (2017), that smallholder producers, in Wogera District of Northern Ethiopia,
received higher margin than trader from the sale of Eucalyptus products. Betelhem, further investigated, the
continuous improvement of woodlot price due to the increasing number of traders and the demand for wood
products. In the current study, only three middlemen were recorded, which might create low competition
between traders and give the privilege to have high bargaining power on the price of the Eucalyptus stand.
Moreover, this can be elucidated by the fact that tree growers perform a limited range of functions in the
value chain, only the supply of stumpage Eucalyptus, while traders held the functions (harvesting,
transporting, marketing) that significantly increased the value of the product, which was not the case for
Wogera tree growers (Betelhem 2017).
Although tree growers have captured low benefit as compared to traders, however, Eucalyptus business
is their second important livelihood option next to home-based agroforestry practice (HAF’s) (Shibire
2017). In the past years, the intention for the management of the woodlots was for household consumption
such as construction and firewood and was mainly planted in roads sides, marginal lands and farmland
boundaries. However, currently, the management intention is changed to market-oriented due to primarily
the price rise of the Eucalyptus products and extensively planted as a woodlot on poor and unproductive
areas of coffee and khat farmlands. Similarly, in many parts of Ethiopia, farmers purposely planted
Eucalyptus mainly for economic and social services on degraded and erosion-prone grounds (Mekonnen
2007; Hailemicael 2012; Zerga and Woldetsadik 2016).
According to Zerga and Woldetsadik (2016), Eucalyptus production, in Eza woreda of Guraga zone,
was the second important source of income next to enset. Similarly, a study by Asaye (2002) indicated, a
high financial return from Eucalyptus as compared to the commonly grown and planted crops of teff and
sorghum in Gonder Zuria District of north-western Amhara. Consistently, in the current finding, the income
contribution of Eucalyptus (US $ 1,489) (35%) was ranked secondly following Home-based Agroforestry
practice (HAF’s) (US $ 2,331 (56%). But, the contribution outweighs the other livelihood portfolios of kaht
(US $ 1,211), coffee (US $ 1,008), enset (US $ 55) and others, when compared separately. Moreover,
woodlots in the study area have been used for shading, fencing, making of farming equipment’s, shelter or

89
windbreak, reduce deforestation, as s form of saving, seed production as well as for bonfire (Meskel
celebration). Most of these functions were in line with the finding of Asaye 2002; Mekonnen 2007; Zerga
and Woldetsadik 2016; Gizachew 2017).
Value chain of different forest products has been constrained by various factors and limits the benefit
sharing of actors, especially the smallholders of producers. According to Abetw et al. (2012), lack of
awareness, limited financial resources and capital, and market knowledge about quality requirements for
the commercial chain of Frankincense had limited the capability of producers to add value in the form of
primary processing. Poudel et al. (2009) confirmed, the limited development of Non-Timber Forest
Products (NTFP’s) sector of Nepal due to the presence of different barriers including, inadequate knowledge
and skill in modern technology, insufficient finance and lack of sufficient information. Besides, the
economic and institutional barriers such as: transportation costs, quality standards, inadequate and
uncoordinated market information systems to wattle marketing had limited the wattle-sector development
of Njombe and Lushoto Districts of Tanzania (Sanga 2016). Similarly, the current finding confirmed, that
lack of access to market information, finance, road (from the production area to the main road), storage
space, capital, support from the government and NGO’s (e.g., technical on silviculture and financial,
through arrangements of the credit institutions) as well as lack of license and cooperation in between actors
hindered the growth of the sector of Eucalyptus production and marketing in the study area. There has also
been inadequate knowledge and skill with the tree growers and traders about modern technology (e.g.
harvesting and product development). On the other side, the technical support given for producers through
extension services, credit arrangement, training as well as provision of market information and trade license
on Eucalyptus production and marketing at Wogera District of Northern Ethiopia (Betelhem 2017), has
played a great contribution for the development of the sector through the improvement profit for both actors,
wages of laboure’s and revenue of the government.
As it was observed in Figure 30, the value chain of Eucalyptus pole and fuelwood were characterised
by market governance types. The complexity of Eucalyptus products is very low as compared to other
products, and no processing occurs at the tree growers’ level. This finding is in line with Gereffi et al. (2005)
who postulated the prediction of governance structure in value chains. Such types of value chain governance
were identified in the value chain of the teak pole from Benin and non-timber forest products value chains
in Bangladesh (Velde et al. 2006; Aoudji 2012). To market agricultural products in developing countries,
the structure of the network is often seen as a key coordination form (Hoffmann and Bernhard 2007; Aoudji
2012), however, this has not been the same for the Eucalyptus growers at Chefasine kebele. Moreover, the
support services from the government and NGO’s for the development of Eucalyptus production and
management was very little.

90
5.3 Upgrading options
Despite these limitations, several options to improve the value chain analysis of Eucalyptus products in
Chefasine Kebele exist. Here are some of the intervention options identified for the healthy growth of
Eucalyptus pole and fuelwood value chain (fig. 33). Such intervention options were developed from the in-
depth interview, key informant interview, focus group desiccation and participatory innovative platform.
A. Creation of tree growers cooperatives
In the study area tree growers did not have any form of cooperation for Eucalyptus prodcution and
marketing. The creation of tree grower cooperatives for the improvement of marketing information and
sharing is a crucial intervention area for tree growers that suffer from inadequate knowledge and
information on marketing and prices of the Eucalyptus proudtcs. These cooperatives can significantly
reduce intermediaries from network structure and also integrating tree growers horizontally to acquire the
right power (Trienekens 2011) over powerful middlemen and wholesalers and retailers, who dominate and
control the price of Eucalyptus poles and fuelwood. As suggested by Aoudji et al. (2012), adopting the
system whereby few experienced individuals, e.g., cooperatives may transport the products belonging to
several stakeholders in the market is the better option to reduce the transaction cost and improve market
information. Cooperatives can facilitate price informmation contacts with wholsailers and retailer in main
market town centers throgh the coopratives leaders. Tree cooperative enhances the value-added processing
activities such as harvesting, splitting, debranching and piling at the tree growers level, this, in turn, helps
tree growers to increase their benefit sharing from the final consumer price and to improve their livelihood
activities and enable them to retain more profits at the community level (Trienekens 2011). The idea from
the Trienekens was also supported in the case of Wogera tree growers, where they receice more profit
(Betelhem 2017) from the final consumer price and improve thier livelihood. In Wogera Distrcit of Northern
Ethiopia, different informal and formal types of cooperatives, which are working on Eucalyptus prodcution
were identified. These are, informal (Dabeyet and Mahabir/Senbete and formal (Farmers’ Development
Group and Farmers’ Cooperative) (Abebe 2017).
B. Arranging access to credit
Arranging credit access to tree growers enabled them to produce and sell their products themselves at the
right time of rotation and hence improve their income. Due to the financial survecie provided for tree
growers in Wogera District (Betelhem 2017), tree growers have developed high negotiation power and wait
until they got an affordable price for their woodlots.

91
C. Acces to extenstion service and training
The currently avilable extenstionists in the village are not forest experts and their foucs was on agricltural
aspects including: soil improvemnet and water conservation. So specific knowledge on tree planting,
spacing detremination, tree species selection, objective based planating, when and how to harvest, selection
thinning and marketing was lacking similar to the finding by Hingi (2018). in Tanzania. Thus, access to
extenstion and technical training is important to improve the performance of the woodlots interms of growth
and productivity. Training on tree planting, good access to market and roads, and provision of seedlings in
Gonder Zuria District of northwestern Amhara, motivated tree growers to plant and extend Eucalyptus
woodlots (Asaye 2002). Similarly, Betelhem (2017) reported that tree growers who had access to extension
services, training, and trade license gained higher returns. Moreover, it enables them to get a fair price for
their products during marketing time. In this option, the formation of cooperatives would play a crucial role
due to the assumption that farmer associations or cooperatives can attract support from organizations. For
example, according to Hingi (2018), in Tanzania; tree growers who have better tree planting, management
and product marketing skills were those who belonged to the tree grower associations (TGA's), and this
was attributed to the training, material and funding they received from support organisations. Here, the
newly established ministry of Environment, Forest and Climate Change has played a big role by devolving
power to the lower level, employing forestry expertise, giving training and providing improved seeds and
planting materials.
D. Facilitating road and transport access
Enabling of road and transport facilities in the study area will increase the supply of Eucalyptus products to
the market by tree growers themselves and help them to increase their yearly income. It also helps the buyers
to get easy accessibility to the area and reduce their transportation costs and increase the price of the tree
growers stand.
E. Formulation and enforcing of policies
Formulation of government polices that encorages and supports tree growers tree production and marketing
is important for the improvmnet of the value chain of Eucalyptus in the study area. Encoraging policies may
consist of, for example, providing free and improved seeds and seedlings, allwoing tax free investments,
standarsing the products, licence for the tree growers. Enforcing rules and requlation that are alaredy on the
paper are also crucial for the developmnet of the sectors. Currently, Eucalyptus is planted in areas that are
believed to be not productive for khat and coffee without following the government rules and regulations.

92
FIGURE 33. INTERVENTIONS OPTIONS FOR THE UPGRADING OF EUCALYPTUS POLE AND FUELWOOD VALUE CHAIN DEVELOPED FROM THE INTERVIEW AND PIP WORKSHOP
93
However, there is a need to recognise, that the downstream actors bear relatively higher levels of risk due
to capital investment and market fluctuation, as the tree growers are supported. For example, the income
that the tree growers grasped will increase at least with the amount equal to the processing cost of traders
(middlemen and Tulla pole wholesalers and retailers). While, the income for the middlemen and wholesalers
and retailers will be reduced, and the business for the middlemen will be at risk, as the tree growers will
take over most of the value processing activities. Thus, intervention on the downstream actors (traders) is
also required.
F. Upgrading options of traders
Access to marketing area, credit, road, and techenical traning on techenologies were some of the options
identified for the improving of the value chain of Eucalyptus at the traders level. The main problem of
middlemen and pole and fuelwood wholesalers and retailers was lack of definite storage space or marketing
area for storing and vending Eucalyptus products. They used the road sides for vending the products. In
addition, it was observed that wholesalers and retailers lack knowledge on quality control of the products.
Innovation technologies on harvesting and product development were not available. Also, credit access was
limited for them and road and transport access was lacking. Therefore, dealing with this challenge helps the
trader to improve their business. To solve the problem of marketing area, creating traders cooperatives or
union is essential. Trader cooperative helps traders to ask land from the governmnet or buying/renting land
from the munucipality or private agencies. Technical training on technologies for example, on harvesting
and product development like briquettes and cement board production as well as quality control, helps
traders to improve the value-added processing activities and add value to the product and therefore increase
their revenues. Interventions such as controlling the system (organising labourers and proper collection of
tax) bring equitable share for the labourers and the government. It, in turn, improves the value of Eucalyptus
for the development of the village as well as the nations. The intervention options empowered tree growers,
as well as traders and ensured equal benefit sharing from Eucalyptus products. Creating a common platform
for disccution such as a particicpatory innovative platform is essential to ensure the benefits access of
diffrent actors. The partcicpatory innovative platform helps actors to know each other, disscuss thier
problems and find a common solution for thier problem. In general, all the problems and challenges faced
by different actor groups cannot be addressed by a single organization, various actors: including government
(research institutions mainly, Ministry of Environment, Forest and Climate Change, credit institutions,
decision makers etc.), individual actors, NGO's and other private organizations need to have collaborated
in search of appropriate solutions and implementation.

94
CHAPTER SIX
6 CONCLUSIONS AND RECOMMENDATIONS
6.1 Conclusion
This study was carried with the main intension to analyse the value chain and identify options for Eucalyptus
pole and fuelwood originating from Chefasine kebele, Hawassa Zuria District, Southern Ethiopia. Growing
Eucalyptus is quite profitable as compared with other farming systems; hence it should be encouraged to
alleviate the wood product supply crises in the country. Woodlot management is one of the livelihood
options for many of the farmers in Chefasine kebele. Tree growers in Chefasine were started planting
Eucalyptus before 20 years. Currently, Eucalyptus has been planted for income generation, but at the same
time, it contributed a lot for the conservation of degraded land, the supply of pole for construction, firewood,
shading, saving and others.
Moreover, the income from Eucalyptus was mostly used for the payment of education fees and house
renting, to purchase household consumptions good (food, cloth, equipment) and others. Poles, fuelwood,
splitted poles, seeds, branches and twigs are products of Eucalyptus from Chefasine. Among this,
Eucalyptus poles were the most traded products (85%), sold at Tulla and Hawassa towns followed by
fuelwood (5%), sold mostly at Tulla towns. Two main lines from Chefasine to Tulla (line 1) and from
Chefasine to Hawassa (line 2) for pole and one line (Tree grower till small fuelwood retailers) for fuelwood
were identified. The value chain of Eucalyptus poles and fuelwood originated from Chefasine Kebele has
four main functions including production, processing, marketing and consuming. These segments were
undertaken in sequential order by tree growers, middlemen and Tulla pole wholesalers and retailers,
Hawassa pole wholesalers and retailers and consumers.
Eucalyptus production and marketing were financially profitable for producers, middlemen, Tulla and
Hawassa wholesalers and retailers of the pole and middlemen of fuelwood. However, the benefit
distribution was vertically skewed for poles, implied that Eucalyptus tree growers received less income in
spite of their efforts and role in the production of Eucalyptus. The share of middlemen was high in case of
fuelwood value chain as compared to the other actors. The commercialisation margin shows increasing
distribution towards the downstream actors for pole while for fuelwood, middlemen have received high
commercialisation margin (74%) than large fuelwood wholesalers and small fuelwood retailers (8% and
12%), respectively. Tree growers received a commercialisation margin of 6% from fuelwood. The annual
reaping of tree growers was considerably smaller compared to the downstream actors. Tree growers have
to wait five years, while the downstream actors deal with large quantities of Eucalyptus products in a short
period and gain a large share of benefits.

95
The value chain actors used different mechanisms to get access and control over the Eucalyptus
products and obtain benefit from the business of Eucalyptus pole and fuelwood. These mechanisms include:
access to market information, capital, finance, labour opportunities, relationship buildings, license and
vending area among others. Market government type was identified along the chain. Supporting services
for the tree growers and traders was minimal. Tree growers had received lower profit and as compared with
traders. However, it known that, under the present condition, the downstream actors have a higher level of
costs for both pole and fuelwood except the middlemen in fuelwood. Value addition as the primary
processing at the tree grower level is low due to lack of capital, lack of knowledge and market information,
license and vending area among others. Improving the processing activity at the tree growers' level would
be a high potential for increasing the benefits of the tree growers. For example, if the tree growers were
organised as cooperatives for selling and market information sharing or were able to find support like,
access to extension services, credit facilities and training for their plantation, their income would be
increased tremendously.
However, when the tree growers are supported, it is known that the downstream actors bear relatively
higher levels of risk. So that, intervention solution should be devised for the downstream actors as well to
bring equal benefit sharing from Eucalyptus business. Many such options were developed in figure 34,
which can empower both the tree growers and traders and ensured equal benefit sharing. These included
the creation of cooperation among tree growers for information sharing and marketing, easiness of access
to credit, construction of gravel roads and made transportation facilities available and formulation of
encouraging policies and enforcing rules and regulations. Besides, the creation of unions for traders for the
purchase or rent of marketing area, improving road access, facilitate credit mechanism, development of
technologies for harvesting and processing of Eucalyptus products in to, for example, briquettes, chopped
woods, etc. as well as improving tax controlling system were the suggested options for upgrading. In
general, individual actor (tree growers, traders etc.), governmental and other non-governmental agency have
to be work together to enhance the value of Eucalyptus and the livelihood of the community as well as to
improve the contribution of Eucalyptus for both regional and national development.
6.2 Recommendation
Based on the findings of this study the following are some of the recommendations suggested for the future
improvement of the value chain of Eucalyptus from Chefasine kebele.
1. The current management system of Eucalyptus in Chefasine kebele is based mostly on experience,
where main basic silvicultural systems including soil management, thinning, and spacing among others
are lacking. Well organised nursery mainly for Eucalyptus production does not exist. Tree growers
mostly used bare-rooted seedlings raised on not well-established seedbeds. Eucalyptus planation does

96
not follow appropriate planting spacing and is not objective specific. Most of the tree growers do not
know the importance of thinning and therefore the majority of them do not thin their woodlots. Soil
management (soil loosing and fertilising) is not a common practice after the first planting. However,
all these management systems are required to improve the productivity of the woodlots and ensure
sustainable wood production and supply. Thus, this research recommends that the concerning body
especially the new Ministry of Environment, Forest and Climate Change to help tree growers on these
essential silvicultural activities, by employing forest extensions in the area.
2. The current analysis on value addition and its distribution at the tree grower level showed the weak
and passive passion of tree growers as compared to other traders. Securing higher benefit and
empowerment of tree growers can increase production of the woodlot and secure continuity of the
business. Therefore, urgent actions are thought essential to empower the tree growers and secure their
livelihood as well as sustainable development of the woodlots.
3. The study also revealed weak horizontal and vertical coordination and relationship in and along the
value chain of Eucalyptus production and marketing. Thus, mechanisms to assist tree growers (the
most affected actors) to organise themselves better and to develop activities jointly (cooperatives)
focussing on marketing is essential and cooperatives should be established to improve the price
bargaining power and market information of tree growers.
4. Market information for example on price and demand for crops such as coffee, khat, maize etc. is
available and provided using television, radios, mobile SMS and other communication means,
however, this is not available for Eucalyptus production and marketing, therefore, integrating
Eucalyptus based products in the system is recommended to improve the production and marketing
information.
5. The service provision for Eucalyptus production and marketing from the government, NGO’s and
other agents is minimal. Therefore, provision of services including training on silviculture of tree
management, processing, marketing as well as technology development to the tree growers and traders,
arranging credit facilities, road and transport access etc. are essential for the development of the sector
and recommended. Such support might be provided by the government, NGO's or any private agencies
and projects like WoodCluster project.
6. Rules and regulation on production and marketing of Eucalyptus are minimal. Polices that encourage
Eucalyptus planting activities do not exist. Also, the value-added distribution to the workers and
government are almost negligible. Nevertheless, the currently available regulation is not properly
implemented. Therefore, the present study recommends the formulation of appropriate government
policies that encourage Eucalyptus planting (incentives and subsides) marketing and enforcing rules
and regulation (e.g. on Eucalyptus planting and tax collection).

97
7. Establishment of demonstration site for training or as a filed school on silvicultural practices of tree
planting as well as on marketing of the Eucalyptus products is believed to empower tree growers and
helps to fill the current gaps of skill, knowledge, and information. Thus, the establishment of a
demonstration site by the government, NGO’s and other projects like WoodCluster project are
recommended.
8. The present study does not include the other potential Eucalyptus growing and marketing areas in
Sidama zone. The study mainly examines the Eucalyptus value chain originating from Chefasine
kebele. Thus, further studies in analysing the Eucalyptus chain considering the whole zone focused on
Shebedino, Wondo Genet Woredas and other zones such as Wolaita zone is recommended to give a
clear picture of the Eucalyptus value chain in the region.
9. Eucalyptus leaf wilting disease was observed during data collection and is one of the main concern of
tree growers. Therefore, additional and integrated research is sought to identify the disease and find a
possible solution.
10. In the study area some products of Eucalyptus such as slabs and sawdust are not tradable. Thus, studies
are recommended to develop technologies and to add the values of these resources.

98
BIBLIOGRAPHY
Abebe, B. (2017) Analysis of smallholder farmers’ cooperation in Eucalyptus woodlot production: the case
of Wogera District, North Gondar zone, Ethiopia. MSc. thesis in Agricultural Economics. Collage of agriculture and rural transformationn. University of Gonder, Ethiopia. Unpublished.
Abebe, M. and Tadesse, W. (2014) Eucalyptus in Ethiopia: Risk or opportunity? Ethiopian Institutes of Agricultural Research, Addis Ababa. Pp. 65.
Abele, W. and Tewodros, T. (2017) Supply Response of Haricot Bean : The Case of Boricha District. Journal of Agriculture and Crop, 3. No. 4(4), Pp. 29-35.
Abiyu, A., Teketay, D., Gratzer, G. and Shete, M. (2015) Tree Planting by Smallholder Farmers in the Upper Catchment of Lake Tana Watershed, Northwest Ethiopia. Small-scale Forestry Vol.15: pp. 199–212.
Abtew, A., Pretzsch, J., El-Sheikh, M., and Omar, A. (2012) Commodity Chain of Frankincense from the Dry Woodlands of Nuba Mountains, South Kordofan State, Sudan’, Small-scale Forestry, 11(3), Pp. 365–388.
Alem, S., Nakhooda, M. (2017) Woody Plant Diversity and Density in Selected Eucalyptus and Other Plantation Forest Species in Ethiopia. In: Ahuja M., Jain S. (eds) Biodiversity and Conservation of Woody Plants. Sustainable Development and Biodiversity, Springer, Cham. Vol 17. Pp 291-312
Available at: https://link.springer.com/chapter/10.1007/978-3-319-66426-2. Accessed on November 02, 2017.
Amare, G. (2002) Eucalyptus farming in Ethiopia: The case of Eucalyptus woodlots in the Amhara Region. In: Natural Resources Degradation and Environmental concerns in the Amhara National Regional State, Ethiopia: Impact on Food security, proceeding, 2003, Bahar Dar, Ethiopia.
Aoudji, K., Adégbidi, A., Agbo, V., Atindogbé, G., Toyi, S., Yêvid, S., Ganglo, C. Lebailly, P (2012) Value chains: Functioning of farm-grown timber value chains. Lessons from the smallholder-produced teak (Tectona grandis L.f.) poles value chain in Southern Benin. Forest Policy and Economics. Elsevier B.V., 15, Pp. 98–107.
Asaye, A. (2002) Growth performance and economics of growing Eucalyptus Camaldulensis by smallholder farmers of Amhara Region: the case of Gondar Zuria District, North Gondar, Ethiopia. M.Sc. thesis report. Swedish University of Agricultural Sciences, Sweden.
Asmamaw, A.; Auch, E. (2016) Participative Innovation Platforms (PIP): Guideline for analysis and development of commercial forest product value chains in Sudan and Ethiopia. CHAINS Working Paper; 3rd Edition. CHAnces IN Sustainability: promoting natural resource-based product chains in East Africa (CHAINS). Technische Universität Dresden, Tharandt, Germany.
Auch, E. (2017) Lecture notes Module FOMT 1.4A. Part: NTFP and Product Chains. Version 2016/2017 – FOMT 1.4A_Scriptum+Reader_2016‐11‐01. Tharandt, Germany
Ayele, Z. (2008) Smallholder farmers’ decision making in farm tree growing in the highlands of Ethiopia. Doctoral dissertation, Oregon State University, Corvallis.
Azemeraw, T. M. and Francis, X. J., and Marion, D. (2013) Alternative Future Pathways for Household Biomass Use in Ethiopia. Discussion paper. KTH Royal Institute of Technology, Stock-holm, Sweden. Available at: www.jstor.org/stable/resrep00381. Accessed on September 20, 2017.
Bekele, M. (2011) Forest plantation and woodlots in Ethiopia. African forest forum working paper series. African forest forum. Nairobi, Kenya. 12(1): Pp.1-56.
99
Bekele, T. (2015) Integrated Utilization of Eucalyptus globulus grown on the Ethiopian Highlands and its Contribution to Rural Livelihood : A Case Study of Oromia, Amhara and Southern Nations Nationalities and People’s Regional State Ethiopia. International journal of basic and applied sciences, 4(2), Pp. 80-87.
Bekele, T., Kassa, K., Mengistu, T., Debele, M. And Melka, Y. (2013) Working with communities to address deforestation in the Wondo Genet Catchment Area, Ethiopia: Lessons learned from a participatory action research. Research Journal of Agriculture and Environmental Management, 2(12): 448-456.
Bernard, H. R. (2011) Research methods in anthropology: Quantitative and quantitative approaches. Fifth Edit. Altamira Press, Uk.
Betelhem, T. (2017). Value chain analysis of smallholder farmers’Eucalyptus woodlot products in Wogera District, North Gondar, Ethiopia. MSc. thesis in Agricultural Economics. Collage of agriculture and rural transformationn. University of Gonder, Ethiopia. Unpublished.
Bewket, W. (2005) Biofuel consumption, household level tree planting and its implications for environmental management in the North-western highlands of Ethiopia. EASSRR, Pp 21:1.
Birru, Y., Tadele, A. and Anteneh, A. (2013) Expansion of Eucalyptus Woodlots in the Fertile Soils of the Highlands of Ethiopia: Could It Be a Treat on Future Cropland Use? Journal of Agricultural Science; Vol. 5, No. 8. Pp. 60-120
Bockel, L. & Tallec, F. (2005) Commodity Chain Analysis: Constructing the Commodity Chain, Functional Analysis, and Flow Charts. Food and Agriculture Organization of the United Nations. Available at: www.fao.org/docs/up/easypol/330/value_chain_analysis_flow_charts_043en.pdf. Accessed on November 02, 2017.
Breitenbach, F. (1961) Exotic Forest Trees in Ethiopia. Addis Ababa, Ethiopia Forestry Association. Ethiopian Forestry Review, Vol. 2, Pp.19-39.
Central Statistical Authority (2007) Summary and Statistical Report of the 2007 Population and Housing Census Results. Addis Ababa, Ethiopia: CSA.
Chiche, Y. and Kelemu, K. (2010) Qualitative analysis of women’s participation in the Eucalyptus fuelwood supply chain. Proceeding held in Addis Ababa.
Creswell, J. W. (2007) Qualitative Inquiry and Research Design: Choosing Among Five Approaches, 2nd eds. Sage Publications, London, UK.
Daba, M. (2016) The Eucalyptus Dilemma. The Pursuit for Socio-economic Benefit versus Environmental Impacts of Eucalyptus in Ethiopia. Journal of Natural Sciences Research, 6(19), pp. 127–137. Available at: www.iiste.org. Accessed on September 12, 2017.
Davidson, J. (1989) The Eucalyptus dilemma: an argument for and against Eucalyptus planting in Ethiopia. The forestry research center, Addis Ababa. Seminar notes series no.1 An Amharic Reader. African Sun Publishing, Oakland.
Demamu, M. (2002) Economic analysis of E. globulus plantation in the former Dessie fuelwood project, South Wollo, Ethiopia. MSc thesis, Swedish University of Agricultural Sciences, Skinnskatteberg, Sweden.
Dereje, J. (2009) The expansion of Eucalyptus plantation by smallholder farmers and its drivers: the case of Arsi Negelle district, southern Oromia, Ethiopia. MSc thesis, Hawassa University, Wondo Genet College of Forestry and Natural Resources, Hawassa.
Dessie, G. and Erkossa, T. (2011) Eucalyptus in East Africa Socio-economic and environmental issues. Planted Forests and Trees Working Paper. Forest Management Team, Forest Management Division. FAO, Rome, (46), p. 30.

100
Drăgan, I. and Isaic-Maniu, A. (2012) Snowball Sampling Developments used in Marketing Research. International Journal of Arts and Commerce. Vol. 1. No. 6/23. Pp. 214–223.
Duguma, L, and Hager, H. (2010) Woody plants diversity and possession, and their future prospects in smallscale tree and shrub growing in agricultural landscapes in central highlands of Ethiopia. Small-Scale For 9(2):153–174
Earthscan, T. (2011) Markets and rural poverty: Upgrading in value chains. In: Jonathan M. and Christopher, C. Markets and rural poverty: Upgrading in value chains. International Development Research center. IDRC, Ottawa, Canada.
FAO. (2006) Global Planted Forests Thematic: Supplementary Desk Study on Planted Forests, by Del Lungo, A., Ball, J. and Carle J. Planted Forests and Trees Working Papers, Working Paper 35b. Forest Resources Development Service, Forest Resources Division. FAO, Rome.
FAO. (2009) Eucalyptus in East Africa: The Socio-economic and Environmental Issues. Addis Ababa Forrester, D.I., Bauhus, J., Cowie, A.L & Vanclay, J.K. (2006) Mixed-species plantations of Eucalyptus with nitrogen-fixing trees: a review. Forest Ecol. and Management, Vo.233: Pp. 211-230.
Faße, A., Grote, U. and Winter E. (2009) Value Chain Analysis Methodologies in the Context of Environment and Trade Research. Discussion Paper No. 429. Hannover. Available at: http://diskussionspapiere.wiwi.uni-hannover.de/pdf_bib/dp-429. Accessed on October 3, 2017.
Gebrekidan, A., Subramanian, A. and Nigussie, K. (2012) Yield, Contents and Chemical Composition Variations in the Essential oils of Different Eucalyptus globulus trees from Tigray, Northern Ethiopia. JPBMS, 17 (11), Pp.1-6.
Gereffi, G. (1994) The Organization of Buyer-Driven Global Commodity Chains: How U.S. Retailers Shape Overseas Production Networks. In Gereffi, G.; Korzeniewicz, M. (eds). Commodity Chains and Global Capitalism. Westport, CT: Praeger, Pp. 95–122.
Gereffi, G. (1999) International trade and industrial upgrading in the apparel commodity chain. Journal of International Economics, 48(1), Pp. 37–70.
Gereffi, G., Humphrey, J. and Sturgeon, T. (2005) The governance of global value chains. Review of International Political Economy, 12(1), Pp. 78 -104.
Gil, L., Tadesse, W., Tolosana, E., López, R. (2010) Eucalyptus species management, history, status and trends in Ethiopia. Introduction, In: Proceedings of the congress held in Addis Ababa. Ethiopian Institute of Agricultural Research EIAR, September 15th–17th, Pp 9–12.
Gizachew, K. (2017) Expansion of Eucalypt Woodlot and Its Factors in Its Factors in Cheha District, Southern Ethiopia. World Scientific News, Pp. 163–180.
Hailemicael, B. (2012) The Contribution of Eucalyptus Woodlots to the Livelihoods of Small-Scale Farmers in Tropical and Subtropical Countries with Special Reference to the Ethiopian Highlands. Department of Forest Products, SLU, Uppsala.
Hailu Z, Sieghardt M, Schume H, Ottner F, Glatzel G, Assefa B, Hailu TT (2003) Impact of Eucalyptus globulus and Eucalyptus camaldulensis small-scale plantations on chemical and physical soil properties and on soil hydrological parameter in the highland of Ethiopia a comparison with other land-use systems. Final Project-Report, p 178. Available at: Google Scholar. Accessed on November 02, 2017.
Harberger, A.C. (1971) The Social Opportunity Cost of Labor. International Labor Review. Harrington. 103: Pp. 559-580.

101
Harrison, R., Herbohn, L. and Niskanen, J. (2002) Non-industrial, smallholder, small-scale and family forestry: what's in a name? Small-scale Forest Economics. Management and Policy. Vol. 1, Pp. 1–11.
Herr, L.M. (2007) An operational guide to local value chain development. Combining Local Economic Development (LED) with Value Chain Development (VCD) to strengthen competitiveness and integration of SMEs into markets. International labour organization, Enterprise for Pro-Poor Growth (Enter-Growth). Colombo, Sri Lanka: Available at: www.ilo.org/empent/areas/value-chain-development-vcd/WCMS_101319/. Accessed on October 15, 2017.
Hingi, O. (2018) Organization of Smallholder Tree Growers, Support Organizations, Linkages and Implications for Woodlots Performance. The Case of Mufindi District, Tanzania. MS.c. thesis in Tropical Forestry and Management. Faculty of the Environmental Sciences, Department of Forest Sciences, Institute of International Forestry and Forest Products, Technische Universität Dresden, Unpublished
Hoffmann, I., Bernhard, J. (2007) Meat marketing in Burkina Faso after the devaluation of the FCFA: insights into the functioning of informal market systems. Food Policy, Vol. 32, Pp: 229–245.
Hulusjö, D. (2013) A value chain analysis for timber in four East African countries. An exploratory case study. Swedish University of Agricultural Sciences Faculty of Forest Sciences, department of forest product. Available at: http://urn.kb.se/resolve?urn=urn:nbn:se:slu:epsilon-s-2034. Accessed on October 3, 2017.
ILO. (2015) A rough guide to value chain development: a short guide for development practitioners, government and private sector initiatives. In, Nadja Nutz and Merten Sievers (eds), International Labour Office. Geneva: p. 31. Available at: www.ilo.org/wcmsp5/groups/public/---ed_emp/---emp_ent/---ifp_seed/documents/publication/wcms_366005.pdf. Accesses on December 20, 2017.
Islam, K. K. (2014) Marketing of Agroforestry Products in Bangladesh: A Value Chain Analysis. American Journal of Agriculture and Forestry.Vo. 2(4), Pp. 135.
Jagger, P. and Pender, J. (2000) The role of trees for sustainable management of less-favored lands: the case of Eucalyptus in Ethiopia. Forest Policy and Economics Volume 5, Pp. 83-95.
Jagger, P. and Pender, J. (2003) The role of trees for sustainable management of less-favored lands: The case of Eucalyptus in Ethiopia. Forest Policy and Economics, 5(1), Pp. 83–95.
Jaleta, D., Mbilinyi, B., Mahoo, H., and Lemenih, M. (2016) Eucalyptus Expansion as Relieving and Provocative Tree in Ethiopia. Journal of Agriculture and Ecology Research International, 6(3), Pp. 1–12.
Jenbere, D., Lemenih, M. and Kassa, H. (2012) Expansion of Eucalyptus Farm Forestry and Its Determinants in Arsi Negelle District, South Central Ethiopia. Small-scale Forestry, 11(3), Pp. 389–405.
Kaplinsky, R. and Morris, M. (2001) A Handbook for Value Chain Research. Institute for Development Studies: Brighton, UK.
Kebebew, Z. and Ayele, G. (2010) Profitability and Household Income Contribution of Growing Eucalyptus globulus (Labill.) to Smallholder Farmers. The Case of Central Highland of Oromia, Ethiopia. Available at: www.researchgate.net/publication/277405748. Accessed on November 20, 2017.
Kelemu K., Tadesse W. (2010) Analysis of Eucalyptus role in the livelihoods of rural households. In: Gil L, Tadesse W, Tolosana E, López, R, (eds.) Eucalyptus species management, history, status and trends in Ethiopia. Proceedings of the Congress. Ethiopian Institute for Agricultural Research, Addis Ababa. 2010; 53–61.
102
Marshall, E., Schreckenberg, K. and Newton, A.C. (eds) (2006) Commercialization of Non-timber Forest Products: Factors Influencing Success. Lessons Learned from Mexico and Bolivia and Policy Implications for Decision-makers. UNEP World Conservation Monitoring Centre, Cambridge, UK.
McCormick, D. and Schmitz, H. (2002) Manual for Value Chain Research on Homeworkers in the Garment Industry, mimeo, Institute of Development Studies, Nairobi and Sussex.
Mekonnen, Z. (2013) Productivity of Eucalyptus camaldulensis (Dehnh.) in Goro Woreda of Bale zone, Ethiopia. Research Journal of Agriculture and Environmental Management. Vol.2. pp. 252-260.
Mekonnen, Z., Kassa, H., Lemenh, M. and Campbell, B.M. (2007) The role and management of Eucalyptus in Lode Hetosa district, central Ethiopia. Forest, Trees and Livelihood, Vol. 17, Pp.309-323.
Melaku, B. (1992) Forest history of Ethiopia from early times to 1974. A thesis submitted to the fulfillment of the requirement for the Degree of Philosophise Magister in the University of Wales Bangor, Gwynedd.
Mendoza, G. (1995) A primer on marketing channels and margins. P257-275.In G.J. Scott (ends). Prices, Products, and people; Analysing Agricultural markets in Developing Countries. Lynne Rienner Publishers, Boulder, London
Mengist, K. M. (2011) Eucalyptus plantations in the highlands of Ethiopia revisited : A comparison of soil nutrient status after the first coppicing. Master Thesis - Mountain Forestry program. University of Natural Resources and Applied Life Sciences Vienna. Department of Forest‐ and Soil. Vienna, Austria.
Montello Von D.R and Sutton P.C (2006) An introduction to scientific research methods in geography. Sage Ndegwa Geoffrey M. (2010) Wood fuel Value Chains in Kenya and Rwanda; Economic analysis of the
market-oriented wood fuel sector. Publications Inc. USA. Available at: https://energypedia.info. Accessed on December 10, 2017.
Oballa, P., Chagala-Odera, E., Wamalwa, L., Oeba, V., Mutitu, E. and Mwangi, L. (2010) The performance of Eucalyptus hybrid clones and local landraces in various Agro-ecological zones in Kenya.
Oduol, J. and Nang 'ole, E. (2012) Economic and Market Assessment of Agroforestry Options in Ethiopia: A Case study of Jeldu, Diga and Fogera Districts. Technical Report. Accessed at: www.researchgate.net/publication/266089052. Accessed on August 02, 2018.
OECD (2005) Oslo manual guidelines for collecting and interpreting innovation data. Organization for Economic Co-operation and Development: Statistical Office of the European Communities, Paris.
Ostrom, E. and Schlager, E. (1996) The formation of property rights. In: Hanna S, Folke C, M�ler K-G (eds). Rights to nature: ecological, economic, cultural, and political principles of institutions for the environment. Island Press, Washington D.C., USA.
PIP (2018). Wood Cluster Participatory Innovative Platform Workshop Chefasine Kebele. In a collaboration between HU-WGCF & NR and Institute of International Forestry and Forest Product, Technische Universität Dresden, Germany. Hawassa, Ethiopia.
Pohjonen, V. and Pukkala, T. (1990) Eucalyptus globulus in Ethiopian forestry. Forest Ecology and Management 36, 19-31.
Ponte, S. (2001) The ‘Latte’ Revolution? Winners and losers in the restructuring of the global coffee marketing chain, CDR Working Paper 01.3, Centre for Development Research Copenhagen (June).
Porter, M. E. (1998) Competitive Advantage of nations. Creating and sustaining superior performance: with a new introduction. The Free Press. New York. Available at: www.hbs.edu/faculty/Pages/item.aspx? Accessed on October 05, 2017.
Raikes, P., Jensen M.F. and S. Ponte (2000) Global commodity chain analysis and the French Filiere approach: comparison and critique. Economy and Society, Vol. 29, Issue 3, Pp. 390–417.

103
Rametsteiner, E., Weiss, G. and Kubeczko, K. (2005) Innovation and Entrepreneurship in Forestry in Central Europe (Research report). Joensuu: European Forest Institute. Available at: www.hbs.edu/faculty/Pages/item.aspx?num=193. Accessed on November 02, 2017.
Rassaeifar, M., Hosseini, N., Haji Hasani Asl, N., Zandi, P., Moradi Aghdam, A. Rassaeifar, M., Hosseini, N., Hasani, N., Zandi, P. and Aghdam, A. (2013) Allelopathic Effect of Eucalyptus Globulus’ Essential Oil on Seed Germination and Seedling Establishment of Amaranthus Blitoides And Cyndon Dactylon. Trakia Journal of Sciences, Vol.1: Pp.73-81.
Ribot, J. C. (1998) Theorizing Access: Forest Profits along Senegal’s Charcoal Commodity Chain. Development and Change, 29(2), Pp. 307–341.
Ribot, J. C. and Peluso, N. L. (2003) A Theory of Access. Rural Sociology, 68(2), Pp. 153–181. Ryan, C. (1995) Researching tourist satisfaction: Issues, concepts, problems. Routledge, London. Sanga, D. A. (2016) Value chain and rural livelihoods. Analysis of Acacia mearnsii (Black wattle) activities
in njombe and lushoto districts. Master of Science in Environmental and Natural Resource Economics. The Sokoine University of Agriculture. Available at: www.suaire.suanet.ac.tz:8080/xmlui/handle/123456789/1479. Accessed on October 05, 2017.
Schure, J., Dkamela, P., Goes, A. and McNally, R. (2014) An Approach to Promote REDD + Compatible Wood-fuel Value Chains. REDD + Energy and Agriculture Programme (REAP), SNV Netherlands Development Organization (SNV), Netherlands.
Selamyihun, K. (2004) Using Eucalyptus for soil and water conservation on the highland Vertisols of Ethiopia. Tropical Resource Management Papers. Ph.D. dissertation, Wageningen University and Research Center, Department of Environmental Science and Water Conservation Group, the Netherlands.
Selamyihun, K., Mamo, T. and Stroosnijder, L. (2005) Biomass production of Eucalyptus boundary plantations and their effect on crop productivity on Ethiopian highland vertisols. Agroforestry Systems. 63(3), pp. 281–290.
Shi, Z., Xu, D., Yang, X., Jia, Z., Guo, H and, Zhang, N. (2012) Ecohydrological impacts of Eucalyptus plantations: A review. Journal of Food, Agriculture and Environment; Vol. 10: Pp:1419-1426.
Shibire, B. (2017) Financial analysis of smallholder farmers’ woodlot and homestead agroforestry systems and its implications for household income improvement; the case of Hawassa Zuria District, Southern Ethiopia. MS.c. thesis in Tropical Forestry and management. Faculty of the Environmental Sciences, Department of Forest Sciences, Institute of International Forestry and Forest Products, Technische Universität Dresden, Unpublished.
Springer-Heinze, A. (2017) ValueLinks. Value Chain Analysis, Strategy and Implementation. Manual on Sustainable Value Chain Development. ValueLinks 2.0 Manual, GTZ, Eschborn. Available at: http://valuelinks.org/wp-content/uploads/2015/09/ValueLinks. Accessed on November 02, 2017.
Tadele, D., Assefa, A. and Teketay, D. (2014) Effect of Eucalyptus camaldulensis stands Conversion into Crop Production on Growth and Yield of Maize. The case of Koga Watershed Areas in north-western Ethiopia. Momona Ethiopian Journal of Science (MEJS), V6 (1): Pp.58-69.
Tahir, EL. and Vishwanath, A. (2015) Market and Value Chain Analyses of Marketable Natural Products from Agroforestry Systems in Eastern Sudan. Journal of Geoscience and Environment Protection, Vol. 3, Pp. 57-73.
Teketay, D. (2000) Facts and Experiences on Eucalyptus in Ethiopia and Elsewhere: Ground for Making Wise and Informed Decision’, Walia, 2000(21), pp. 25–46.

104
Thiem, F. (2018) Assessment of growth of Eucalyptus woodlots in Ethiopia. Bachelor of Science für das Fachgebiet Forstwissenschaften. Wurde der Fakultät Umweltwissenschaften der Technischen Universität Dresden, unpublished.
Trienekens, J. H. (2011) Agricultural Value Chains in Developing Countries. International Food and Agribusiness Management Review, 14(2), Pp. 51–82.
Tuckett, A. (2004) Qualitative research sampling: the very real complexities. Nurse Researcher Vo. 12: Pp. 47–61.
Velde, D. W.; Rushton, J.; Schreckenberg, K.; Marshall, E.; Edouard, F.; Newton, A. and Arancibia, E. (2006) Entrepreneurship in Value Chains of Non-timber Forest Products. Forest Policy and Economics 8 (7): Pp: 725-41.
Velde, D.W., Rushton, J., Schreckenberg, K., Marshall, E., Edouard, F., Newton, A. and Arancibia, E. (2006) Entrepreneurship in value chains of non-timber forest products. Forest Policy and Economics, Vol. 8 (7), Pp: 725–741.
Wallerstein, I. (1976) The Modern World-System. European World-Economy in the Sixteenth Century, Pp. 229–233.
Weiss, G. (2011) Theoretical Approaches for the Analysis of Innovation Processes and Policies in the Forest Sector. In: Weiss, G., Pettenella, D., Ollonqvist, P. and Slee, B. (eds.), Innovation in Forestry: Territorial and Value Chain Relationships, CAB International, Oxfordshire; Pp.10-34
World Bank (2017) Harnessing the Potential of Productive Forests and Timber Supply Chains for Climate Change Mitigation and Green Growth-Opportunities for the private sector. Available at: https://climateinvestmentfunds.org/. Accessed on November 03, 2017.
Yin, R. K. (2003) Case study research: design and methods, Applied social research methods series. Thousand Oaks, CA: Sage Publications, Inc. Afacan, Y. and Erbug, C. (2009) (eds). An interdisciplinary heuristic evaluation method for universal building design. Journal of Applied Ergonomics, Vol.40, Pp: 731-744.
Zainal, Z. (2007) Case study as a research method. Jurnal Kemanusiaan, Vol. Pp. 1-6. Zerfu, H. (2002) Ecological impact evaluation of Eucalyptus plantations in comparison with agricultural
and grazing land-use types in the highlands of Ethiopia. Doctoral thesis. Institute of Forest Ecology, University of Natural Resources and Life Sciences, Vienna.
Zerga, B. and Woldetsadik, M. (2016) Contribution of Eucalyptus Tree Farming for Rural Livelihood in Eza Wereda, Ethiopia. Pj Palgo Journal of Agriculture. Vol.3. Pp 111 - 117 Available at: www.palgojournals.org/PJA/Index.htm. Accessed on June 03, 2018.
Zerga, B. and Woldetsadik, M. (2016) Contribution of Eucalyptus Tree Farming for Rural Livelihood: In Eza Wereda, Ethiopia. PJ Palgo Journal of Agriculture. Vol. 3, Pp. 111 – 117.
Zerihun, K. (2010) Eucalyptus in Rural Livelihood Safety Net Strategy in Coffee Growing Area: Case Study Around Jimma, Southwestern Ethiopia. Research Journal of Forestry 4(4): Pp.202-207.
Zeulie, K. A., and Cropp, R. (2004) Cooperatives: Principles and practices in the 21st century. Madison: University of Wisconsin.
Zewdie, M. Olsson, M. and Verwijst, T. (2009) Above-ground biomass production and allometric relations of Eucalyptus globulus Labill. coppice plantations along a chronosequence in the central highlands of Ethiopia. Biomass Bioenergy, Vol. 33. Pp. 421-428.
Zhang, C. & Fu, S. (2009) Allelopathic effects of Eucalyptus and the establishment of mixed stands of Eucalyptus and native species. Forest Ecology and Management, Vol. 258: Pp.1391–1396.

105
Web Accessed sources
CurrencyStats247 (Undated) Available at: https://www.currencystats247.com/currencies/etb-usd/2018. on May 24, 2018.
Investopedia (Undated) Available at: https://www.investopedia.com/terms/g/gross_profit_margin.asp#axzz1ukMcMM9q. Accessed on June 30, 2018.

106
APPENDICES Appendix I: Questionnaires for the in-depth interview, key informant and focus group discussion
Introductory note: The main objective of this questionnaire is to study the value chain and upgrading
options of Eucalyptus pole and fuelwood in Sidama zone, Hawassa Zuria District, Hawassa. The study is
being conducted as part of the MSc. thesis in Tropical Forestry. I am grateful to thank you for your
willingness, respect and taking the time to fill this questionnaire’. Information given by you will strictly be
kept confidential during the course of the study and beyond.
Name of interviewer………………………………Date of interview ……………………………………. Kebele (Village)……………………………………. Sub village……………………No.………………….
1. Personal information of the respondent A. Name of the respondent……………………………………………………… B. Sex of respondent: 1. Male 2. Female C. Age of the respondent………………...years D. Formal educational level of the respondent: 1. Formal education 2. Primary education 3.
Secondary education 4. More that secondary education E. Marital status: 1. Single 2. Married 3. Widow 4. Divorced F. Number of people in the household……………….
2. How many plots of land do you have at present in total? ………………………. 3. What types of land use do you have on your land?
A. Farmland………. (ha) B. Homestead ……. (ha) C. Grazing land…………. (ha) D. Plantation with Eucalyptus…………(ha) D. Marginal land………. (ha) E. Others……………………
4. What are the sources of your land? A. Rent…………. (ha) B Own…………...(ha) C. Family …………. (ha)
5. If your land is from rent, how much is the rent?..............(ETB/month/year) and which payment are you used for land rent? A. Share B. Cash C. Other:
6. What are your livelihood activities? Please Rank your livelihood activities according to its contribution to your household needs.
7. Do you think Eucalyptus pole and fuelwood contribute to your livelihood? 1. Yes 2 = No If yes in what way, it supports you? ………………………………………………………………...
8. Inputs used and their associated cost for Eucalyptus, HAF’s and Agriculture?
No. Livelihood activity Income (ETB) per year or per season
How long have you been involved in this livelihood activity?
1 2 3 4 5

107
Inputs/per season/unit area/hectare
Livelihood activity
Woodlot Coffee Khat Enset Vegetable Others Maize Haricot bean Others Cordia Banana,
avocado, gesho Others
Fertilizer Kg
Cost
Pesticide Liter
Cost
Seedling No.
Cost
Seed Kg
Cost
Oxen No.
Cost
Hired labor
Mad day cost
Family labor
Mad day cost
others Unit
Cost

108
9. What are your assets?
10. Which family members are engaged in farming mostly.
A. Bellow 12 years B. 12-18 years C. Above 18 years 11. How long does the family spend working on the farm per day? excluding church and other social
activity days……………… and how is the household labour distributed for each land use type? Months Required labor hour/day (HAF’s) Farming Eucalyptus
production Remark
Khat Coffee Enset September October November December January February March April May June July August
12. For which activity do you hire labour? A. Farming B. Homestead C. Eucalyptus planation D. Others
13. How many labourer per production season do you hire for each land use type? What is the labour cost per day or per production year? Is the labour cost differing? Which land use activity is more labour intensive?
Land use type No. of labour Labour cost Inessive labour Remark Farming crops
Homestead Eucalypts Others
Rank 1. More intensive 2. Intensive 3. Less intensive 4. Not intensive 14. Why are you interested in Eucalyptus plantation?
Functions Remark (Rank) based on importance
Assets Number Price (on average)
Input cost Labour grass Medicine others
Livestock
Oxen Cow Heifer Others
Goat Sheep Poultry Donkey Horse Others

109
Rank 1 very important 2. Important 3. Less important 4. Not important. 15. How long have you been planting Eucalyptus?
A. Less than 5 years B 5-10 years C. 10-15 years D. 15-20 years E More than 20 years 16. What is the trend of Eucalyptus woodlot plantation?
A. When you start planting……………(size) ha B. Currently…………………ha C. Future expectation after 5 years ……………ha
17. What are the most important products from Eucalyptus that you have grown?
Rank 1. mostly preferred 2. Preferred. 3. Less preferred 4. Not preferred
18. What types of seedlings are used for your Eucalyptus woodlot? Which species? A. Bare rooted B. Containerised C. Others specify …………………………...
19. Which are the most preferred types of a seedling from and why?
A. Bare rooted B. Containerised C. Others specify………………………………………………….
20. Where do you get seedling? 1. In the market 2. Own production 3. Others please specify…. 21. If from the market how much is the price per seedling?.......................ETB 22. Where do you plant Eucalyptus? And which one is the most preferer and why?
A. Farmland and homestead B. Grazing land C. Marginal land D. Others specify……. 23. What is the management during the rotation?
Silvicultural management
Working hours
No. of days
No. of worker
Family labour
Hired labour
Cost per day
Cost per hectare per year/season
Site Clearing
Plowing
Pit preparation
Planting
Fencing
Watering
Replanting
Weeding
Intermediate cutting
Thinning
Product type Proportion Preferences Pole for fencing and construction Fuelwood Charcoal Others
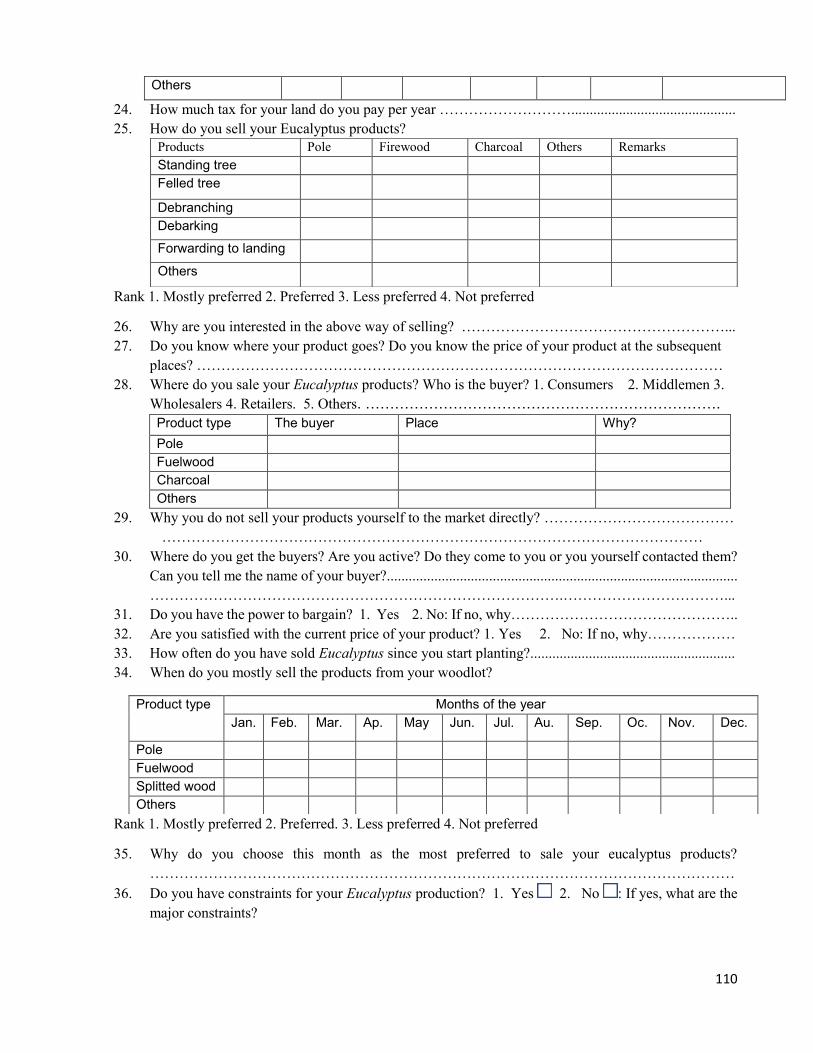
110
Others
24. How much tax for your land do you pay per year ………………………............................................. 25. How do you sell your Eucalyptus products?
Rank 1. Mostly preferred 2. Preferred 3. Less preferred 4. Not preferred
26. Why are you interested in the above way of selling? ………………………………………………... 27. Do you know where your product goes? Do you know the price of your product at the subsequent
places? ……………………………………………………………………………………………… 28. Where do you sale your Eucalyptus products? Who is the buyer? 1. Consumers 2. Middlemen 3.
Wholesalers 4. Retailers. 5. Others. ………………………………………………………………. Product type The buyer Place Why? Pole Fuelwood Charcoal Others
29. Why you do not sell your products yourself to the market directly? ………………………………… …………………………………………………………………………………………………
30. Where do you get the buyers? Are you active? Do they come to you or you yourself contacted them? Can you tell me the name of your buyer?................................................................................................ ………………………………………………………………………….……………………………...
31. Do you have the power to bargain? 1. Yes 2. No: If no, why……………………………………….. 32. Are you satisfied with the current price of your product? 1. Yes 2. No: If no, why……………… 33. How often do you have sold Eucalyptus since you start planting?........................................................ 34. When do you mostly sell the products from your woodlot?
Rank 1. Mostly preferred 2. Preferred. 3. Less preferred 4. Not preferred
35. Why do you choose this month as the most preferred to sale your eucalyptus products? …………………………………………………………………………………………………………
36. Do you have constraints for your Eucalyptus production? 1. Yes 2. No : If yes, what are the major constraints?
Products Pole Firewood Charcoal Others Remarks Standing tree Felled tree
Debranching Debarking
Forwarding to landing
Others
Product type Months of the year Jan. Feb. Mar. Ap. May Jun. Jul. Au. Sep. Oc. Nov. Dec.
Pole Fuelwood Splitted wood Others

111
Production constraint Severity (1.2.3.4) How are you overcome them?
Category 1. Most sever 2. Severs 3. Less sever 4. Not sever.
37. How is the payment mechanism arranged for your products? 1. In Cash 2. In-kind 3. Delayed payment 4. Bank transfer 5. Credit 6. others
explain………………………………………………………………………………...................... 38. Do you have a collaboration with other actors?
1. Producers 2 Traders 3. Government forestry departments 4. NGO’s 5. Others 39. What kind of assistance or service or support do you get to from the government and other institutions
during the process of growing and selling your plantations?.................................................................. …………………………………………………………………………………………………………
40. You exploit, or others exploit you? …………………………………………………………………...
41. Have you had any disputes with other actors during the course of harvesting and selling? 1. Yes 2. No: If yes, please indicate ……………………………………………………………...
42. What are your suggestions to improve your income and sustain the production of Eucalyptus woodlot?...................................................................................................................................................
43. What do you think about cooperative? Is it will be a solution to your problem and improve your Eucalyptus production?...........................................................................................................................
……………………………………………………………………………………………………… 44. Any suggestion or comments you want to give?
………………………………………………………………………………………………………
Thank you for your cooperation.
II: Questioners for the Traders
I am grateful to thank you for your willingness, respect and taking the time to fill this questionnaire’. This questionnaire is used for collecting information on the value chain of Eucalyptus pole and fuelwood and the and will be treated as confidential.
Name of Interviewer……………………………………. Date of interview ……………………………… District………………………………………. Kebele (Village)……………………No.………………….
1. General information A. Name of the respondent………………………………………………………………………….. B. Sex of respondent: 1. Male 2. Female C. Age of the respondent………………...years D. Formal educational level of the respondent: 1. Formal education 2. Primary education 3.
Secondary education 4. More that secondary education E. Marital status: 1. Single 2. Married 3. Widow 4. Divorced F. Number of people in the household…………………………………..
2. Are you a permanent resident in the area?.......................................................................................... 3. What is your main source of livelihood/occupation?..........................................................................

112
4. Do you have other livelihood activities? 1. Yes 2. No; If yes question no. 5
5. Rank your livelihood activities according to its contribution to your household needs?
6. Do you think Eucalyptus pole and fuelwood contribute to your livelihood? 1. Yes 2. No
If yes in what way, it supports you?.................................................................................................
7. Which category of trader/ commercial operator are you? 1. Village merchant 2. City merchant 3. Company 4. Middlemen/broker 5. Agent for company 6. Others ……..
8. What is your Eucalyptus business? 1. Pole 2. Fuelwood 3. Splitted wood 4. Others specify……………………………………………………………………………………………..
9. How long have you been engaged in this business?......................................years 10. How did you get in this business? What Motivates you?.....................................................................
………………………………………………………………………………………………………… 11. Have you got market information? 1. Yes , 2. No if yes from whom? Friends 2. From
media 3. A direct visit to the markets 4. Others specify…... 12. From where do you purchase Eucalyptus products? 1. At the production site 2. At local market
3. Landing area 4. Others specify……………………………………………………..... 13. What are your preferences for the above question? 1. Most preferred 2. Preferred 3. Less
preferred 4. Not preferred 14. From whom do you purchase your products?
Suppliers Products Preferences Pole Fuelwood Splitted wood
Producer Middlemen Agents Others
Rank 1. Mostly preferred 2. Preferred 3. Less preferred 4. Not preferred
15. Why do you choose to buy Eucalyptus products from them? ……………………………………….. 16. To whom did you sell your products? Do they come to you or you yourself contacted them?.............
………………………………………………………………………………………………………… 17. What is your mode of contact with your customers?............................................................................. 18. Did you have any collaboration with others traders/your suppliers/buyers?
Collaborative with Types of collaboration Comments Producers Other traders Government finance department NGO’s Others
No. Livelihood activity Income (ETB)/year/ha
How long have you been involved in this livelihood activity
1 2 3 4

113
19. How do you purchase Eucalyptus base products? 1. Standing tree 2. Felled/processed/ 3. Fuelwood 4. Charcoal 5. Others specify………………………………………………
20. What is the current purchasing price per kada/hectare at your ranking preferred location of purchase………………………………………………………………………………………………………………………………………………………………………………………………………
21. Who determines the price? 1. Seller 2. Purchaser 3. Market 4. Others please specify…………………………………………………………………………………………………
22. What factors are considered in setting up the price of Eucalyptus pole and fuelwood? (Please rank) 1. production costs 2. Transportation costs 4. Quality 5. Seasonality 7. others (specify)……………………………………………………………………………………………...
23. Do you store the products before selling? 1. Yes 2. No , If yes: question 24, 24. Where are you storing the products? 1. Own store 2. Rent 3. Communal land 4. Others
please specify…………………………………and how long…………………………days/months 25. What is the storage cost per month? 1. Tax…….. 2. Charge………. 3. Others specify ……………… 26. Where do you sell your Eucalyptus products? Please specify the name of the places.
Site Distance from the landing Products Poles Fuelwood Splitted wood
On-site Local market Sale to the regional market Sale to the export market Others
27. Where do you get the information for a price about Eucalyptus pole and fuelwood trade? ……………...………………………………………………………………………………………
28. What transportation means are you used?
Means of transportation Products Distance to the market and cost payed Pole Fuelwood
Manpower Donkey cartload Vehicle Others
29. What is your selling price in the last 5 years per tree/kada/hectare?
Selling price per unit of products
Years Future expectation 2014 2015 2016 2017 2018
Pole Fuelwood Splitted wood Others
30. Are you satisfied with the current price of your products? 1. Yes 2. No, If No, why?........................... 31. What factors influence the price? And how the price of the product changes?
Ranking Products Remarks Pole Fuelwood Splitted wood
High demand Low demand High supply

114
Low quality Others
Rank 1. Best driving factor 2. Good rank 3. Moderate 4. Bad
32. What might be the option to get a better price from your product?.......................................................... …………………………………………………………………………………………………………
33. What are the activities/ values you add to increase your selling price or volume?
Activities Price per unit Reasons for that
34. Are there any difficulties in selling your products?................................................................................. 35. List daily/monthly/ yearly expense related to your business activities, including your duties and fees.
Kind of cost Amount per day/month/year Tax and duties Rent Labour Transportation Security Tools used Others
36. What is your primary source of finance for your business? Financing mechanism Amount per year Ranking by preferences Self-financing Credit from bank Credit from a local organization Mutual help Others
Rank 1. Most preferred 2. Preferred 3. Less preferred 4. Not preferred
37. What skills are necessary to do the business?........................................................................................ ……………………………………………………………………………………………………….
38. Do you think you exploited others or are exploited by any actors?.......................................................... 39. What types of right do you have over the trade of Eucalyptus pole and fuelwood?................................
………………………………………………………………………………………………………… 40. What do you think the main sources of getting access to the trade of Eucalyptus pole and fuelwood,
excluding legal or property right?........................................................................................................ 41. What are the requirements to get the official permit to run your business?............................................
……………………………………………………………………………………………………… 42. What is the main important attribute that your buyer expects from you? E.g. time, quality, place,
labour, storage places etc…………………………………………………………………………. 43. Have paid payments unofficially to the product? Can this control? Whose responsibility is that?
………………………………………………………………………………………………………… 44. What are the main problems you face in the course of your business activities?
……………………………………………………………………………………………………… 45. Do you get any support or services from any organization or government department? 1. YES
2. NO: If your answer is yes, what type of support? And from Whom?

115
................................................................................................................................................................ 46. Have you ever received training on how to improve Eucalypts pole and fuelwood business? 1. Yes
2. No: If yes please explain?................................................................................................................... 47. Any suggestion or comments you want to give?
……………………………………………………………………………………………………… Thank you for your cooperation
III. Questioners for the Key informant interview
1. What are the products of Eucalyptus in the village? Products Remark Pole Fuelwood Charcoal leaves others
2. How are the products line from producer to consumer?........................................................................... .............................................................................................................................................................
3. What are the main activities carried out in the production of Eucalyptus products? No. Nod Activities Inputs 1 2 3
4. Who are the key actors along the Eucalyptus pole and fuelwood value chain?........................................... …………………………………………………………………………………………………………...
5. What are the value-added activities performed in the Eucalyptus pole and fuelwood value chain? ………………………………………………………………………………………………………….. 6. How many Eucalyptus pole and fuelwood value dealers have been registered in your district in year
2017/2018?................................................................................................................................................. 6.1. How much is the charge as a tax for Eucalyptus pole and fuelwood business? A. Growers ………………………………….. B. Traders……………………………………………
7. What other charges do you absorb from Eucalyptus pole and fuelwood dealers/traders, Apart from formal tax?.................................................................................................................................................
7.1. What is the regulation in the chain?.................................................................................................... ………………………………………………………………………………………………………...
8. Factors which if there are absent, the chain is significantly modified?..................................................... ……………………………………………………………………………………………………...
9. What are the supporting environments or supporting bodies in the value chain? No. Actor
(Producer, trader, retailer)
What type of supplies and services
Who is the provider (Official, guy NGO others)
How they are interacting? Who is approaching whom?
1 2
10. How the actors are organized (coordinated)?
10.1. Who determines the price of the products? 1. Seller 2. Buyer 3. Other actors

116
Explain (Who is approaching whom for cutting, harvesting etc) ……………………………………………. ……………………………………………………………………………………………………………….. 11. Do actors have the power to bargain the price? 1. Yes 2. No: If no why………………………………... 12. Where are the marketplaces? …………………………………………………………………………… 13. How the negotiation and exchange take place? How actor groups are contacted?......................................
…………………………………………………………………………………………………………...
14. What types of right do you think actors have on Eucalypts pole and fuelwood?......................................... …………………………………………………………………………………………………………...
15. What strategies/programs/policies/incentives by government or development partners if put in place would enable growth in the Eucalyptus pole and fuelwood business and improve chain value addition? …………………………………………………………………………………………………………..
16. Is there any social organization for eucalyptus pole and fuelwood? 1. Yes 2. No, if yes no. 17 17. What are they……………………………………………………………………………………………. 18. Do you have any information about cooperatives? 1. Yes 2. No: If yes please describe? ………………
…………………………………………………………………………………………………………... 19. Do farmers work together? Is it attractive to put together two or three woodlots together?
…………………………………………………………………………………………………………... 20. What are the gaps, problems and ideas to overcome the problems?............................................................
…………………………………………………………………………………………………………... 21. Do you think cooperatives will be the solution to improve the chain.?....................................................... 22. What other solutions do you think help to improve the value chain of Eucalyptus pole and fuelwood?
…………………………………………………………………………………………………………... 23. Do you have any other suggestions or comments?.....................................................................................
………………………………………………………………………………………………………...
Thank you for your cooperation
IV. Focus Group Discussion at eucalyptus grower level
1. Introduction of members, both research team and focus group participants and purpose of gathering 2. Who are the main key actors involved in the chain? 3. Could you explain the history of Eucalyptus planting in the Chefasine? 4. What are the contributions and roles of Eucalyptus pole and fuelwood in Chefasine? 5. What are the value-added activities performed in the chain at tree growers and trader level? 6. According to the key informant and in-depth interview, we cannot find any service that feeds into the
system from NGO’s and government, what is your idea or opinion for this? 7. We found that tree growers do not have any information about marketing and production and is received
a lower share from the final price, would you agree on this? 8. What regulations are there in their Eucalyptus production and marketing? 9. What are the challenges and important factors affecting Eucalyptus production and marketing? 10. The result shows shallow or absence of interaction in between and among the actor’s groups, what is
your idea and how it will be solved? 11. What solutions could you suggest improving the chain generally? 12. Is cooperative will be the solution for the improvement of Eucalyptus pole and fuelwood business of
actors? Thank you for your cooperation

117
Appendix II: Benefit, cost and margin of Eucalyptus pole and fuelwood at each actor level per hectare per year.
1) The benefit, cost and margin of Eucalyptus pole and fuelwood at tree growers level per hectare per year.
An average number of trees produced by tree grower per year per hectare 16,129. Quantity sold as pole per five years of rotation: 85% of the total pole =13,710, Quantity sold per year, 2742 trees/hectare. Spacing of 0.55 * 0.69
Unit Quantity Unit price (ETB)
Total value (ETB)
Total value per hectare
Amortized value (ETB)/ha
Value (US $)
Total revenue (Average production *Average price)
Number of trees
2,742 13 35,646 35,646 - 1,308
Costs of producing 2,720 trees per hectare Seedling Number of
seedlings 536.63 2 1,073.26 3,462.13 844.33 30.98
Management cost
Land preparation including nursery
Man days 5 66 330 1,064.52 259.63 9.53
Transportation (seedling)
Man days 2 66 132 425.81 103.85 3.81
Planting Man days 5 66 330 1,064.52 259.63 9.53 Weeding and Hoeing (1st & 2nd year)
Man days 12 66 792 2,554.84 623.10 22.86
Thinning Man days 2 66 132 425.81 103.85 3.81 Fencing Man days 2 66 132 425.81 103.85 3.81
Sub total cost 2,298.29 84.34 Land rent
Hectare 1 65 65 65 65 2.39
Total cost Sum of all expense 2,948 4,562 2,364 86.75 Margin
32,698
33,282 1,221
Gross Profit Margin
Revenue less Total cost/Revenue *100
93%

118
Note: All the harvesting, stacking, loading and unloading activities are done by hired labourers.
4 For transporting a truck of Eucalyptus poles from Chefasine to Hawassa town, 800 to 1,200 ETB (1,100 ETB on average) including the cost of the driver was needed, 5 Harvesting, debranching, staking, loading and unloading activities are done by hired labourers as a contract work. To harvest and debranch a Kada (7 trucks) of Eucalyptus, 800 to 1,300 ETB (on average 1,050 ETB) was required. That means, the middlemen incur a cost of 150 ETB to harvest and debranch a truck of Eucalyptus poles. 6 On average, 1,050 ETB for a Kada of Eucalyptus was required to stack the harvested poles on one place and load it on the truck. Which means, for a truck 150 ETB was paid by the middlemen. 7 80 to 120 ETB (100 ETB, on average) was required to unload a truck of poles at Hawassa. 8 Brokers received 100 to 300 ETB, on average 250 ETB, from a hectare or a Kada of Eucalyptus.
2) Benefit and cost analysis for 2,742 Eucalyptus pole value chain from Chefasine to Hawassa at middlemen level.
Middlemen: A truck loads, 500 to 600 poles (on average 550 poles) and sold at a price of US $ 514 (14,000 ETB) to US $ 734 (20,000 ETB), on average USD $ 624 (17,000 ETB), which means US $ 1.12 (31 ETB) per pole.
Unit Quantity Unit price
(ETB) Total value (ETB)
Value (US $)
Costs for 2,742 trees/ hectare Product cost Number of trees 2,742 13 35,646 1,308 Transportation cost including driver
Truck 5 1,1004 5,500 202
Harvesting and debranching
Truck 5 1505 750 27.53
Stacking and loading
Truck 5 1506 750 27.53 Unloading Truck 5 1007 500 18.35 Tax
Pcs 1 250 250 9.17
Commission fee
Pcs 1 100 100 3.67 For broker
Pcs 1 2508 250 9.17
Mobile card for communication Mobile card 5 50 250 9.17 Total Cost Sum of all costs
43,996 1,615
Revenue Quantity * Unit price 2,742 31 85,002 3,120 Margin Revenue less Total cost
41,006 1,505
Gross Profit Margin Revenue less Total cost/Revenue * 100
48%

119
4) Benefit and cost analysis of Eucalyptus pole value chain from Chefasine at Hawassa pole wholesaler and retailer level. Unit Quantity Unit price (ETB) Total value (ETB) Value (US $)
Costs for 2,720 trees per hectare Product cost Number of trees 2,742 31 85,002 3119 Pole arrangement Truck 5 120 600 22.02 Tax Pcs 1 125 125 4.59
9 On average 600 ETB (500 to 700 ETB) is required for the transportation of a truck of Eucalyptus poles from Chefasine to Tulla, including the cost of the driver. 10 On average Tulla pole wholesalers and retailers paid 700 ETB for harvesting and debranching of a Kada of Eucalyptus. That means, on average 100 ETB was incurred by them for harvesting and debranching of a truck of poles (1 Kada = 7 trucks of poles).
3) Benefit and cost analysis of Eucalyptus pole value chain from Chefasine at Tulla pole wholesaler and retailer level. Tulla pole wholesaler and retailer: These traders bought Eucalypts from the tree grower as standing tree (stumpage) with an average price of 13 ETB per tree
Unit Quantity Unit price (ETB) Total value (ETB) Value (US $) Costs for 2,742 trees/ Hectare Product cost Number of trees 2,742 13 35,646 1,308 Transportation cost including driver Truck including 5 6009 3000 110.09 Harvesting and debranching Truck 5 10010 500 18.35 Stacking in one place and loading on to the truck
Truck 5 150 750 27.52
Unloading from truck Truck 5 100 500 18.35 Pole arrangement Truck 5 50 250 9.17 Tax Pcs 1 100 100 3.67 Unofficial fees Pcs 1 100 100 3.67 Registration fee Pcs 1 100 100 3.67 Broker Pcs 1 250 250 9.17 Mobile card for communication Mobile card 5 25 125 4.58 Total cost (sum of all costs) 2,761
41,321 1,516
Revenue Quantity * Unit price 2,742 37 101,454 3,723 Margin Revenue less Total cost
60,133 2,187
Gross Profit Margin Profit/Revenue * 100
59 %
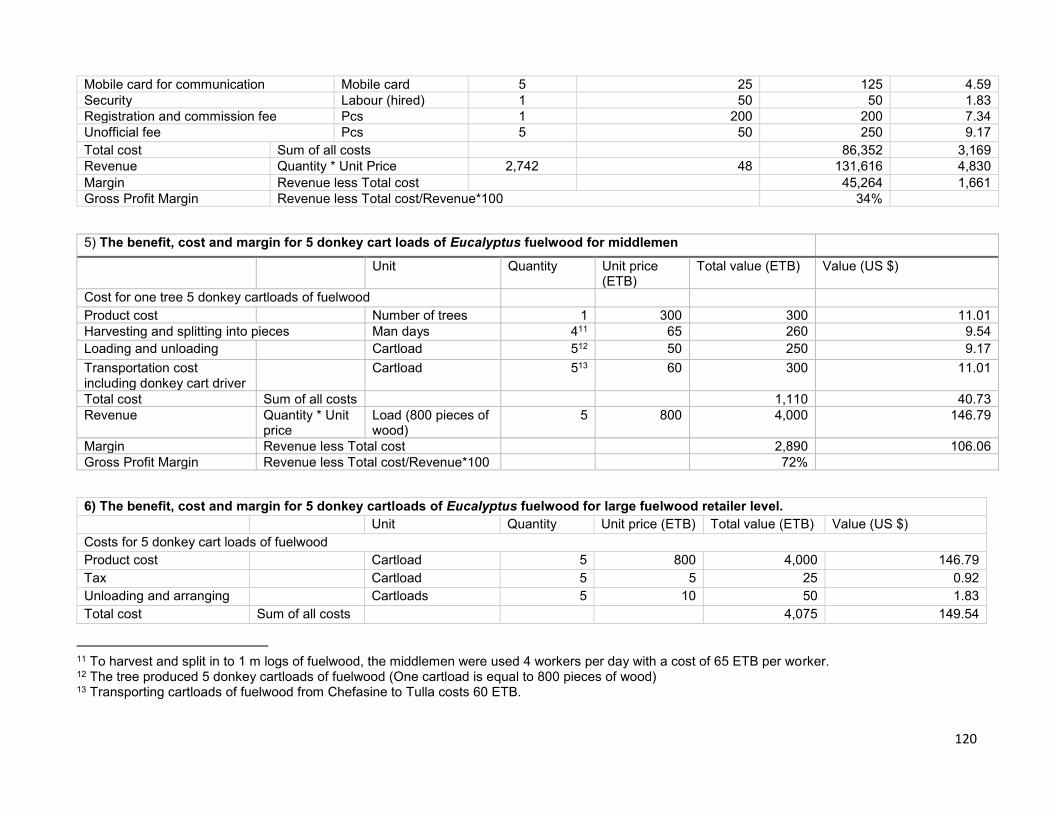
120
Mobile card for communication Mobile card 5 25 125 4.59 Security Labour (hired) 1 50 50 1.83 Registration and commission fee Pcs 1 200 200 7.34 Unofficial fee Pcs 5 50 250 9.17 Total cost Sum of all costs
86,352 3,169
Revenue Quantity * Unit Price 2,742 48 131,616 4,830 Margin Revenue less Total cost
45,264 1,661
Gross Profit Margin Revenue less Total cost/Revenue*100 34%
5) The benefit, cost and margin for 5 donkey cart loads of Eucalyptus fuelwood for middlemen Unit Quantity Unit price
(ETB) Total value (ETB) Value (US $)
Cost for one tree 5 donkey cartloads of fuelwood
Product cost Number of trees 1 300 300 11.01 Harvesting and splitting into pieces Man days 411 65 260 9.54 Loading and unloading
Cartload 512 50 250 9.17
Transportation cost including donkey cart driver
Cartload 513 60 300 11.01
Total cost Sum of all costs
1,110 40.73 Revenue Quantity * Unit
price Load (800 pieces of wood)
5 800 4,000 146.79
Margin Revenue less Total cost
2,890 106.06 Gross Profit Margin Revenue less Total cost/Revenue*100 72%
6) The benefit, cost and margin for 5 donkey cartloads of Eucalyptus fuelwood for large fuelwood retailer level. Unit Quantity Unit price (ETB) Total value (ETB) Value (US $)
Costs for 5 donkey cart loads of fuelwood Product cost Cartload 5 800 4,000 146.79 Tax
Cartload 5 5 25 0.92
Unloading and arranging
Cartloads 5 10 50 1.83 Total cost Sum of all costs
4,075 149.54
11 To harvest and split in to 1 m logs of fuelwood, the middlemen were used 4 workers per day with a cost of 65 ETB per worker. 12 The tree produced 5 donkey cartloads of fuelwood (One cartload is equal to 800 pieces of wood) 13 Transporting cartloads of fuelwood from Chefasine to Tulla costs 60 ETB.

121
Revenue Quantity * Unit price
Load (800 pieces of wood
5 88014 4,400 161.47
Margin Revenue less Total cost
325 11.93 Gross Profit Margin Revenue less Total cost/Revenue*100 7%
7) The benefit, cost and margin for 5 donkey cartloads of Eucalyptus fuelwood for small fuelwood retailer level (Flyers) Unit Quantity Unit price (ETB) Total value (ETB) Value (US $) Costs for 5 donkey cartloads of fuelwood Product cost Cartloads 5 880 4,400 161.47 Transportation cost Cartloads 5 2015 100 3.67 Labour cost Cartloads 5 1616 80 2.94 Total cost (Sum of all costs) 4,580 168.08 Revenue Quantity *Unit price Donkey cartload 5 1,00017 5,000 183.48 Margin
420 15.41
Gross profit margin Revenue less Total cost/Revenue*100 8.4%
14 Large fuelwood wholesalers and retailer sold one pieces of fuelwood in 1.10 ETB. 15 Transportation of one cartloads of fuelwood costs on average 20 ETB (15 to 25 ETB) at Tulla town and 30 to 40 ETB at Hawassa town 16 To vend one cartloads of fuelwood on average flayers needs 2 hours (on average 8 working hour per day with 65 ETB). So, 16 ETB per carloads were needed. 17 Small fuelwood retailers sold one pieces of fuelwood in 1.25 ETB.

122
Appendix III: Gross margin of selected crops in Chefasine.
II Gross margin for a hectare of khat at Chefasine kebele (30 years of lifespan)
No. Variable cost Unit Quantity Unit price Cost/unit area
(0.89) Cost/ha/year
(ETB) Total cost/ha/year
Establishment cost (A) 1 Land preparation Man days 16 65 1,040 1,168.54 94.17 2 Seedling Number 580 7 4,060 4,561.80 367.62 3 Seedling transport Man days 1 65 65 73.03 5.89 4 Planting Man days 6 65 390 438.20 35.31 5 Subtotal cost 6,241.57 502.99 6 Annual cost (B) 7 Weeding and hoeing (2 times/year) Man days 30 65 1,950 2,191.01 2,191.01 8 Fertiliser Kg 100 11.75 1,175 1,320.22 1,320.22 9 Collection (2 times per year) Man days 42 65 2,730 3,067.42 3,067.42
10 Transportation Zubra 2,790 5 13,950 15,674.16 15,674.16 11 Subtotal cost 22,252.81 22,252.81 12 Total variable cost (C= A + B) 28,494.38 22,755.79
I Gross margin for a hectare of Eucalyptus at Chefasine kebele (5 years of average rotation age)
No. Variable cost Unit Quantity Unit price Cost/unit area (0.31)
Cost/ha/year (ETB)
Amortised cost/ha/Year (ETB)
Establishment cost (A)
1 Land preparation including, a nursery for seedling growing Man days 4 66 264 852 208
2 Seedling No. 700 2 1,400 4,516 101 3 Seedling transportation Man days 2 66 132 426 104 4 Planting No. 4 66 264 852 208
5 Weeding and hoeing (first and second year) Man days 10 66 660 2,129 519
6 Fencing Man days 2 66 132 426 104 7 Thinning Man days 2 66 132 426 104 8 Total variable cost 9,626 1,347 9 Revenue (D) Number 5,000 13 65,000 209,677 41,935
10 Gross margin (D-C) 200,052 40,588 11 Gross margin in US$ (exchange rate 1US$=27.25 7,341 1,489

123
13 Revenue (Quantity * Price) (D) Zubra 1654 30 49,620 55,753 55,753 14 Gross margin (Revenue less Total variable cost (E= D-C) 27,258 32,997 Gross margin in US$ (exchange rate 1US$=27.25 1,000 1,211
III Gross margin for a hectare of coffee at Chefasine kebele, Sidama zone (ETB) (25 years of lifespan)
No. Variable cost Unit Quantity Unit price
Cost/unit area (0.89) Cost/ha/year (ETB) Total cost/ha/year
Establishment cost (A) 1 Land preparation Man days 25 65 1625 1,825.84 156.68 2 Compost preparation Man days 4 65 260 292.13 25.07 3 Compost transport Man days 0.5 40 20 22.47 1.93 4 Seedling No. 213 3 639 717.98 61.61 5 Seedling transport Man days 1 65 65 73.03 6.27 6 Planting Man days 2 65 130 146.07 12.53 7 Subtotal cost 3,077.53 264.08
Annual cost (B) 8 Weeding and Hoeing Man days 24 65 1560 1,752.81 1,752.81 9 Fertiliser Kg 55 11.75 646.25 726.12 726.12
10 Mulching Man days 5 65 325 365.17 365.17 11 Collection Man days 18 65 1170 1,314.61 1,314.61 12 Pulping Man days 2 65 130 146.07 146.07 13 Washing Man days 2 65 130 146.07 146.07 14 Drying Man days 1 65 65 73.03 73.03 15 Transportation Kg 335 5 1675 1,882.02 1,882.02 16 Subtotal cost 6,405.90 6,405.90 17 Total variable cost (C= A + B) 9,483.43 6,669.98 18 Revenue (Quantity * Price) (D) Kg 335 90 30150 33,876.40 33,876.40 19 Gross margin (Revenue less Total variable cost (E= D - C) 24,392.98 27,470.51 Growth Margin in US$ (exchange rate 1US$=27.25 895.16 1008.09

124
IV Gross margin for a hectare of enset at Chefasine kebele, Sidama zone (ETB) (6 years of lifespan) NO. Variable cost Unit Quantity Unit price Cost/unit area
(0.89) Cost/ha/year
(ETB) Total cost/ha/year
Establishment cost (A) 1 Land preparation Man days 4 65 260 292.13 61.28 2 Seedling Number 270 0.6 162 182.02 38.18 3 Seedling transport Man days 1 65 65 73.03 15.32 4 Planting Man days 3 65 195 219.10 45.96 5 Subtotal cost 766.29 160.76 Annual cost (B)
7 Weeding and Hoeing (2 times/year)
Man days 8 65 520 584.27 584.27
8 Compost Man days 2 65 130 146.07 146.07 9 Harvesting Man days 42 65 2,730 3,067.41 3,067.41
10 Subtotal cost 3,797.75 3,797.75 11 Total variable cost (C= A + B) 4,564.04 3,958.52 12 Revenue (Quantity * Price)
(D) Kg 270 18 4,860 5,460.67 5,460.67
13 Gross margin (Revenue less Total variable cost) (D-C) 896.63 1,502.15 14 Gross margin in US$ (exchange rate 1US$=27.25) 32.90 55.12
V Gross margin for a hectare of maize at Chefasine kebele, Sidama zone (ETB) No. Variable cost Unit Quantity Unit price cost/unit area (0.39) Cost/ha/year (ETB)
Establishment cost (A) 1 Ploughing (2 times) Man days 4 65 260 667 2 Seed (Improved) Kg 3 50 150 385 3 fertiliser (DAP and UREA) Kg 12 11.77 141.24 362 4 Oxen for ploughing Number 2 1,400 2,800 7,179 5 Sowing Man days 2 65 130 333 6 Weeding and hoeing (2 times) Man days 2 65 130 333 7 Fertiliser application Man days 4 65 260 667 8 Subtotal 9,926 9 Other costs (B)
10 Harvesting and threshing Man days 2 65 130 333.33 11 Transportation Kg 508 0.05 25.4 65.13 12 Subtotal 155.4 398.46

125
VI Gross margin for a hectare of Haricot bean at Chefasine kebele, Sidama zone (ETB)
No. Variable cost Unit quantity Unit price Price/unit area (0.89) Price/ha/year (ETB)
Annual cost 1 Land preparation (clearing) Man days 4 65 260 292.13 2 Seed Kg 2 15 30 33.71 3 Sowing Man days 4 65 260 292.13 4 Weeding Man days 2 65 130 146.07 5 Collecting and Threshing Man days 2 65 130 146.07 6 Transport Kg 200 0.1 20 22.47 7 Total variable cost 932.58 8 Revenue (Quantity * price) Kg 200 15 3000 3370.79 9 Gross margin (Revenue less Total variable cost 2438.20
Gross margin in US$ (exchange rate 1US $=27.25 89.48
VII Gross margin for a hectare of vegetables at Chefasine kebele, Sidama zone (ETB) No.
Variable cost Unit Quantity Unit price Cost/unit area (0.89) Total cost /ha/year (ETB)
Annual cost 1 Land preparation Man days 1 65 65 73.03 2 Seed Pieces 1 50 50 56.18 3 Sowing Man days 1 65 65 73.03 4 Weeding Man days 1 65 65 73.03 5 Collecting Man days 0.5 65 32.5 36.52 6 Total variable cost 311.80 7 Revenue (Quantity * Price) 400 449.44 8 Gross margin (Revenue less Total variable cost 137.64 9 Gross Margin in US$ (exchange rate 1US$=27.25
13 Total variable cost (C= A+ B) 10,325 14 Revenue (D) Kg 650 8 5,200 13,333.33 15 Gross margin (Revenue less total variable cost (D-C)) 3,009
Gross margin in US$ (exchange rate 1US$=27.25) 110.41

126
VIII Gross margin for a hectare of Banana, Avocado, and Gesho at Chefasine kebele (15 years of average lifetime)
No. Variable cost Unit Quantity Unit price
Cost/unit area (0.89)
Total Cost/ha/year (ETB)
Total cost/ ha/year ETB
Establishment cost (A): Average lifetime 15 years were used. 1 Land preparation and planting Man day 2 65 130 146.07 16.04 2 Seedling of Banana Number 50 5 250 280.90 30.84 3 Seedling of Avocado Number 25 8 200 224.72 24.67 4 Seed of Gesho (Rhamnus prinoides) Kg 0.5 15 7.5 8.43 0.93 5 Seedling transportation Man days 1 65 65 73.03 8.02 6 Subtotal 733.15 80.50
Annual cost (B) 8 Weeding and hoeing Man days 4 65 260 292.13 292.13 9 Collecting Man days 3 65 195 219.10 219.10
10 Transportation cost (Banana + Avocado + Gesho) 220 247.19 247.19
11 Subtotal 758.43 758.43 12 Total variable cost (C= A+B) 1,491.57 838.92 13 Revenue (Quantity * Price), Banana Kg 30 14 420 471.91 471.91 14 Revenue (Quantity * Price), Avocado Kg 43 18 756 849.44 849.44 15 Revenue (Quantity * Price), Gesho Kg 20 30 600 674.16 674.16 16 Total revenue (Banana + Avocado +
Gesho) (D) Kg 143 1,995.51 1,995.51 17 Gross margin (Revenue less Total variable cost) (C – D). 503.93 1,156.58 18 Gross margin in US$ (exchange rate 1US$=27.25 8.49 42.44

127
Note: To harvest cordia, tree growers in the area need to wait 15 to 25 years. Thus, on average 20 years of a lifetime were considered. Twenty years old
of Cordia africana has produced 5 cartloads of timber and sold at 3,000 ETB. Forty to sixty ETB, on average fifty ETB, were required for transporting
from Chefasine to Tulla and Hawassa towns, respectively.
IX Gross margin for a hectare of Cordia africana at Chefasine kebele (20 years of average lifetime) No. Variable cost Unit Quantity Unit price Cost/unit area
(0.89)/year Total cost/ha/year
(ETB) Amortised cost ETB ha-1year-1
Establishment cost 1 Planting Man days 0.25 65 16.25 18.26 1.72 2 Seedling Number 5 10 50 56.18 5.30 3 Harvesting and splitting Man days 4 65 260 292 292 4 Transportation cost Load 5 50 250 281 281 5 Total variable cost 1,478.93 1,411.53 6 Revenue (Quantity *
price) Number 5 3,000 15,000 16,854 843
7 Gross margin (Revenue less Total variable cost) 16,207 263 8 Gross margin in US$ (exchange rate 1US$=27.25 595 10

128
Appendix IV: Eucalyptus poles assortment and their respective price at different marketing places.
X Price of different poles at Chefasine, Tulla and Hawassa area A different
assortment of Eucalyptus (Used to fix or connect)
Quantity
Price at different locations/markets (ETB) Amharic Name Chefasine Tulla Hawassa Overall
mean Stem Kg Min Max Mean Min Max Mean Min Max Mean
Ye Wuch Gedegeda Mager
Construction wall from
1
11 16 13
16 20 18 25 35 30 20
Ye Wuste Gedgeda Mager
Construction wall from inside
1
8 10 9
10 14 12 15 25 20 14
Qesete Connect top of wall and roof
1
19.5
25 22 25 35 30 34 50 42 31
Wraje The roof with the wall
1
30 50 40 55 80 68 70 86 78 62
Gureshume Inside and outside corner of the house
1
40 46 43 50 70 60 64 80 72 58
Ye Qoreqoro Magere
the roof with the Weraje
1
16 20 18 20 26 23 36 45 40 27
Teshegagari A long pole, two said of the roof
1
75 82 78 70 100 85 80 120 100 88
Aerecho/ Chefeka Traditional/cottage construction
1
1.5
1.5 1.5 2 2 2 2 3 2.5 2
Mean of mean 28 37 48

129
Appendix V: Photos from the field survey
Eucalyptus fuelwood (left) and pole (right) vending area.
Donkey cartload of fuelwood (left) and truck of pole to the (right)
Eucalyptus marketing at Hawassa (left) and Tulla town (right)
Discussion with DA’s for sample selection Interview and discussion with tree growers

130
Sources for all Figures: Autor (2018)
Disease during data collection, April 2018 (left) and at the end of May (right) 2018)
Labour during loading and unloading
PIP workshop opening speech (Prof. Pretzsch and Prof. Tsegaye) (left) and problem prioritization by the trainers (right)
In-depth interview and Discussion with tree growers and brokers
Scaffolding by Eucalyptus pole