value chain analysis for green productivity improvement in the natural rubber supply chain: a case...
TRANSCRIPT

lable at ScienceDirect
Journal of Cleaner Production xxx (2014) 1e11
Contents lists avai
Journal of Cleaner Production
journal homepage: www.elsevier .com/locate/ jc lepro
Value chain analysis for green productivity improvement in thenatural rubber supply chain: a case study
Marimin*, Muhammad Arif Darmawan, Machfud, Muhammad Panji Islam Fajar Putra,Bangkit WigunaDepartment of Agroindustrial Technology, Faculty of Agricultural Technology, Bogor Agricultural University, Bogor, Indonesia
a r t i c l e i n f o
Article history:Received 27 March 2013Received in revised form21 December 2013Accepted 29 January 2014Available online xxx
Keywords:Green productivityNatural rubberValue streamGreen productivity index
* Corresponding author.E-mail addresses: [email protected], marimin_07
net.id ( Marimin).1 The liquid latex tapped from tress is not a stabl
required to change it to a form suitable for storage or s‘downstream’ here refers to the processes used to conas crumb rubber, ribbed sheet, or crepe rubber.
http://dx.doi.org/10.1016/j.jclepro.2014.01.0980959-6526/� 2014 Elsevier Ltd. All rights reserved.
Please cite this article in press as: Marimin, ecase study, Journal of Cleaner Production (2
a b s t r a c t
The main objective of this research was to map and to analyze green productivity of a natural rubbersupply chain and formulate scenarios for increasing its green productivity level. The case studies wereconducted in private enterprises engaged in natural rubber plantation and processing. Material flowanalysis was performed using the green material flow map to analyze the seven sources of green wastes.The best strategy for green productivity improvement was determined by using the Analytic HierarchyProcess (AHP). The performance of green productivity improvement strategies was then assessed asfuture GPI (Green Productivity Index) and compared with current GPI. Results of this research haveshown that the natural rubber cultivation combined with latex production improvement and wasteminimization was the best green productivity improvement strategy. The best selected strategy for theproduction process was reusing the processing water.
� 2014 Elsevier Ltd. All rights reserved.
1. Introduction
Indonesia is the second largest natural rubber (NR) producer inthe world with a production about 28% of the total production in2010. However, rubber plantation productivity in Indonesia islower compared to other major natural rubber producing countriessuch as Thailand and Malaysia.
Indonesia’s natural rubber industries have three possible sour-ces of raw material, namely smallholders, Government OwnedEnterprises, and large scale private plantations (estates). They arecharacterized by their low productivity on both the upstream anddownstream1 sides. Indonesia natural rubber upstream produc-tivity was 935 kg/hectare/year (Ministry of Agriculture, TheRepublic of Indonesia (2012)). This figure was lower than those ofother natural rubber producing countries such as Thailand,Malaysia and India. In 2008, Thailand’s natural rubber upstreamproductivity was 1698 kg/hectare/year, while Malaysia was1430 kg/hectare/year and India was 1930 kg/hectare/year
@yahoo.com, marimin@indo.
e material and processing ishipment. The use of the termvert the latex to a solid form
t al., Value chain analysis for g014), http://dx.doi.org/10.101
(Damardjati and Jacob, 2009). Besides the low productivity ofnatural rubber upstream industry, the raw material supply formanufacturing industry was scarce due to the export of most of theNR.
Existing studies on natural rubber have focused on upstreampractices rather than the natural rubber supply chain as a whole.Several studies on plantation practices have been conducted suchas on the germination and seedling (Basyaruddin, 2009; Permadiand Ginting, 2009; Hickling et al., 2009; Sundiandi et al., 2009;Boerhendhy et al., 2009; Muluk, 2009), and land preparation(Nugroho and Istianto, 2009). Although several studies have beendone on natural rubber production and rubber-related supplychains, such as rubber wood (Zachariah and Patrick, 2011), andenvironmental impact (Tekasakul and Tekasakul, 2006; Singh et al.,2011; Mohammadi et al., 2011), only few of them examined theintegration of productivity and effects on the environment. Arifin(2005) identified the need for integration between productivityand environmental concerns by increasing production with theintroduction of new varieties of rubber trees, combined with landuse that meets the requirements of sustainable resource manage-ment and environmental quality. The Arifin study, however, did notaddress increasing productivity throughout the supply chain nordid it integrate productivity and environmental issues in a systemicand systematic fashion. Rao (2000) suggested that an approachtowards an environmental initiative required a long-term vision ofa sustainable world encompassing a three-stage strategic solution
reen productivity improvement in the natural rubber supply chain: a6/j.jclepro.2014.01.098

Marimin et al. / Journal of Cleaner Production xxx (2014) 1e112
for the environment, namely (1) pollution prevention beforepollution control, (2) product stewardship and (3) clean technology.A systemic approach is required in order to see the problem fromboth an economic and environmental viewpoint.
The concept used in this research was Green Productivity (GP),focused on the issues at hand. The Asian Productivity Organization(APO) in 2006 stated that GP focuses on the environment through areduction in the rate of use of environmental resources while at thesame time reducing the negative impact on the environment. GPalso focuses on the economical reduction of material and energycosts used to create goods and services, thereby reducing the directcosts that ultimately have an impact on profitability.
This research has two purposes; (1) mapping and analyzinggreen productivity of the natural rubber supply chain, and (2)formulating scenarios to increase the productivity of the NR busi-ness based on a Green Productivity approach through case studiesof large-scale plantations (estates).
2. Literature study
2.1. Indonesian natural rubber supply chain
Businesses in the natural rubber industry supply chain are veryclosely interlinked; therefore, a supply chain analysis has the po-tential to indicate methods of reducing the cost of NR as a com-modity. Large estates are able to integrate all activities in the chainresulting in the ability to implement effective and efficient pro-duction, while small and medium estates need further improve-ment in order to integrate their upstream and downstream supplychain. Indonesia’s NR industry produces commodities in the formof crumb rubber (Standard Indonesian Rubber), sheet (RibbedSmoked2 Sheet), concentrated latex3, and crepe. The need forintegration between the downstream and upstream natural rubberbusinesses is important.
The price of natural rubber is caused by several factors such asthe phenomenon of the business cycle and the effect of Cobweb4
theory on rubber commodity, the dynamic changes in funda-mental factors and economic shocks/policies that affect the de-mand and supply of the world’s natural rubber, and the emergenceof non-physical market as hedging efforts of investors and specu-lators in the futures market exchange, especially in SingaporeCommodity Exchange (SICOM), Shanghai Future Exchange (SHFE),Tokyo Commodity Exchange (TOCOM) and others. World rubberprice volatility is often used by speculators to make a profit, but forrubber planters, this is often detrimental to farmers particularlywhen prices fall and only a momentary benefit in the event of priceincreases (Permadi, 2010).
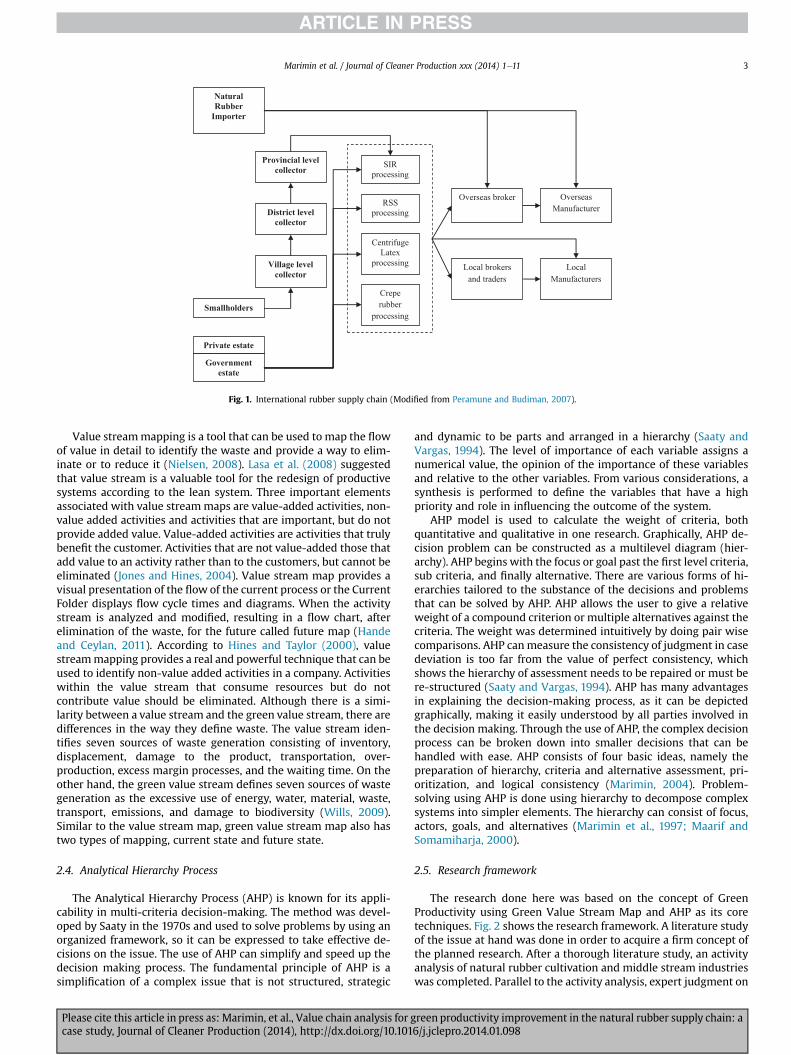
The natural rubber supply chain in Indonesia consists of sup-plier, distributor, processor, and marketer. The suppliers aresmallholder farmers, private and government estates, and naturalrubber importers. The smallholder supply goes through variousintermediaries, usually including village, district and provinciallevel collectors. The larger private and government estates establishtheir own internal distribution. Smallholders supply over 90% of thetotal natural rubber supply, and it is primarily in one of the solidforms. NR processed products consist of crumb rubber of
2 Concentrated latex is an alternate downstream NR form. It is normally pro-cessed, by centrifuging the liquid latex and adding an ammonia stabilizer.
3 Part of the process necessary to produce solid forms of NR is drying. Originallydrying was aided by heat of the smoke from burning wood. The term ‘smoked’comes from that history.
4 Cobweb model is based on a time lag between supply and demand decisions.Since there is lag between planting and harvesting in agricultural markets, theCobweb model is said to be applicable in these market.
Please cite this article in press as: Marimin, et al., Value chain analysis for gcase study, Journal of Cleaner Production (2014), http://dx.doi.org/10.101
Indonesian Standard (SIR), Ribbed Smoked Sheet (RSS), CentrifugeLatex, Crepe rubber (Brown Crepe and White Crepe) and others.The natural rubber markets comprise national market and inter-national markets. The national market consists of local brokers andtraders that supply national downstream manufacturing. The in-ternational market, on the other hand, consists of overseas brokersthat supply overseas manufacturers of rubber goods. The overall NRsupply chain is exhibited in Fig. 1.
2.2. Green productivity
Green Productivity stems from the concept of “lean and green”concept, which is an integration of both lean and green thinking.Lean thinking was introduced in order to enhance productivity interms of economy over the last several decades. Recently, envi-ronmental consciousness in industrial practices has receivedconsiderable attention. It has triggered the emergence of greenthinking in the way firms operate in various industries. Lean andgreen thinking tries to minimize waste in terms of production andterms of the environment. Overlap between the two paradigms hasbeen studied by Dues et al. (2012). The literature study concludedthat the relationship between lean and green are very close. Basedon the studies that have been done on companies implementinglean production system, it was found that lean could help creategreen supply chains. On the other hand, the application of greenapproaches in the production system can help production becomelean.
One of several lean and green initiatives is ‘Green Productivity’that was designed by The Asian Productivity Organization. It wascreated following the 1992 Rio Earth Summit as both concept andstrategy integrating the lean and green initiative. The definition ofGreen Productivity as stated by the Asian Productivity Organization(2006) is:
“Green productivity (GP) is a strategy for enhancing productivityand environmental performance simultaneously to achieveoverall socio-economic development. Its aim is well-roundedsocio-economic development that leads to sustained improve-ment in the quality of human life. It is the combined applicationof appropriate productivity and environmental managementtools, techniques and technologies that reduce the environ-mental impact of an organization’s activities, products andservices while enhancing profitability and competitiveadvantage”.
Although there are very few research articles on Green Pro-ductivity, it is a growing topic in the field of lean and green. Severalpapers explicitly mentioned Green Productivity, namely Gandhiet al. (2006), Tuttle and Heap (2008), and Hur et al. (2004).Fliedner and Majeske (2010), although they did not explicitlymention the term Green Productivity, argued that lean and greenconcepts intercept and supported each other in order to enhanceproductivity.
2.3. Green Value Stream
Green Value Stream (GVS) mapmethod was introduced byWills(2009), which was known as the principle of green intentions withgreen value stream mapping, as a tool to map the seven wastegenerators that exist in value added systems. The GVS has its rootsto the original value stream map that was first developed by op-erations management staff at Toyota Motor Corporation, Japan, inthe late 1980s. It was originally used to identify ways to smooth theflow of material and information, improve productivity andcompetitiveness, and help implement the system rather.
reen productivity improvement in the natural rubber supply chain: a6/j.jclepro.2014.01.098
Smallholders
Natural Rubber
Importer
Village level collector
District level collector
SIR processing
RSS processing
Centrifuge Latex
processing
Crepe rubber
processing
Overseas broker
Local brokers and traders
Overseas Manufacturer
Local Manufacturers
Provincial level collector
Private estate
Government estate
Fig. 1. International rubber supply chain (Modified from Peramune and Budiman, 2007).
Marimin et al. / Journal of Cleaner Production xxx (2014) 1e11 3
Value streammapping is a tool that can be used to map the flowof value in detail to identify the waste and provide a way to elim-inate or to reduce it (Nielsen, 2008). Lasa et al. (2008) suggestedthat value stream is a valuable tool for the redesign of productivesystems according to the lean system. Three important elementsassociated with value streammaps are value-added activities, non-value added activities and activities that are important, but do notprovide added value. Value-added activities are activities that trulybenefit the customer. Activities that are not value-added those thatadd value to an activity rather than to the customers, but cannot beeliminated (Jones and Hines, 2004). Value stream map provides avisual presentation of the flow of the current process or the CurrentFolder displays flow cycle times and diagrams. When the activitystream is analyzed and modified, resulting in a flow chart, afterelimination of the waste, for the future called future map (Handeand Ceylan, 2011). According to Hines and Taylor (2000), valuestreammapping provides a real and powerful technique that can beused to identify non-value added activities in a company. Activitieswithin the value stream that consume resources but do notcontribute value should be eliminated. Although there is a simi-larity between a value stream and the green value stream, there aredifferences in the way they define waste. The value stream iden-tifies seven sources of waste generation consisting of inventory,displacement, damage to the product, transportation, over-production, excess margin processes, and the waiting time. On theother hand, the green value stream defines seven sources of wastegeneration as the excessive use of energy, water, material, waste,transport, emissions, and damage to biodiversity (Wills, 2009).Similar to the value stream map, green value stream map also hastwo types of mapping, current state and future state.
2.4. Analytical Hierarchy Process
The Analytical Hierarchy Process (AHP) is known for its appli-cability in multi-criteria decision-making. The method was devel-oped by Saaty in the 1970s and used to solve problems by using anorganized framework, so it can be expressed to take effective de-cisions on the issue. The use of AHP can simplify and speed up thedecision making process. The fundamental principle of AHP is asimplification of a complex issue that is not structured, strategic
Please cite this article in press as: Marimin, et al., Value chain analysis for gcase study, Journal of Cleaner Production (2014), http://dx.doi.org/10.101
and dynamic to be parts and arranged in a hierarchy (Saaty andVargas, 1994). The level of importance of each variable assigns anumerical value, the opinion of the importance of these variablesand relative to the other variables. From various considerations, asynthesis is performed to define the variables that have a highpriority and role in influencing the outcome of the system.
AHP model is used to calculate the weight of criteria, bothquantitative and qualitative in one research. Graphically, AHP de-cision problem can be constructed as a multilevel diagram (hier-archy). AHP begins with the focus or goal past the first level criteria,sub criteria, and finally alternative. There are various forms of hi-erarchies tailored to the substance of the decisions and problemsthat can be solved by AHP. AHP allows the user to give a relativeweight of a compound criterion or multiple alternatives against thecriteria. The weight was determined intuitively by doing pair wisecomparisons. AHP canmeasure the consistency of judgment in casedeviation is too far from the value of perfect consistency, whichshows the hierarchy of assessment needs to be repaired or must bere-structured (Saaty and Vargas, 1994). AHP has many advantagesin explaining the decision-making process, as it can be depictedgraphically, making it easily understood by all parties involved inthe decision making. Through the use of AHP, the complex decisionprocess can be broken down into smaller decisions that can behandled with ease. AHP consists of four basic ideas, namely thepreparation of hierarchy, criteria and alternative assessment, pri-oritization, and logical consistency (Marimin, 2004). Problem-solving using AHP is done using hierarchy to decompose complexsystems into simpler elements. The hierarchy can consist of focus,actors, goals, and alternatives (Marimin et al., 1997; Maarif andSomamiharja, 2000).
2.5. Research framework
The research done here was based on the concept of GreenProductivity using Green Value Stream Map and AHP as its coretechniques. Fig. 2 shows the research framework. A literature studyof the issue at hand was done in order to acquire a firm concept ofthe planned research. After a thorough literature study, an activityanalysis of natural rubber cultivation and middle stream industrieswas completed. Parallel to the activity analysis, expert judgment on
reen productivity improvement in the natural rubber supply chain: a6/j.jclepro.2014.01.098

Activity analysis of natural rubber upstream and first
downstream industry
Green Productivity Measures
Generate Green Productivity Indicator
Green Productivity Calculations
Current green value stream map
Economic Indicator
Environment Indicator
Expert Judgement on environment issues
Literature Study
Future green value stream map
Generate Productivity Improvement Strategy
Fig. 2. Research framework.
Production Cost
Product price
Economic Indicator
Gas waste source generator
Green Productivity
Marimin et al. / Journal of Cleaner Production xxx (2014) 1e114
environmental issues was completed in order to generate GreenProductivity Indicators. Subsequently, green productivity measureswere determined as an input for Green Productivity calculations. Inaddition, green productivity measures, i.e. environmental indicatorand economic indicator were used in the calculation. Green valuestream map was constructed on the basis of activities performedand the result of the calculation. The current green value streammap was analyzed in order to generate productivity improvementstrategies. The productivity improvement strategies were thenused to construct a future green value stream map.
Water consumption Environment impact
Solid waste source generator
Fig. 3. Green productivity index measurement (modified from Gandhi et al., 2006).
3. Research method
Indonesia’s natural rubber industries have three possible sour-ces of raw material, namely smallholders, Government Own En-terprises, and large scale private plantations (estates). In thisresearch, in determining the common factors we considered thesethree sources. However, due to practical constraints, we useddetailed numerical data and information provided by XYZ Co. inparticular and the private estates in general.
Value chain analysis consists of several activities. The processstages and required material for cultivation and production wereanalyzed using green value stream developed by Wills (2009). Thisanalysis starts with the identification of seven green waste gener-ators. Following the analysis of the activities and materials neededin the cultivation and production, the green productivity index(GPI) was calculated with formulas (1), (2), and (3). Fig. 3 shows theframework of GPI measurement.
3.1. Green productivity index
Green productivity calculations were done by accumulating theresults of the calculation of economic indicators and environmentalindicators. Economic indicators were calculated by the ratio be-tween the incomes earned from the sale of products and produc-tion costs to produce the product.
Green Productivity Index ðGPIÞ ¼ Economic Indicator=Environmen
Please cite this article in press as: Marimin, et al., Value chain analysis for gcase study, Journal of Cleaner Production (2014), http://dx.doi.org/10.101
The economic indicator is the ratio between the selling price andcost of production of the same unit of one type of product. In thisresearch, the sellingpriceof theproduct inquestion is the sellingpriceper liter of latex products produced from the field, while the cost ofproduction is the cost required to produce 1 L of latex products. Thecalculations used in determining the value of the economic indicatorare based upon the production of one tonne of latex products.
Economic Indicator ¼ Revenue=Total Cost (2)
Furthermore, the environmental indicator is determined by theextent of environmental impact of the cultivation and production ofnatural rubber. Based on the methodology developed by Gandhiet al. (2006), the indicator value is determined based on threetypes of plant waste, i.e. gaseous wastes generation, solid wastesgeneration, and water consumption.
The environmental impact (EI)was determined by the sumof theweights for each green productivity indicator. Green Productivity
tal Indicator (1)
reen productivity improvement in the natural rubber supply chain: a6/j.jclepro.2014.01.098

Table 1Indicators’ weight in ESI 2005 (Esty et al., 2005).
Equality of ESI indicator Weight in ESI
Quality of air 0.05Greenhouse emission 0.05Decrease in air pollution level 0.05Water quality 0.05Water consumption 0.05Decrease in solid and material consumption 0.05Biodiversity 0.05Land area 0.05
Marimin et al. / Journal of Cleaner Production xxx (2014) 1e11 5
weights and indicators were determined by the results of theanalysis and were summarized by world experts as EnvironmentalSustainability Index (ESI) (Esty et al., 2005). Preparation of the ESIwas based upon the determination of the five types of environ-mental quality assessment components, which included 21 in-dicators of environmental sustainability and76variables underlyingthe valuation weight of each indicator. Aggregation method wasused toequalize the amountofweights. Theuseof ESI as thebasis forweighting environmental impact (EI) in this research refers toresearch conducted by Gandhi et al. (2006). Table 1 shows the eightimportant indicators in the ESI used in this research.
Environmental impact was defined as the sum of environmentalvariable weight of GPI and derived from ESI weight.
EI ¼ w1GWGþw2WCþw3SWGþw4LWG (3)
whereas:
w1, w2, w3, w4: weight of each GPIGWG : gaseous wastes generationSWG : solid wastes generationWC : water consumptionLWG : land wastes generation
Therefore, the weights of each GPI indicator for natural rubbercultivation were, w1 ¼ 0.375, w2 ¼ 0.25, w3 ¼ 0.125, and w4¼ 0.25and the environmental impact of natural rubber cultivation wasformulated as:
EI ¼ 0:375GWGþ 0:25WCþ 0:125SWGþ 0:25LWG (4)
Whereas, the Environmental impact for natural rubber pro-cessing were:
EI ¼ 0:17 SWGþ 0:5 GWGþ 0:33 WC (5)
3.2. Generating improvement strategies
1. Systems Approach
The systems approach was accomplished by identifying all of thefactors contained in the system to obtain a good solution for resolvingthe problem, and then creating a model of AHP to help rational de-cisions. TheAHP structure consists offive levels; namely, focus, factors,actors, goals and alternatives. The AHP structure of productivityimprovementwasgained throughexpert interviews,namely, opinionsof three experts and an expert in the production of natural rubber.
2. Determination of Respondents
In accordance with the approach adopted in this research, therespondents were determined by expert selection techniques. Inthis case, the experts selected were those in the field of naturalrubber cultivation, from academia, bureaucracy and practitioners.The experts involved in this research were three people, consistingof corporate culture experts, experts from the Institute for EstateCrops Research Nusantara (RPN), and a professor who was anexpert on natural rubber cultivation. The application of the AHPrequires a consistency test of expert opinion; therefore, a Consis-tency Ratio Test (CR Test) was completed.
3. Improvement scenario selection method
The method used in this research is the Analytical HierarchyProcess (AHP), a technique that can be used in the decision makingprocess. Decision-making was carried out through preparation
Please cite this article in press as: Marimin, et al., Value chain analysis for gcase study, Journal of Cleaner Production (2014), http://dx.doi.org/10.101
hierarchy, which according to Saaty and Vargas (1994) describedthe structure of the system in which the function hierarchy be-tween components and the impact on the overall system can bestudied. Pictures or illustrations in Analytic Hierarchy Process wereinterrelated, ranging from goals, incentives, business, strategy ormethod to do. AHP was used in this research because the systembeing studied was complex and unstructured. Designing scenariosrepairs were done on the basis of the results of the analysis andidentification of solutions to existing problems. The scenarios weredrawn up and problem solutions were obtained through AHPanalysis and literature review.
4. Current Green Value Stream and GPI
Based on the observation conducted, natural rubber cultivationwas classified into six process activities i.e. nursery related activ-ities, plants maintenance, harvesting, filtering, and shipping todesignated factories. The plants were classified into two categories,namely immature non-producing plants and mature producingplants. Immature non-producing plants are rubber plants rangingfrom 0 to 5 years of age while mature productive plants are plantsin their productive stage that can be harvested, ranging from5 to 30years old.
Harvesting activities were conducted every day, starting fromfive to eight o’clock in the morning. Subsequently, the process ofcollecting latex began at ten in the morning. All latex tapped wascollected in a collecting depot at eleven. In the process of collectinglatex, collectors usually add one drop of ammonia on each tappingbowl to prevent latex clotting. The screening process was carriedout in the collecting depot along with the casting process of thebucket into the tank. Filtering aims to filter out various impurities,such as twigs, leaves, or lump (clotted latex). At the time ofscreening, typically, the amount of dirt filtered reached two or threepounds for each depot.
Latex delivery was done in latex tanks mounted on trucks. Eachtruck transported the results from the depot to the factory. Elimi-nation of natural rubber cultivation process was undertaken toeliminate “unnecessary” cultivation activity due to its little or noimpact on the overall natural rubber cultivation. Based on theanalysis of the overall activities, filtering was considered as elimi-nable from the entire rubber cultivation. The main reason was thatthe filtering activities only producedwaste in the form of large latexpollutants, such as twigs, leaves, or lump. Overall waste is basicallya type of organic waste that can be tolerated by the environment,thus eliminating these activities will not affect the analysis of thewaste to the entire process of cultivation of natural rubber.
The seven sources of green waste per activity for the upstreamactivities and production process of RSS (Ribbed Smoked Sheet),and BC (Brown Crepe) are shown respectively in Table 2, Table 3,and Table 4. The upstream activities of the chain consisted ofnursery, maintenance of non-productive plants (NPPMaintenance),and maintenance of productive plants (PP maintenance), harvest-ing, sorting and shipping.
reen productivity improvement in the natural rubber supply chain: a6/j.jclepro.2014.01.098

Table 2Green waste identification for upstream activities.
Waste type Process activities
Nursery NPP maintenance PP maintenance Harvest Sorting Shipping Total
Energy (Kwh) 1830 0 0 0 0 0 1830Water (m3) 900 0 0 0 0 0 900Material (kg) 1245 28,075 40,531 0 0 0 69,851Garbage (kg) 0 0 0 14,400 3000 0 14,400Transportation (km) 0 0 0 0 0 2700 2769Emission 1631 0 0 0 0 1426 3094Biodiversity (ha) 194 763 1759 0.02 0.01 0 2715
Table 3Seven green wastes identification of RSS.
Waste type Process activities (per production)
Raw material receiving Dilution and coagulation Milling Smoking Sorting Packaging Total
Energy (kWh) 3.33 200.00 170.00 e e 50.00 423.33Water (liter) e 8549.71 7000.00 e e e 15,549.71Material (kg) e 45.00 e 0.00 e e 45.00Garbage (kg) e e e 652.00 e e 652.00Transportation (km) e e e e e e e
Emission (tonnes CO2/day) 2.97 � 10-3 0.71 0.76 0.15 e 0.27 1.89Biodiversity (Ha) e e e e e e e
Source: XYZ Co. (2012).
Marimin et al. / Journal of Cleaner Production xxx (2014) 1e116
The company mainly produces two types of product, the RibbedSmoked Sheet and Brown Crepe. The RSS production consists of sixactivities, i.e. raw material receiving, dilution and coagulation,milling, smoking, sorting and packing. Table 3 exhibits the activitiesof RSS, seven green wastes generated, and their amounts. The BCproduction process consists of four activities, which are sorting andreceiving, milling, drying and sorting. Similarly, Table 4 exhibits theactivities of BC, seven green wastes generated, and the wasteamounts generated.
Calculation of Green Productivity Index for the upstreamresulted in a figure of 1.956, based on an environmental indicator of0.6714 and economic indicator of 1.3132. These figures show thatthe economic indicator was higher than the environmental indi-cator. The upstream process has a higher GPI compared to thedownstream processing of the chain, which means the green pro-ductivity is higher compared to the downstream processing ofnatural rubber in the chain. The value indicated that the level ofproductivity was still higher than the environmental impactresulting from the activities performed. When the company ach-ieves higher green productivity index values, the level of economicproductivity and indicators of enterprisewould be higher, while theenvironmental impact of the company’s activity would be lower.
Table 4Seven sources of green wastes identification of BC.
Waste type Process activities (per production)
Sorting andreceiving
Milling Drying Sorting Total
Energy (kWh) 90.00 148.20 e e 238.20Water (liter) 4000.00 6080.00 e e 10,080.00Material (kg) e e e e e
Garbage (kg) e e e e e
Transportation(km)
e e e e e
Emission(tonnes CO2/day)
e 0.66 e e 0.74
Biodiversity (Ha) e e e e e
Source: XYZ Co. (2012).
Please cite this article in press as: Marimin, et al., Value chain analysis for gcase study, Journal of Cleaner Production (2014), http://dx.doi.org/10.101
Conversely, the lower the index value of green productivity, thegreater the environmental impact of the process activities in thecompany. The GPI of upstream and overall downstream processesof RSS and BCwere compared and illustrated in Fig. 4.The upstreamGPI indicated to be the highest compared to the RSS and BC pro-duction processes. In the upstream side of the chain, the environ-mental indicator suggested low environmental impact, andmoderate economic indicator compared to the RSS and BC.Conversely, the RSS production process has the lowest GPIcompared to the other two and the highest environmental indica-tor. Therefore, it is argued that the high environmental indicator ofRSS production has hindered the achievement of greenproductivity.
In terms of GPI in the production process, RSS was significantlysmaller compared to BC, which means that BC was higher in greenproductivity. Based on Fig. 4, the environmental impact was higherthan the economic indicator significantly which means the envi-ronmental impact exceeded its economic value added. Based on thehistogram, RSS had a substantially high environmental indicatorvalue, as much as 7.672, while its economic indicator was 2.063.
The Green Value Stream of natural rubber cultivation and Rib-bed Smoked Sheet production are exhibited in Fig. 5 and Fig. 6. The
0
1
2
3
4
5
6
7
8
9
Upstream RSS BC
Value
Environmental indicator
Economic Indicator
Current GPI
Fig. 4. Economic and environmental indicators and GP index for upstream and pro-duction processes.
reen productivity improvement in the natural rubber supply chain: a6/j.jclepro.2014.01.098

SEED SUPPLIER
PROCESSING PLANT
ADMIN & SUPPORT
XYZ Company
Transport : 69.17 km
Emission : 37 kg
Energy : 1,830 KWh
Water : 900 m
Materials : 131,836 kg
Garbage : 147,334 kg
Transportation : 2,769.17 km
Emission : 3,094.3 kg
Sorting
(everyday)
Energy : 0 KWh
Water : 0 m3
Materials : 0 kg
Garbage : 3,000 kg
Transportation : 0 km
Emission : 0 kg
Harvest(everyday)
Energy : 0 KWh
Water : 0 m3
Materials : 0 kg
Garbage : 144,000 kg
Transportation : 0 km
Emission : 0 kg
Maintenance PP
(6-30 years)
Energy : 0 KWh
Water : 0 m3
Materials : 75,806.6 kg
Garbage : 0 kg
Transportation : 0 km
Emission : 0 kg
Maintenance NPP
(1-5 years)
Energy : 0 KWh
Water : 0 m3
Materials : 53,670.5 kg
Garbage : 0 kg
Transportation : 0 km
Emission : 0 kg
Nursery
(0-1 years)
Energy : 1,830 KWh
Water : 900 m3
Materials : 2,358.6kg
Garbage : 334 kg
Transportation : 0 km
Emission : 1,631 kg
Latex ProductionAverage: 428,557
Liter/month
Seed demand1 million seeds/year
Shipping
Transport : 2,700 km
Fig. 5. Green Value Stream of natural rubber cultivation.
PROCESSING PLANT
CUSTOMER
ADMIN & SUPPORT
XYZ Company
Every Day14,285.23 Liter/Day
Transport. : -Emission : -
2x/MonthEnergy
Transport. : -Emission : -Energy : 12,699.9Kwh/Month
Water :388.742 m3/Month
Materials :1,125 liter/Month
Garbage :19.56 tonnes/month
Transportation :-
Emission :1.8876 tonnes CO2/Day
Biodiversity : -
(Daily)
Raw Materials Receiving (Latex)
(daily)C/T : 1 hourC/O : 0
Energy : 3.33 Kwh
Water : 0 Liter
Materials : 0
Garbage : 0 Kg
Transportation: 0 Km
Emission : 2.967 x 10
Tonn CO2/Day
Biodiversity : -
Dilution and Coagulation (daily)
C/T : 4 hourC/O : 1 hour
Energy : 200 Kwh
Water : 8,549.71 Liter
Materials : 45 Liter
Garbage : 0 Kg
Transportation: 0 Km
Emission : 0.7128 Ton
CO /Day
Milling Station(daily)
C/T : 5 hourC/O : 2 hour
Energy : 170 Kwh
Water : 7,000 Liter
Materials : 0
Garbage : 0 Kg
Transportation: 0 Km
Emission : 0.7573 Ton
CO /Day
Biodiversity : -Energy : 0 KWh
Smoking Station(daily)
C/T : 120 hourC/O : 2 hour
Energy : 0 Kwh
Water : 0 Liter
Materials : 0
Garbage : 0.652 Ton
Transportation: 0 Km
Emission : 0.1473 ton
NO , SO
Biodiversity : -
Sorting Station(daily)
C/T : 6 hourC/O : 1 hour
Energy : 0 Kwh
Water : 0 Liter
Materials : 0
Garbage : 0 Kg
Transportation: 0 Km
Emission : -
Packing and inventory (daily)
C/T : 6 hourC/O : 1 hour
Energy : 50 Kwh
Water : 0 Liter
Materials : 0
Garbage : 0 Kg
Transportation: 0 Km
Emission : 0,2673 Ton
CO /Day
Biodiversity: -
Demand120 Tonnes/month
Latex needs information
Average 14,285.23 Liter/Day
Fig. 6. Green value stream of ribbed smoke sheet production.
Marimin et al. / Journal of Cleaner Production xxx (2014) 1e11 7
Please cite this article in press as: Marimin, et al., Value chain analysis for green productivity improvement in the natural rubber supply chain: acase study, Journal of Cleaner Production (2014), http://dx.doi.org/10.1016/j.jclepro.2014.01.098

0.000
0.500
1.000
1.500
2.000
2.500
3.000
3.500
4.000
4.500
Cultivation Ribbed SmokedSheet
Brown Crepe
Current GPI
Future GPI Alternative
Fig. 7. Comparison of current and future alternative GPI.
Marimin et al. / Journal of Cleaner Production xxx (2014) 1e118
seven green wastes are illustrated in every step of the process, inthe cultivation and the RSS production process. In the cultivation ofnatural rubber, the total amount of seven green wastes generated,namely energy, water, materials, garbage, transportation andbiodiversity were 1830 KWh, 900 m3, 131836 kg, 147334 kg,2769.17 km, 3094.3 kg and 0, respectively, while the RSS productionhas shown a different figure of seven green wastes generated:12699.9 KWh/month energy, 388.742 m3/month water,1125 L/month materials, 19.56 tonnes/month garbage, 0 trans-portation, 1.8876 tonnes CO2/day emissions and 0 biodiversity.
4. Generating green productivity improvement strategies
4.1. Cultivation improvement strategy
A productivity improvement scenario was obtained from thedevelopment of selected strategy based on the AHP. The AHPstructure for strategy alternative to increase productivity of naturalrubber cultivation is presented in Fig. 8. The selected alternativewas semi-intensification and replacing low producing plants withnew ones with a weight value of 0.290 compared to other alter-natives. Alternative strategy was selected based on expert opinion.
Focus
Factor
Actor
Goal
Alternative
Productivity Improvement Strategy Sele(1
Production facility and Infrastructure
(0.039)
Planters and actors competence
(0.222)
Plantation optimum utilization
(0.139)
Pla
Government(0.081)
Ministry of agriculture(0.095)
Company management
(0.326)
Environmental im(0.26
Increase latex output(0.473)
Substitute a portion of Chemical pesticide usage with
Vegetable pesticide (0.177)
Reuse of wastes from
cultivation process(0.252)
Fig. 8. AHP structure for productivity impr
Please cite this article in press as: Marimin, et al., Value chain analysis for gcase study, Journal of Cleaner Production (2014), http://dx.doi.org/10.101
Based on the alternative selected, 9 scenarios were then con-structed in order to implement the alternative. Next, the GPI of thenine scenarios was calculated in order to obtain the best GPI value.The nine scenarios and GPI value are shown in Table 5. The best GPIobtained was 3.69 for scenario 9, which was the combination of thebest strategy with scenario 8.
4.2. Natural rubber production process improvement strategy
Productivity improvement strategy was obtained from thedevelopment of selected strategy based on the AHP. AHP structurefor strategy alternatives to increase productivity of the naturalrubber production process is presented in Fig. 9. The alternativesweighted by experts were (1) production process optimization, (2)raw material control, (3) raw material substitution, and (4) waterre-use. Based on expert opinion aggregation, the selected alterna-tive strategy for increasing productivity in the production of naturalrubber in the company was the use of water (reuse). The use ofwater (reuse) was considered the most likely to be applied in orderto increase the green productivity of the production process in thecompany. Through the reduction of water consumption in theproduction, not only is natural rubber production cost able to bereduced but also the environmental impact of the production ofnatural rubber can be reduced.
4.3. Future green value stream map
Based on the calculation of GPI for cultivation and processshown in Fig. 7, it is argued that there is a significant difference inthe GPI between the current and future scenario. A sharp differencebetween current and future alternative was 1.956e3.960. It isargued that the implementation of future scenario could increaseGPI by 2 digits. Similar result exhibited that for RSS and BC, reuse ofwater could increase GPI for both production lines.
Based on the comparison of current and future state GPI for thecultivation of natural rubber as well as natural rubber processing-RSS and BC it is argued that the scenario based on Green Produc-tivity improvement strategy is indeed able to increase Green Pro-ductivity. Based on the future scenario, future green value streammap was constructed for natural rubber cultivation and production
ction of Natural Rubber Process based on GP .000)
nts Nursery and Maintenance
(0.258)
Transportation and Communication
(0.039)
Technology Mastery and
application (0.135)
Government Policy(0.032)
Universities and research institution(0.079)
Plantation head(0.215)
Planters group(0.204)
pact reduction3)
Increase company profit(0.264)
Substitute a portion of Chemical with Organic
and Green fertilizers(0.281)
Semi-intensify and replaceLow producing plants with new ones
(0.290)
ovement in natural rubber cultivation.
reen productivity improvement in the natural rubber supply chain: a6/j.jclepro.2014.01.098
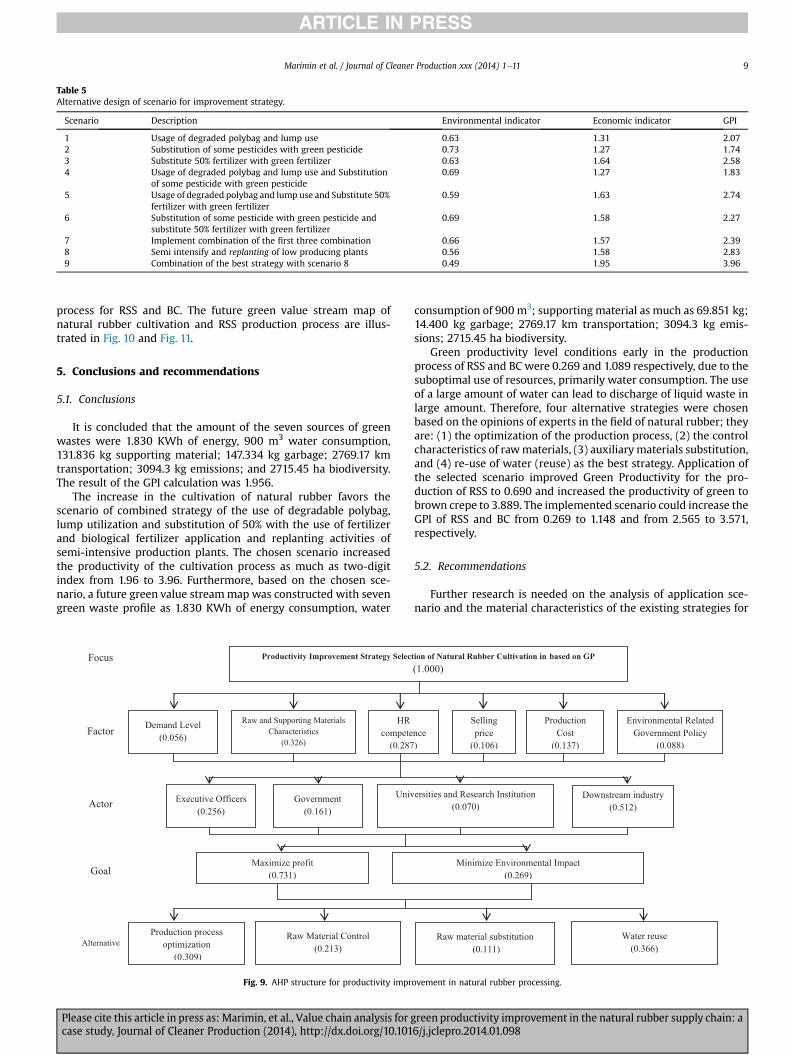
Table 5Alternative design of scenario for improvement strategy.
Scenario Description Environmental indicator Economic indicator GPI
1 Usage of degraded polybag and lump use 0.63 1.31 2.072 Substitution of some pesticides with green pesticide 0.73 1.27 1.743 Substitute 50% fertilizer with green fertilizer 0.63 1.64 2.584 Usage of degraded polybag and lump use and Substitution
of some pesticide with green pesticide0.69 1.27 1.83
5 Usage of degraded polybag and lump use and Substitute 50%fertilizer with green fertilizer
0.59 1.63 2.74
6 Substitution of some pesticide with green pesticide andsubstitute 50% fertilizer with green fertilizer
0.69 1.58 2.27
7 Implement combination of the first three combination 0.66 1.57 2.398 Semi intensify and replanting of low producing plants 0.56 1.58 2.839 Combination of the best strategy with scenario 8 0.49 1.95 3.96
Marimin et al. / Journal of Cleaner Production xxx (2014) 1e11 9
process for RSS and BC. The future green value stream map ofnatural rubber cultivation and RSS production process are illus-trated in Fig. 10 and Fig. 11.
5. Conclusions and recommendations
5.1. Conclusions
It is concluded that the amount of the seven sources of greenwastes were 1.830 KWh of energy, 900 m3 water consumption,131.836 kg supporting material; 147.334 kg garbage; 2769.17 kmtransportation; 3094.3 kg emissions; and 2715.45 ha biodiversity.The result of the GPI calculation was 1.956.
The increase in the cultivation of natural rubber favors thescenario of combined strategy of the use of degradable polybag,lump utilization and substitution of 50% with the use of fertilizerand biological fertilizer application and replanting activities ofsemi-intensive production plants. The chosen scenario increasedthe productivity of the cultivation process as much as two-digitindex from 1.96 to 3.96. Furthermore, based on the chosen sce-nario, a future green value streammap was constructed with sevengreen waste profile as 1.830 KWh of energy consumption, water
Factor
Alternative
Productivity Improvement Strategy Selec
Demand Level(0.056)
Raw and Supporting Materials Characteristics
(0.326)
HR compete
(0.287
Focus
Actor
Goal
Executive Officers(0.256)
Government(0.161)
Univ
Maximize profit(0.731)
Production process optimization
(0.309)
Raw Material Control (0.213)
Fig. 9. AHP structure for productivity impr
Please cite this article in press as: Marimin, et al., Value chain analysis for gcase study, Journal of Cleaner Production (2014), http://dx.doi.org/10.101
consumption of 900 m3; supporting material as much as 69.851 kg;14.400 kg garbage; 2769.17 km transportation; 3094.3 kg emis-sions; 2715.45 ha biodiversity.
Green productivity level conditions early in the productionprocess of RSS and BC were 0.269 and 1.089 respectively, due to thesuboptimal use of resources, primarily water consumption. The useof a large amount of water can lead to discharge of liquid waste inlarge amount. Therefore, four alternative strategies were chosenbased on the opinions of experts in the field of natural rubber; theyare: (1) the optimization of the production process, (2) the controlcharacteristics of rawmaterials, (3) auxiliarymaterials substitution,and (4) re-use of water (reuse) as the best strategy. Application ofthe selected scenario improved Green Productivity for the pro-duction of RSS to 0.690 and increased the productivity of green tobrown crepe to 3.889. The implemented scenario could increase theGPI of RSS and BC from 0.269 to 1.148 and from 2.565 to 3.571,respectively.
5.2. Recommendations
Further research is needed on the analysis of application sce-nario and the material characteristics of the existing strategies for
tion of Natural Rubber Cultivation in based on GP (1.000)
nce)
Selling price
(0.106)
Production Cost
(0.137)
Environmental Related Government Policy
(0.088)
ersities and Research Institution (0.070)
Downstream industry(0.512)
Minimize Environmental Impact(0.269)
Raw material substitution(0.111)
Water reuse (0.366)
ovement in natural rubber processing.
reen productivity improvement in the natural rubber supply chain: a6/j.jclepro.2014.01.098

SEEDSUPPLIER
PROCESSING PLANT
ADMIN & SUPPORT
Transport : 69.17 km
Emission : 37 kg
Energy : 1,830 KWhWater : 900 m3
Materials : 69,851 kgGarbage : 14,400 kgTransportation : 2,769.17 kmEmisi : 3,094.3 kgBiodiversity : 2,715.45 Ha
Sorting Station
(daily)
Energy : 0 KWh
Water : 0 m
Materials : 0 kg
Garbage : 3,000 kg
Transportation : 0 km
Emission: 0 kg
Harvesting(daily)
Energy : 0 KWh
Water : 0 m
Materials : 0 kg
Garbage : 14,400 kg
Transportation : 0 km
Emission: 0 kg
PP maintenance
(6-30 years)
Energy : 0 KWh
Water : 0 m
Materials : 40,531.3 kg
Garbage : 0 kg
Transportation : 0 km
Emission : 0 kg
NPP maintenance
(1-5 years)
Energy : 0 KWh
Water : 0 m
Materials : 28,074.85 kg
Garbage : 0 kg
Transportation : 0 km
Emission: 0 kg
Nursery
(0-1 year)
Energy : 1,830 KWh
Water : 900 m
Materials : 1,244.85kg
Garbage : 0 kg
Transportation : 0 km
Emission : 1,631 kg
Latex production Average: 428,557
liter/month
Seed needed1 million/year
Shipping
Transport : 2,700 km
Emission : 1,426.30 kg
Fig. 10. Green value stream map of RSS natural rubber cultivation.
PROCESSING PLANT
CUSTOMER
ADMIN & SUPPORT
XYZ Company
Transport. : -Emission : -
Transport. : -Emissions : -Energy : 12,699.9Kwh/Month
Water : 388.742 m /Month
Materials : 1,125 Liter/Month
Garbage :19.56 tonnes/month
Transport. :-
Emission :1.8876 Tonnes CO /Day
Biodiversity:
Receiving St (Latex) (daily)
C/T : 1 hourC/O : 0 hour
Energy : 3.33 Kwh
Water : 0 Liter
Materials : 0
Garbage : 0 Kg
Transportation: 0 Km
Emission : 2.967 x 10Ton CO /Day
Dilution and Coagulation station (daily)
C/T : 4 hourC/O : 1 hour
Energy : 200 Kwh
Water : 8,549.71 Liter
Materials : 45 Liter
Garbage : 0 Kg
Transportation: 0 Km
Emission : 0.7128 Ton CO /Day
Milling station(daily)
C/T : 5 hourC/O : 2 hour
Energy : 12.143 Kwh
Water : 500 Liter
Materials : 0
Garbage : 0 Kg
Transportation: 0 Km
Emission: 0.054 Ton CO /Day
Smoking station(daily)
C/T : 120 hourC/O : 2 hour
Energy : 0 Kwh
Water : 0 Liter
Materials : 0
Garbage : 0.652 Ton
Transportation: 0 Km
Emission : 0.1473 ton NO , SO
Sorting Station(daily)
C/T : 6 hourC/O : 1 hour
Energy : 0 Kwh
Water : 0 Liter
Materials : 0
Garbage : 0 Kg
Transportation: 0 Km
Emission : -Biodiversity : -
Packing and Inventory Station (daily)
C/T : 6 hourC/O : 1 hour
Energy : 50 Kwh
Water : 0 Liter
Materials : 0
Garbage : 0 Kg
Transportation: 0 Km
Emission : 0,2673 Ton CO /Day
Demand120 Tonnes/Month
Latex demand Average 14,285.23
Liter/Day
Fig. 11. Green value stream map of RSS production process.
Marimin et al. / Journal of Cleaner Production xxx (2014) 1e1110
Please cite this article in press as: Marimin, et al., Value chain analysis for green productivity improvement in the natural rubber supply chain: acase study, Journal of Cleaner Production (2014), http://dx.doi.org/10.1016/j.jclepro.2014.01.098

Marimin et al. / Journal of Cleaner Production xxx (2014) 1e11 11
increasing awareness of any environmental impact caused by theuse of materials. There is also a need for the implementation offarm management activities in order to minimize environmentalimpact, and an integrated measurement system that can measurethe level of productivity of the farming activities as well as naturalrubber production process, so that the improvement can be iden-tified and simulated better, organized, and sustainable in practice.
Furthermore, a detailed case study should also be done ingovernment-owned rubber enteprises as well as in the smallholderrubber enteprises, and the results compared accordingly.
Acknowledgments
The research leading to this publication was partly funded byDirectorate General of Higher Education, Ministry of Education andCulture, Republic of Indonesia, under National Strategic ResearchGrant fiscal year 2012 and 2013. The authors would like also toconvey their appreciation to the editors and anonymous reviewersfor their valuable comments and suggestions, and to the key per-sons of companies and institutions who provided data and infor-mation for the case study in this analysis.
References
Arifin, B.A., 2005. Supply chain of natural rubber in Indonesia. J. Manaj. Agribisnis 2(1), 1e16.
Asian Productivity Organization [APO], 2006. Handbook on Green Productivity.Asian Productivity Organization.
Basyaruddin, D., 2009. Development policy of natural rubber seed industry (InIndonesian). In: Prosiding Lokakarya Nasional Pemuliaan Tanaman Karet,Batam, August 2009. Pusat Penelitian Karet Lembaga Riset PerkebunanIndonesia, Bogor, pp. 6e14.
Boerhendhy, I., Nancy, C., Amypalupy, K., August 2009. Development strategy ofsuperior grade rubber clone (In Indonesian). In: Prosiding Lokakarya NasionalPemuliaan Tanaman Karet, Batam. Pusat Penelitian Karet Lembaga Riset Per-kebunan Indonesia, Bogor, pp. 157e167.
Damardjati, D.S., Jacob, J., 2009. Present trends and outlook for global supply ofnatural rubber (In Indonesian). In: Prosiding Lokakarya Nasional PemuliaanTanaman Karet, Batam, August 2009. Pusat Penelitian Karet Lembaga RisetPerkebunan Indonesia, Bogor, pp. 18e30.
Dues, C.M., Kim, H.T., Lim, M., 2013. Green as the new lean: how to use leanpractices as a catalyst to greening your supply chain. J. Clean. Prod. 40(February), 93e100.
Esty, Daniel C., Levy, Marc, Srebotnjak, Tanja, Sherbinin, Alexander de, 2005.Environmental Sustainability Index: Benchmarking National EnvironmentalStewardship. Yale Center for Environmental Law & Policy, New Haven.
Fliedner, G., Majeske, K., 2010. Sustainability: the new lean frontier. Prod. InventoryManag. J. 46 (1), 6e13.
Gandhi, M., Selladurai, V., Santhi, P., 2006. Green productivity indexing: a practicalstep towards integrating environmental protection into corporate performance.Int. J. Prod. Perform. Manag. 55 (7), 594e606.
Hande, A., Ceylan, C., 2011. Value chain analysis using value stream mapping: whitegood industry application. J. Ind. Eng. Manag. 12 (9), 852e857.
Please cite this article in press as: Marimin, et al., Value chain analysis for gcase study, Journal of Cleaner Production (2014), http://dx.doi.org/10.101
Hickling, P.D., Munthe, M., Hasibuan, S.E., 2009. Evaluation of clone variability in PTbridgestone sumatra rubber estate (In Indonesian). In: Prosiding LokakaryaNasional Pemuliaan Tanaman Karet, Batam, August 2009. Pusat Penelitian KaretLembaga Riset Perkebunan Indonesia, Bogor, pp. 118e122.
Hines, P., Taylor, D., 2000. Going Lean. Lean Enterprise Research Center. CardiffBusiness School, UK.
Hur, T., Kim, I., Yamamoto, R., 2004. Measurement of green productivity and itsimprovement. J. Clean. Prod. 12 (7), 673e683.
Jones, D.T., Hines, P., 2004. Lean logistics. Int. J. Phys. Distrib. Logist. Manag. 12 (4),235e246.
Lasa, I.S., Laburu, C.O., Vila, R.C., 2008. An evaluation of the value stream mappingtool. Bus. Process Manag. J. 14 (1), 39e52.
Maarif, M.S., Somamiharja, A., 2000. Productivity improvement strategy (In Indo-nesian). J. Ilmu-ilmu Pertan. Indones. 9 (2), 62e76.
Marimin, Umano, M., Hatono, I., Tamura, H., 1997. Non-numeric method for pair-wise fuzzy group decision analysi. J. Intell. Fuzzy Syst. 5 (3), 257e269.
Marimin, 2004. Teknik dan Aplikasi Pengambilan Keputusan Kriteria Majemuk(Technique and Application of Multi-criteria Decision Making). PT. GramediaWidiasarana Indonesia, Jakarta.
Ministry of Agriculture The Republic of Indonesia, 2012. Technical Manual forRubber Post-harvest Activities Improvement (Pedoman Teknis Kegiatan Pen-ingkatan Penanganan Pascapanen Tanaman Karet) (Jakarta. Indonesia).
Mohammadi, M., Man, H.C., Hassan, M.A., Yee, P.L., 2011. Treatment of wastewaterfrom rubber industry in Malaysia. Afr. J. Biotechnol. 9 (38), 6233e6243.
Muluk, C., 2009. Micro-cutting technology development for propagation andplanting material in PTP Nusantara III (In Indonesian). In: Prosiding LokakaryaNasional Pemuliaan Tanaman Karet. Batam, August 2009. Pusat Penelitian KaretLembaga Riset Perkebunan Indonesia, Bogor, pp. 350e355.
Nielsen, A., 2008. Getting Started with Value Stream Mapping. Gardiner NielsenAssociates Inc.
Nugroho, P., Istianto, P., 2009. Natural rubber estate land preparation requirement.In: Prosiding Lokakarya Nasional Pemuliaan Tanaman Karet, Batam, August2009. Pusat Penelitian Karet Lembaga Riset Perkebunan Indonesia, Bogor,pp. 139e149 (in Indonesian).
Peramune, M.R., Budiman, A.F.S., 2007. A Value Chain Assesment of the RubberIndustry in Indonesia. USAID Project.
Permadi, G., 2010. Slow expansion. Hevea 2 (1), 14e16.Permadi, P., Ginting, E., 2009. Evaluation of rubber clone variability in PT. Socfin
Indonesia (In Indonesian). In: Prosiding Lokakarya Nasional Pemuliaan Tana-man Karet, Batam, August 2009. Pusat Penelitian Karet Lembaga Riset Perke-bunan Indonesia, Bogor, pp. 110e117.
Rao, P., 2000. Exploring environmental management systems and their impact inSoutheast Asia. Asia Pac. J. Econ. Bus. 4 (2), 74e113.
Saaty, T.L., Vargas, L.G., 1994. Decision Making in Economic, Political, Social andTechnological Environments: the Analytic Hierarchy Process, vol. VII. RWSPublications, Pittsburg, PA, USA.
Singh, R., Kumar, S., Sharma, S., 2011. Assessment of toxicity of chemicals in workersor rubber industry. J. Pharm. Res. 4 (9), 3229e3231.
Sundiandi, Sihombing, J.H., Siagian, N., Karyudi, 2009. Efforts to accelerate pre-productive rubber plant in PTP Nusantara III (In Indonesian). In: ProsidingLokakarya Nasional Pemuliaan Tanaman Karet, Batam, August 2009. PusatPenelitian Karet Lembaga Riset Perkebunan Indonesia, Bogor, pp. 123e138.
Tekasakul, P., Tekasakul, S., 2006. Environmental problems related to natural rubberproduction in Thailand. J. Aerosol. Res. 21 (2), 121e129.
Tuttle, T., Heap, J., 2008. Green productivity: moving the agenda. Int. J. Prod.Perform. Manag. 57 (1), 93e106.
Wills, B., 2009. Green Intentions: Creating a Green Value Stream to Compete andWin. Productivity Press, New York.
Zachariah, O., Patrick, M., 2011. The value chain of rubber wood industry in Kerala:relative share of various actors. Asia Pac. J. Res. Bus. Manag. 2 (6), 77e86.
reen productivity improvement in the natural rubber supply chain: a6/j.jclepro.2014.01.098