value chain dynamics - mit opencourseware · pdf filevalue chain dynamics: 1 ... disruptive...
TRANSCRIPT
1 Value Chain Dynamics:Business and Supply ChainBusiness and Supply Chain
Strategy iin a FFast-ClClockkspeed W d Worldt ld
Professor Charles FineMMassachhusetts IInstiitute off T Techhnollogy
Sloan School of ManagementCambridge, Massachusetts 02142g ,
September 2010
-
-
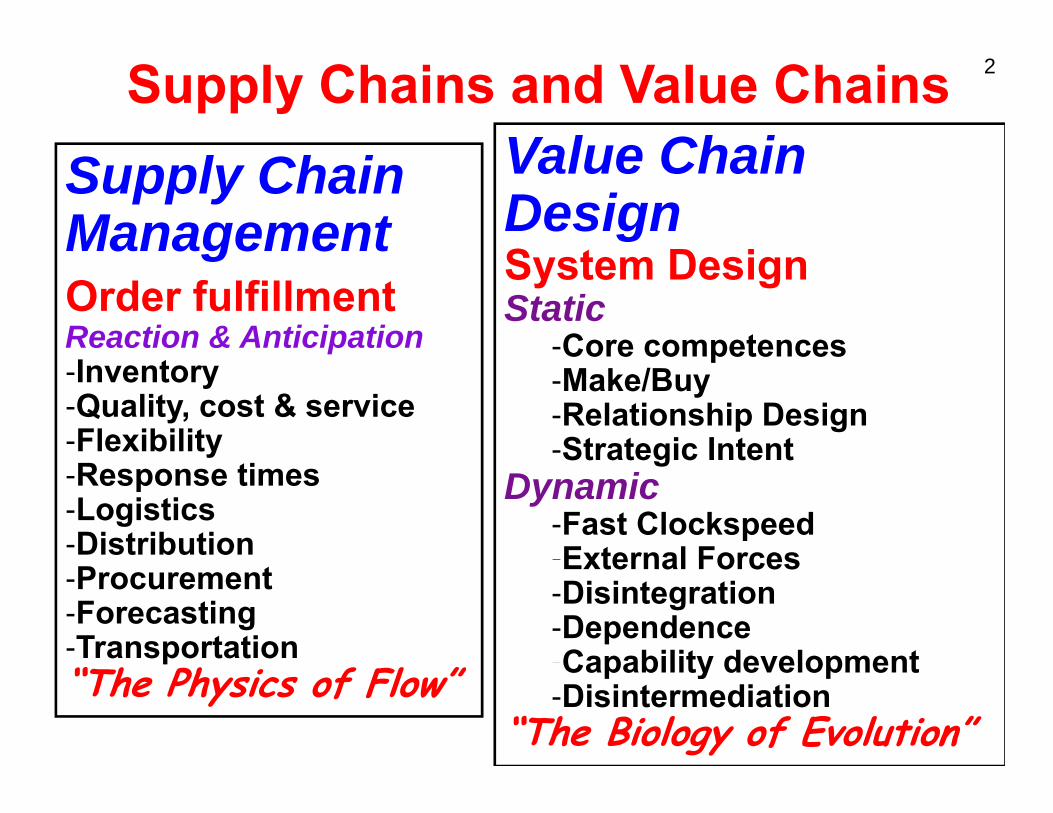
2 Supply Chains and Value Chains Supply ChainManaggementOrder fulfillment Reaction & Anticipation -Inventory -Quality, cost & service -Flexibility -Response times -Logistics -Distribution -Procurement -Forecasting -Transpportation “The Physics of Flow”
Value ChainValue Chain DesignS t D iSystem DesignStatic
-Core competences Core competences-Make/Buy-Relationship Design-Strategic IntentStrategic Intent
Dynamic -Fast Clockspeed-External ForcesExternal Forces -Disintegration -Dependence -Capability development Capability development -Disintermediation
“The Biology of Evolution”
Voice of theCustomer
3
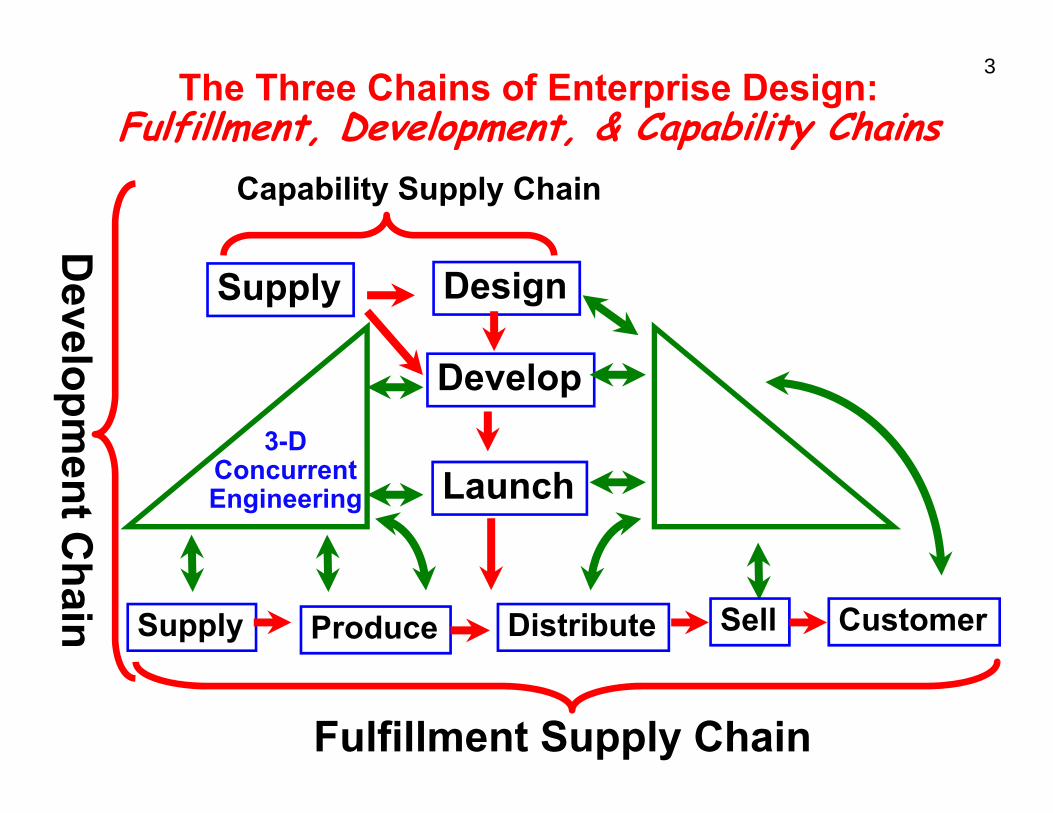
Developm
eent Chain
DesignSupply
Develop 3-D
LaunchConcurrent Engineering
Supply Produce Distribute Sell Customer
The Three Chains of Enterprise Design:Fulfillment, Development, & Capability Chains
Capability Supply Chain
Fulfillment Supply Chain
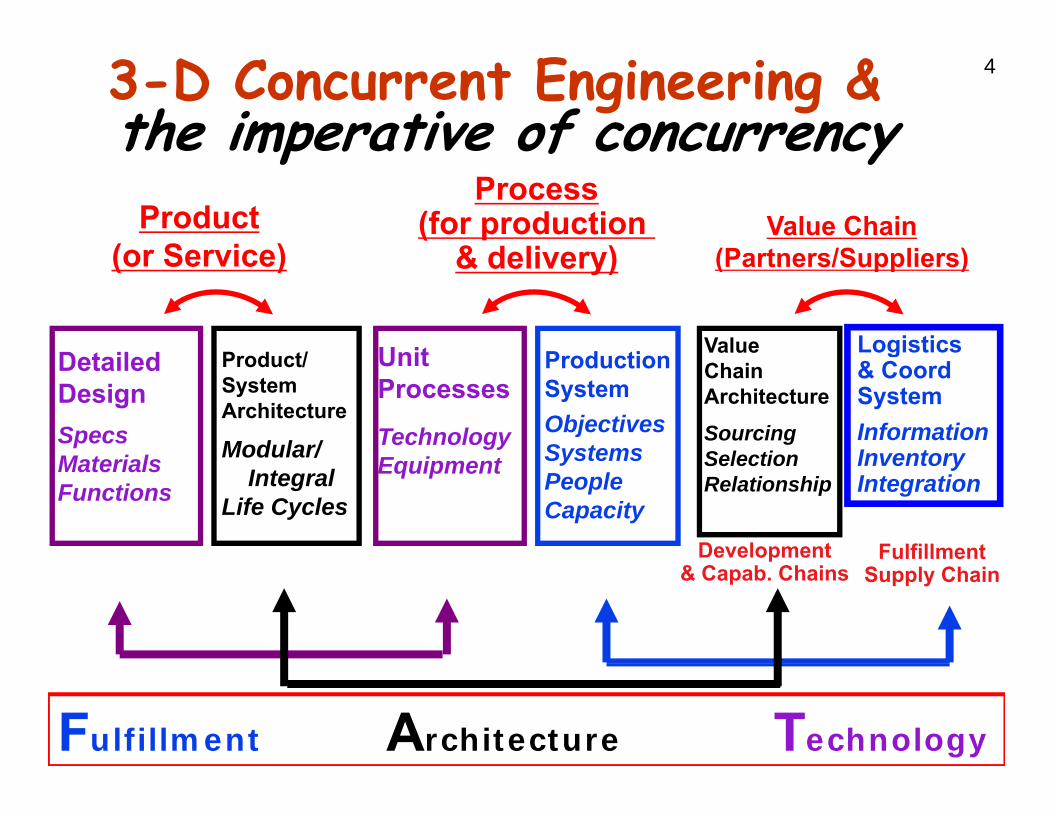
4 3-D Concurrent Engineering & the imperative of concurrencythe imperative of concurrency
Process (for production Value Chain Product
(or Service)(or Service) & delivery)& delivery) (Partners/S ppliers)(Partners/Suppliers)
D t il dDetailed Design Specs M t i lMaterials Functions
P d t/ Product/ System Architecture
Modular/ Integral
Life Cycles
UnitUnit Processes
Technology E i tEquipment
P d ti Production System Objectives SystemsSystems People Capacity
Value Logisticsg & Coord System Information InventoryInventory Integration
Chain Architecture Sourcing SelectionSelection Relationship
Developpment& Capab. Chains
FulfillmentSupply Chain
Fulfillment Architecture Technology
5
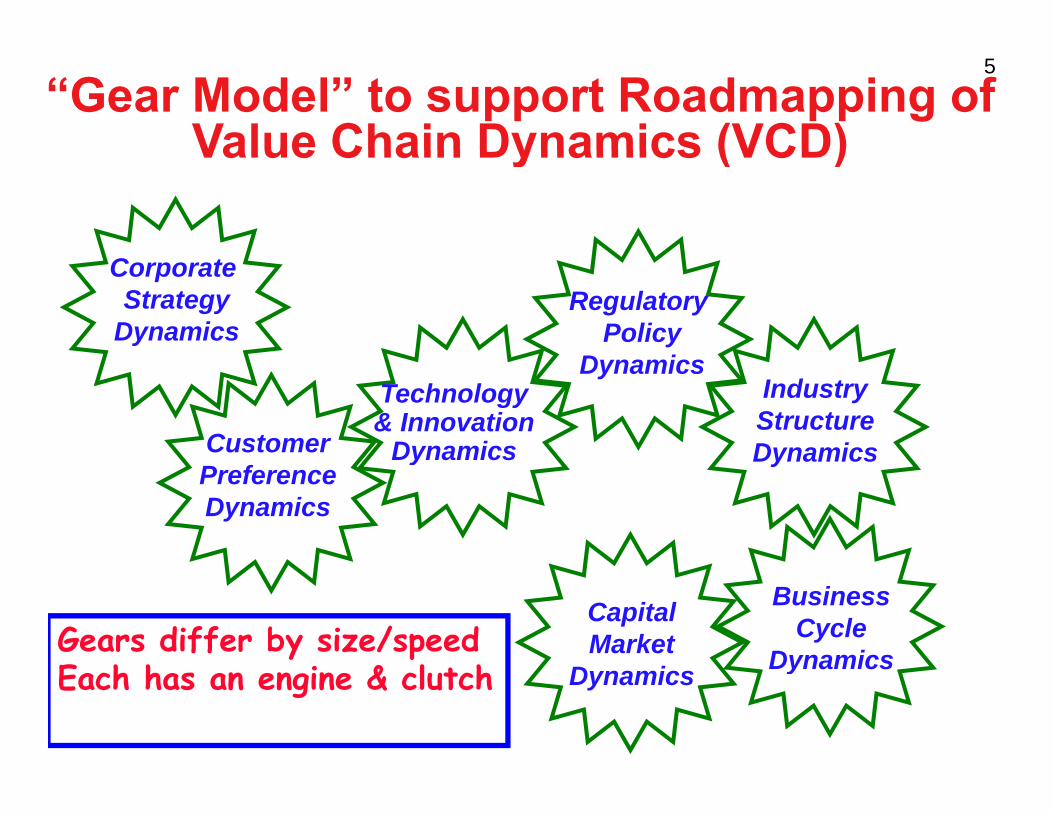
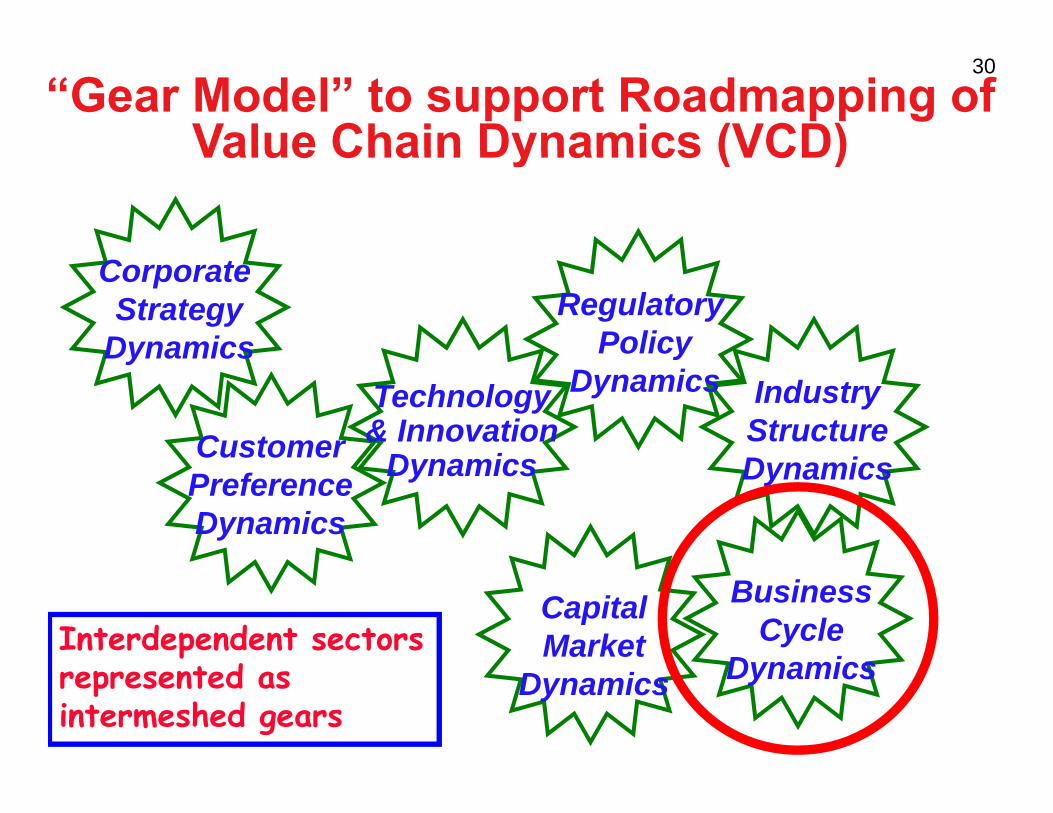
“Gear Model” to support Roadmapping ofValue Chain Dynamics (VCD)Value Chain Dynamics (VCD)
Regulatory Policy
D i
Corporate Strategy
Dynamics Dynamics
Industry Structure DynamicsCustomer
Technology& Innovation
Dynamics DynamicsPreference Dynamics
Dynamics
Business Cycle
Dynamics
Capital MarketGears differ by size/speed DynamicsDynamicsEach has an engine & clutch
--
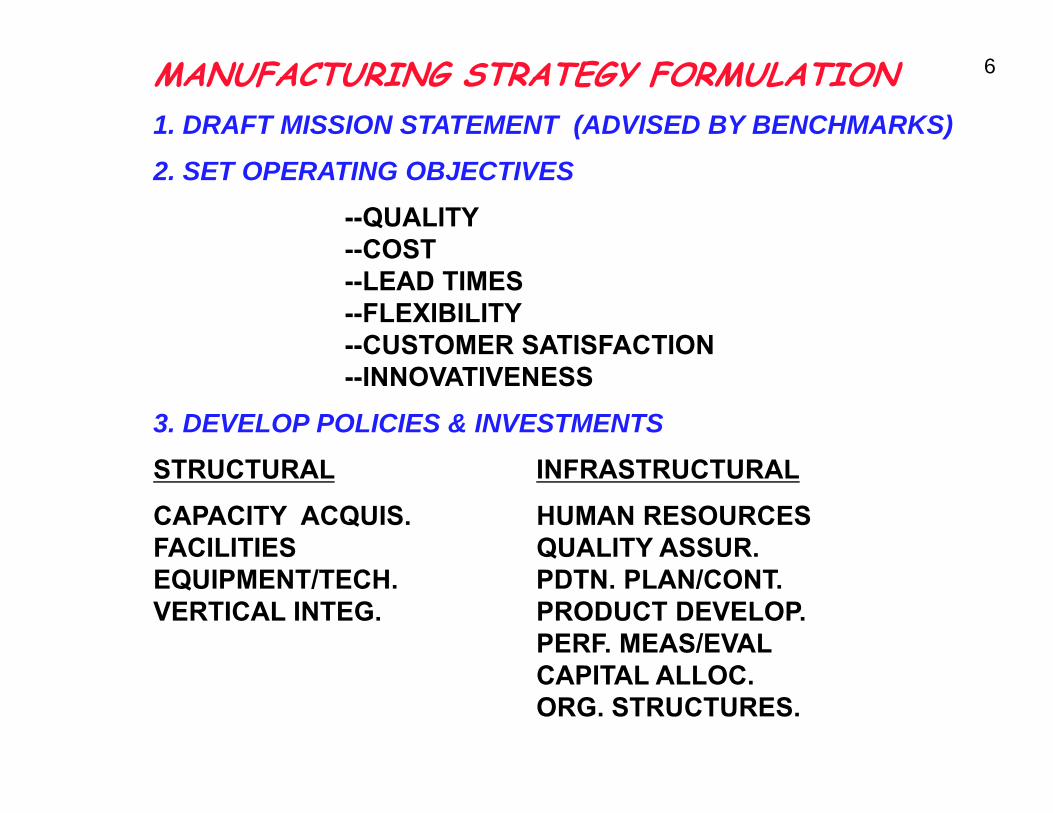
6 MANUFACTURING STRATEGY FORMULATION 1. DRAFT MISSION STATEMENT (ADVISED BY BENCHMARKS)
2. SET OPERATING OBJECTIVES
--QUALITY--COSTCOST --LEAD TIMES --FLEXIBILITY --CUSTOMER SATISFACTION --INNOVATIVENESS
3. DEVELOP POLICIES & INVESTMENTS
STRUCTURAL INFRASTRUCTURAL
CAPACITY ACQUIS. HUMAN RESOURCES FACILITIES QUALITY ASSUR. EQUIPMENT/TECH. PDTN. PLAN/CONT. VERTICAL INTEG. PRODUCT DEVELOP.
PERF. MEAS/EVAL CAPITAL ALLOC. ORG. STRUCTURES.
t t
•
7
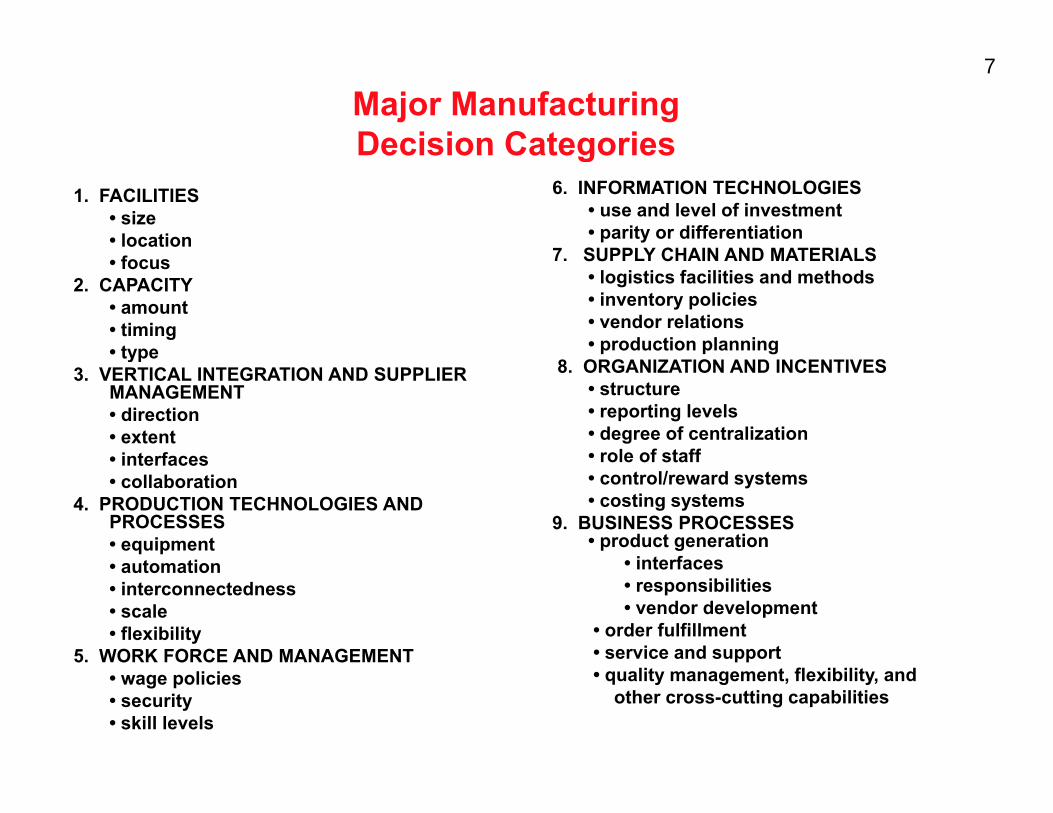
Major Manufacturing Decision CategoriesDecision Categories
1. FACILITIES • size • location • focus
2. CAPACITY • amount • timing • type type
3. VERTICAL INTEGRATION AND SUPPLIER MANAGEMENT • direction • extent • interfaces • interfaces • collaboration
4. PRODUCTION TECHNOLOGIES AND PROCESSES • equipment • automatiion • interconnectedness • scale • flexibility
5. WORK FORCE AND MANAGEMENT • wage policies • security • skill levels
6. INFORMATION TECHNOLOGIES • use and level of investment • parity or differentiation
77. SUPPLY CHAIN AND MATERIALS SUPPLY CHAIN AND MATERIALS • logistics facilities and methods • inventory policies • vendor relations • production planning
8. ORGANIZATION AND INCENTIVES • structure • reporting levels • degree of centralization • role of staff role of staff • control/reward systems • costing systems
9. BUSINESS PROCESSES • product generation
• interfaces • interfaces • responsibilities • vendor development
• order fulfillment• service and support • quality management, flexibility, and
other cross-cutting capabilities
-
A UL URE OF ON INUOUS RO ESS IM ROVEMEN
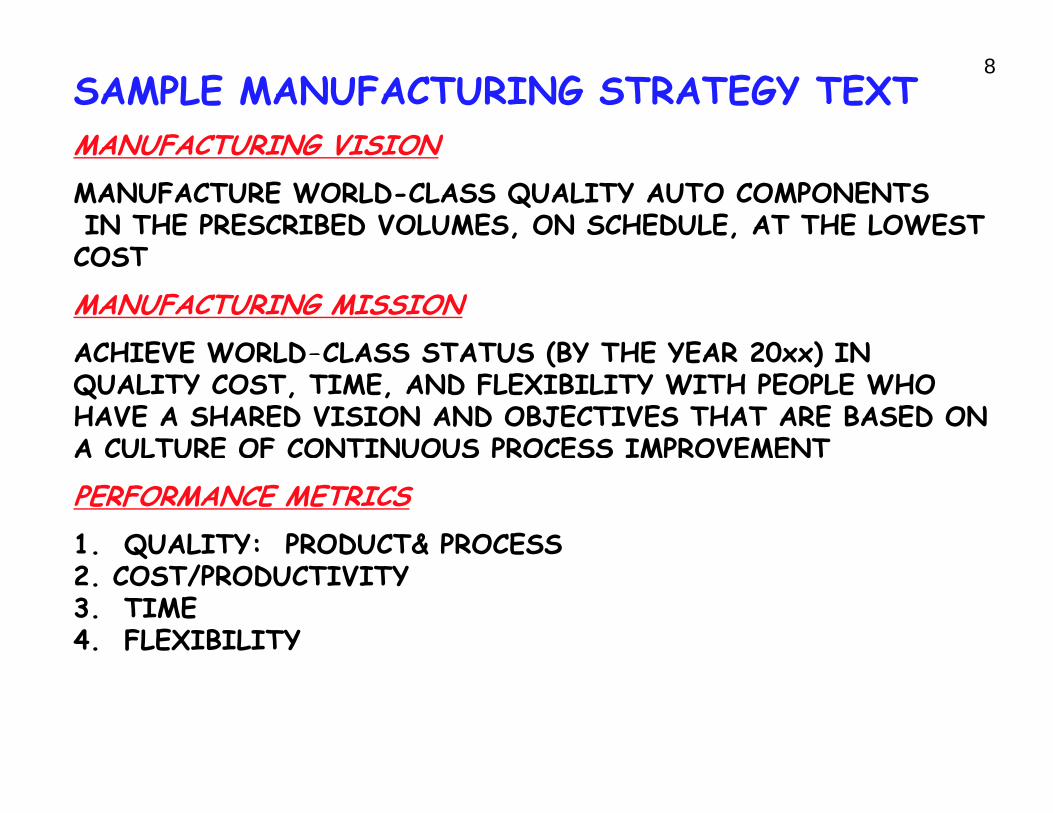
8 SAMPLE MANUFACTURING STRATEGY TEXT MANUFACTURING VISIONMANUFACTURING VISION MANUFACTURE WORLD-CLASS QUALITY AUTO COMPONENTS IN THE PRESCRIBED VOLUMES, ON SCHEDULE, AT THE LOWEST COSTCOST
MANUFACTURING MISSION ACHIEVE WORLD-CLASS STATUS (BY THE YEAR 20xx) IN ACHIEVE WORLD CLASS STATUS (BY THE YEAR 20xx) IN QUALITY COST, TIME, AND FLEXIBILITY WITH PEOPLE WHO HAVE A SHARED VISION AND OBJECTIVES THAT ARE BASED ON A CULTURE OF CONTINUOUS PROCESS IMPROVEMENT
PERFORMANCE METRICS 1. QUALITY: PRODUCT& PROCESS 2. COST/PRODUCTIVITY 3. TIME 4. FLEXIBILITY
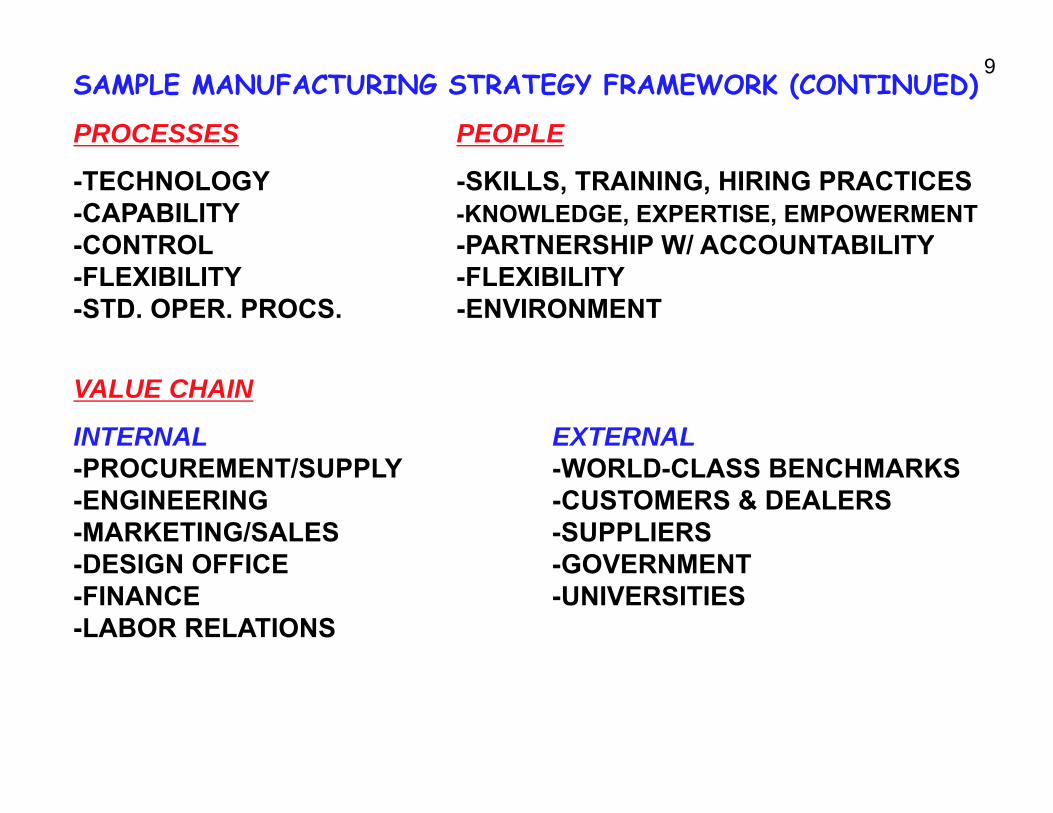
9 SAMPLE MANUFACTURING STRATEGY FRAMEWORK (CONTINUED)
PROCESSES
-TECHNOLOGY -CAPABILITY -CONTROLCONTROL -FLEXIBILITY -STD. OPER. PROCS.
VALUE CHAIN
INTERNAL -PROCUREMENT/SUPPLY -ENGINEERING -MARKETING/SALES DESIGN OFFICE -DESIGN OFFICE
-FINANCE -LABOR RELATIONS
PEOPLE
-SKILLS, TRAINING, HIRING PRACTICES -KNOWLEDGE, EXPERTISE, EMPOWERMENT -PARTNERSHIP W/ ACCOUNTABILITY PARTNERSHIP W/ ACCOUNTABILITY -FLEXIBILITY -ENVIRONMENT
EXTERNAL -WORLD-CLASS BENCHMARKS -CUSTOMERS & DEALERS -SUPPLIERS GOVERNMENT-GOVERNMENT
-UNIVERSITIES
10
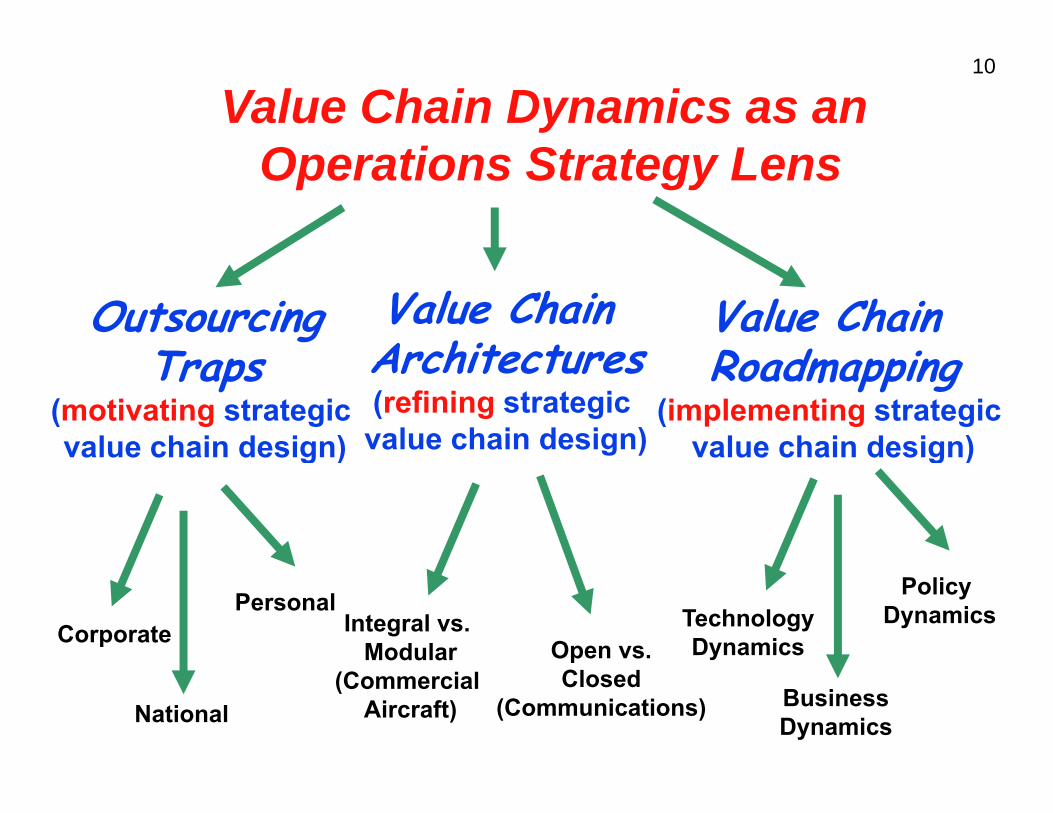
Value Chain Dynamics as an OOperati tions Strattegy LensSt L
Outsourcing Value Chain Value Chain ArchitecturesT Architectures R dRoadmappingTraps i
(motivating strategic (refining strategic (implementing strategic value chain desigg )n) value chain design) value chain design)g )
PolicyPersonal DynamicsTechnology Corporate Integral vs. Modular Open vs. Dynamics
(Commercial Closed Aircraft) (Communications) BusinessNational Dynamics
11
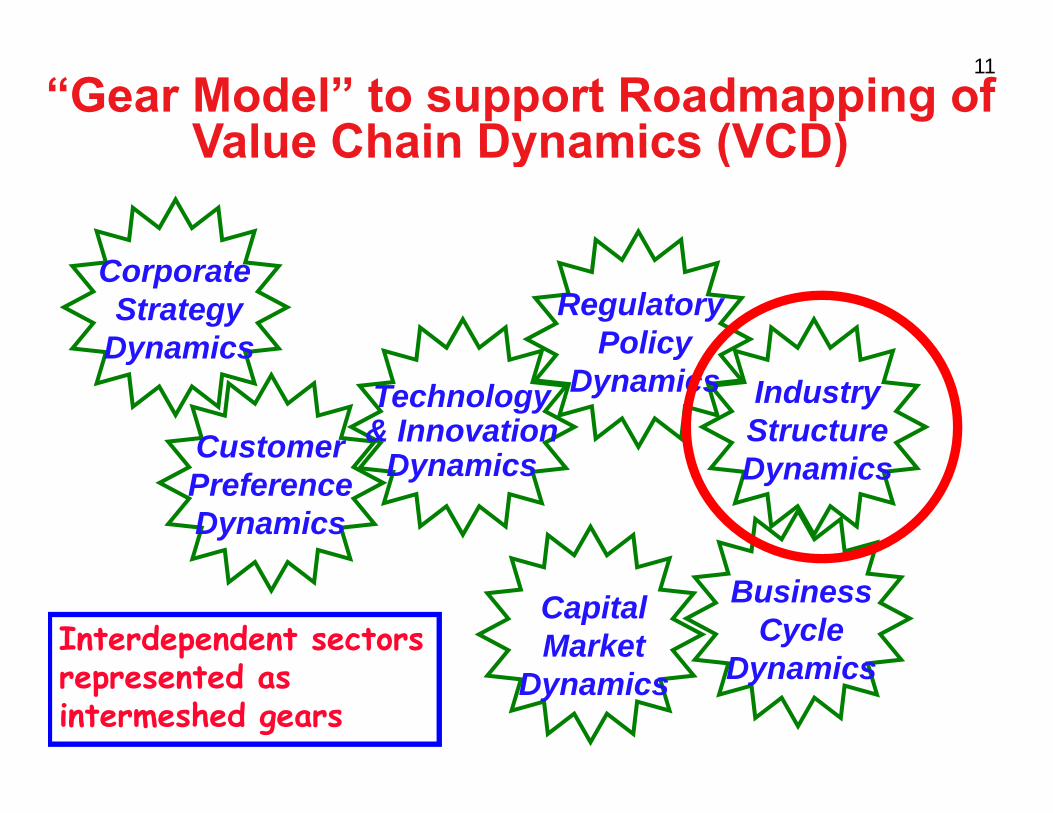
“Gear Model” to support Roadmapping ofValue Chain Dynamics (VCD)Value Chain Dynamics (VCD)
Regulatory Policy
Corporate Strategy
Dynamics yDynamics
DynamicsIndustryStructureD i
CustomerTechnology& Innovation
D i DynamicsPreferenceDynamics
Dynamics
BusinessCycle
Dynamics
CapitalMarketInterdependent sectors
d DynamicsDynamicsrepresented as intermeshed gears
12
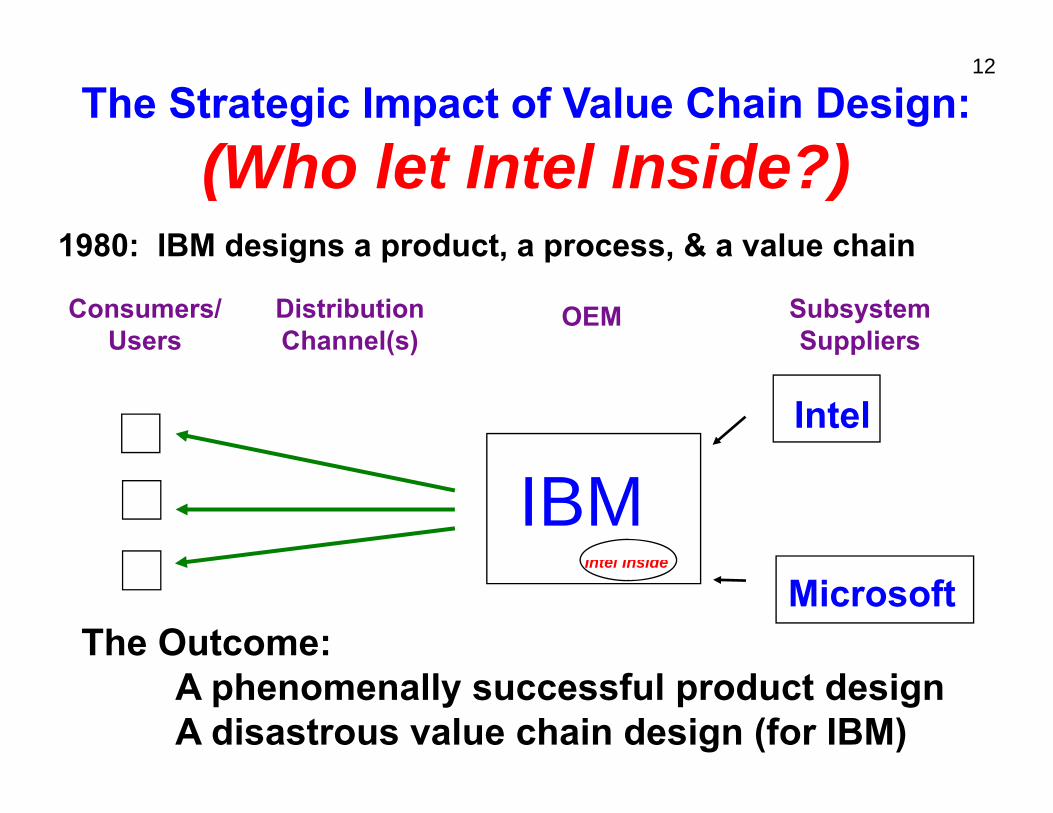
The Strategic Impact of Value Chain Design:(Wh(Who llet Inttel Insid ide?)?)t I l I
1980: IBM designs a product, a process, & a value chain1980: IBM designs a product, a process, & a value chain
Consumers/ Distribution OEM SubsystemUsers Channel(s) Suppliers
IBM Intel Inside Intel Inside
Microsoft
A phenomenally successful product design A disastrous value chain design (for IBM)
Intel
The Outcome:
13
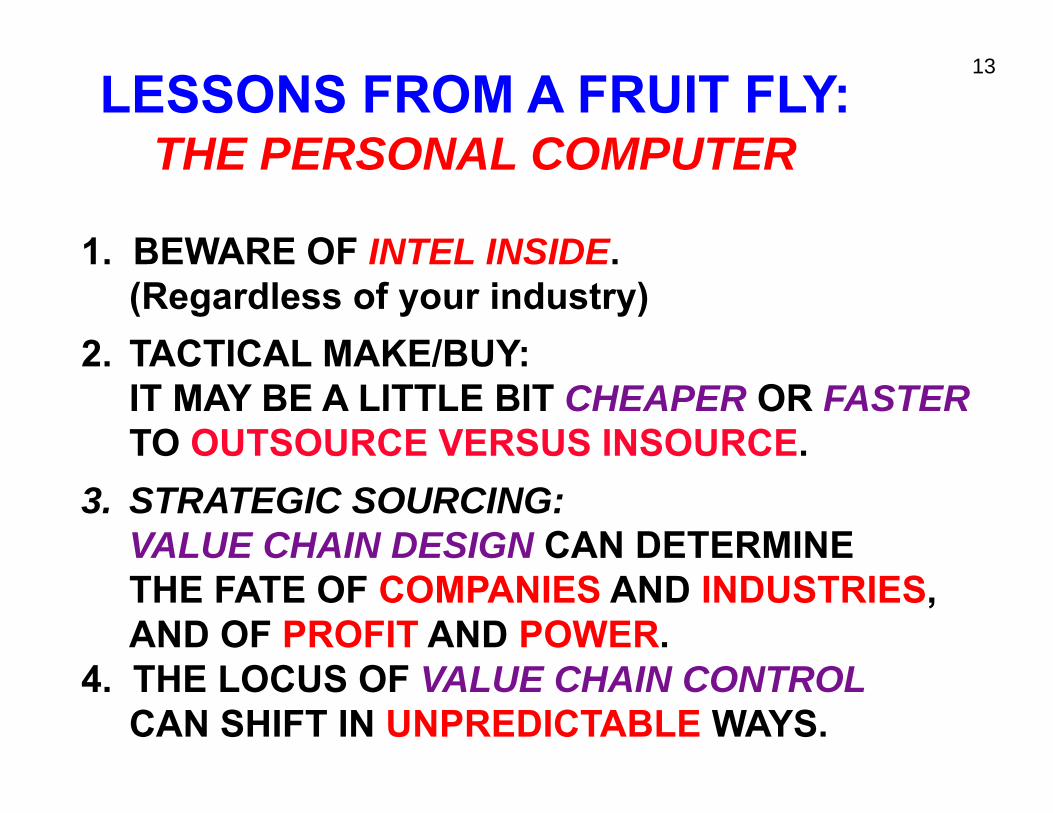
LESSONS FROM A FRUIT FLY: THE PERSONAL COMPUTERTHE PERSONAL COMPUTER
11. BEWARE OF INTEL INSIDE BEWARE OF INTEL INSIDE.(Regardless of your industry)
22. TACTICAL MAKE/BUY: TACTICAL MAKE/BUY:IT MAY BE A LITTLE BIT CHEAPER OR FASTERTO OUTSOURCE VERSUS INSOURCE.
3. STRATEGIC SOURCING: VALUE CHAIN DESIGN CAN DETERMINE THE FATE OF COMPANIES AND INDUSTRIES, AND OF PROFIT AND POWER.
4. THE LOCUS OF VALUE CHAIN CONTROLCAN SHIFT IN UNPREDICTABLE WAYS.
14
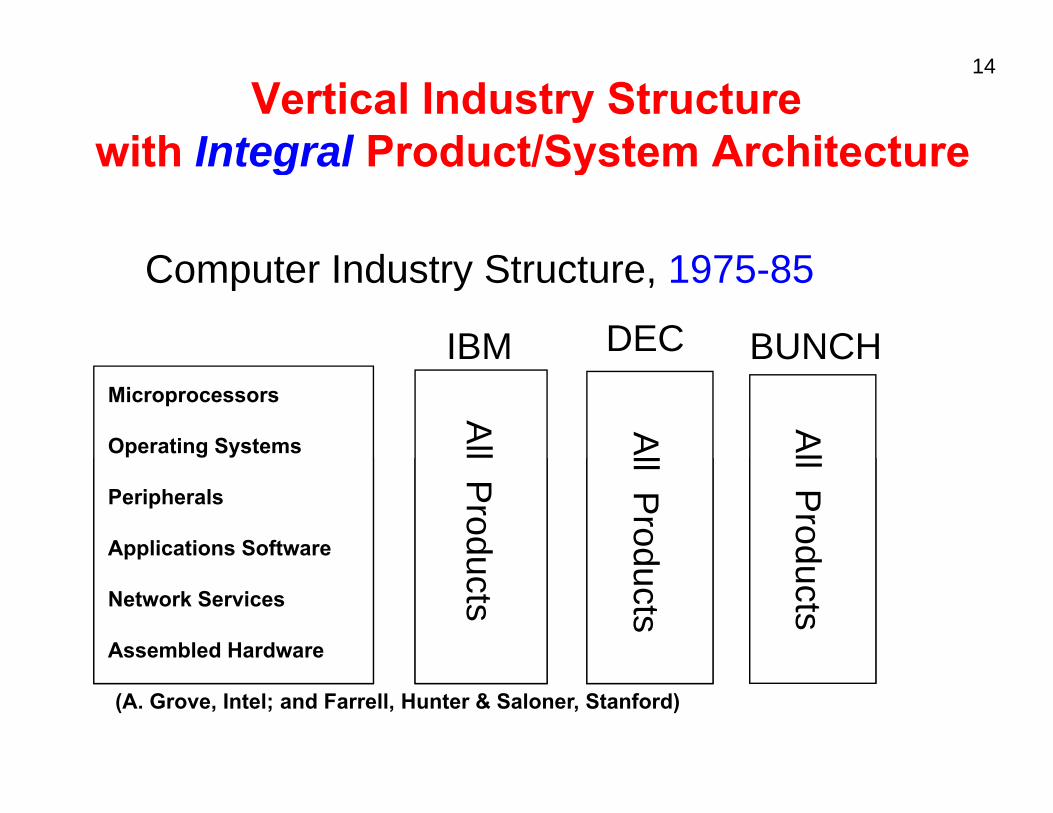
Vertical Industry Structurewith Integral Product/System Architecturewith Integral Product/System Architecture
Computer Industry Structure, 1975-85
IBMIBM DEC BUNCHBUNCH Microprocessors
Operating Systems
All Al
Al
Peripherals
Applications Software P
rodu
ll Prod
ll Prod
Network Services
Assembled Hardware
ucts
ducts
ducts
(A. Grove, Intel; and Farrell, Hunter & Saloner, Stanford)

ac
Intel Mac TI etc
Intel Mac TI etc
etc
etcetc
15 Horizontal Industry Structure
with Modular Product/System Architecturewith Modular Product/System Architecture
Computer Industry Structure, 1985-95
Microprocessors
Operating Systems Microsoft Mac Unix
Intel Moto AMD etc
Peripherals
Applications Software
Unix
HP Seagate etcEpson etc
Microsoft NovellLotus etc Network Services
Assembled Hardware
Microsoft NovellLotus
AOL/Netscape EDS etcMicrosoft
HP D ll tIBMC
etc
HP Dell etcIBMCompaq (A. Grove, Intel; and Farrell, Hunter & Saloner, Stanford)
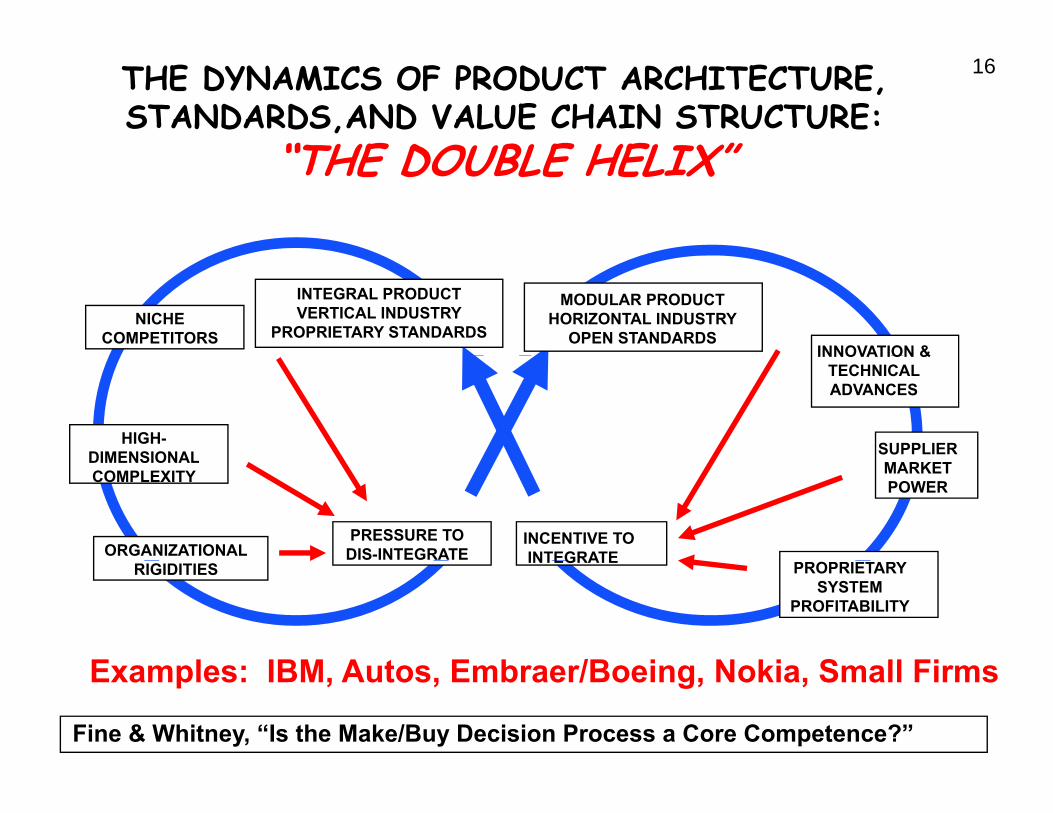
16THE DYNAMICS OF PRODUCT ARCHITECTURE, STANDARDS,AND VALUE CHAIN STRUCTURE:
“THE DOUBLE HELIX”“THE DOUBLE HELIX”
MODULAR PRODUCTHORIZONTAL INDUSTRY
OPEN STANDARDS
INTEGRAL PRODUCTVERTICAL INDUSTRY
PROPRIETARY STANDARDSNICHE
COMPETITORSINNOVATION &
HIGH-DIMENSIONAL SUPPLIER
INNOVATION & TECHNICAL ADVANCES
INCENTIVE TOINTEGRATE
PRESSURE TO DIS-INTEGRATEORGANIZATIONAL
DIMENSIONALCOMPLEXITY MARKET
POWER
INTEGRATERIGIDITIES PROPRIETARY
SYSTEM PROFITABILITY
E l IBM A t E b /B i N ki S ll Fi
Fine & Whitney, “Is the Make/Buy Decision Process a Core Competence?”
Examples: IBM, Autos, Embraer/Boeing, Nokia, Small Firms
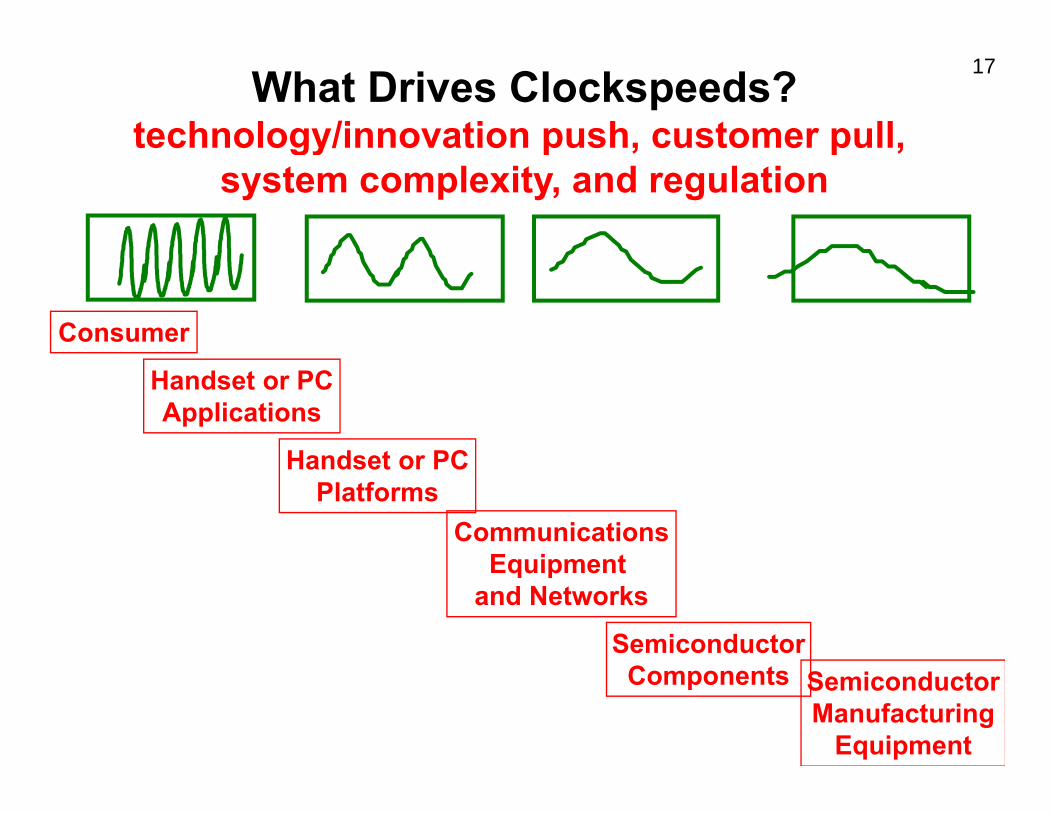
17 What Drives Clockspeeds? technologygy/innovation ppush,, customer ppull,,
system complexity, and regulation
Consumer
Handset or PC Applications
Handset or PC Handset or PC Platforms
Communications EquipmentEquipment
and Networks
Semiconductor Components Semiconductor
Manufacturing Equipment
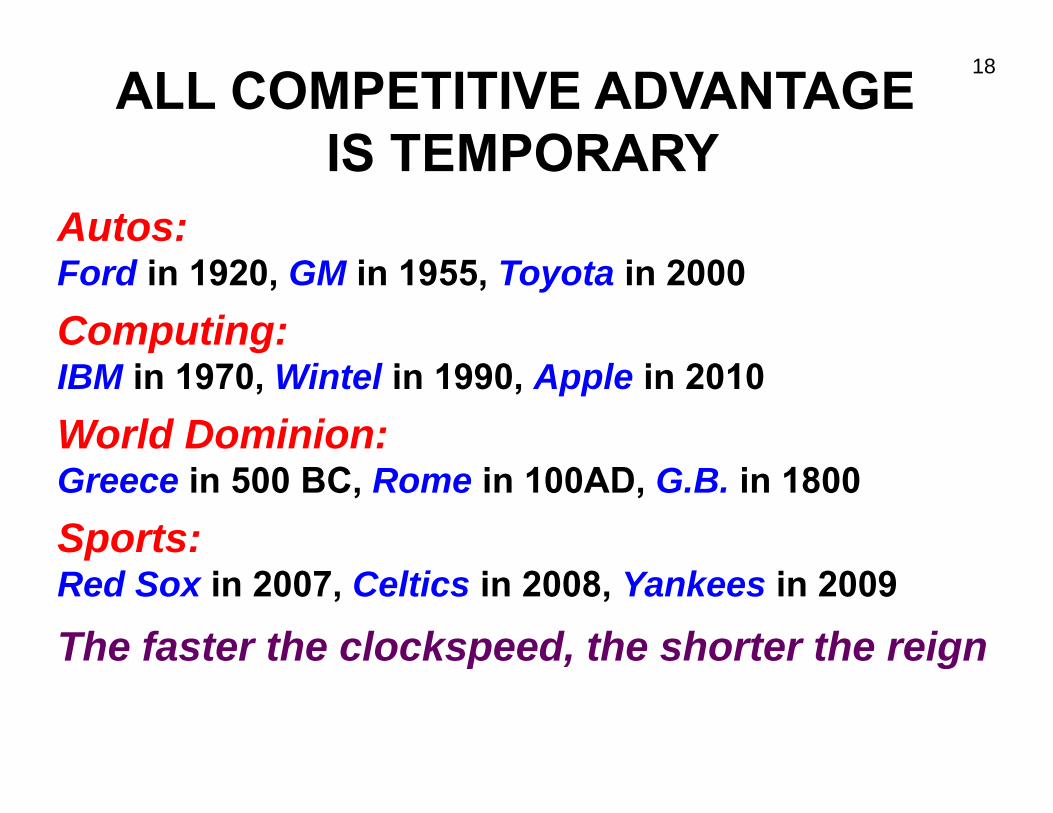
18 ALL COMPETITIVE ADVANTAGE IS TEMPORARYIS TEMPORARY
Autos: Ford in 1920, GM in 1955, Toyota in 2000 Computing: IBM in 1970, Wintel in 1990, Apple in 2010 World Dominion: Greece in 500 BC, Rome in 100AD, G.B. in 1800 Sports: Red Sox in 2007, Celtics in 2008, Yankees in 2009
The faster the clocksppeed,, the shorter the reiggn
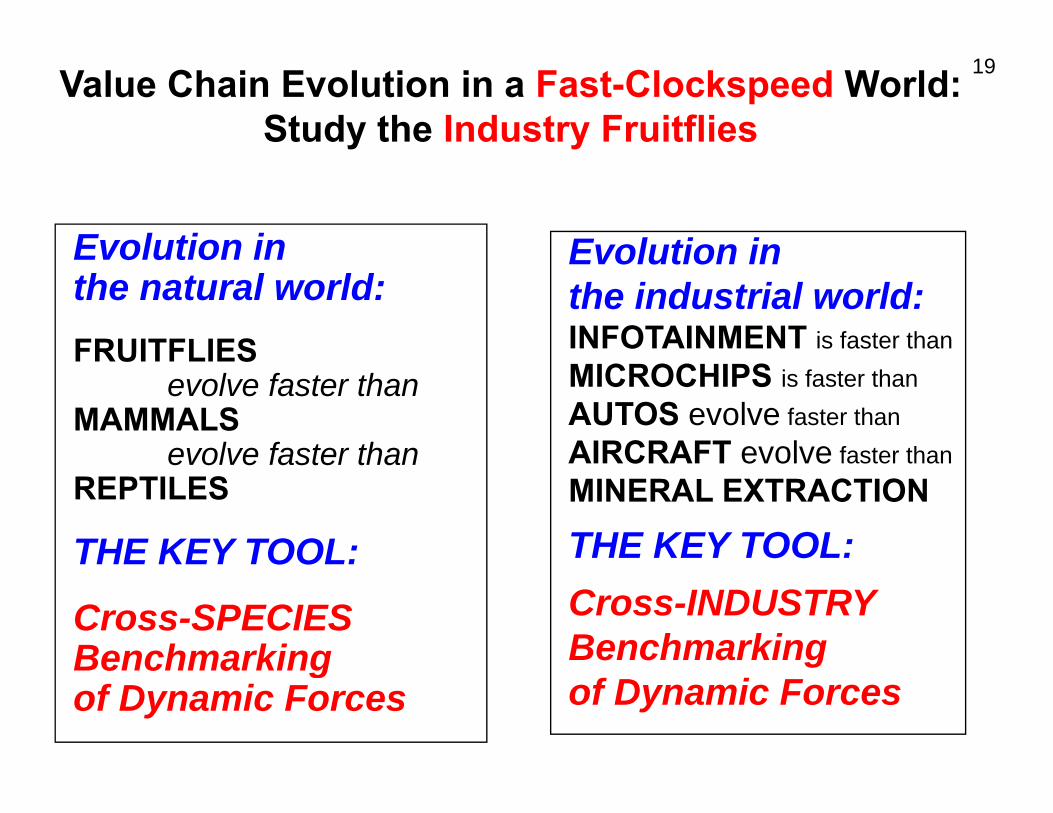
Value Chain Evolution in a Fast-Clockspeed World: 19
Study the Industry Fruitflies
Evolution in Evolution inthe natural world:FRUITFLIESFRUITFLIES
evolve faster than MAMMALS
evolve faster than evolve faster than REPTILES
THE KEY TOOL: THE KEY TOOL:
Cross-SPECIES BenchmarkingBenchmarking of Dynamic Forces
Evolution in Evolution inthe industrial world:INFOTAINMENT is faster than MICROCHIPS is faster than AUTOS evolve faster than AIRCRAFT evolve faster than AIRCRAFT evolve faster than MINERAL EXTRACTION
THE KEY TOOL: Cross-INDUSTRYBenchmarkingg of Dynamic Forces
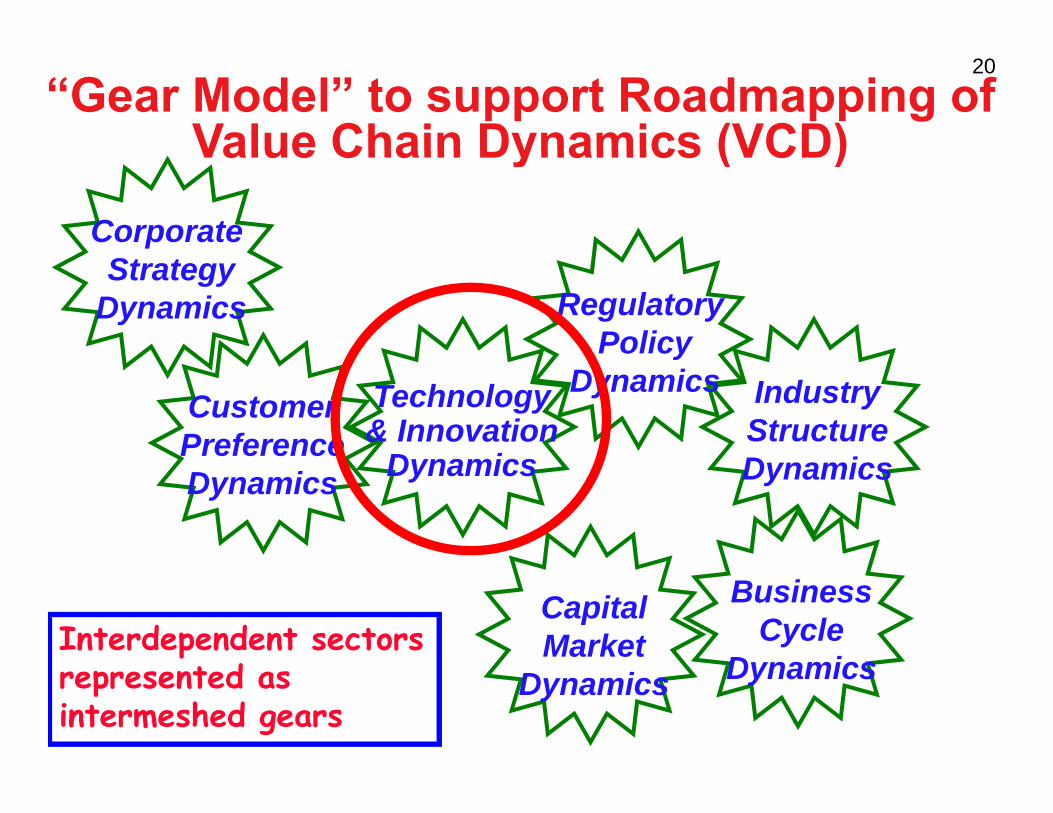
20
“Gear Model” to support Roadmapping ofValue Chain Dynamics (VCD)
Corporate
Value Chain Dynamics (VCD)
Regulatory Policy
StrategyDynamics
yDynamics Industry
StructureD i
CustomerPreference
Technology& Innovation
D i DynamicsDynamics Dynamics
BusinessCycle
Dynamics
CapitalMarketInterdependent sectors
d DynamicsDynamicsrepresented as intermeshed gears
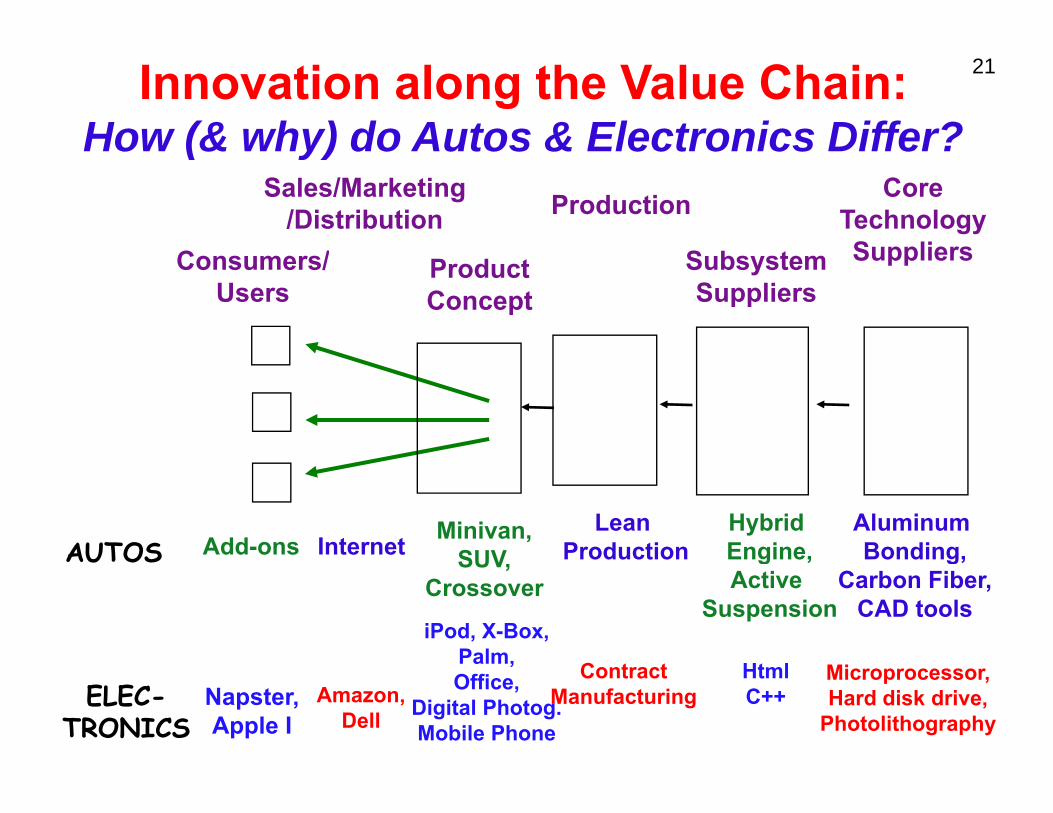
21 Innovation along the Value Chain:How (& why) do Autos & Electronics Differ?How (& why) do Autos & Electronics Differ?
Sales/Marketing /Distribution Production Core
Technology C /Consumers/ Product S b tSubsystem SuppliersSuppliers
Users Concept Suppliers
Minivan, Lean Hybrid Aluminum AUTOS Add-ons Internet SUV, Production Enggine,, Bonding,g,AUTOS SUV
Crossover Active Carbon Fiber, Suspension CAD tools
iPod, X-Box, Palm,Palm,
Digital Photog. C Html
ELEC- Napster, Amazon, Office, Manufacturing C++ Hard disk drive, Contract H l Microprocessor,
TRONICS Apple I Dell Mobile Phone Photolithography
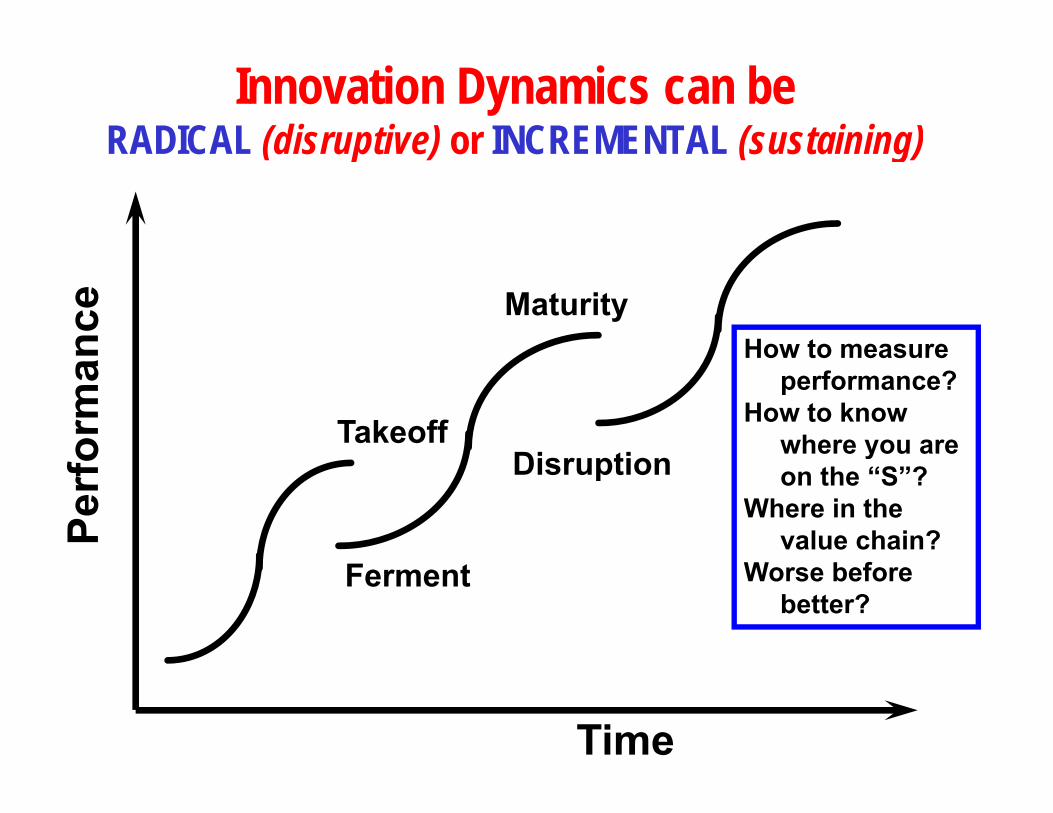
Innovation Dynamics can be RADICAL (disruptive) or INCREMENTAL (sustaining)RADICAL (disruptive) or INCREMENTAL (sustaining)
nce Maturity
How to measure
orm
an
Takeoff Disr ption
How to measure performance?
How to know where you are
Perf
o Disruption y on the “S”?
Where in the value chain?
Ferment Worse before better?
Time
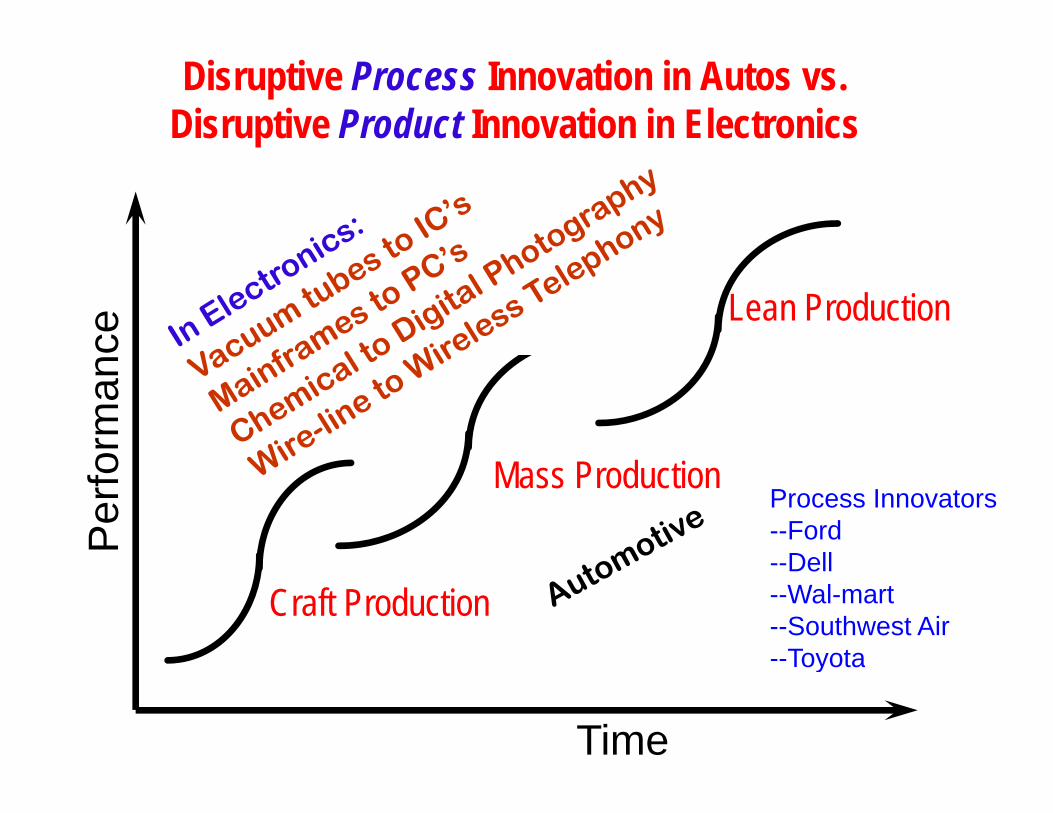
Disruptive Process Innovation in Autos vs. Disruptive Product Innovation in Electronics
ceP
erfoo
rman
Lean Production
Mass Production Process Innovators --Ford
Dell--Dell --Wal-mart Craft Production --Southwest Air --Toyota Toyota
Time
24
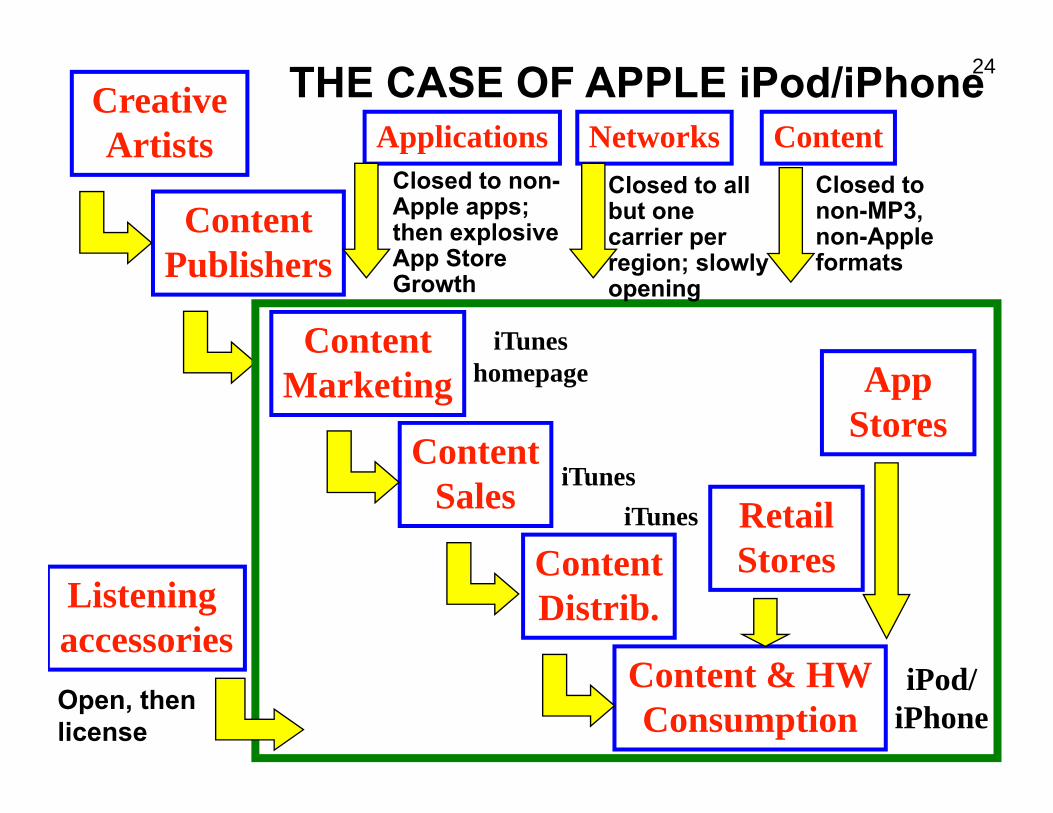
Creative Artists ContentNetworksApplications
THE CASE OF APPLE iPod/iPhoneArtists
ContentP bli h
Closed to non-MP3, non-Apple f
Closed to all but one carrier per
ppClosed to non-Apple apps; then explosive A St
Content
Publishers
iTunes
formatsregion; slowly opening
App Store Growth
Marketing
Content
homepage App Stores
Content
ContentSales iTunes
iTunesRetail StoresContent
Distrib.
C & HW
Listening accessories
Stores
Content & HWConsumption
iPod/ iPhoneOpen, then
license
25
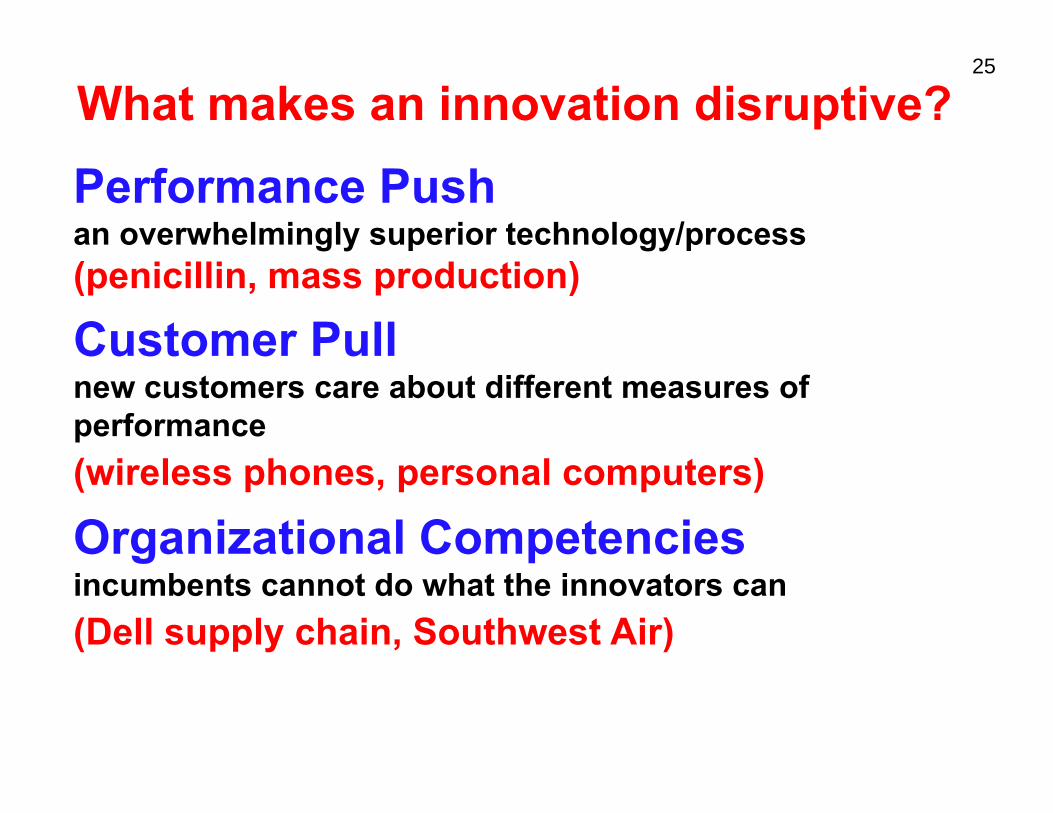
What makes an innovation disruptive? Performance Push an overwhelmingly superior technology/process (penicillin, mass production)
Customer PullCustomer Pull new customers care about different measures of performance ( )(wireless phones, personal computers)
Orgganizational Comppetencies incumbents cannot do what the innovators can (Dell supply chain, Southwest Air)
26
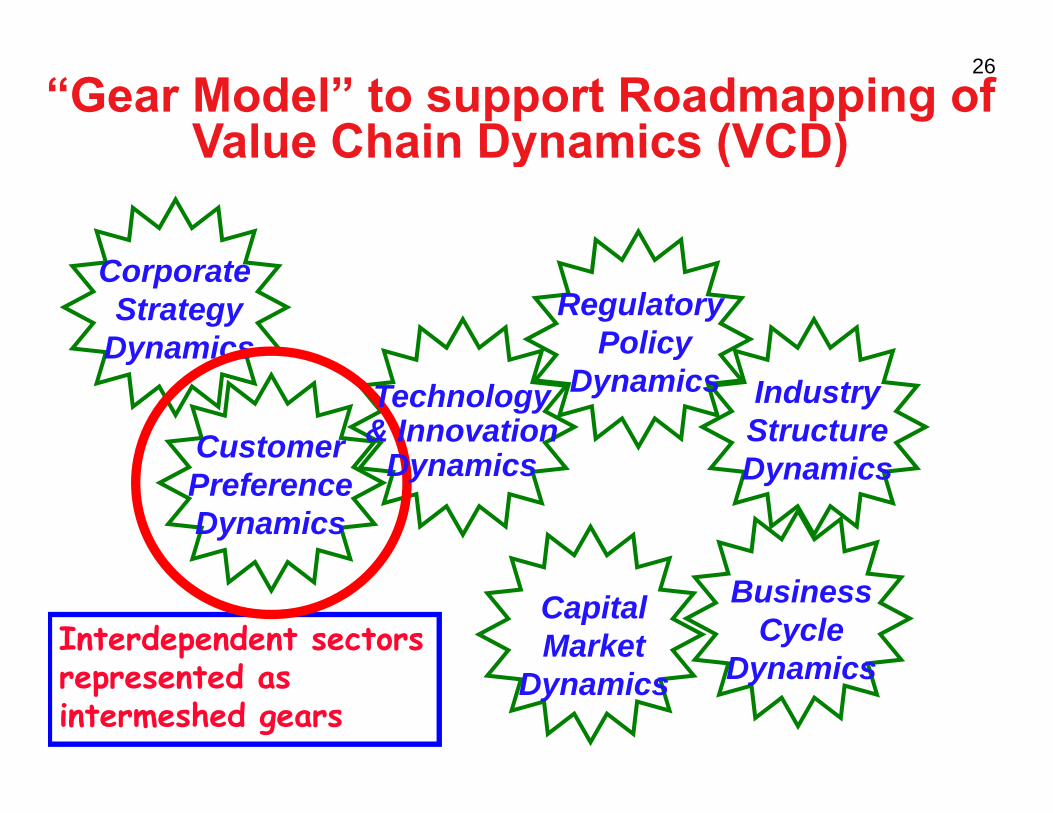
“Gear Model” to support Roadmapping ofValue Chain Dynamics (VCD)Value Chain Dynamics (VCD)
Regulatory Policy
Corporate Strategy
Dynamics yDynamics
DynamicsIndustryStructureD i
CustomerTechnology& Innovation
D i DynamicsPreferenceDynamics
Dynamics
BusinessCycle
Dynamics
CapitalMarketInterdependent sectors
d DynamicsDynamicsrepresented as intermeshed gears
t t t
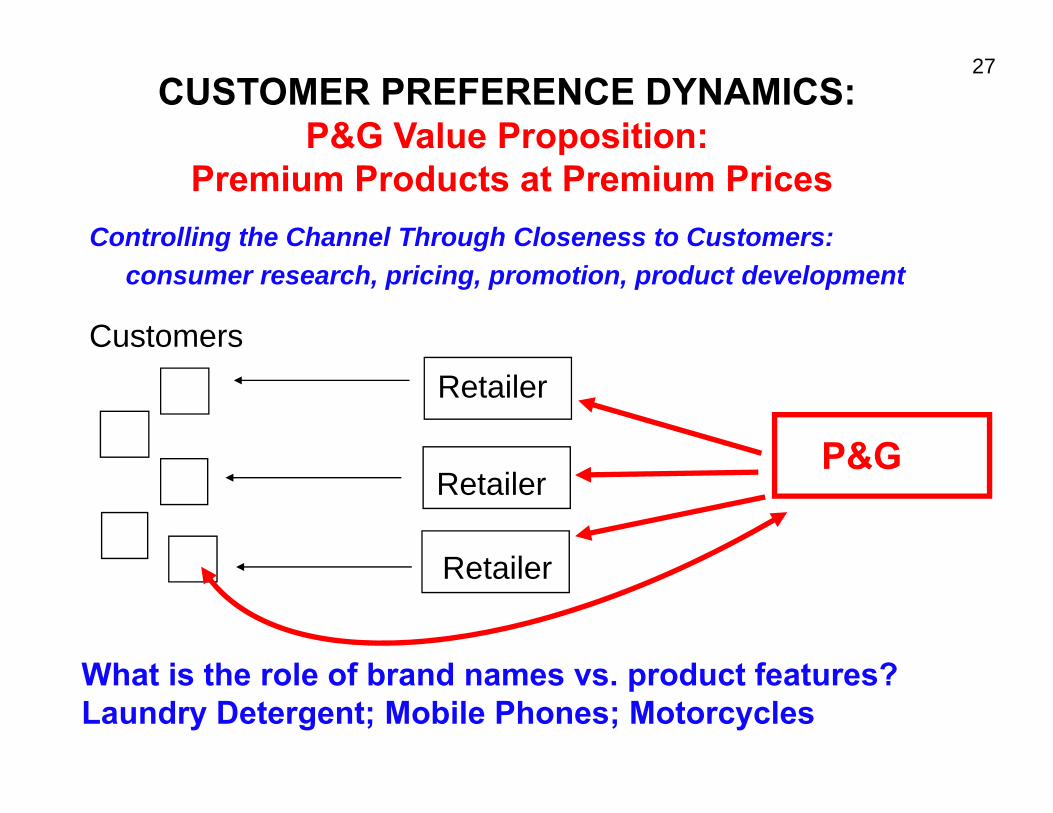
27 CUSTOMER PREFERENCE DYNAMICS:
P&G Value Propposition:Premium Products at Premium Prices
Controlling the Channel Through Closeness to Customers: consumer research, pricing, promotion, product development
Customers Retailer
P&G Retailer
R t il
P&G
Retailer
WhWhat iis ththe rolle of brandd names vs. product ffeatures??f b d Laundry Detergent; Mobile Phones; Motorcycles
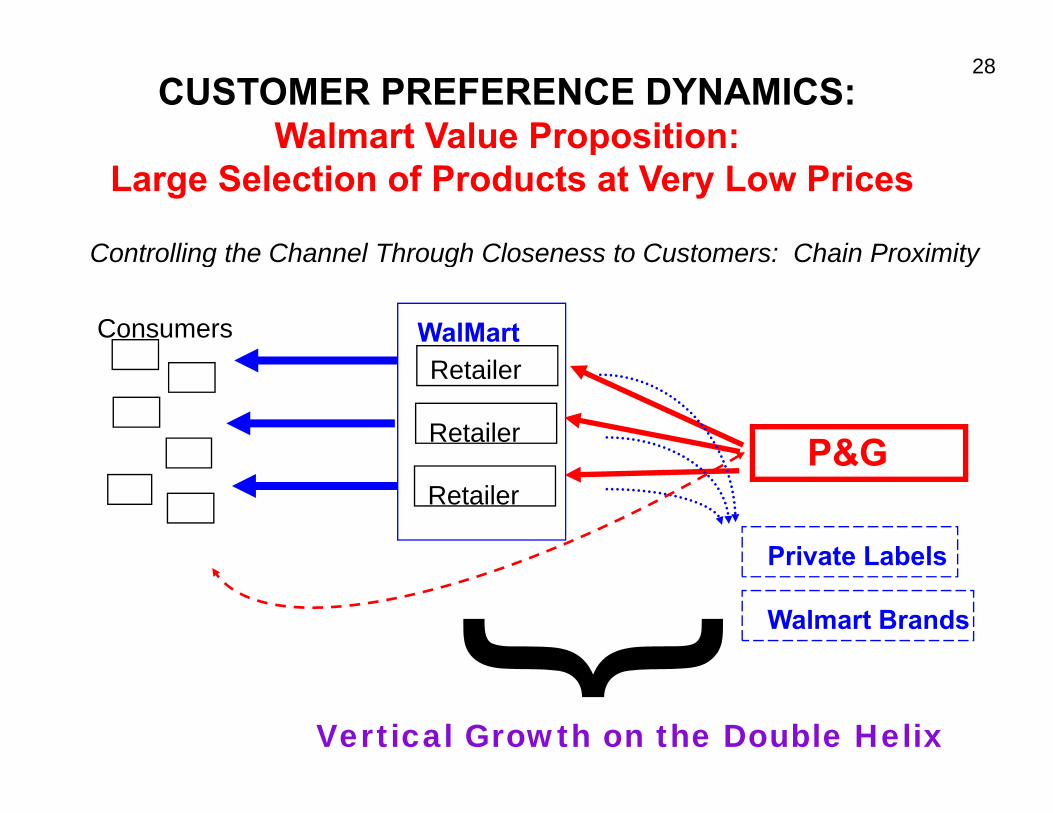
28CUSTOMER PREFERENCE DYNAMICS:
Walmart Value Proposition:
Controlling the Channel Through Closeness to Customers: Chain Proximity
pLarge Selection of Products at Very Low Prices
Controlling the Channel Through Closeness to Customers: Chain Proximity
Consumers WalMartRetailer
Retailer P&GRetailer
P&G
Private LabelsPrivate Labels
Walmart Brands
Vertical Growth on the Double Helix
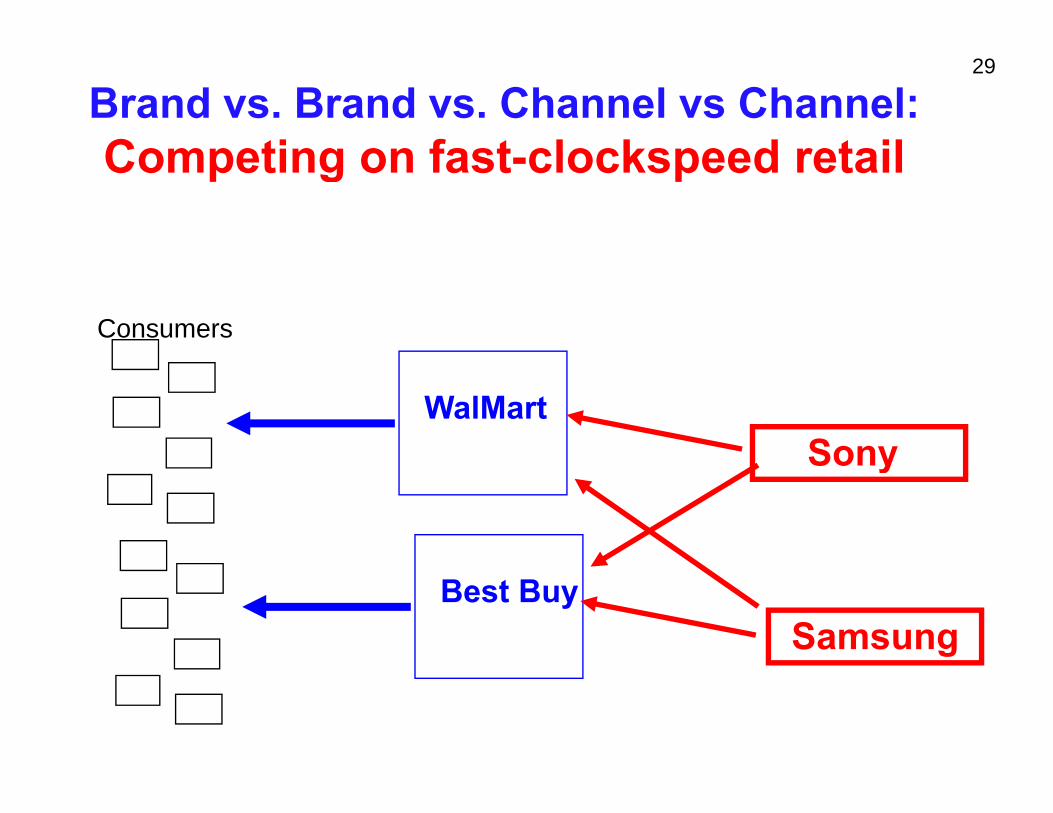
29
Brand vs. Brand vs. Channel vs Channel: Competing on fast clockspeed retail Competing on fast-clockspeed retail
Consumers
SonySony
Best Buy Samsung
WalMart
30
“Gear Model” to support Roadmapping ofValue Chain Dynamics (VCD)Value Chain Dynamics (VCD)
Regulatory Policy
Corporate Strategy
Dynamics yDynamics
DynamicsIndustryStructureD i
CustomerTechnology& Innovation
D i DynamicsPreferenceDynamics
Dynamics
BusinessCycle
Dynamics
CapitalMarketInterdependent sectors
d DynamicsDynamicsrepresented as intermeshed gears
31
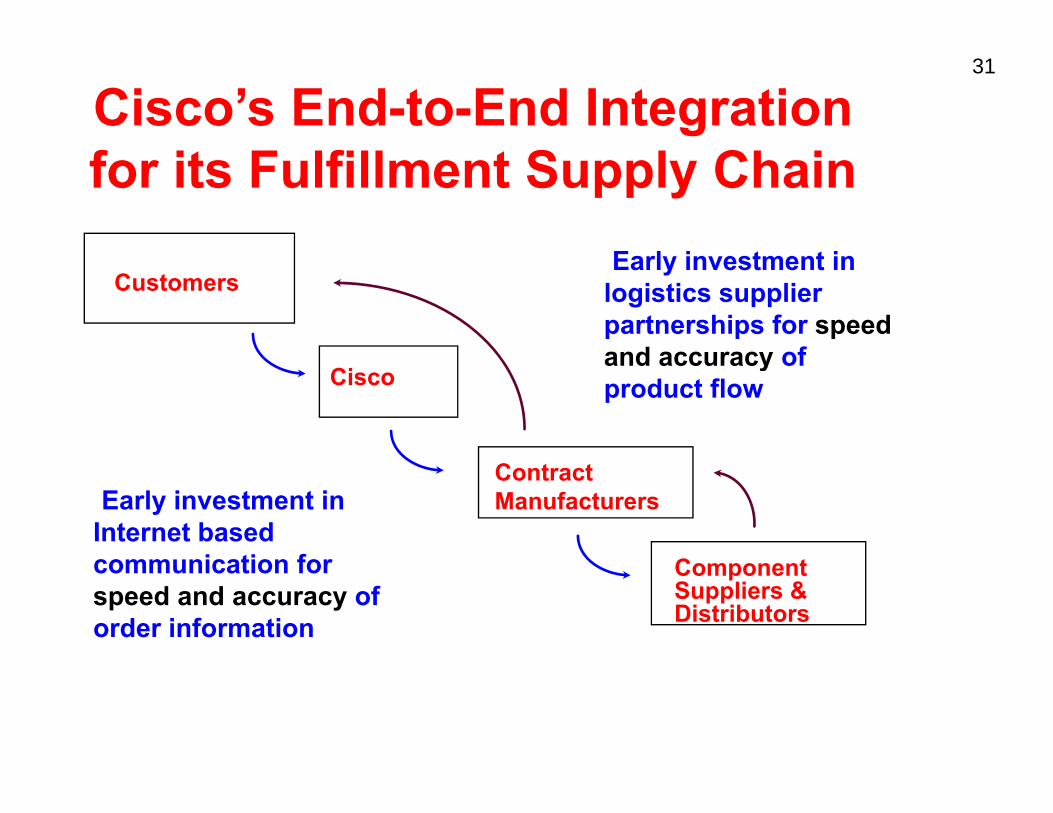
Cisco’s End-to-End Integration f f Cfor its Fulfillment SSupply Chain
communication for communication for speed and accuracy of order information
C tComponent Suppliers &Distributors
E l i t t i Customers
Early investment in logistics supplier partnerships for speed and accuracy of
Cisco and accuracy of product flow
Contract ManufacturersEarly investment in
Internet based
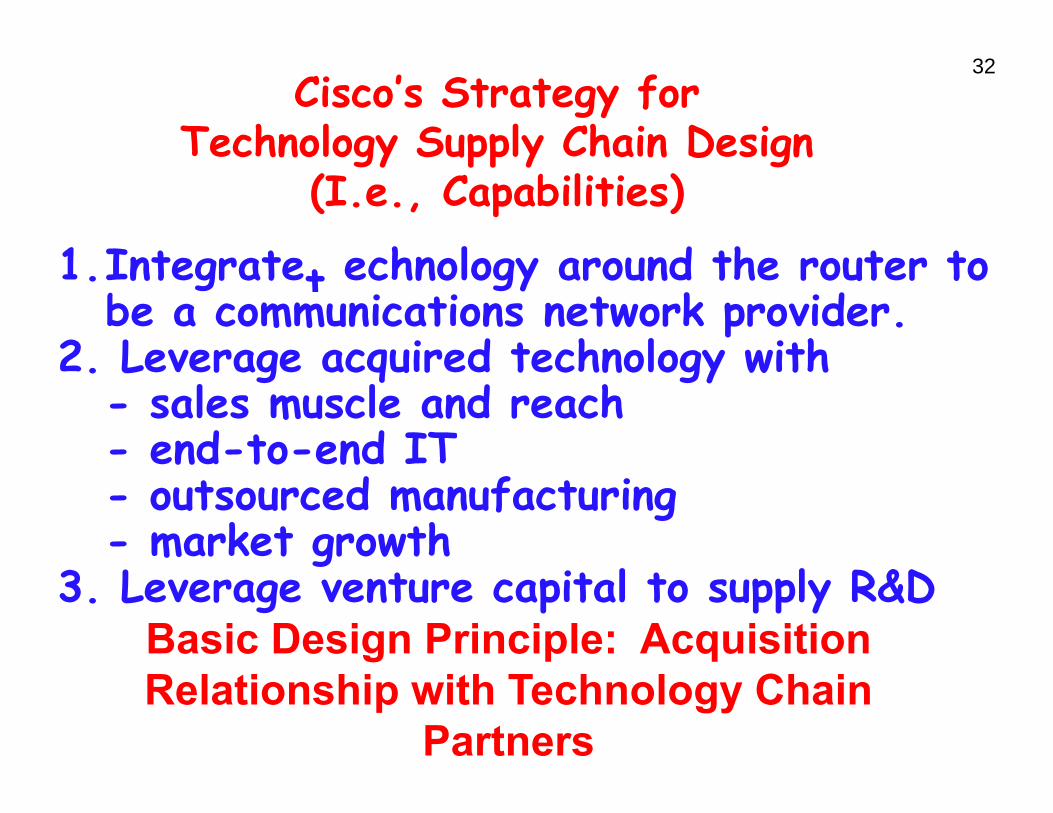
32Cisco’s Strategy for
Technology Supply Chain Design Technology Supply Chain Design (I.e., Capabilities)
1 I t t h d th t t1.Integrate tt echnollogy around the router tobe a communications network provider.
2 Leverage acquired technology with 2. Leverage acquired technology with - sales muscle and reach - end-to-end ITend to end IT - outsourced manufacturing- market ggrowth
3. Leverage venture capital to supply R&D Basic Design Principle: Acquisition Relationship with Technology Chain
Partners
u w Eff
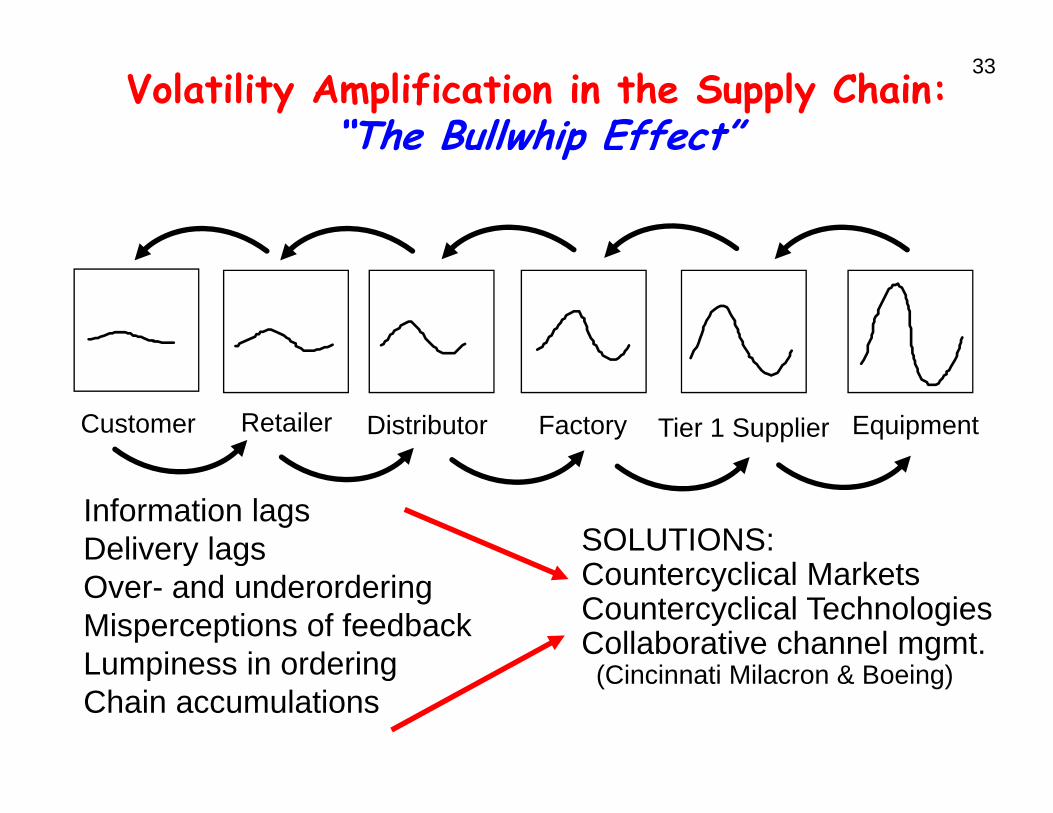
33 Volatility Amplification in the Supply Chain:
“The Bu w p Effect”ll hip
Customer Retailer Distributor Factory Tier 1 Supplier Equipment
Information lags SOLUTIONS:Delivery lagsy g
Over- and underordering Countercyclical MarketsMisperceptions of feedback Countercyclical Technologies
Collaborative channel mgmt.Lumpiness in ordering Lumpiness in ordering (Cincinnati Milacron & Boeing)Chain accumulations
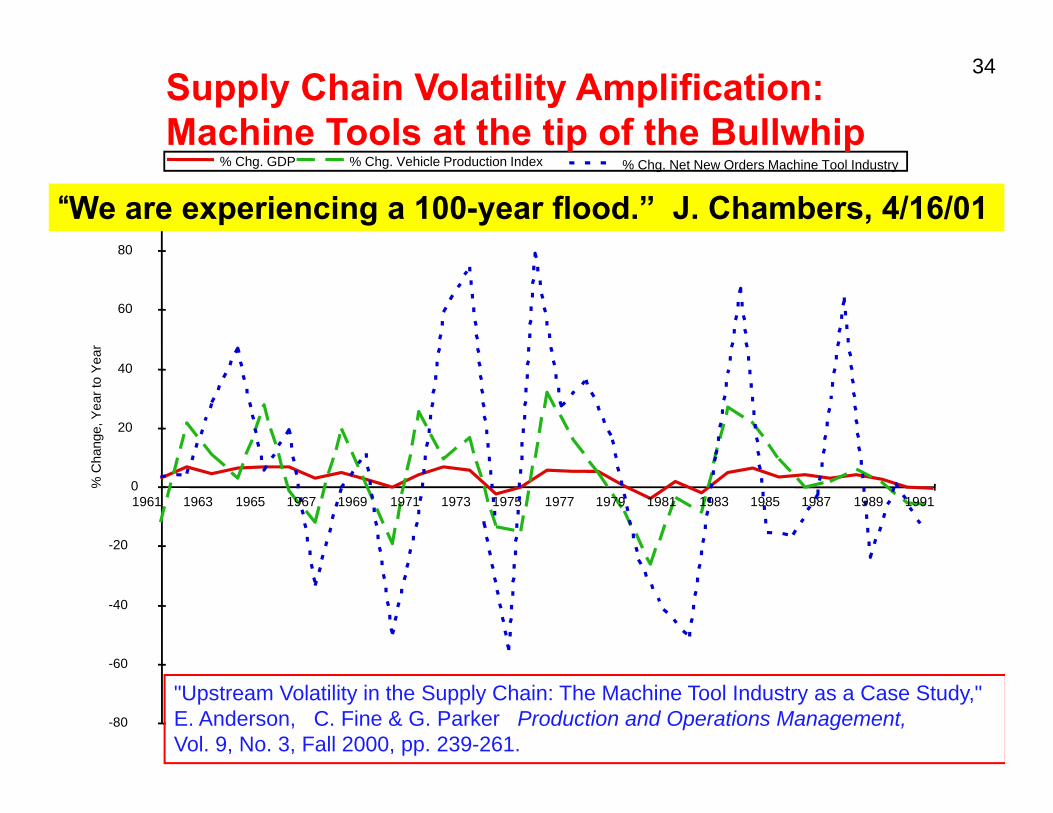
34 Supply Chain Volatility Amplification: Machine Tools at the tip of the Bullwhip
“We are experiencing a 100-year flood.” J. Chambers, 4/16/01 80
% Chg. GDP % Chg. Vehicle Production Index % Chg. Net New Orders Machine Tool Industry
p p
60
80
ar
20
40
hang
e, Y
ear t
o Ye
a
-20
0 1961 1963 1965 1967 1969 1971 1973 1975 1977 1979 1981 1983 1985 1987 1989 1991
% C
h
60
-40
-80
-60
"Upstream Volatility in the Supply Chain: The Machine Tool Industry as a Case Study," E. Anderson, C. Fine & G. Parker Production and Operations Management, Vol. 9, No. 3, Fall 2000, pp. 239-261.
35
100.00
% C
hang
e, Y
ear-
to--Y
ear
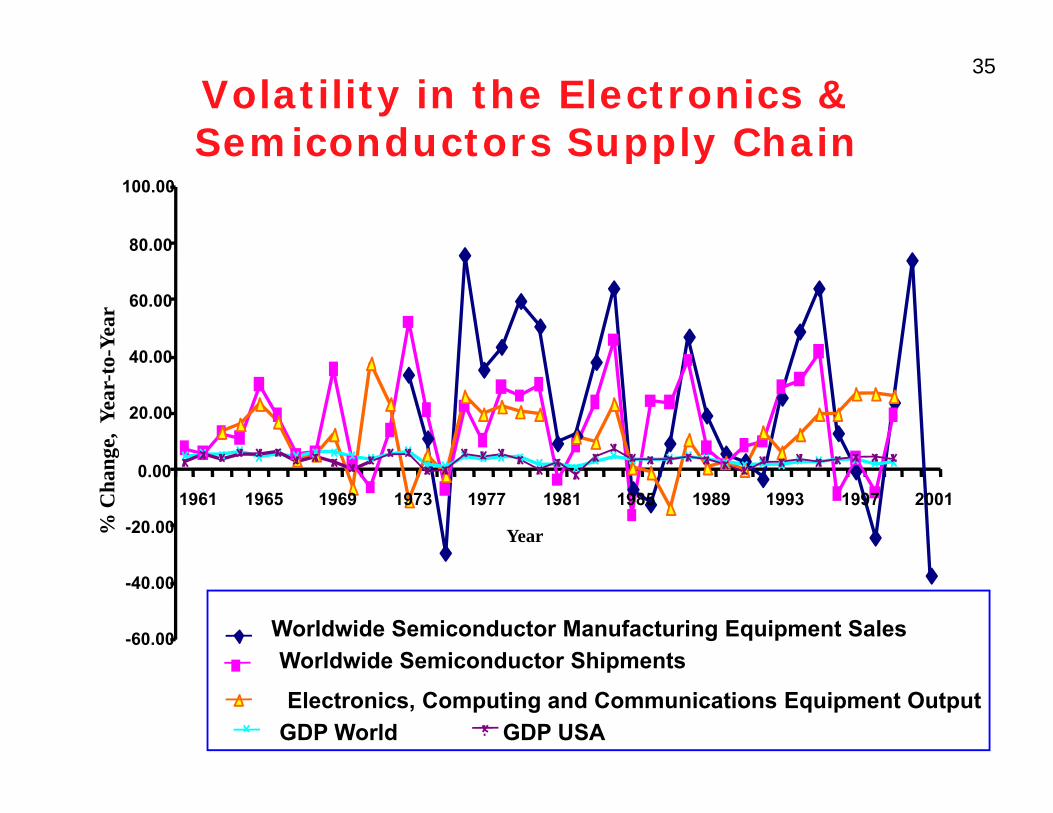
Volatility in the Electronics & Semiconductors Supply Chain Semiconductors Supply Chain
80.00
60.00
40 00 40.00
20.00
0.00
1961 1965 1969 1973 1977 1981 1985 1989 1993 1997 2001 -20.00 Year
-40.00
Worldwide Semiconductor Manufacturing Equipment Sales Worldwide Semiconductor ShipmentsWorldwide Semiconductor Shipments
Electronics, Computing and Communications Equipment Output GDP World GDP USA
-60.00
36
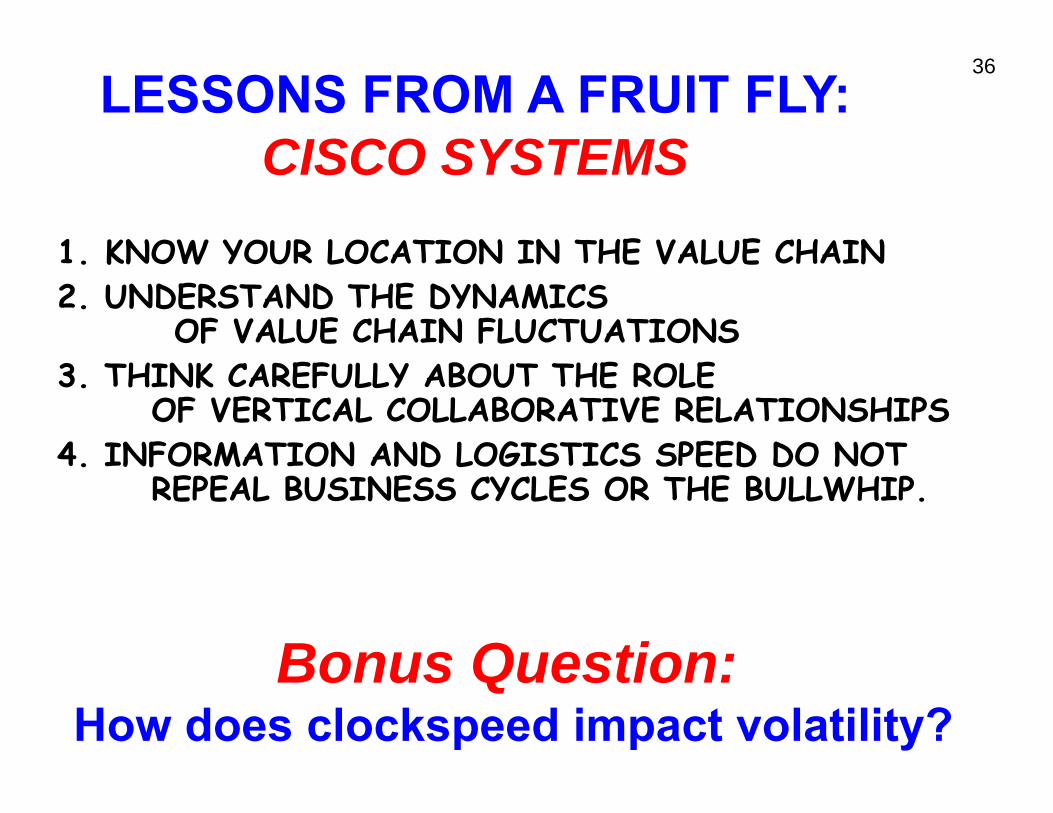
LESSONS FROM A FRUIT FLY: CISCO SYSTEMSCISCO SYSTEMS
1 KNOW YOUR LOCATION IN THE VALUE CHAIN1. KNOW YOUR LOCATION IN THE VALUE CHAIN 2. UNDERSTAND THE DYNAMICS
OF VALUE CHAIN FLUCTUATIONS 3. THINK CAREFULLY ABOUT THE ROLE
OF VERTICAL COLLABORATIVE RELATIONSHIPS 4 INFORMATION AND LOGISTICS SPEED DO NOT 4. INFORMATION AND LOGISTICS SPEED DO NOT
REPEAL BUSINESS CYCLES OR THE BULLWHIP.
Bonus Question:Bonus Question: How does clockspeed impact volatility?
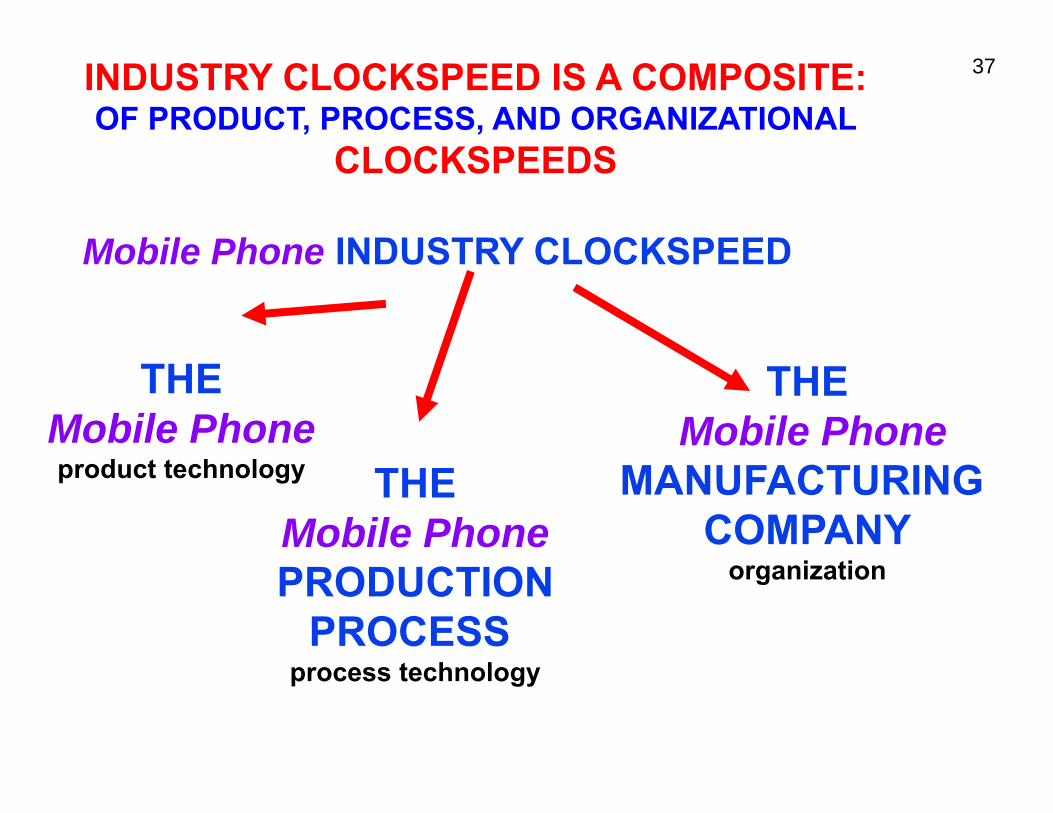
37 INDUSTRY CLOCKSPEED IS A COMPOSITE: OF PRODUCT, PROCESS, AND ORGANIZATIONAL
CLOCKSPEEDSCLOCKSPEEDS
Mobile Phone INDUSTRY CLOCKSPEED Mobile Phone INDUSTRY CLOCKSPEED
THE Mobile Phone
THE Mobile Phone product technology THE MANUFACTURING
Mobile Phone COMPANY PRODUCTION organiizatiion
PROCESS t h lprocess technology
38
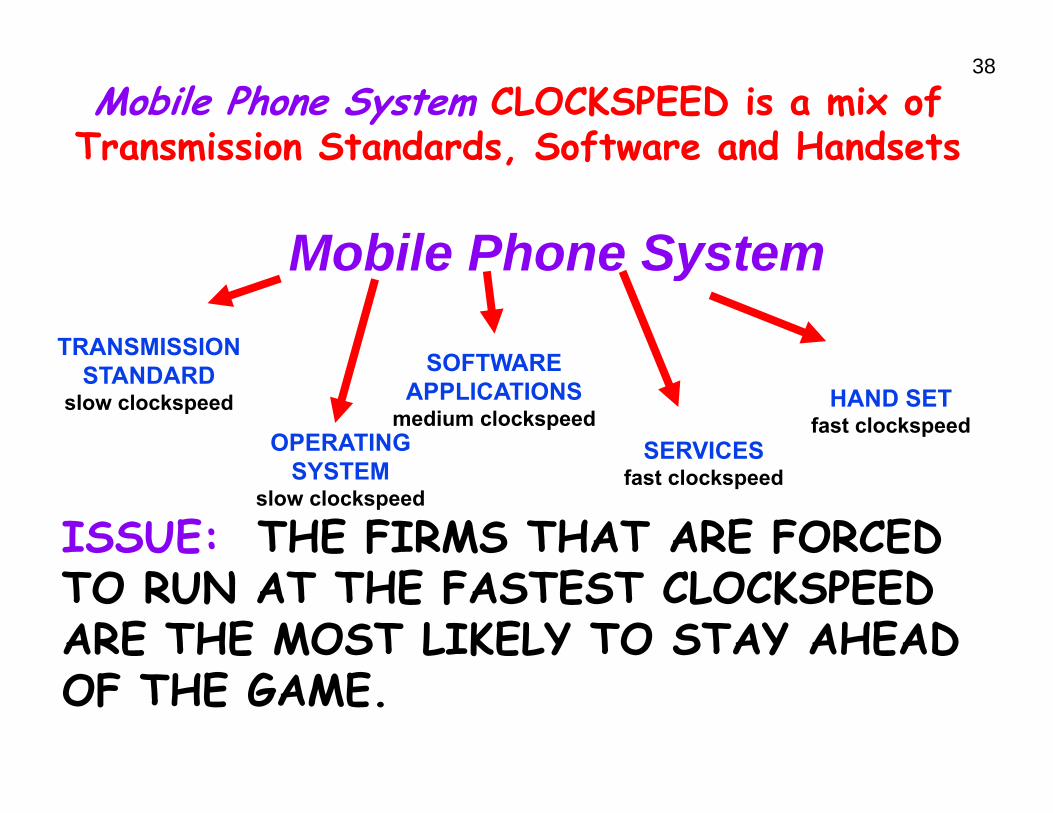
Mobile Phone System CLOCKSPEED is a mix of Transmission Standards Software and HandsetsTransmission Standards, Software and Handsets
Mobile Phone SystemMobile Phone System TRANSMISSION SOFTWARE SOFTWARE STANDARD APPLICATIONS HAND SETslow clockspeed
medium clockspeed fast clockspeedOPERATING SERVICESSERVICES
SYSTEM fast clockspeedslow clockspeed
ISSUE: THE FIRMS THAT ARE FORCED TO RUN AT THE FASTEST CLOCKSPEED ARE THE MOST LIKELY TO STAY AHEAD OF THE GAME.
39
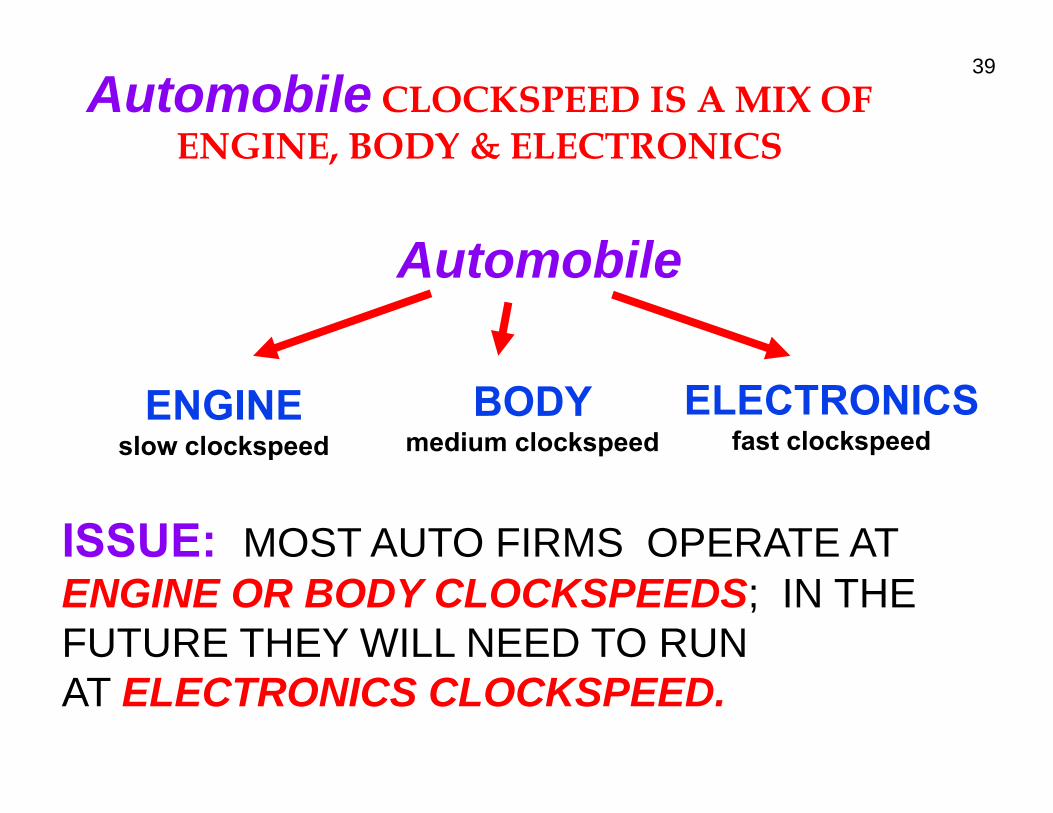
Automobile CLOCKSPEED IS A MIX OF ENGINE BODY & ELECTRONICSENGINE, BODY & ELECTRONICS
AutomobileAutomobile
ENGINE BODY ELECTRONICS slow clocksppeed medium clockspeed fast clockspeed
ISSUE: MOST AUTO FIRMS OPERATE AT ENGINE OR BODY CLOCKSPEEDS; IN THE FUTURE THEY WILL NEED TO RUN AT ELECTRONICS CLOCKSPEED.
am cs
40
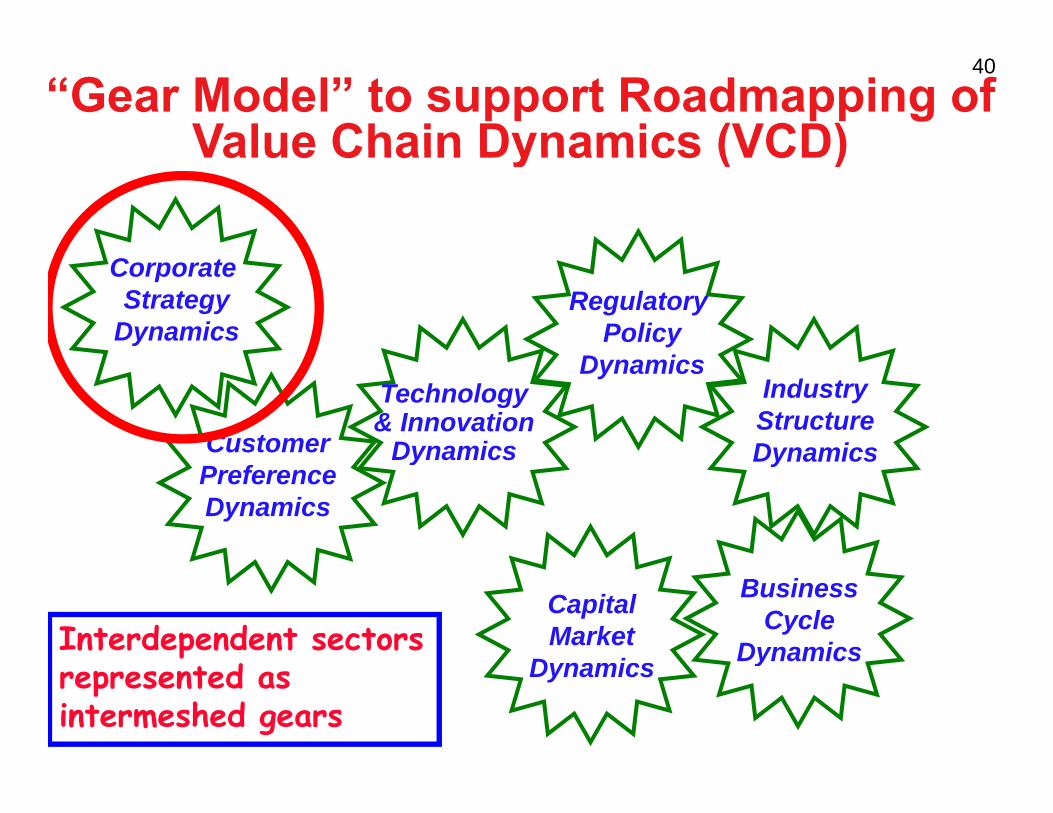
“Gear Model” to support Roadmapping ofValue Chain Dynamics (VCD)Value Chain Dynamics (VCD)
Regulatory Policy
D i
Corporate Strategy
Dynamics
Technology& Innovation
Dynamics
Dynamics Industry Structure DynamicsCustomer Dynamics Dynamics
Preference Dynamics
Business Cycle
Dynamics
Capital Market
D n iInterdependent sectors
d yDynamicsrepresented as
intermeshed gears
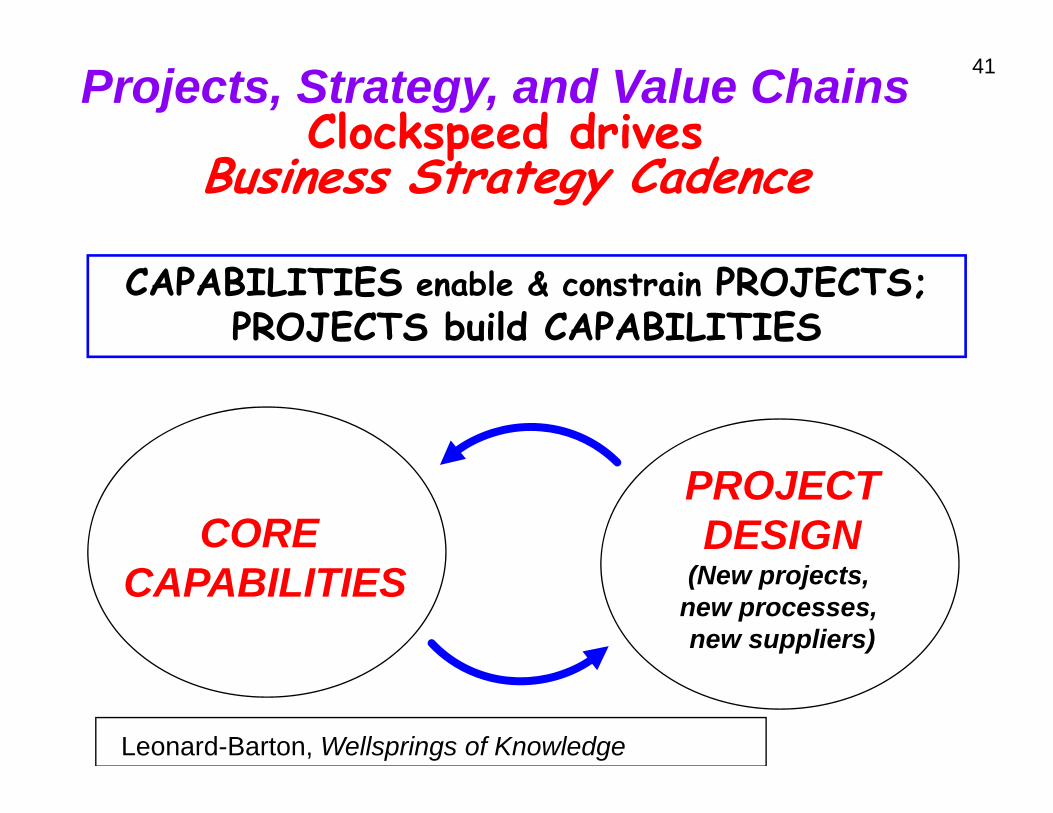
41 Projects, Strategy, and Value ChainsClocksppeed drives
Business Strategy Cadence
CAPABILITIES enable & constrain PROJECTS; PROJECTS build CAPABILITIES
CORE PROJECT DESIGN
CAPABILITIES (New projects, new processes, new suppliers)
Leonard-Barton, Wellsprings of Knowledge
l t & rof t
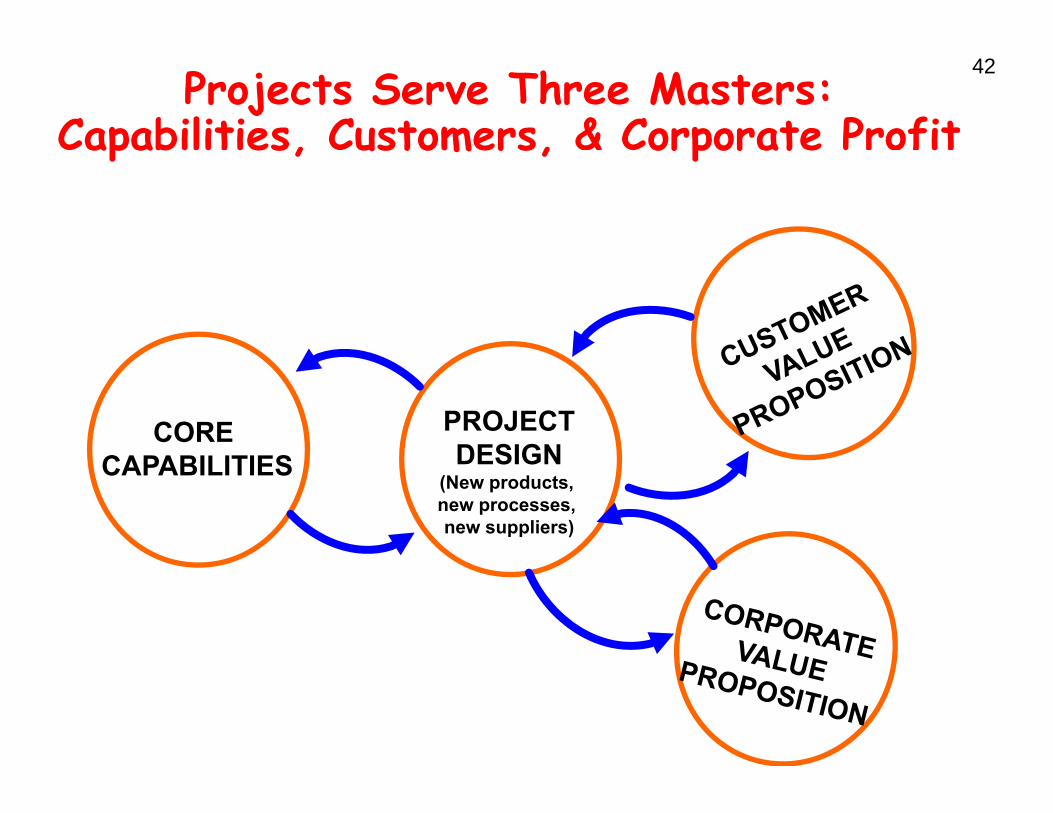
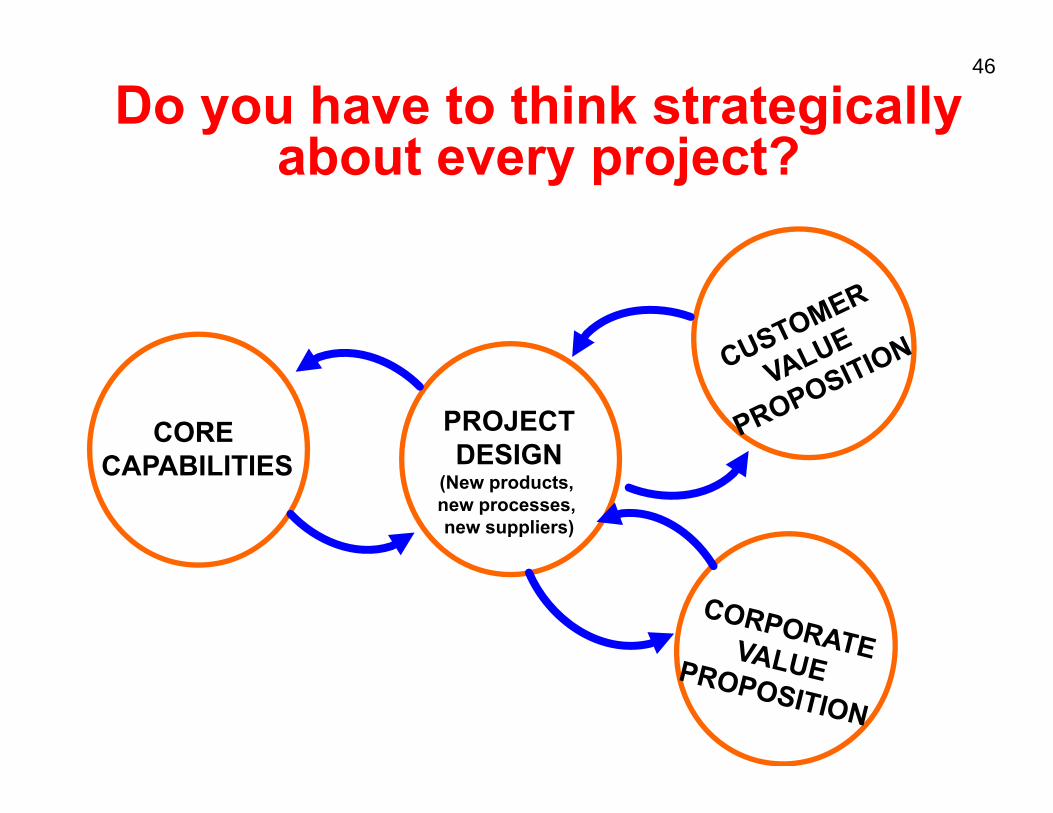
42 Projects Serve Three Masters:
Capabilities, Customers, & Corporate Profitapab es, ustomers, orporate
CORE CAPABILITIES
PROJECT DESIGN CAPABILITIES DESIGN
(New products, new processes, new suppliers)
-
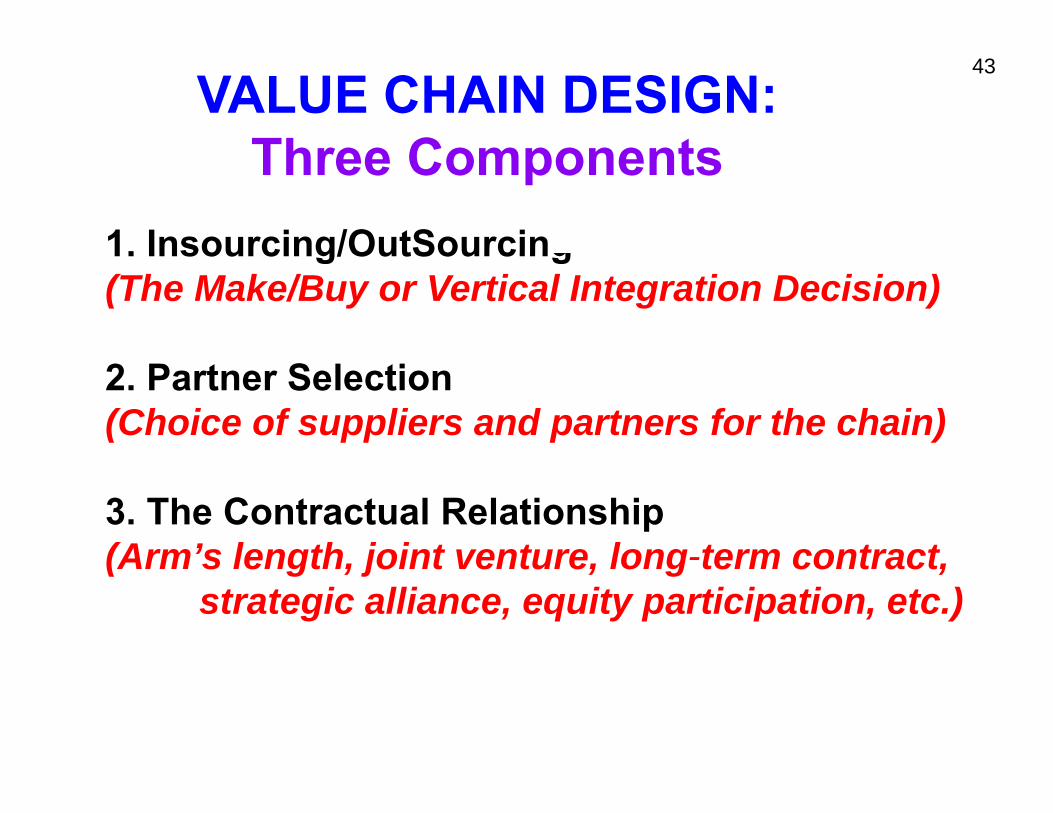
43
VALUE CHAIN DESIGN: Three ComponentsThree Components
1. Insourcing/OutSourcin1. Insourcing/OutSourcing (The Make/Buy or Vertical Integration Decision)
2. Partner Selection (Choice of suppliers and partners for the chain)
3. The Contractual Relationship (Arm’s length joint venture long-term contract (Arm s length, joint venture, long term contract,
strategic alliance, equity participation, etc.)
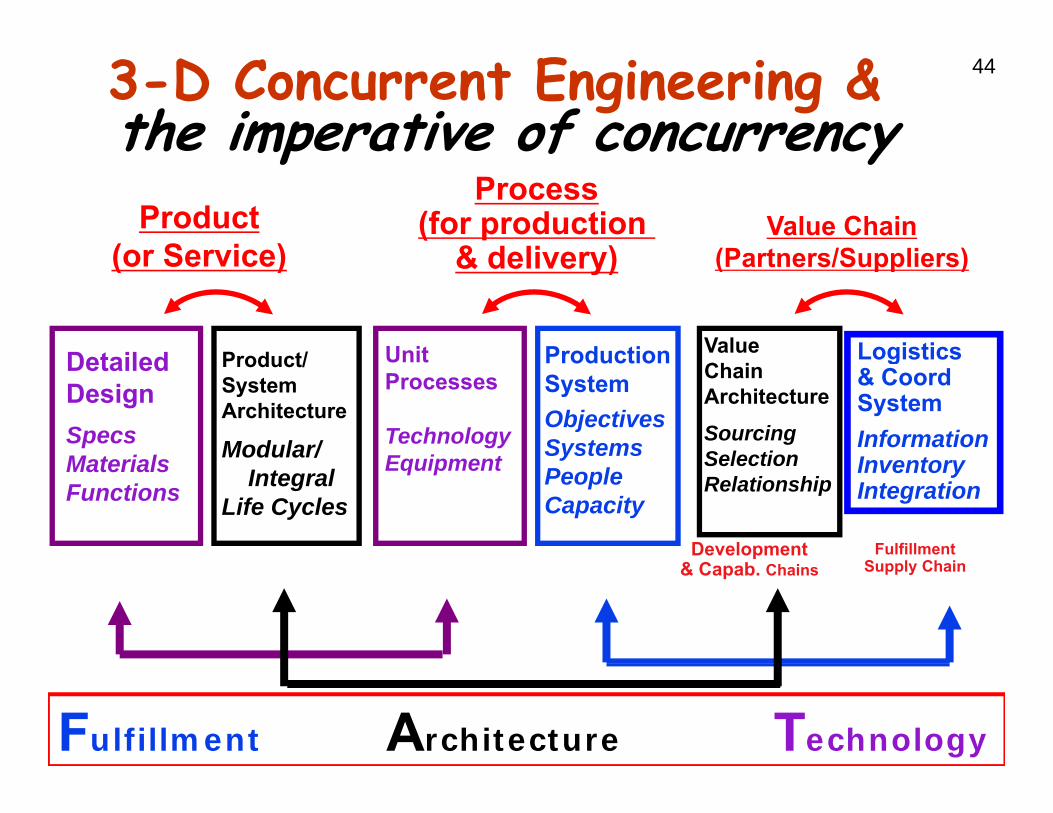
44 3-D Concurrent Engineering & the imperative of concurrencythe imperative of concurrency
ProcessProduct (for production Value Chain
(or Service) & delivery) (Partners/S(Partners/Suppliers)(or Service) & delivery) ppliers)
D t il d Unit Production Value LogisticsP d t/ Chain Architecture Sourcing Selection
Logistics & Coord System Information I t Selection Inventory
Relationship Integration
Detailed Design Specs M t i l
Unit Processes
Technology E i t
Production System Objectives Systems
Product/ System Architecture
Modular/ Materials Functions
Equipment y People Capacity
Integral Life Cycles
Development Fulfillment S l Ch i & Capab. Chains Supply Chain
Fulfillment Architecture Technology
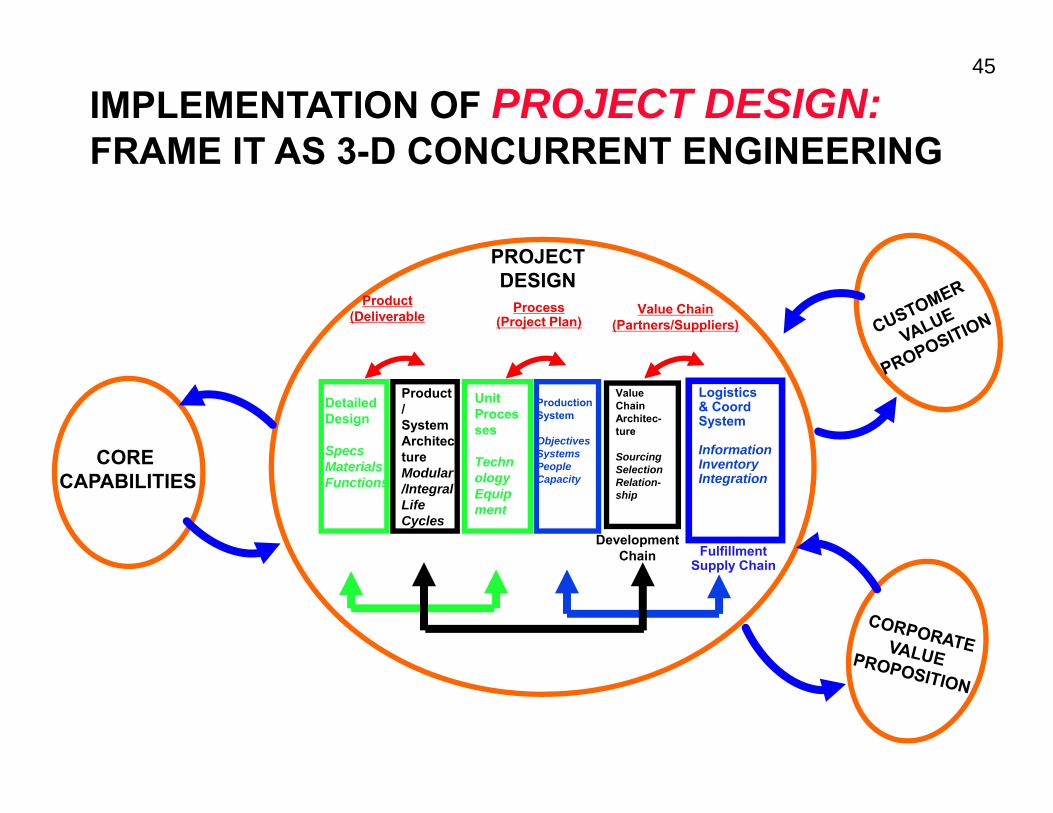
45
IMPLEMENTATION OF PROJECT DESIGN: FRAME IT AS 3 D CONCURRENT ENGINEERING FRAME IT AS 3-D CONCURRENT ENGINEERING
PROJECT
Product (Deliverable Process
(Project Plan) Value Chain
(Partners/Suppliers)
PROJECT DESIGN
CORE
Detailed Design
Specs
Unit Proces ses
T h
Production System
Objectives Systems
Value Chain Architec-ture
Sourcing
Logistics& Coord System
Information
Product / System Architec ture CORE
CAPABILITIES Materials Functions
Techn ology Equip ment
y People Capacity
Sourcing Selection Relation-ship
Inventory Integration
ture Modular /Integral Life Cycles
Development Chain Fulfillment
S l Ch iSupply Chain
46
Do you have to think strategicallyabout every project?about every project?
CORE CAPABILITIES
PROJECT DESIGN CAPABILITIES DESIGN
(New products, new processes, new suppliers)
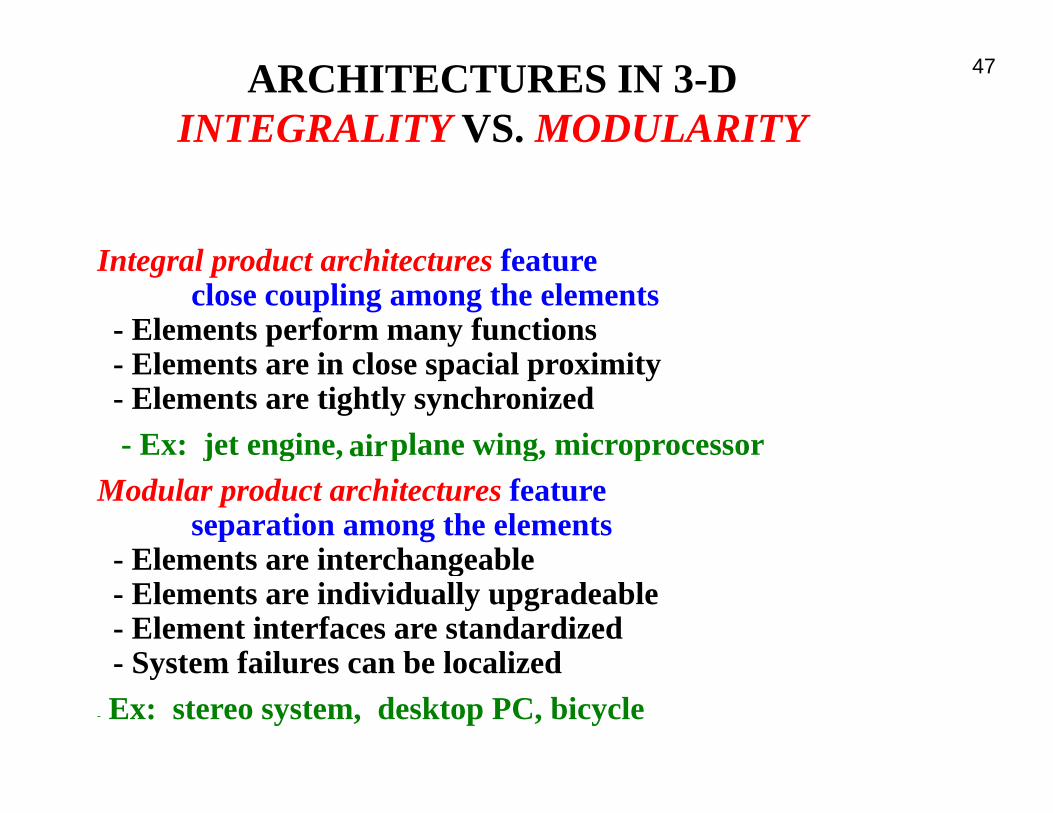
47 ARCHITECTURES IN 3-DINTEGRALITY VS. MODULARITY
I tIntegrall productt architecttures ff teature d hit close coupling among the elements
- Elements perform many functionsEl t i l i l i it- Elements are in close spacial proximity
- Elements are tightly synchronized
- Ex: jjet enggine,, airpplane wing, micropprocessor g, Modular product architectures feature
separation among the elements - Elements are interchangeableElements are interchangeable - Elements are individually upgradeable- Element interfaces are standardized - System failures can be localizedSystem failures can be localized
- Ex: stereo system, desktop PC, bicycle
-
48
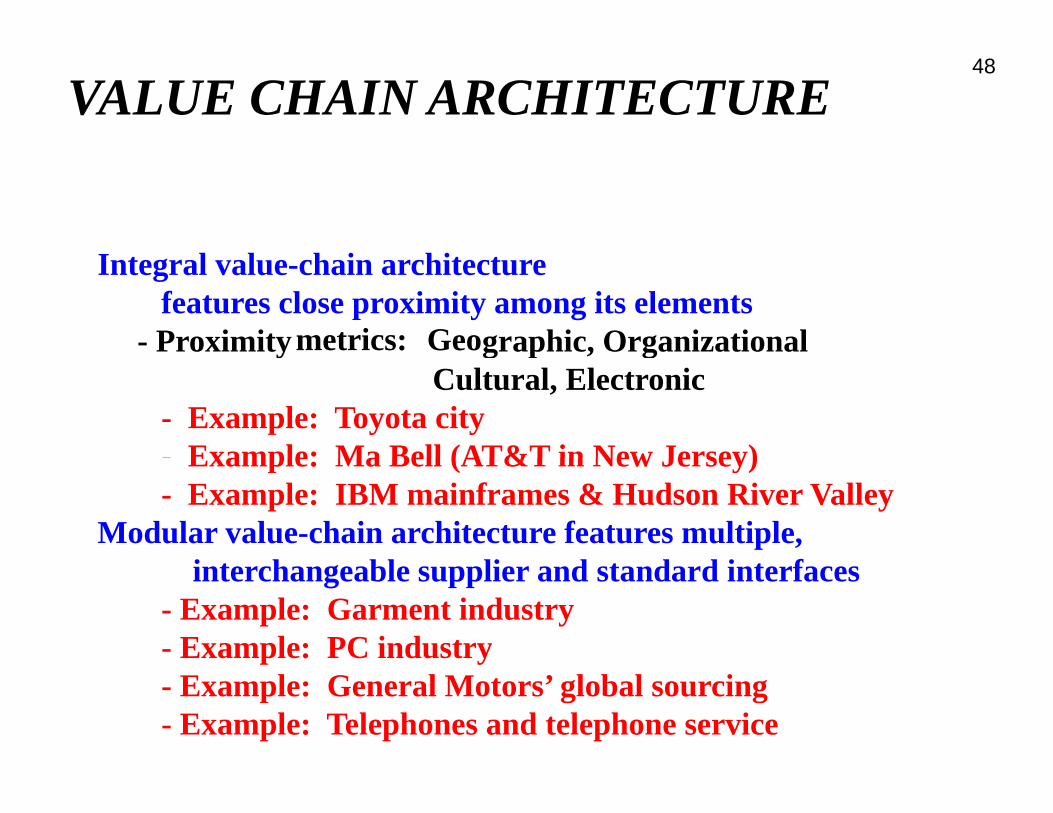
VALUE CHAIN ARCHITECTURE
Integral value-chain architecture features close proximity among its elements
- Proximityy metrics: Geoggrapphic,, Orgganizational Cultural, Electronic
- Example: Toyota city - Example: Ma Bell (AT&T in New Jersey)Ma Bell (AT&T in New Jersey)Example: - Example: IBM mainframes & Hudson River Valley
Modular value-chain architecture features multiple, i h bl li d d d i finterchangeable supplier and standard interfaces
- Example: Garment industry - Exampple: PC industryy - Example: General Motors’ global sourcing - Example: Telephones and telephone service
a
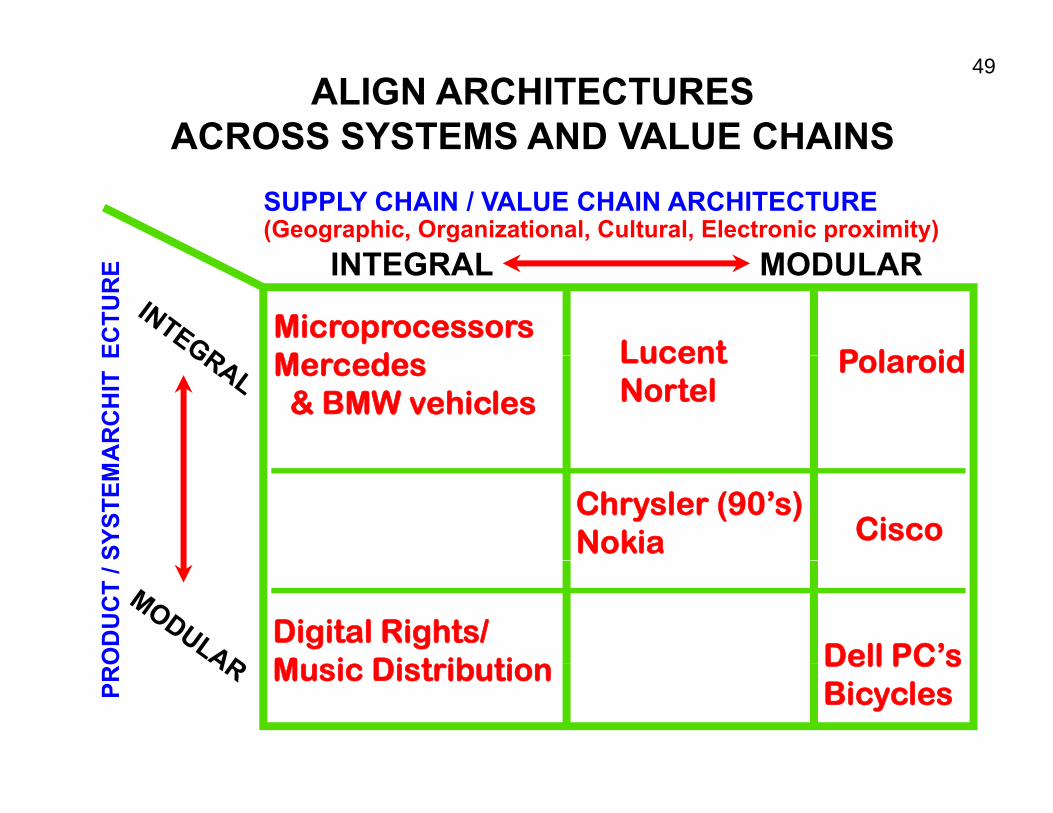
49 ALIGN ARCHITECTURES
ACROSS SYSTEMS AND VALUE CHAINSPR
OOD
UC
T / S
YSTE
M A
RC
HIT
EECTU
RE
SUPPLY CHAIN / VALUE CHAIN ARCHITECTURE(Geographic, Organizational, Cultural, Electronic proximity)
INTEGRALINTEGRAL MODULARMODULAR
Microprocessors M d Lucent P l idMercedes & BMW vehicles
Lucent Nortel
Polaroid
Chrysler (90’s) Nokia Cisco
Dell PC’s Digital Rights/ M i Di t ib ti Dell PC s
Bicycles Music Distribution
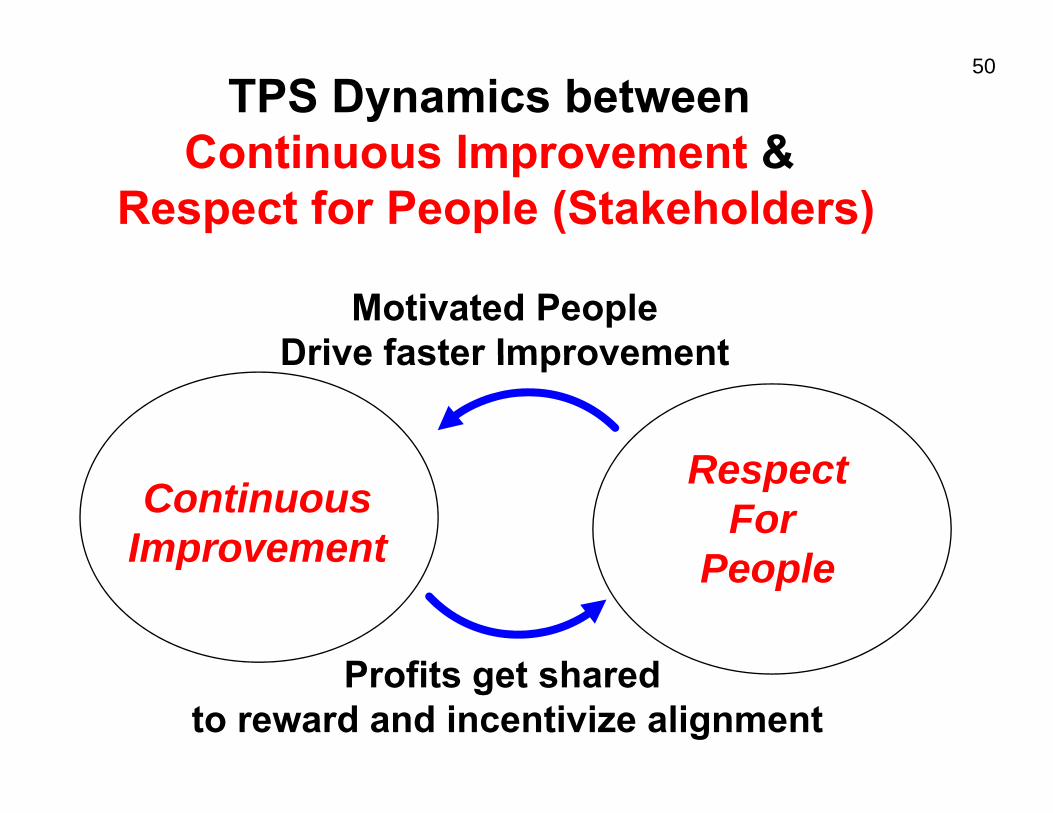
50
TPS Dynamics between Continuous Improvement &Continuous Improvement &
Respect for People (Stakeholders)
Motivated People Drive faster Improvement
R t
Drive faster Improvement
Continuous Improvement
Respect For
People Improvement People
P fit t h dProfits get shared to reward and incentivize alignment
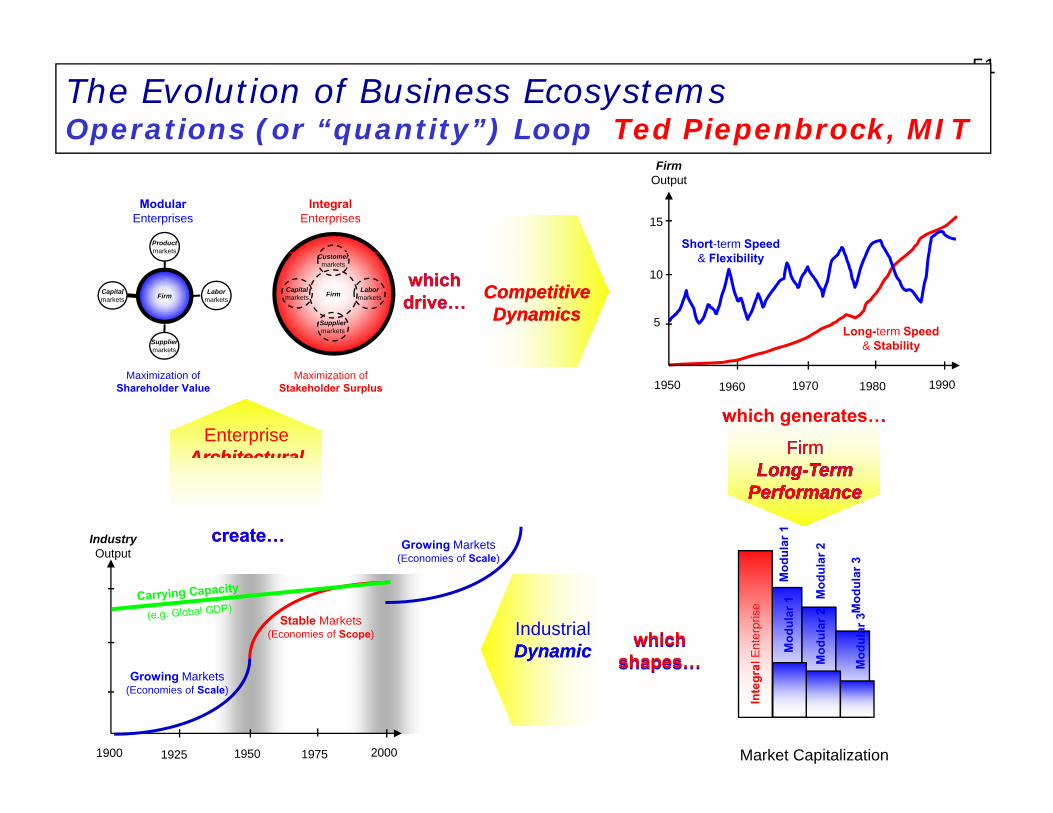
51 The Evolution of Business Ecosystems Operations (or “quantity”) Loop Ted Piepenbrock, MIT
Firm Output
Modular Integral Enterprises Enterprises
Enterprise CompetitiveCompetitiveDynamicsDynamics
EnterpriseCompetitiveCompetitiveDynamicsDynamics
15 Product markets
FirmCapital markets
Labor markets
markets
Firm
Supplier markets
Capital markets
Labor markets
Customer markets
10whichwhichdrive…drive…
Supplier markets
5
Short-term Speed
Long-term Speed & Stability
& Flexibility
Maximization of Maximization of Shareholder Value Stakeholder Surplus 1950 1960 1970 1980 1990
Enterprise ArchitecturalArchitectural
EnterpriseArchitecturalArchitecturalArchitecturalArchitecturalArchitecturalArchitectural
FormsFormsFormsForms
which generates…which generates…
l Ent
erpr
ise
Mod
ular
1
Mod
ular
2
l Mod
ular
3
Inte
gra M M
FirmFirmLong TermLong TermLong--TLong- erm-Term
PerformancePerformancePerformancePerformance
Industry create…create… Growing MarketsOutput (Economies of Scale)(Economies of Scale)
Industrial DynamicDynamicIndustrialDynamicDynamicEvolutionEvolutionEvolutionEvolution
whichwhichshapesshapesshapes…shapes…
Modd
ular
1
Mod
ulaar
2
Mod
ular
33
Stable Markets (Economies of Scope)
Growing Markets (Economies of Scale)
1900 1925 1950 1975 2000 Market Capitalization
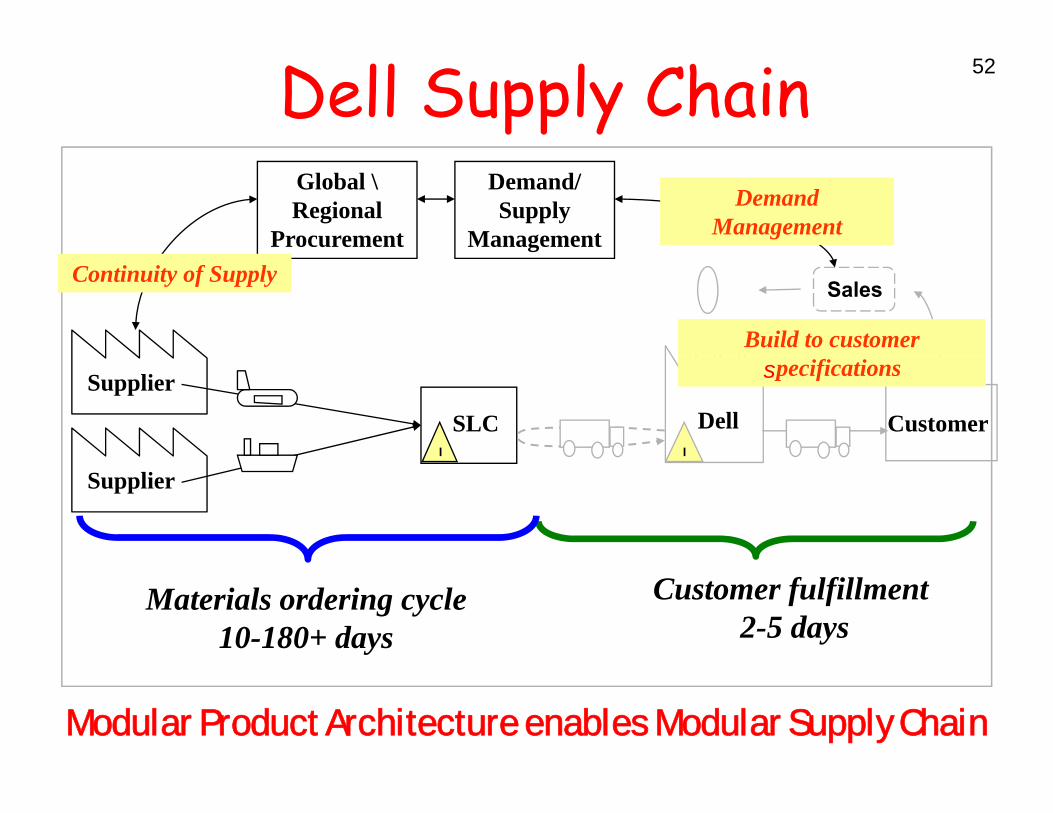
52 Dell Supply Chain Demand/ Supply
Management
Global \ Regional
Procurement
Demand Management
Demand Management
Continuity of SupplyContinuity of Supply
Build to customerBuild to customer
Sales
SLC
Supplier
I
Dell I
Customer
ssssspecificationsspecifications
Supplier
Customer fulfillment 2-5 days
Materials ordering cycle 10-180+ days
Modular Product Architecture enables Modular Supply Chain
s
f f
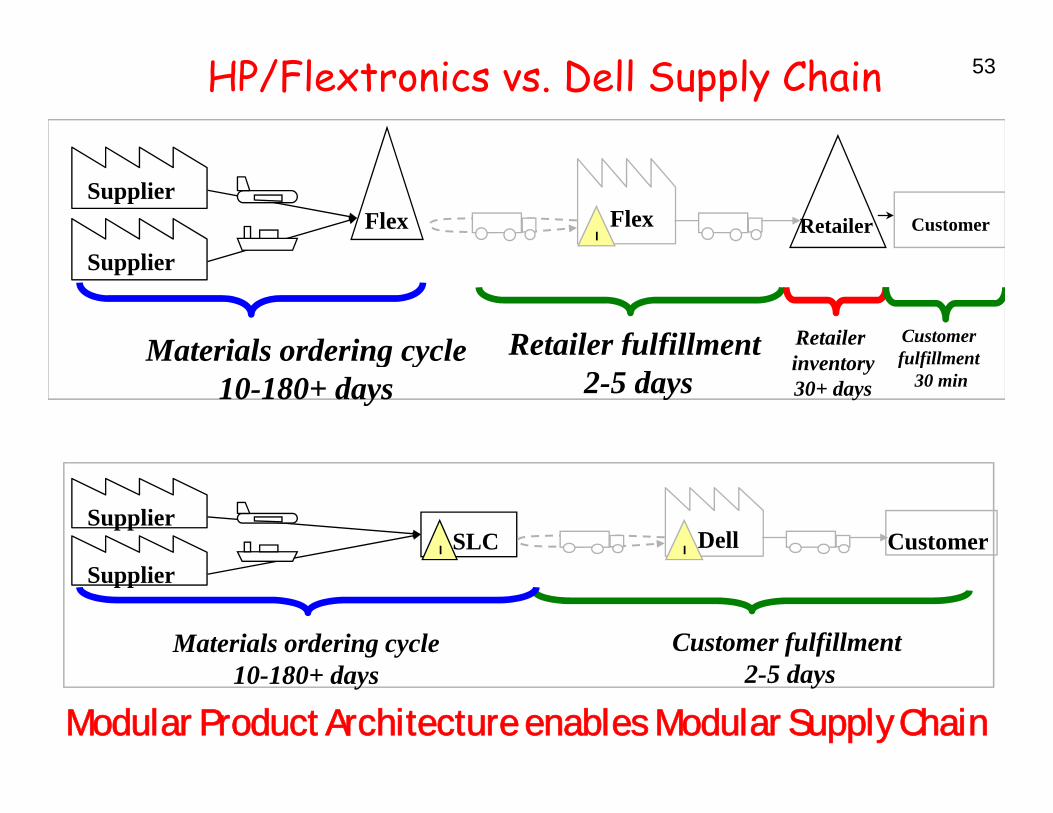
53 HP/Flextronics vs. Dell Supply Chain
Flex Supplier
Flex I
CustomerRetailer
Supplier
Retailer fulfillmentMaterials ordering cycle Retailer Customer f lfill t
2-5 days Materials ordering cycle
10-180+ days inventory 30+ days
fulfillment 30 min
SLCSupplier
I DellI Customer Supplier
Customer fulfillmentMaterials ordering cycle 2-5 days10-180+ days
Modular Product Architecture enables Modular Supply Chain
54
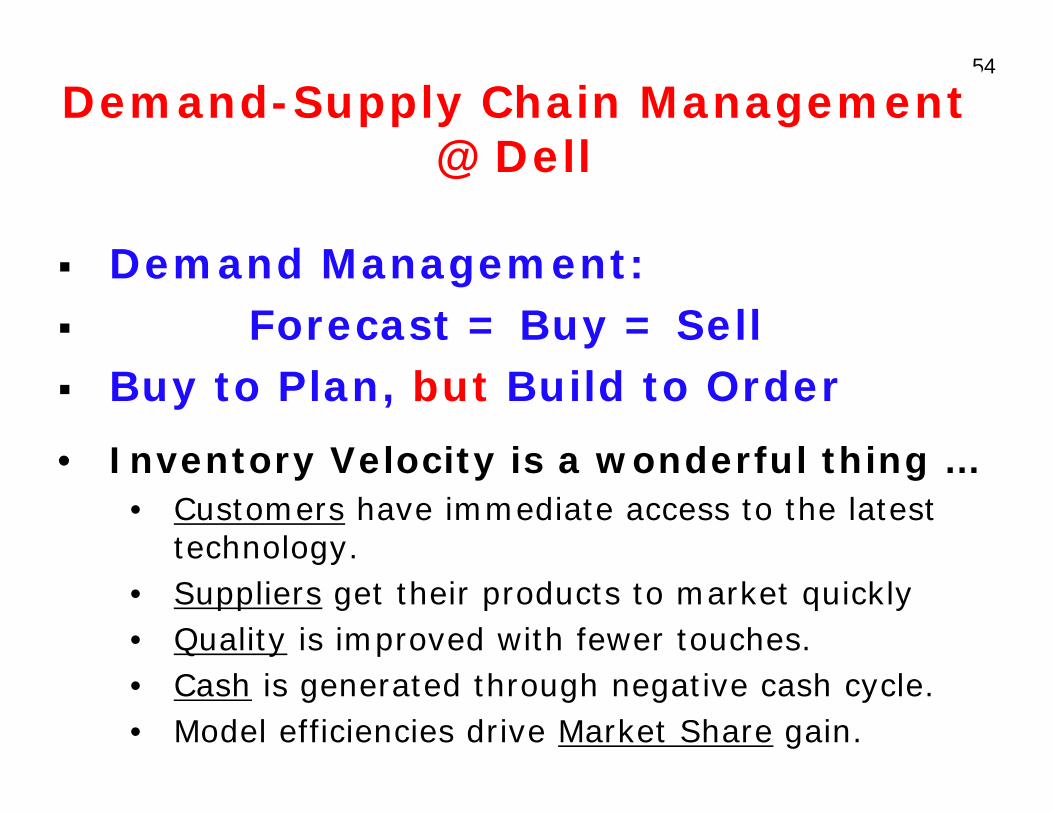
Demand-Supply Chain Management @ Dell@ Dell
� D d M Demand Managementt: � Forecast = Buy = Sell � Buy to Plan, but Build to Order
•• Inventory Velocity is a wonderful thingInventory Velocity is a wonderful thing … • Customers have immediate access to the latest
technologygy. • Suppliers get their products to market quickly
• Quality is improved with fewer touches. • Cash is generated through negative cash cycle.• Model efficiencies drive Market Share gain.
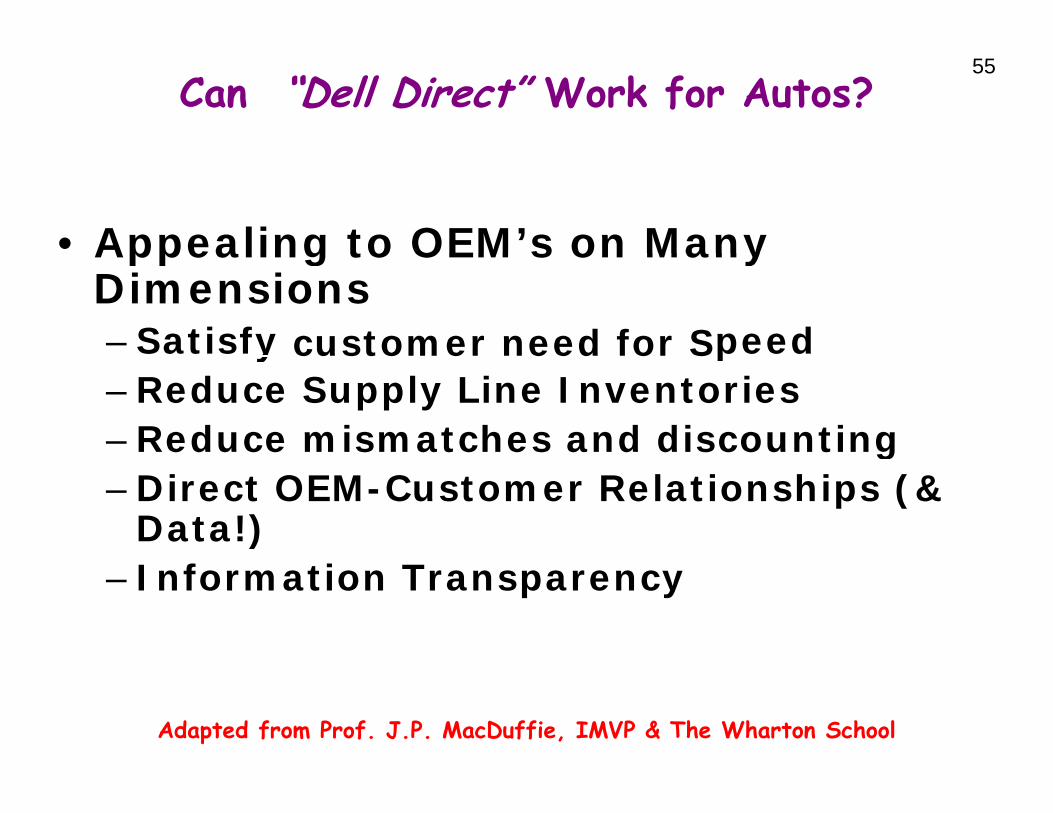
55 Can “Dell Direct” Work for Autos?
• Appealing to OEM’s on Many Appealing to OEM s on Many Dimensions – Satisfyy customer need for Sppeed – Reduce Supply Line Inventories – Reduce mismatches and discountingg– Direct OEM-Customer Relationships (&
Data!) – Information Transparency
Adapted from Prof. J.P. MacDuffie, IMVP & The Wharton School

, ,
56
BUT,A Car is not a Computer!!A Car is not a Computer!!
P l• Personal Computer
• ~50 componentsp • 8-10 key parts • 40 key suppliers • 24 hour burn-in • 100 design • variations • Modular
A hi • Architecture
C• Car • ~ 4000 components • 100 key subsystemsy y • 300 key suppliers • 12 month validation • 1,000,000 • variations • Integral • Architecture
Adapted from Prof. J.P. MacDuffie, IMVP & The Wharton School
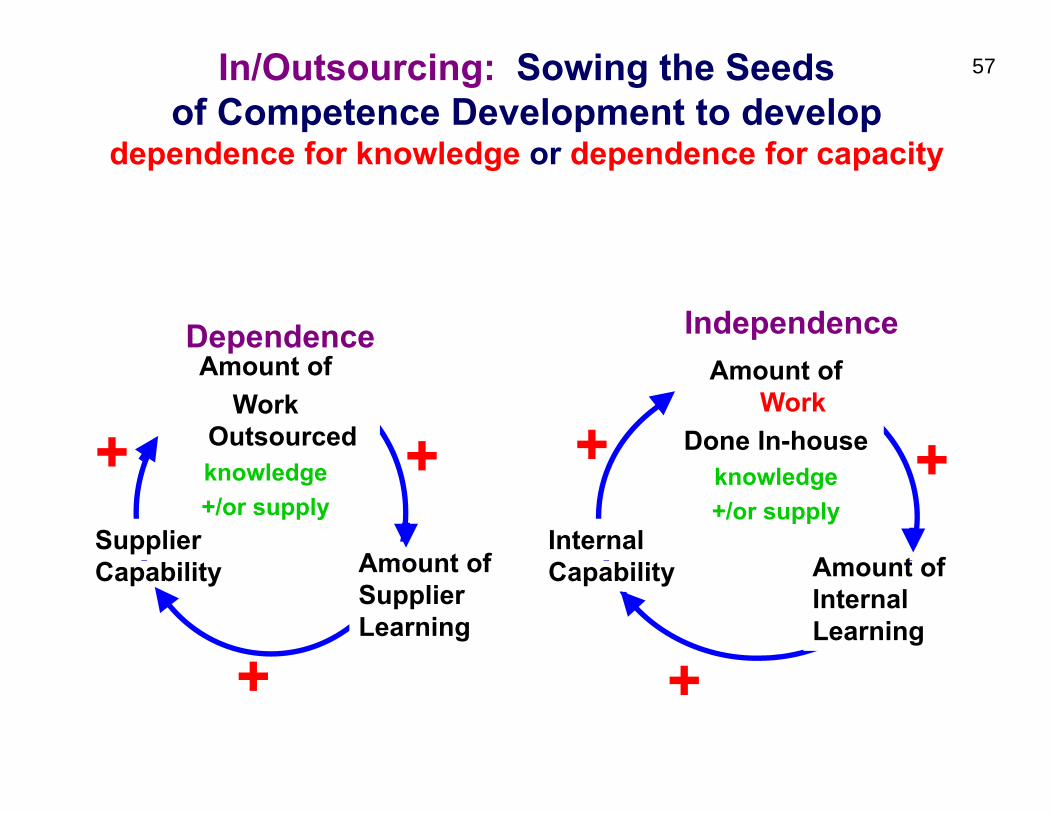
57 In/Outsourcing: Sowing the Seeds of Competence Development to develop
dependence for knowledge or dependence for capacitydependence for knowledge or dependence for capacity
Amount ofWork
Outsourcedknowledge+/or supply
Amount of Supplier
Amount ofSupplierLearning
Capability
Dependence Amount of
Work Done In-house
knowledge+/or supply
A tAmounCapability fInternal
ft oInternalLearning
Independence
+ + ++ ++ + +
+ ++
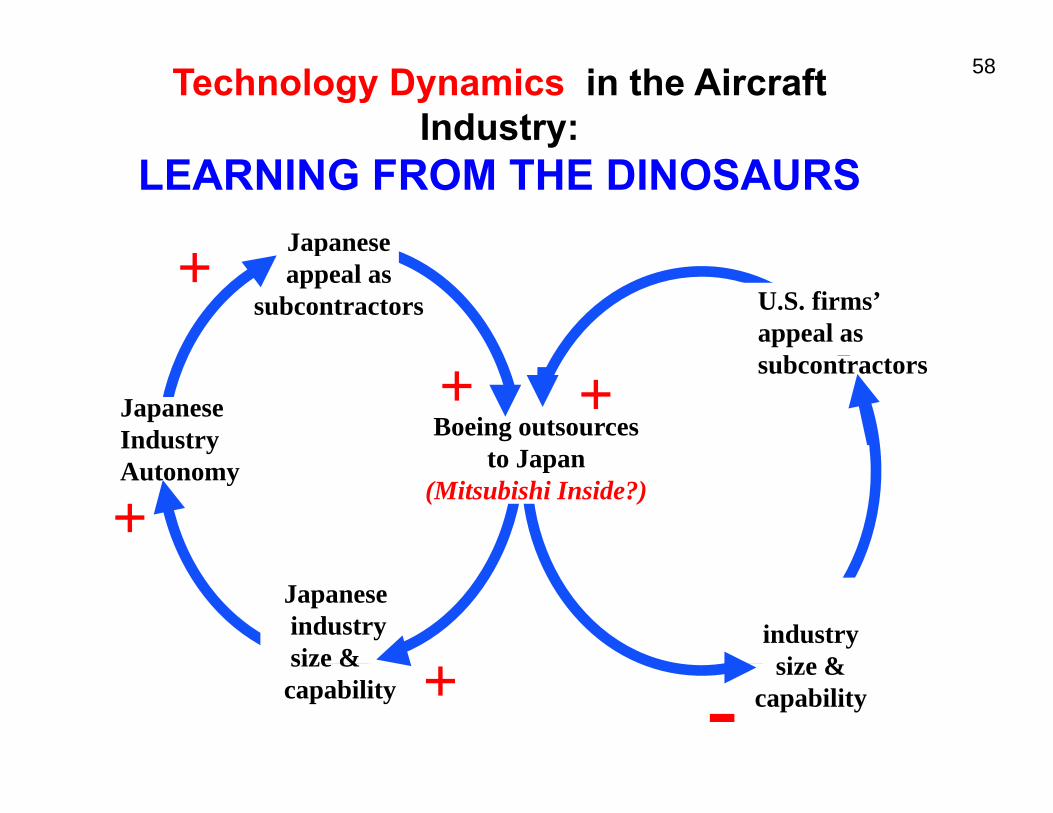
58 Technology Dynamics in the Aircraft Industry:
LEARNING FROM THE DINOSAURS
++
+
+ - capability
Japanesep appeal as
subcontractors U.S. firms’ appeal as subcontractors
Boeing outsources to Japan
Japanese Industry
+ + to Japan
(Mitsubishi Inside?)Autonomy
Japanese industry
U.S.
size & size & industry
size & capability
size &
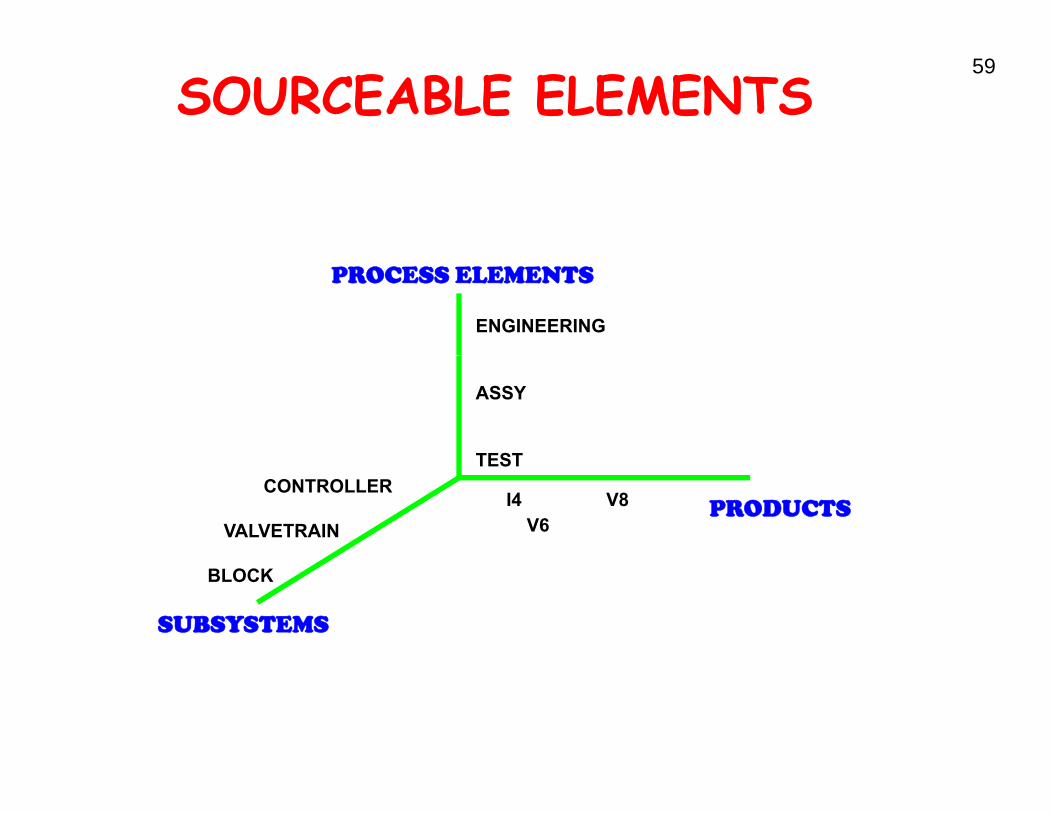
59
SOURCEABLE ELEMENTS
PROCESS ELEMENTS
ENGINEERING
ASSY
TESTTEST CONTROLLER
I4 V6
V8 PRODUCTS VALVETRAIN
BLOCK
SUBSYSTEMS
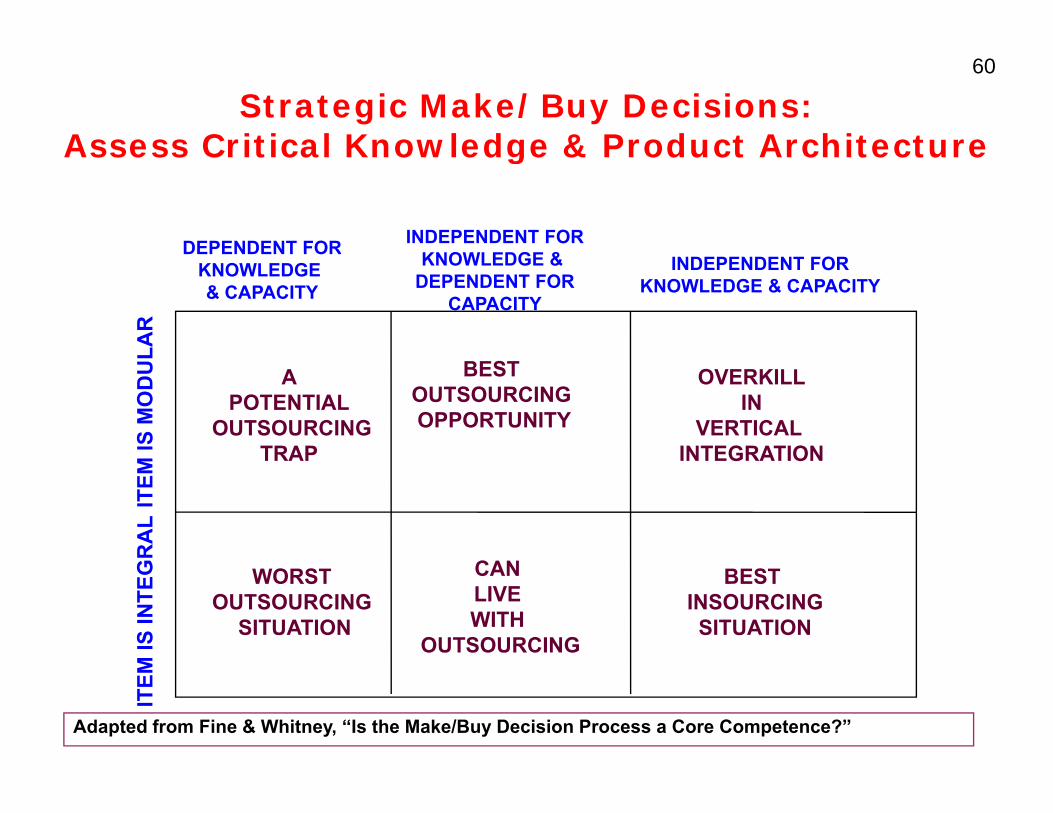
60
Strategic Make/Buy Decisions: Assess Critical Knowledge & Product ArchitectureAssess Critical Knowledge & Product Architecture
INDEPENDENT FORDEPENDENT FOR DEPENDENT FOR KNOWLEDGE & KNOWLEDGE KNOWLEDGE & INDEPENDENT FOR & CAPACITY DEPENDENT FOR KNOWLEDGE & CAPACITY
CAPACITY
OD
ULA
R
BEST OUTSOURCING OPPORTUNITY
A POTENTIAL
OUTSOURCING TRAP
TEM
IS M
O
OVERKILL IN
VERTICAL INTEGRATION
CAN
TRAP
ITTE
GR
AL
INTEGRATION
WORST OUTSOURCING
SITUATION
CAN LIVE WITH
OUTSOURCING
TEM
IS IN
T
BEST INSOURCING SITUATION
I
Adapted from Fine & Whitney, “Is the Make/Buy Decision Process a Core Competence?”
y
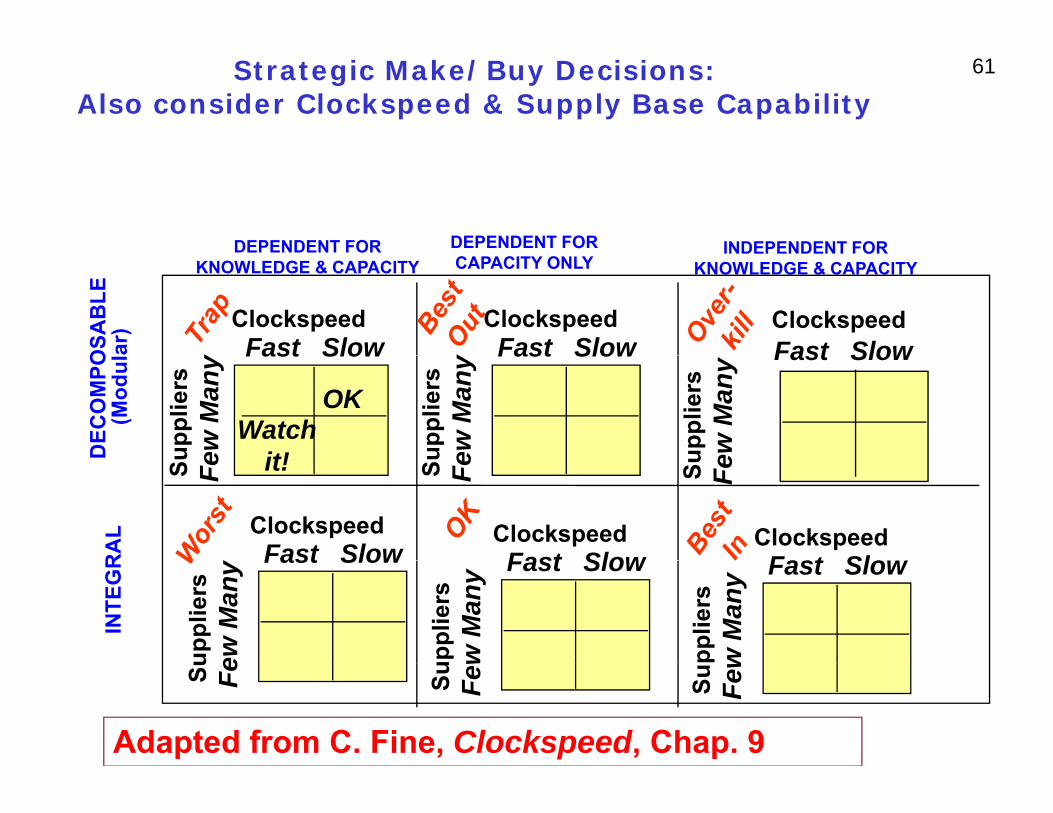
61 Strategic Make/Buy Decisions: Also consider Clockspeed & Supply Base Capability
DEPENDENT FOR DEPENDENT FOR INDEPENDENT FOR INDEPENDENT FOR KNOWLEDGE & CAPACITY CAPACITY ONLY KNOWLEDGE & CAPACITY
OSA
BLE
ar) Clockspeed
y Fast Slow Clockspeed
y Fast Slow Clockspeed Fast Slow
DEC
OM
PO(M
odul
uppl
iers
ew
Man
y Fast Slow
uppl
iers
ew
Man
y Fast Slow
OK Watch
it! uppl
iers
ew
Man
y Fast Slow
RA
L
Su
Fe
Clockspeed Fast Slow
Su
Fe
Clockspeed Fast Slow
it! Su
Fe
Clockspeed Fast Slo
INTE
GR
uppl
iers
ew
Man
y Fast Slow
uppl
iers
w M
any Fast Slow
pplie
rsw
Man
y Fast Slow
Adapted from C. Fine, Clockspeed, Chap. 9
Su
Fe
Su Few
Su Few
�
•••
••• Competitive
Position:Position:• Advantage• Parity• Disadvantage
N
•••
•••
••
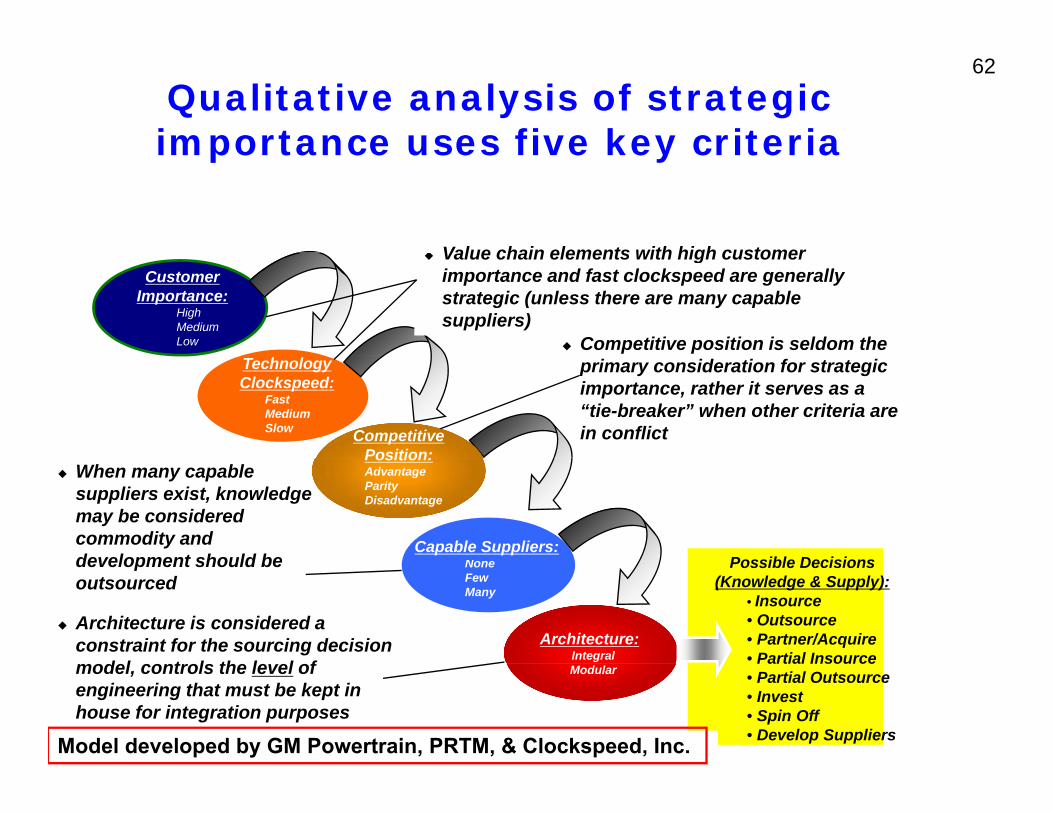
62
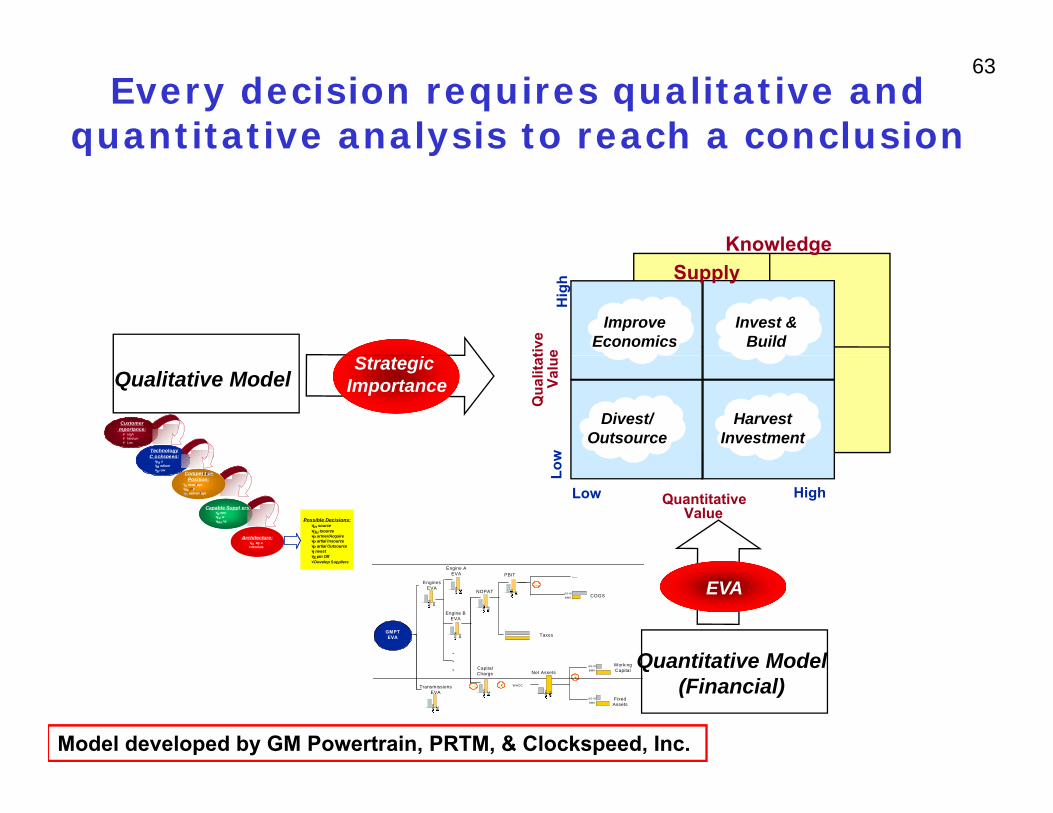
Qualitative analysis of strategic importance uses five key criteriaimportance uses five key criteria
Value chain elements with high customer
�
�
Customer Importance:
High Medium Low
� Value chain elements with high customer importance and fast clockspeed are generally strategic (unless there are many capable suppliers)
� Competitive position is seldom the Technology Clockspeed:
Fast Medium Slow Competitive
Position:
primary consideration for strategic importance, rather it serves as a “tie-breaker” when other criteria are in conflict
Capable Suppliers: Possible Decisions
Position: Advantage Parity Disadvantage
When many capable suppliers exist, knowledge may be considered commodity and development should be
Few Many
(Knowledge & Supply): development should be None
Architecture: Integral
Possible Decisions
• Insource • Outsource
outsourced
Architecture is considered a • Partner/Acquire • Partial Insource
constraint for the sourcing decision d l t l th l l f Modular
Partial Insource • Partial Outsource • Investengineering that must be kept in • Spin Off • Develop Suppliers
model, controls the level of
house for integration purposes
Criteria are applied differently for Products than for Subsystems Model developed by GM Powertrain, PRTM, & Clockspeed, Inc.
Clocks eed:
I
l pt
i
t r lr
i i
trit
t
63
ga evannoitisPo
yPad
: A
p
¥¥
d
ttemCo
egavanas
Every decision requires qualitative and quantitative analyysis to reach a conclusionq
Knowledgge
Supply
Improve Invest & Economics Build
Hig
h
StrategicQualitative Model Importance
Qua
litatt
ive
eeVa
lu
Divest/ HarvestCustomer mportance:
¥ High ¥ Medium Outsource Investment¥ Low
Technology C ockspeed:
¥Fa s ¥M edium ¥Sl ow
CompetitivevePosition:
¥A dvantage
Loww
Low High¥Pa rity¥Di¥Di sadvantage Quantitative
ValueCapable Suppl ers:
¥N one ¥Fe w ¥Ma ny
Architecture: ¥In eg a ¥ Modula
Possible Decisions: ¥In source ¥Ou tsource ¥P artner/Acquire ¥P artial Insource ¥P artial Outsource ¥I nvest ¥S pin Off ¥D l li¥Develop SSuppliers
Engine AEVA PBIT
Revenue
Engines −. EVAEVA
AS
-IS
BIC NOPAT
AS
-IS
BIC
AS-IS BMK COGS
AS
-IS
BIC
AS
-IS
BIC
Engine BEVA
GMPT EVA
.
AS
-IS
BIC Taxes
Quantitative Model. W kiWorking Quantitative ModelCapital AS-IS . BMK CapitalNet AssetsCharge
+. (Financial)X WACC−.Transmissions
AS
-IS
BIC
AS
-IS
BM
KEVA AS-IS Fixed BMK Assets
AS
-IS
BIC
Model developed by GM Powertrain, PRTM, & Clockspeed, Inc.
64
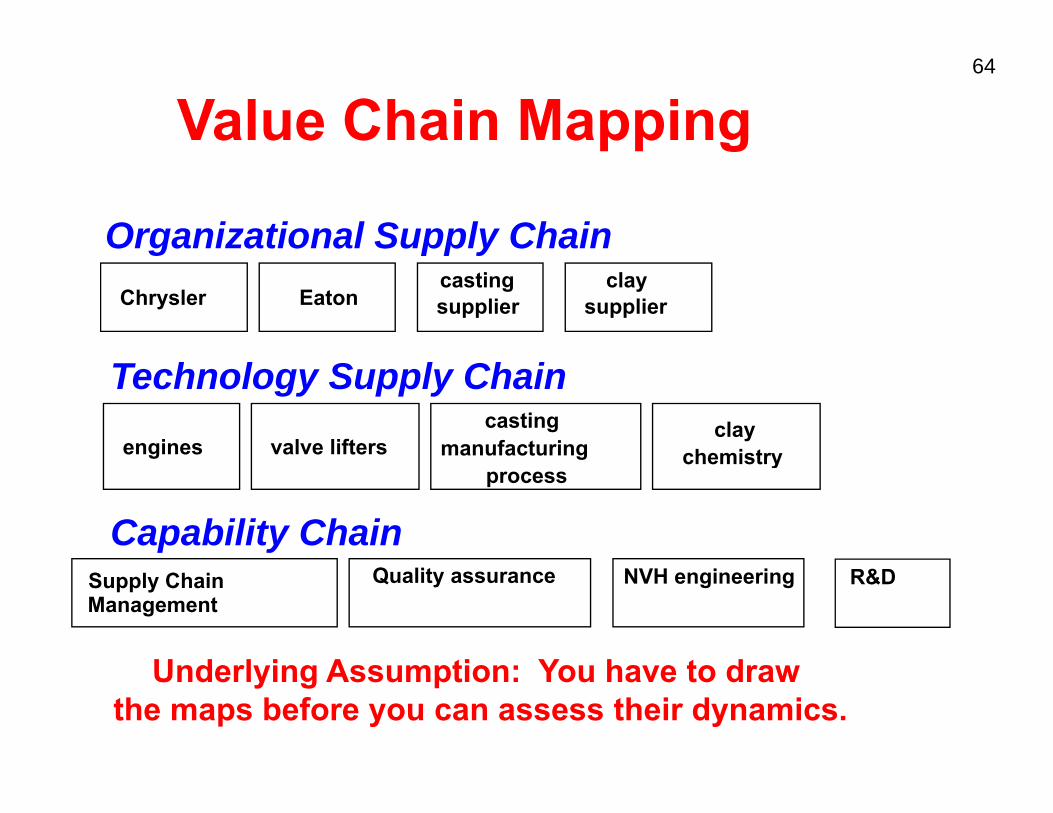
Value Chain Mappinggpp
Orgganizational Supply Chainpp y Chrysler Eaton
casting supplier
clay supplier
Technology Supply Chain
engines valve lifters casting
manufacturing clay
chemistry g g process
chemistry
Capability ChainSupply Chain Management
Quality assurance NVH engineering R&D
U dUnderllyiing AAssumpti tion: YYou hhave tto ddraw the maps before you can assess their dynamics.
65
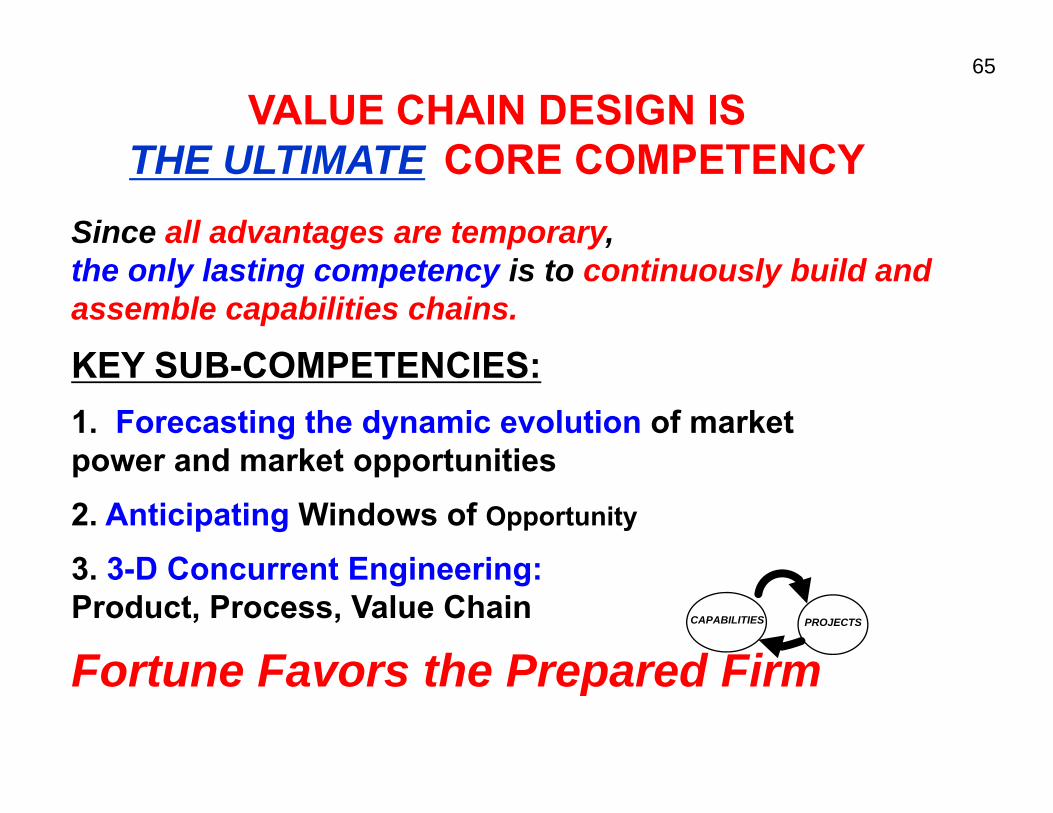
VALUE CHAIN DESIGN ISTHE ULTIMATE CORE COMPETENCYTHE ULTIMATE CORE COMPETENCY
Since all advantages are temporary, the only lasting competency is to continuously build and assemble capabilities chains.
KEY SUB COMPETENCIESKEY SUB-COMPETENCIES: 1. Forecasting the dynamic evolution of market power and market opportunitiespower and market opportunities 2. Anticipating Windows of Opportunity
33. 33-D CD Concurrent Engiineering:t E i Product, Process, Value Chain
Fortune Favors the Prepared Firm CAPABILITIES PROJECTS
Fortune Favors the Prepared Firm
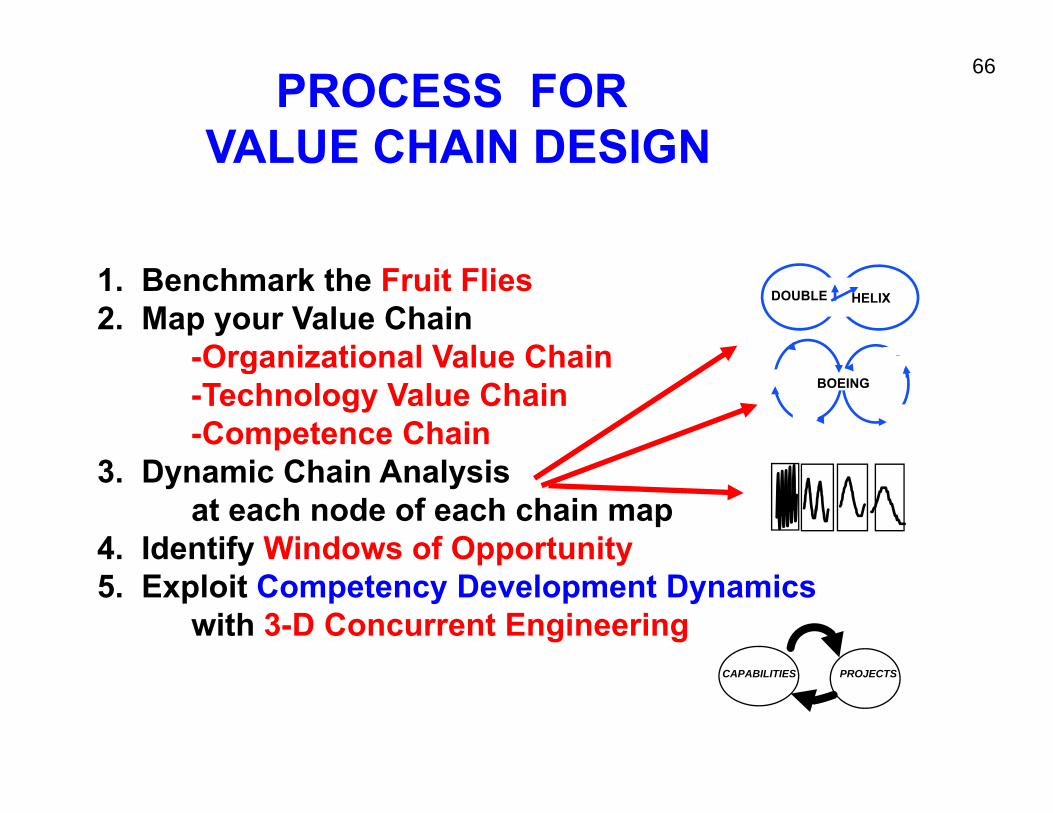
66 PROCESS FOR
VALUE CHAIN DESIGNVALUE CHAIN DESIGN
1. Benchmark the Fruit Flies 2. Map your Value Chain
Organizational Value Chain -Organizational Value Chain-Technology Value Chain-Competence Chain
3. Dynamic Chain Analysis
4. Identifyy Windows of Opportunitypp 5. Exploit Competency Development Dynamics
with 3-D Concurrent Engineering
HELIXDOUBLE
BOEING
at each node of each chain map y
CAPABILITIES PROJECTS
67 In-depth Exercise 2: Value Chain AnalysisValue Chain Analysis
Consider these five industries or an industry of your choice:Consider these five industries or an industry of your choice: -Food -Defense aircraft -AutomobilesAutomobiles -Handheld electronic organizers/communicators -Music
At each table, pick ONE industry: What are the key dependency relationships in the value chain? WhWhatt are the opporttunities ffor outtsourciing??th itiWhat are the windows of opportunity in the chain?
68
“Takeawayys” from the dayy
1.Value Chains are dynamic i d t t t d i-industry structure dynamics
-technology & innovation dynamicst d h l d i -customer and channel dynamics
2.Innovation happens along the value chain d i th l h i d l it lf and in the value chain model itself.
3.All advantage is Temporary 4 St t i S i i k l4. Strategic Sourcing is a key leverage
point for supply chain design. 5 S l Ch i i ti h lti l 5.Supply Chain organizations have multiple
strategic roles to play.
69
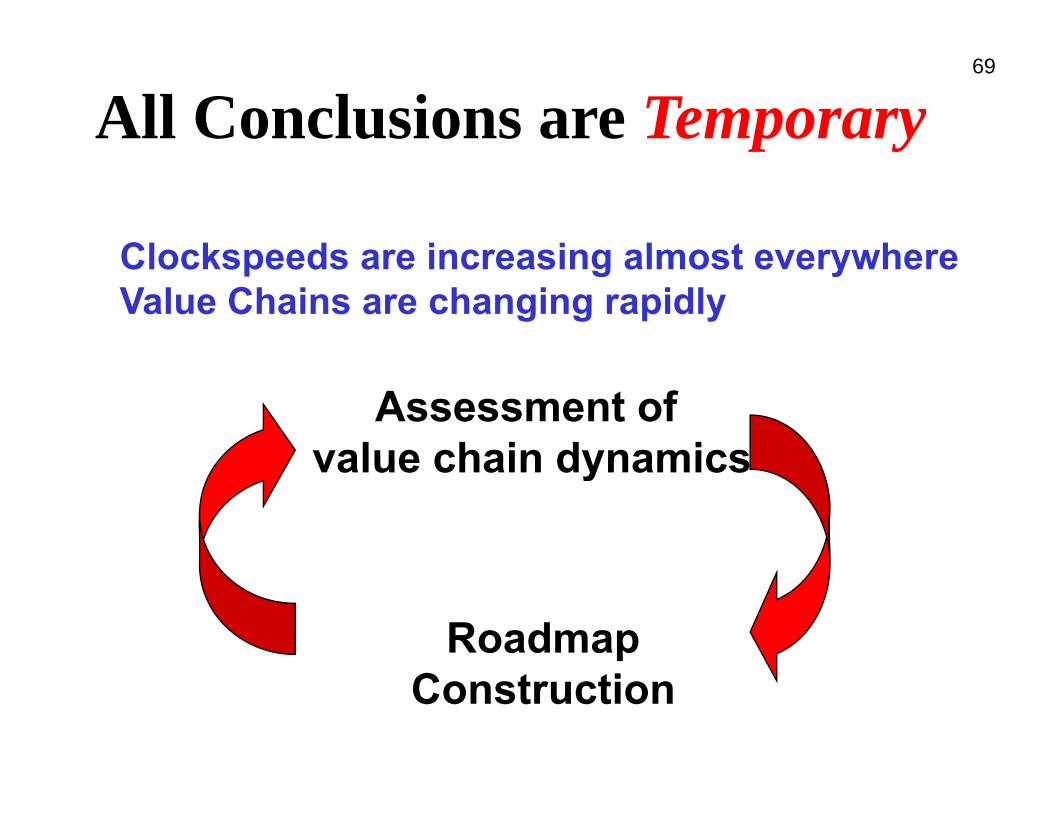
All Conclusions are Tempporaryy
ClockspeedsClockspeeds are increasing almost everywhereare increasing almost everywhere Value Chains are changing rapidly
value chain dynamics Assessment of
value chain dynamics
RoadmapConstruction
70
am cs
71
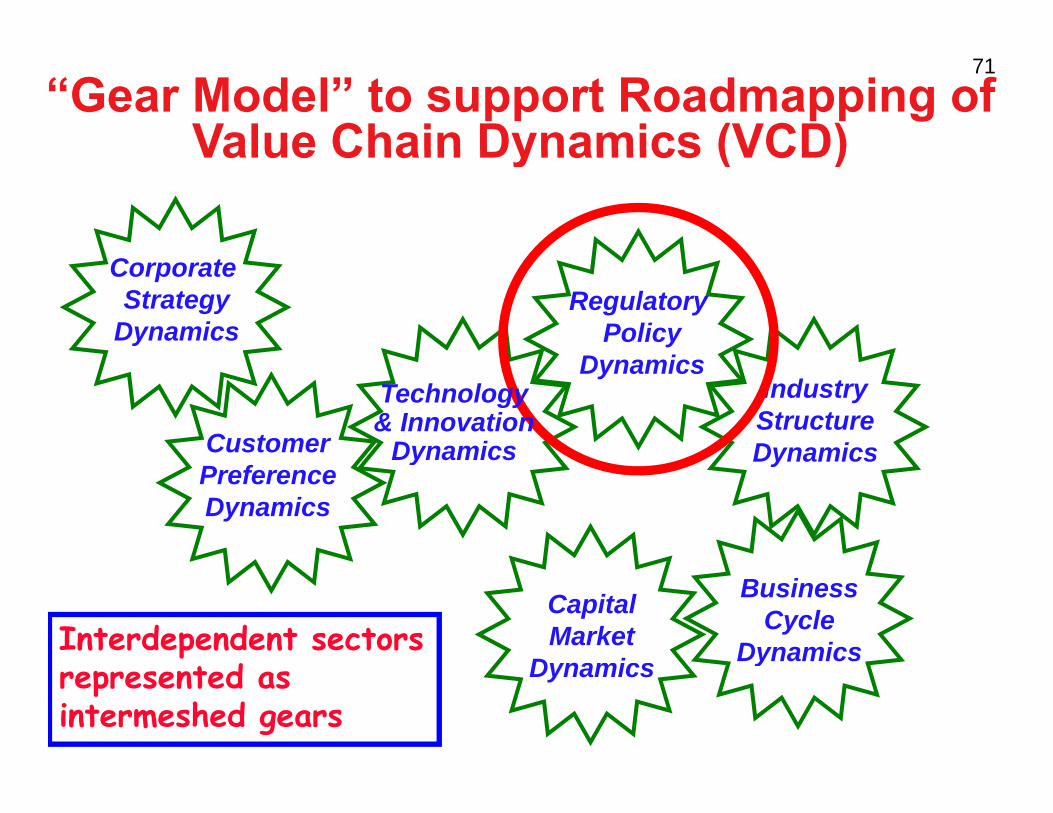
“Gear Model” to support Roadmapping ofValue Chain Dynamics (VCD)Value Chain Dynamics (VCD)
Regulatory Policy
D i
Corporate Strategy
Dynamics Dynamics
Industry Structure DynamicsCustomer
Technology& Innovation
Dynamics DynamicsPreference Dynamics
Dynamics
Business Cycle
Dynamics
Capital Market
D n iInterdependent sectors
d yDynamicsrepresented as
intermeshed gears
72 A long, long time a go in an industry far awayindustry far away . . .
73 Sh
are
of RR
even
ue
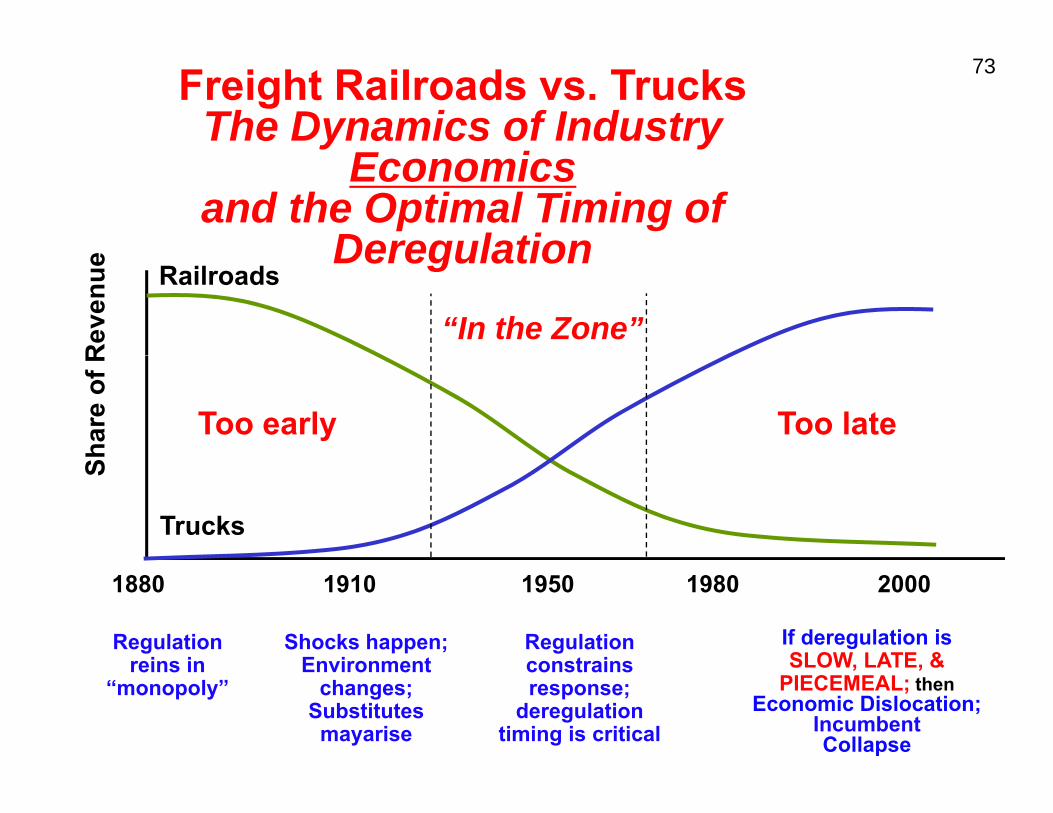
Freight Railroads vs. Trucks The Dynamics of Industry
Economicsand the Optimal Timing of
DeregulationRailroads
Deregulation
“In the Zone”
Too early Too late
Trucks
1880 1910 1950 1980 2000
Regulation Shocks happen; Regulation If deregulation is reins in reins in Environment constrains SLOW LATE &Environment constrains SLOW, LATE, &
“monopoly” changes; response; PIECEMEAL; then Substitutes deregulation Economic Dislocation;mayarise timing is critical Incumbent
Collapse
t
t t
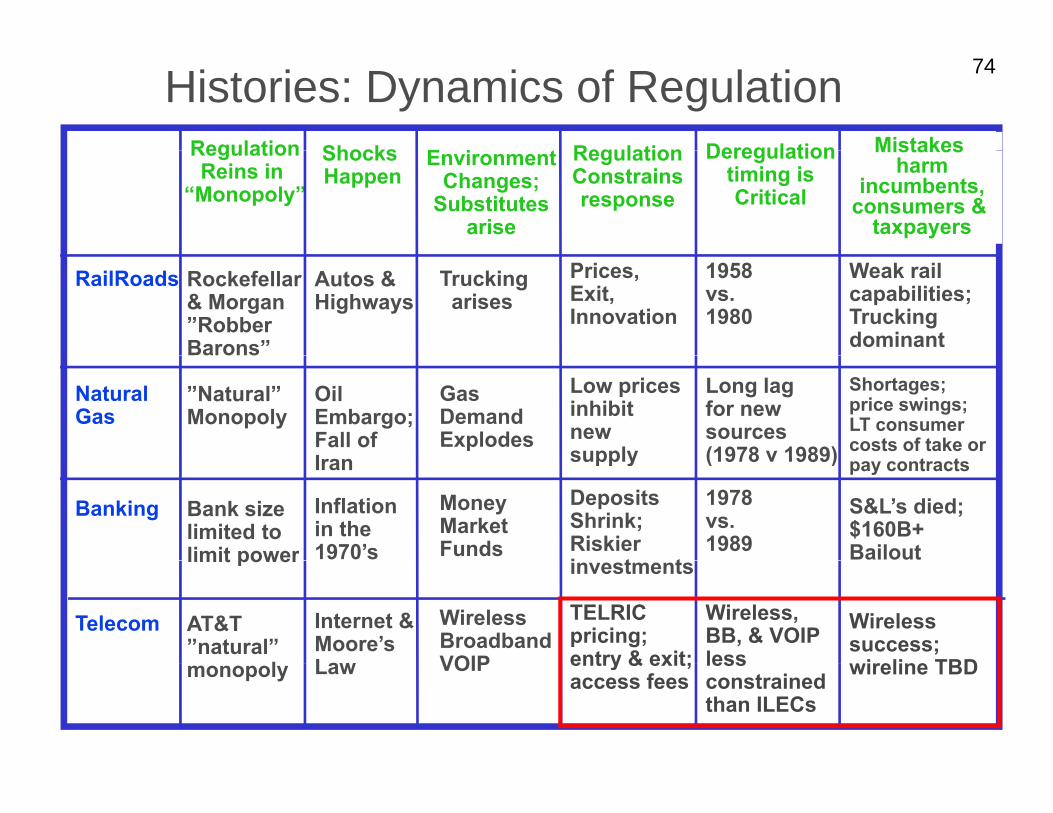
74 Histories: Dynamics of Regulation Regulation RegulationE iShocks Deregulation MistakesRegulation Reins in
“Monopoly”
Regulation Constrains response
Environment Changes;
Substitutes arise
Shocks Happen
Deregulation timing isCritical
Mistakes harm
incumbents,consumers &
taxpayers
RailRoads Rockefellar & Morgan”Robber Barons”
Autos & Highways
Truckingarises
Prices, Exit, Innovation
1958 vs. 1980
Weak rail capabilities;Truckingdominant
Natural Gas
”Natural” Monopoly
Oil Embargo;Fall of I
Gas Demand Explodes
Low pricesinhibit new supply
Long lagfor new sources (1978 v 1989)
Shortages;price swings;LT consumer costs of take or
Banking Bank size limited to limit power
Iran
Inflation in the 1970’s
MoneyMarket Funds
supply
DepositsShrink; Riskier i t t
(1978 v 1989)
1978 vs. 1989
pay contracts
S&L’s died; $160B+ Bailout
Telecom
limit power
AT&T ”natural”
l
Internet & Moore’s Law
Wireless Broadband VOIP
investments
TELRIC pricing;entry & exit;
Wireless, BB, & VOIP less
Wireless success;
ireline TBD monopoly Law VOIP entry & exit; access fees
less constrained than ILECs
wireline TBD
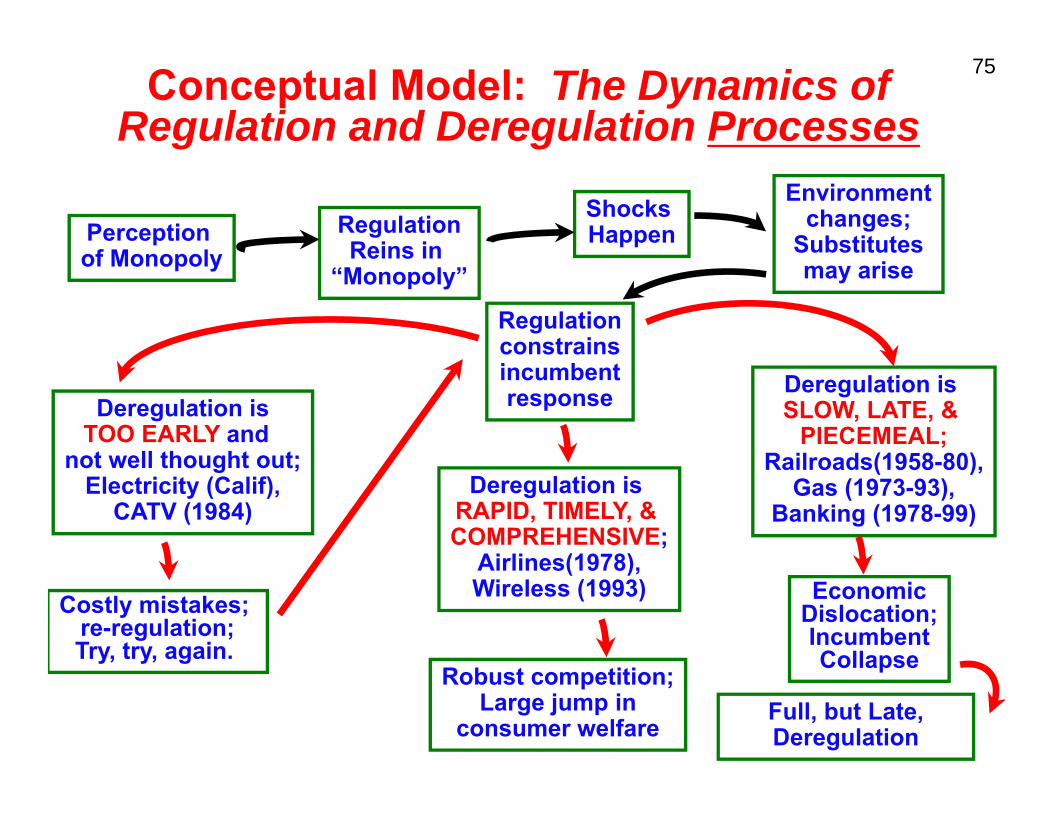
75 Conceptual Model: The Dynamics ofRegulation and Deregulation Processes
RegulationReins in
Shocks HappenPerception
f M l Reins in “Monopoly”
of Monopoly
Regulationconstrains incumbent responseDeregulation is
TOO EARLY and not well thought out; not well thought out;
Electricity (Calif),CATV (1984)
Deregulation isRAPID, TIMELY, & COMPREHENSIVE;
Airlines(1978)Airlines(1978), Wireless (1993) Costly mistakes;
re-regulation;Try, try, again.y y g
Robust competition;Large jump in
consumer welfare
Environment changes;
Substitutes may arise
Deregulation isSLOW, LATE, &
PIECEMEAL; Railroads(1958 80)Railroads(1958-80),
Gas (1973-93),Banking (1978-99)
Economic Dislocation;Incumbent CollapseCollapse
Full, but Late, Deregulation
•
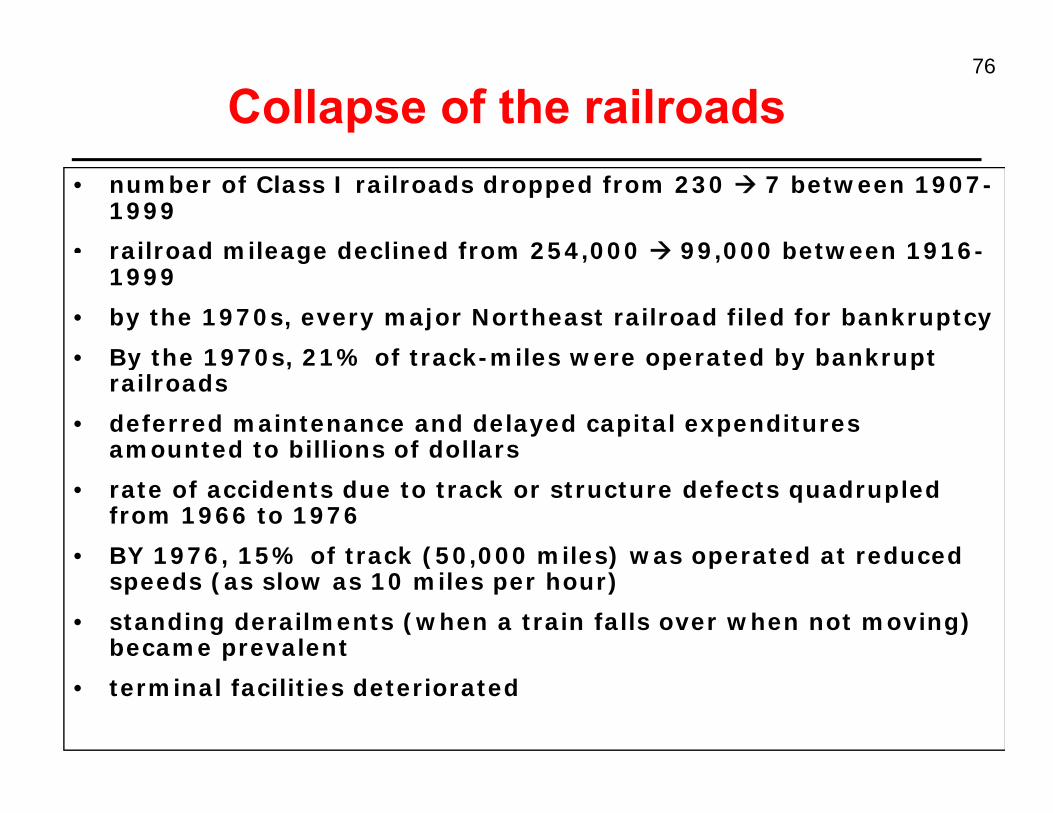
76
Collapse of the railroads • number of Class I railroads dropped from 230 Æ 7 between 1907-
1999
• railroad mileage declined from 254 000 Æ 99 000 between 1916-railroad mileage declined from 254,000 Æ 99,000 between 1916 1999
• by the 1970s, every major Northeast railroad filed for bankruptcy
• By the 1970sBy the 1970s, 21% of track-miles were operated by bankrupt • 21% of track miles were operated by bankrupt railroads
• deferred maintenance and delayed capital expenditures amounted to billions of dollars
• rate of accidents due to track or structure defects quadrupled from 1966 to 1976
• BY 1976, 15% of track (50,000 miles) was operated at reduced BY 1976, 15% of track (50,000 miles) was operated at reduced speeds (as slow as 10 miles per hour)
• standing derailments (when a train falls over when not moving) became prevalent
• terminal facilities deteriorated
77
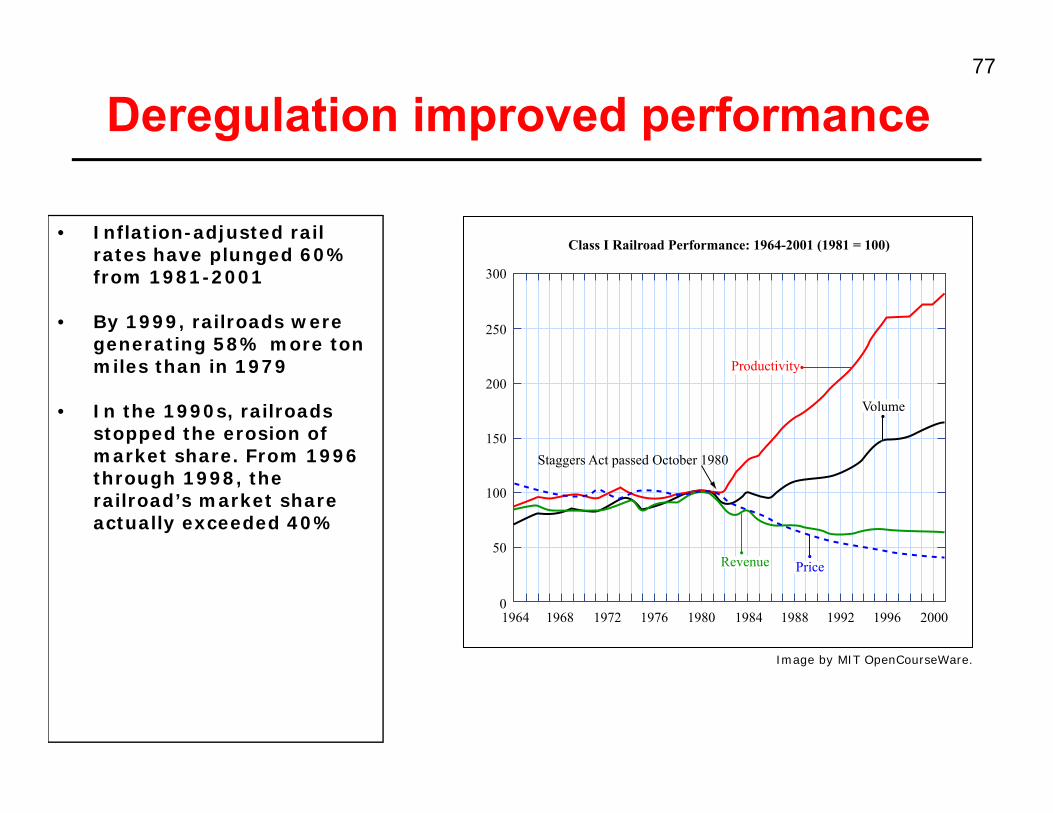
Deregulation improved performance
market share. From 1996
• Inflation-adjusted rail rates have plunged 60% rates have plunged 60% from 1981-2001
• By 1999, railroads were generating 58% more ton miles than in 1979
• In the 1990s, railroads stopped the erosion of market share From 1996 through 1998, the railroad’s market share actually exceeded 40%
300
250
200
150
100
50
01964 1968 1972 1976 1980 1984 1988 1992 1996 2000
Staggers Act passed October 1980
Class I Railroad Performance: 1964-2001 (1981 = 100)
Revenue Price
Volume
Productivity
Image by MIT OpenCourseWare.
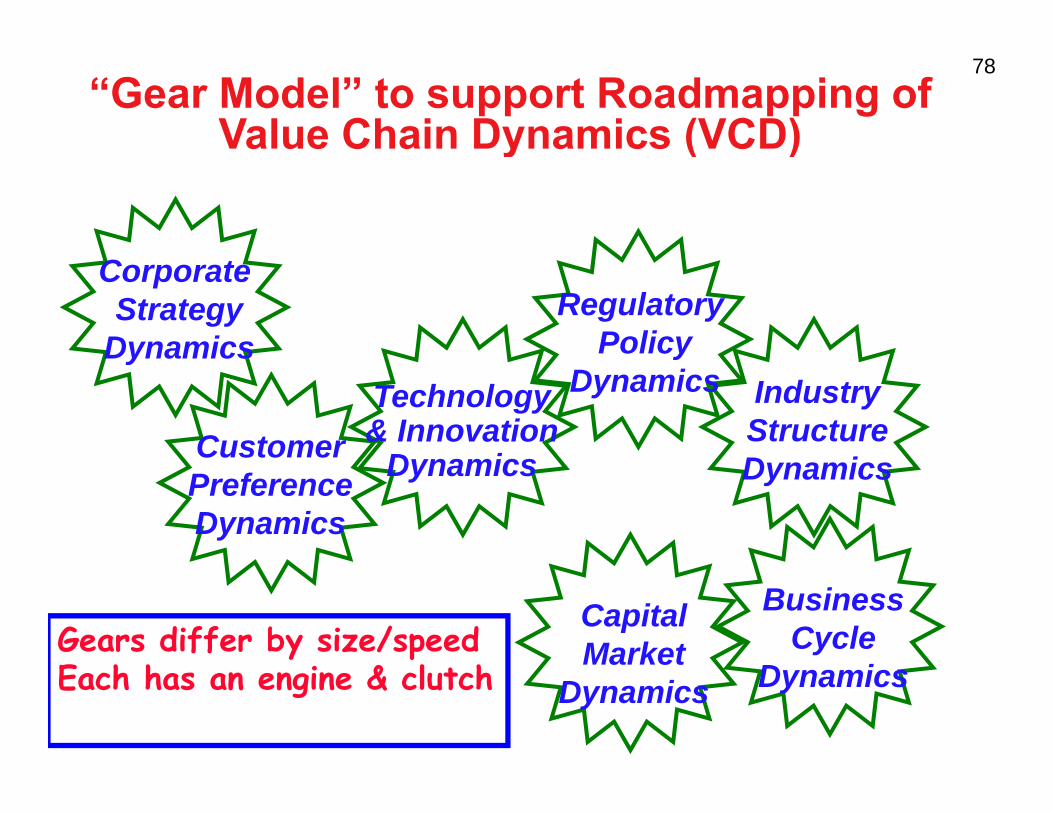
78 “Gear Model” to support Roadmapping of
Value Chain Dyynamics ((VCD))
Regulatory Policy
Corporate Strategy
Dynamics y Dynamics
Dynamics Industry Structure D i
Customer Technology& Innovation
D i DynamicsPreference Dynamics
Dynamics
Business Cycle
Capital MarketGears differ by size/speed
DynamicsMarket
DynamicsEach has an engine & clutch
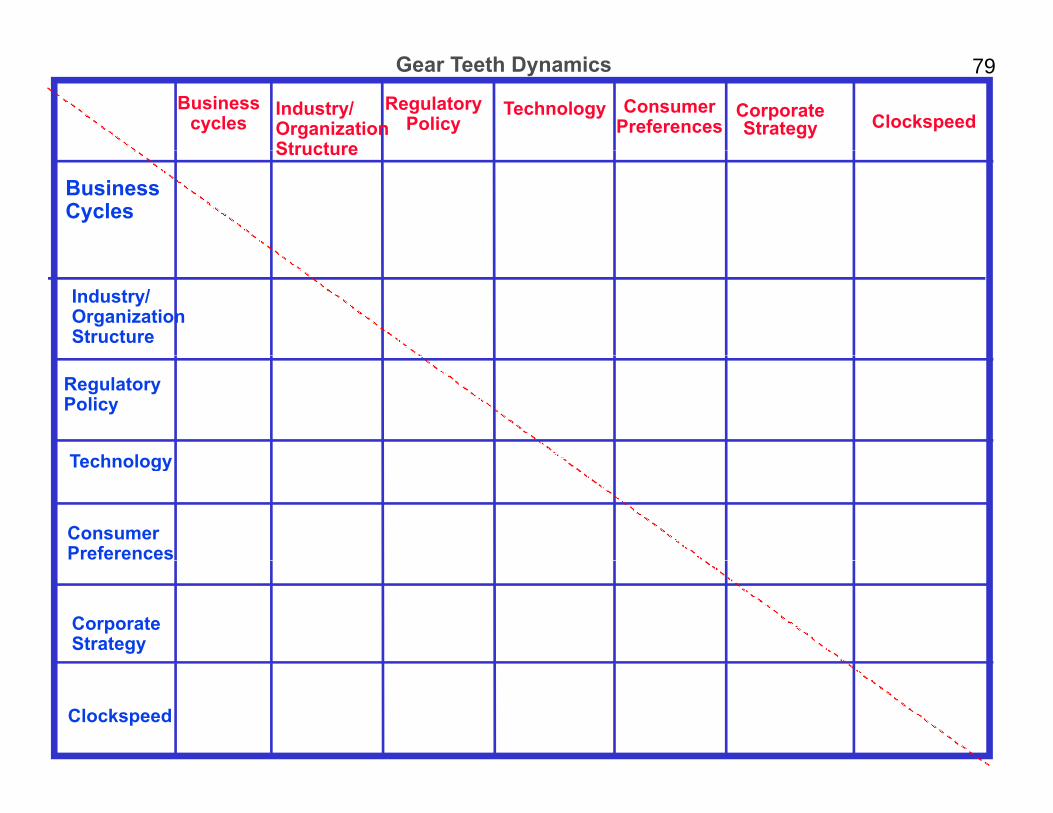
79 Gear Teeth Dynamics
Business cycles
Technology RegulatoryPolicy
Consumer Preferences
CorporateStrategy Clockspeed
Industry/OrganizationStructure
Business Cycles
Structure
Industry/OrganizationStructure
RegulatoryPolicy
TechnologyTechnology
Consumer Preferences
CorporateStrategy
Clockspeed
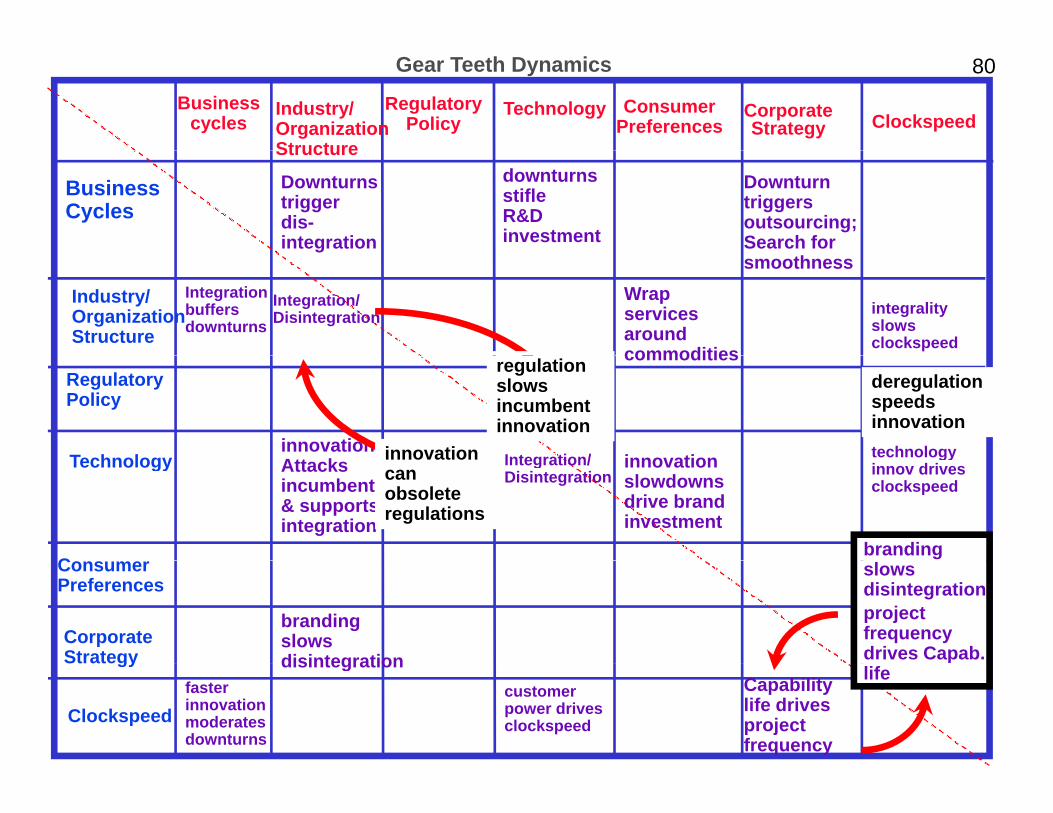
80Gear Teeth Dynamics
Businesscycles
TechnologyRegulatoryPolicy
Industry/OrganizationStructure
ConsumerPreferences
CorporateStrategy Clockspeed
Structure
BusinessCycles
Downturnstriggerdis-integration
downturnsstifleR&D investment
Downturntriggersoutsourcing;Search forsmoothness
Industry/Organization Structure
Integrationbuffersdownturns
Wrap services around commodities
Integration/Disintegration integrality
slows clockspeed
Regulatory Policy
Technologyinnovation
innovation
commodities
Integration/ technology
regulation slows incumbent innovation
innovation
deregulation speeds innovation
Technology
C
Attacks incumbents & supportsintegration
innovationslowdowns drive brand investment
Integration/Disintegration
branding
gyinnov drives clockspeed
innovation can obsolete regulations
ConsumerPreferences
Corporate Strategy
brandingslows disintegration
slows disintegrationproject frequency drives Capab.
fasterinnovationmoderatesdownturns
Strategy
Clockspeed
disintegrationCapability life drives project frequency
lifecustomer power drives clockspeed

81 Mother Nature strikesThe Cell Phone Supply ChainThe Cell Phone Supply Chain
8:00 pm, Friday 17 March 2000: Lightning Strikes an ASIC semiconductor plant of Philips in Albuquerque, New Mexico, USA 8:10 ppm: Fire is extingguished. Plant will be down for months.
LESSON: RESPONSE SPEED
PhilipsChip Factory
Image by MIT OpenCourseWare
Ericsson Cell Phones
Nokia Cell Phones
Image by MIT OpenCourseWare
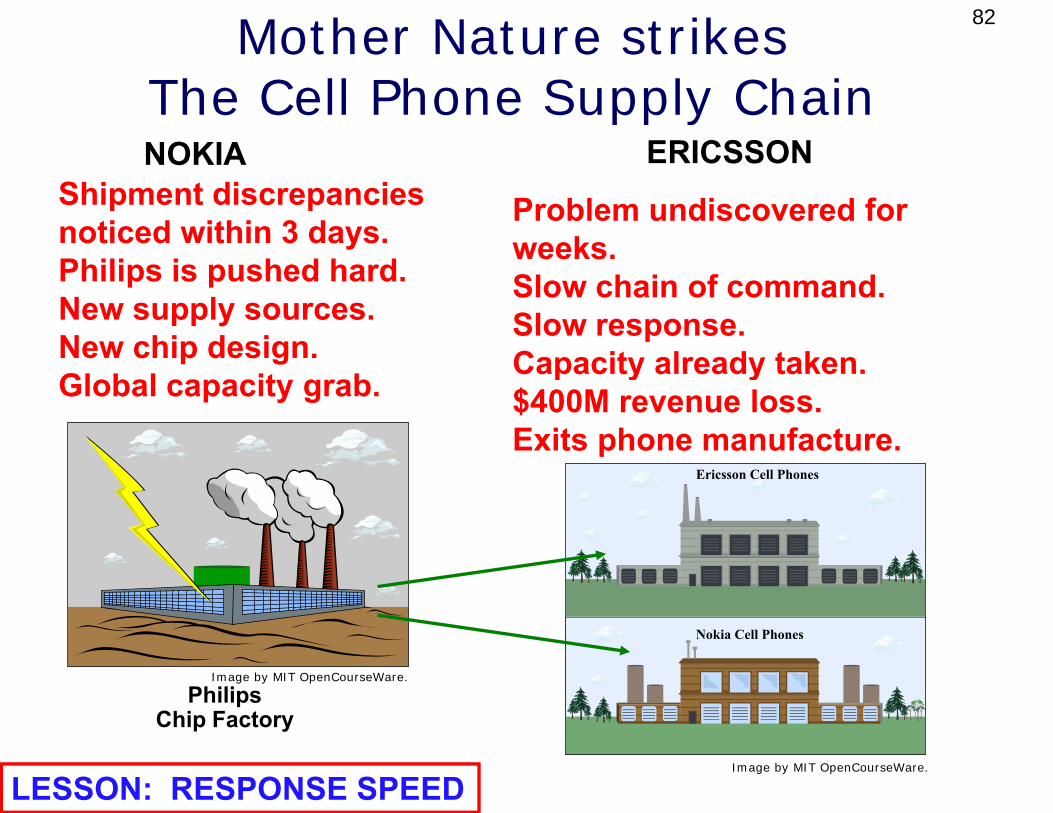
82 Mother Nature strikesThe Cell Phone Supply ChainThe Cell Phone Supply Chain NOKIA ERICSSON
Shipment discrepancies Problem undiscovered for noticed within 3 days. weeks.Philips is pushed hard Philips is pushed hard. Slow chain of command. New supply sources. Slow response.New chip design. Capacity already taken.Global capacity grab.
Capacity already taken. $400M revenue loss. Exits phone manufacture.
LESSON: RESPONSE SPEED
PhilipsChip Factory
Image by MIT OpenCourseWare.
Image by MIT OpenCourseWare.
Ericsson Cell Phones
Nokia Cell Phones

83
RFID tags pushthe boundaries of the Edgethe boundaries of the Edge
(Research Assistant: Natalie Klym)
1. DoD wartime needs will prime the pump for RFID technology and applications.
2. Walmart will add to this effect: box & pallet.3. Pharmacies will do the same for item tagging.
RFID tagg Mobile phone chip Microprocessor Mobile phone chip Microprocessor5¢ $20 10B/yr 1B/yr
$80040M/yr
What disruptions will be driven by the explosion of the edge?
84
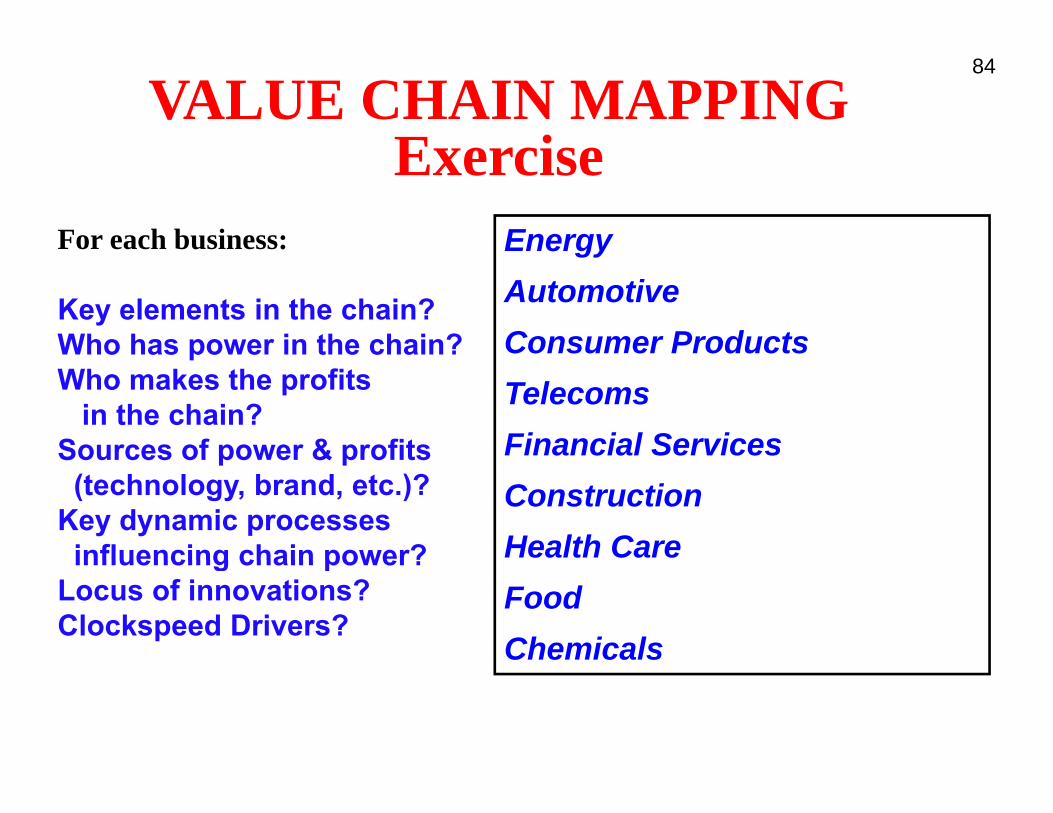
VALUE CHAIN MAPPING ExerciseExercise
For each business:
Key elements in the chain? Who has ppower in the chain? Who makes the profits
in the chain? Sources of power & profits Sources of power & profits (technology, brand, etc.)?
Key dynamic processes influencing chain power? influencing chain power?
Locus of innovations? Clockspeed Drivers?
Energygy Automotive Consumer Products Telecoms Financial Services Construction Health Care Food Chemicals
a s sto s e c
o
85
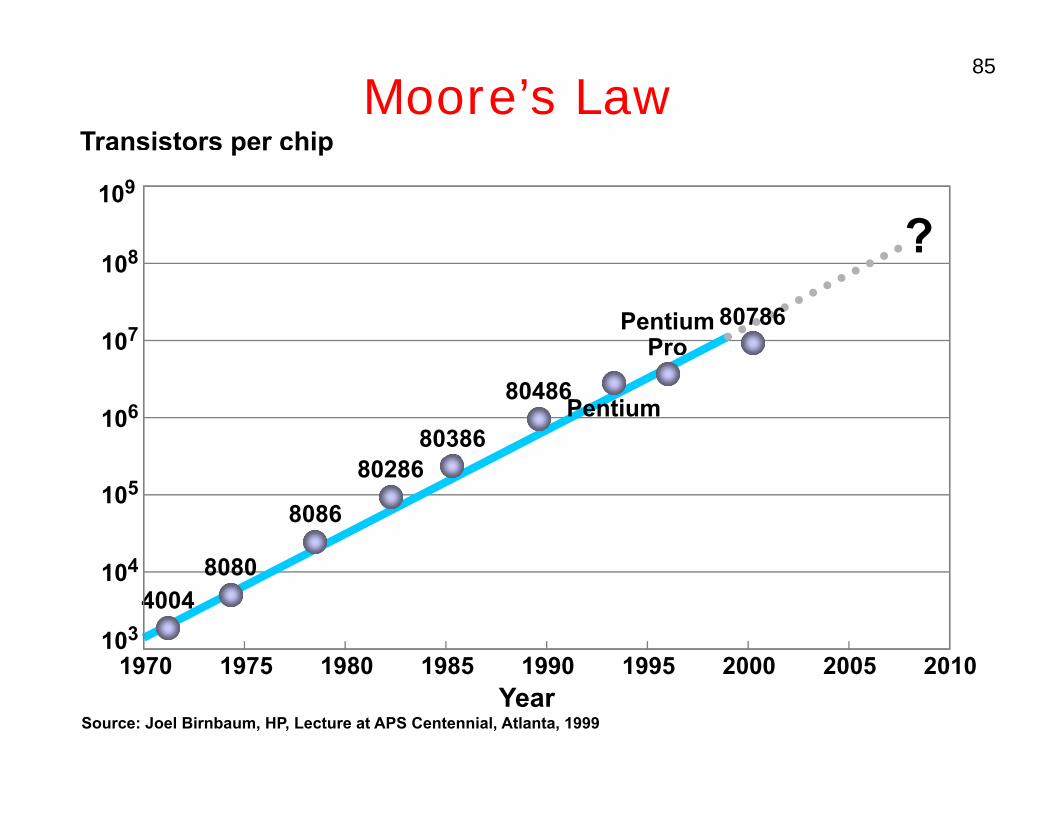
Moore’s LawTransistors pper chipp
109
8 108
107
106
105
4 104
103
1970 1975 1980 1985 1990 1995 2000 2005 2010 Year
? 80786Pentium
Pro
Pentium80486
80386 80286
8086
8080
1970 1975 1980 1985 1990 1995 2000 2005 2010
8080 4004
Source: Joel Birnbaum, HP, Lecture at APS Centennial, Atlanta, 1999
16
86
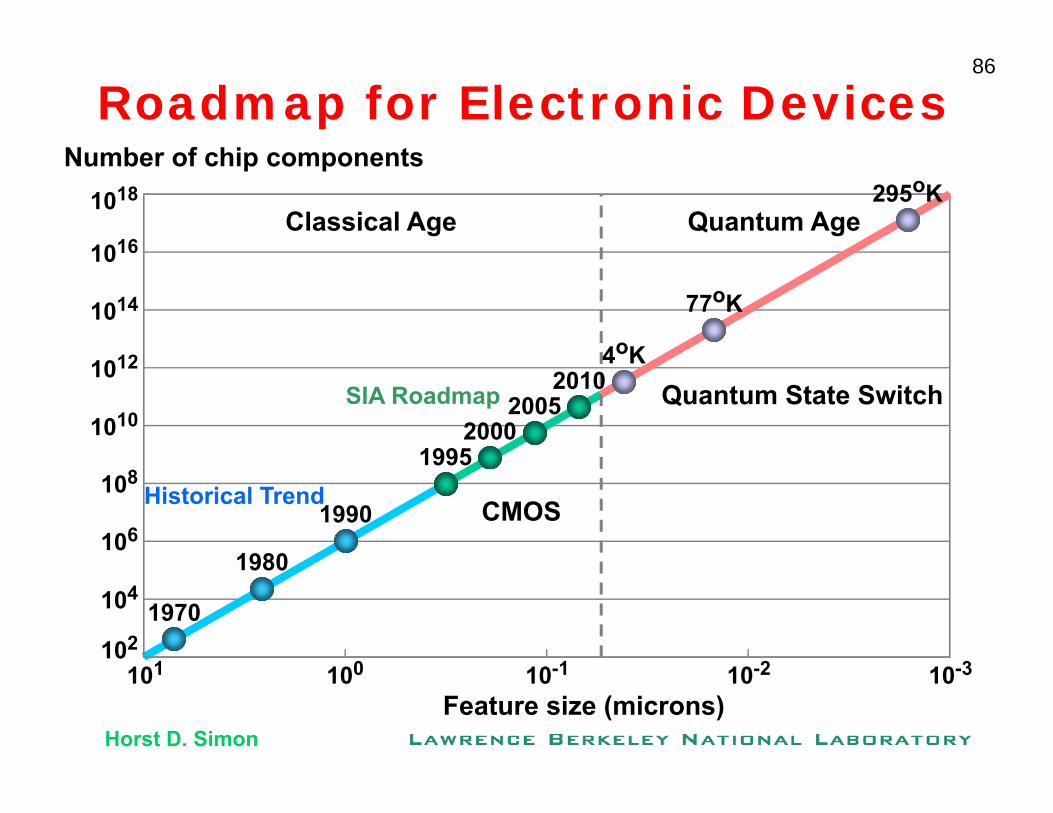
Roadmap for Electronic Devices N b f hi tNumber of chip components
1018
1016 Classical Age Quantum Age
295oK
12
1014
10
4oK
77oK
1010
1012
SIA Roadmap 2010
1995 2000
2005
4 K Quantum State Switch
106
108 Historical Trend CMOS
1995
1980
1990
1 0 1 102
104
2 3
1970
1980
101 100 10-1 10-2 10-3
Feature size (microns) Horst D. Simon
t
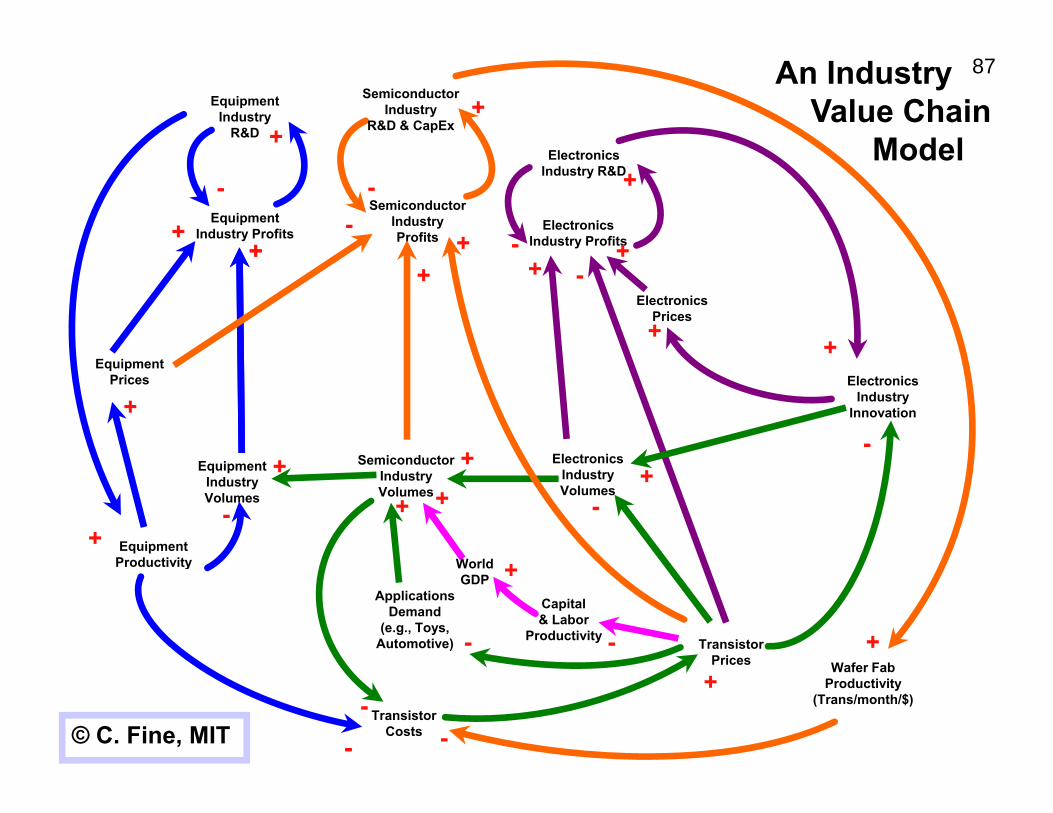
+ Industry Profits Profits + Industry Profits
Electronics ModelModel Equipment Semiconductor
Industry Industry + Value Chain
- +
An Industry 87
R&D + R&D & CapEx
El i Industry R&D
- - + Semiconductor
Equipment - Industry Electronics
++++ + + + -
Electronics Prices +
+ Equipment
Prices Electronics Industry+ Innovation
-Semiconductor
W ld
Electronics Semiconductor ElectronicsEquipment + Industry ++
Industry +IndustryVolumes
© C. Fine, MIT
Volumes+ Volumes
- + -+ Equipment
Productivity WorldProductivity +GDP Applications CapitalDemand & Labor(e.g., Toys, ProductivityAutomotive) - - Transistor +
PricesPrices W f F bWafer Fab + Productivity
- (Trans/month/$) Transistor
Costs ---
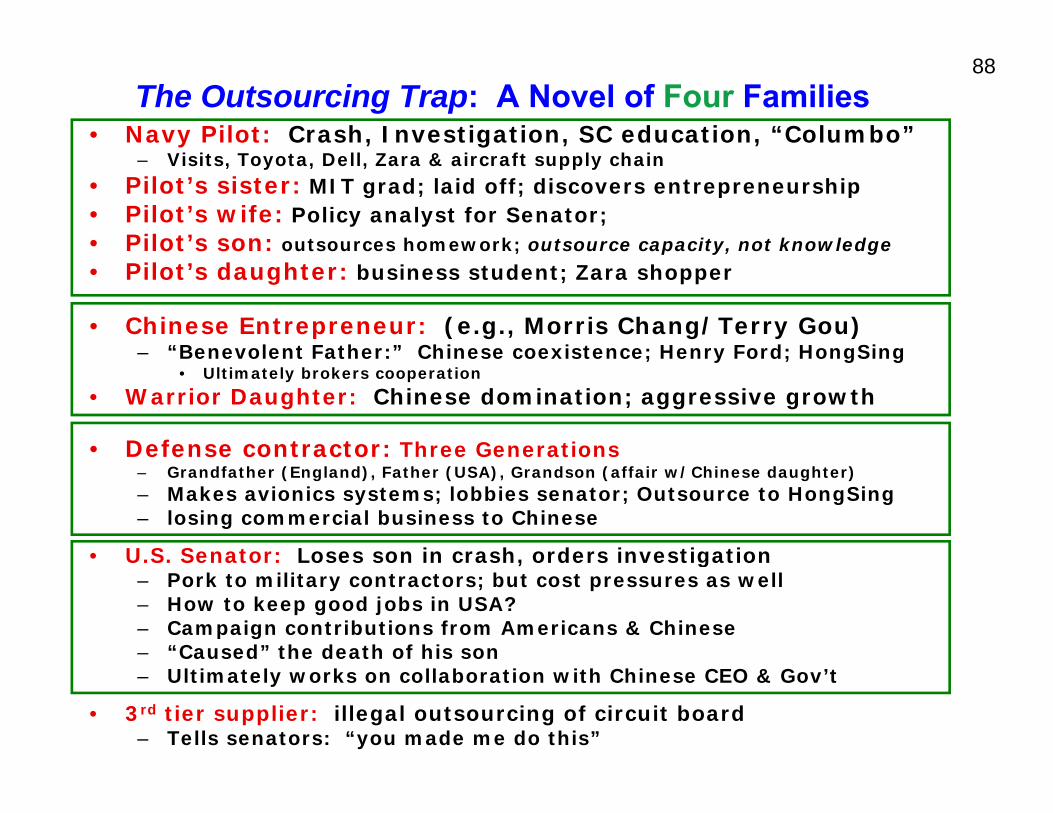
88 The Outsourcing Trap: A Novel of Four Families
• Chinese Entrepreneur: (e.g., Morris Chang/Terry Gou) – “Benevolent Father:” Chinese coexistence; Henry Ford; HongSing Benevolent Father: Chinese coexistence; Henry Ford; HongSing
• Ultimately brokers cooperation
• Warrior Daughter: Chinese domination; aggressive growth
• Defense contractor: Three Generations – Grandfather (England), Father (USA), Grandson (affair w/Chinese daughter) – Makes avionics systems; lobbies senator; Outsource to HongSing – losing commercial business to Chinese
• 3rd tier supplier: illegal outsourcing of circuit board – Tells senators: “you made me do this”
• Navy Pilot: Crash, Investigation, SC education, “Columbo” – Visits, Toyota, Dell, Zara & aircraft supply chain
• Pilot’s sister: MIT grad; laid off; discovers entrepreneurship • Pilot’s wife: Policy analyst for Senator; • Pilot’s son: outsources homework; outsource capacity, not knowledge; p y, g
• Pilot’s daughter: business student; Zara shopper
• U.S. Senator: Loses son in crash, orders investigation U.S. Senator: Loses son in crash, orders investigation – Pork to military contractors; but cost pressures as well – How to keep good jobs in USA? – Campaign contributions from Americans & Chinese – “Caused” the death of his son – Ultimately works on collaboration with Chinese CEO & Gov’t
89
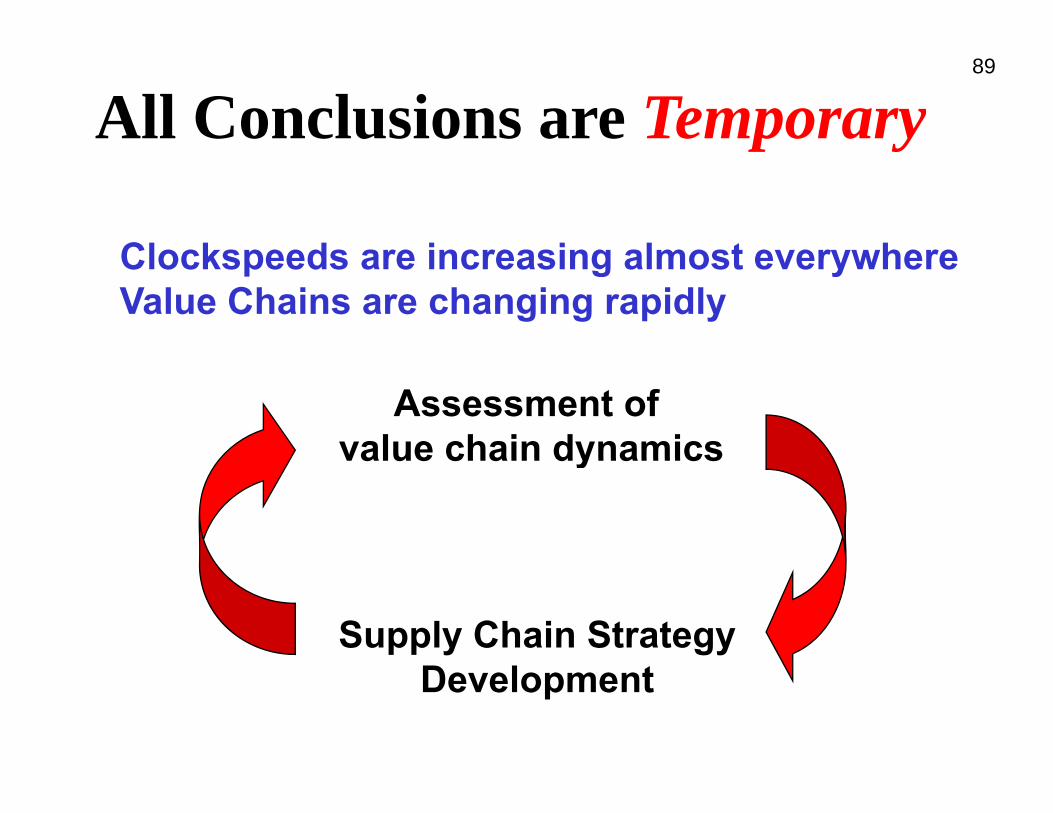
All Conclusions are Tempporaryy
ClockspeedsClockspeeds are increasing almost everywhereare increasing almost everywhere Value Chains are changing rapidly
Assessment of value chain dynamicsvalue chain dynamics
Supply Chain StrategyDevelopment
MIT OpenCourseWarehttp://ocw.mit.edu
15.769 Operations StrategyFall 2010
For information about citing these materials or our Terms of Use, visit: http://ocw.mit.edu/terms.