value fund - series 2 - icici prudential mutual fund | mutual · pdf file ·...
TRANSCRIPT

Value Fund - Series 2Value Fund - Series 2A Close-Ended Equity Scheme
NFO Period: November 18, 2013 to November 29, 2013
OUR VALUE INVESTMENT PHILOSOPHY
GOOD COMPANIESGOOD COMPANIES
DISCOUNTED PRICESDISCOUNTED PRICESat

2
Contents
Why Equities Now?1
Value Investing2
Identifying Value in the market3
Value Investing - Globally4
ICICI Prudential Value Fund Series 25
Key Take Aways6

Why Equities now?
3

Why Equities now? –Valuations lagging Fundamentals
4
• India's market cap to GDP indicates valuations are at historical low.
• The gap between nominal GDP and market cap of BSE has widened post 2010
Source: Bloomberg
INR
bn
0
20,000
40,000
60,000
80,000
100,000
120,000
1993
1994
1995
1996
1997
1998
1999
2000
2001
2002
2003
2004
2005
2006
2007
2008
2009
2010
2011
2012
2013
Nominal GDP Mcap (BSE)
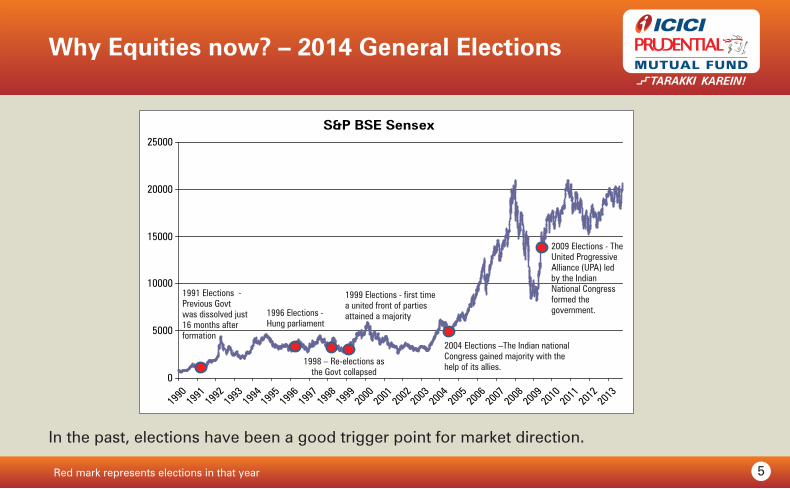
5Red mark represents elections in that year
In the past, elections have been a good trigger point for market direction.
Why Equities now? – 2014 General Elections
S&P BSE Sensex
0
5000
10000
15000
20000
25000
1990
1991
1992
1993
1994
1995
1996
1997
1998
1999
2000
2001
2002
2003
2004
2005
2006
2007
2008
2009
2010
2011
2012
2013
1991 Elections - Previous Govt was dissolved just 16 months after formation
1996 Elections - Hung parliament
1998 – Re-elections as the Govt collapsed
2004 Elections –The Indian national Congress gained majority with the help of its allies.
2009 Elections - The United Progressive Alliance (UPA) led by the Indian National Congress formed the government.
1999 Elections - first time a united front of parties attained a majority

Source: www.bseindia.com and Election Commission of India 6
Why Equities now? –S&P BSE Sensex & Elections
Above chart explains how S&P BSE Sensex has performed post elections.
Provided only for reference and understanding of market movement post elections. Nothing in the slide must be construed as future performance of S&P BSE Sensex.
Elections Absolute Appreciation
Election Year Date Sensex20%
Appreciation50%
Appreciation 70%
Appreciation
1991 21-Jun-91 1361.7 Within 1 year Within 1 year Within 1 year
1996 9-May-96 3694.3 Within 2 years The bull phase that started in 1991ended in 1997.
1998 3-Mar-98 3646.0 Within 2 years Within 2 years
1999 7-Oct-99 4963.1 Within 1 year
2004 13-May-04 5399.5 Within 1 year Within 2 years Within 2 years
2009 16-May-09 12173.4 Within 1 year Within 2 years Within 2 years

7Source:www.bseindia.com
Why Equities now? –Broad Market Valuations
Current valuations below 10 year average, despite some stocks trading at very high valuations
2
3
4
5
6
7
8Sensex P/B Ratio
Avg PB
10
13
16
19
22
25
28Sensex P/E Ratio
Avg PE

8Source: UBS Securities
Why Equities now? –Polarisation of Valuation
Cyclical – Consumer Discretionary, Energy, Financials, Industrials, IT, MaterialsDefensives – Consumer Staples, Healthcare, Telecom, Utilities
• In the past, valuation gap between cyclical and defensives have converged
• Since 2010, the gap has widened and defensives are trading at high valuations
5.0x
10.0x
15.0x
20.0x
25.0x
30.0x
2005
2006
2007
2008
2009
2010
2011
2012
2013
Cyclicals
Defensives
P/E Defensives vs Cyclicals

Source:www.bseindia.com 9
Why Equities now? – Market Segmented
Since the last peak in Nov 2010 the Small and Mid cap stocks are trading at a discount to their Large cap counterparts
Discount is calculated taking Nov’10 index values as base.
S&P BSE Mid Cap S&P BSE Small Cap
Small cap discount toSensex
Mid cap discountto Sensex
50%
60%
70%
80%
90%
100%
Nov-10 Apr-11 Sep-11 Feb-12 Jul-12 Dec-12 May-13 Oct-13
Mid & Small Cap discount to Sensex

Value Investing
10

• Investing in stocks that trade at a discount to their true value.
• Investing at a price lower than what justifies the company’s long term fundamentals.
• Value investing is a long-term strategy - it does not provide instant gratification.
Value Investing
11

Value Investing – Margin of Safety
12
Margin of Safety is the difference between the intrinsic value of a stock and the price arrived at after taking the worst case scenario in calculation of intrinsic value.

13Source: Bloomberg
Understanding Value Investing
• During the period 2011-2013, BSE Sensex remained range bound.• However, during the same period stocks shown above have grown multi fold times.This is a high level oversimplified illustration to explain the concept of Value Investing. Actual results may vary significantly from the ones mentioned here and may not always be beneficial or profitable. The stocks given above should not in any manner be construed as recommendation and ICICI Prudential Mutual Fund/AMC may or may not have any future position in these stocks. There may be other value stocks in the market which may have significantly underperformed large cap stocks. No inference must be drawn that value stocks generate long term performance as there may be cases where such value stocks may actually be value trap.
0
5,000
10,000
15,000
20,000
25,000
30,000
35,000
40,000
Dec/10 Mar/11 Jun/11 Sep/11 Dec/11 Mar/12 Jun/12 Sep/12 Dec/12 Mar/13 Jun/13 Oct/13
S&P BSE Sensex Natco Pharma Ltd Amara Raja Tech Mahindra Ltd
Values rebased to 10,000
Rs 23,662
Rs 22,399
Rs 10,751
Rs 36,214

IDENTIFYING VALUE IN THE MARKET
14

Identifying Value in the Market
• Between 2001 and 2003, the stocks in the consumer basket represented a value buying opportunity.
• Market cap of these stocks did not mirror the consistently growing profits.
• In the ensuing period the market realized the true value of these stocks and market cap soared.
• Consumption basket is currently, trading near historical high valuations
15Source: Morgan Stanley Research
0
1,000
2,000
3,000
4,000
5,000
6,000
7,000
0
20
40
60
80
100
120
140
160
180
1996
1997
1998
1999
2000
2001
2002
2003
2004
2005
2006
2007
2008
2009
2010
2011
2012
2013
Trailing Net Profit
Market Cap (RS)
in INRBn
MS Coverage Consumer Basket - Earningsvs Market Cap
16
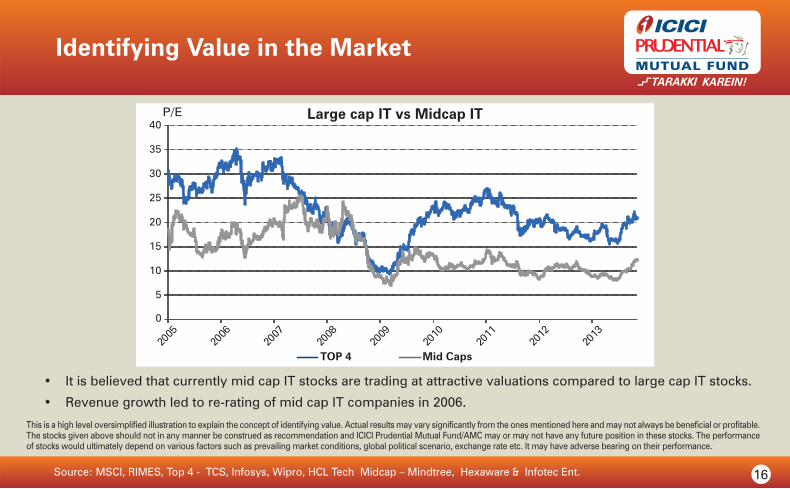
Identifying Value in the Market
• It is believed that currently mid cap IT stocks are trading at attractive valuations compared to large cap IT stocks.
• Revenue growth led to re-rating of mid cap IT companies in 2006.
Source: MSCI, RIMES, Top 4 - TCS, Infosys, Wipro, HCL Tech Midcap – Mindtree, Hexaware & Infotec Ent.
This is a high level oversimplified illustration to explain the concept of identifying value. Actual results may vary significantly from the ones mentioned here and may not always be beneficial or profitable. The stocks given above should not in any manner be construed as recommendation and ICICI Prudential Mutual Fund/AMC may or may not have any future position in these stocks. The performance of stocks would ultimately depend on various factors such as prevailing market conditions, global political scenario, exchange rate etc. It may have adverse bearing on their performance.
TOP 4 Mid Caps
Large cap IT vs Midcap IT
5
0
10
15
20
25
30
35
40
2005
2006
2007
2008
2009
2010
2011
2012
2013
P/E
Source: Bloomberg, Jefferies estimates
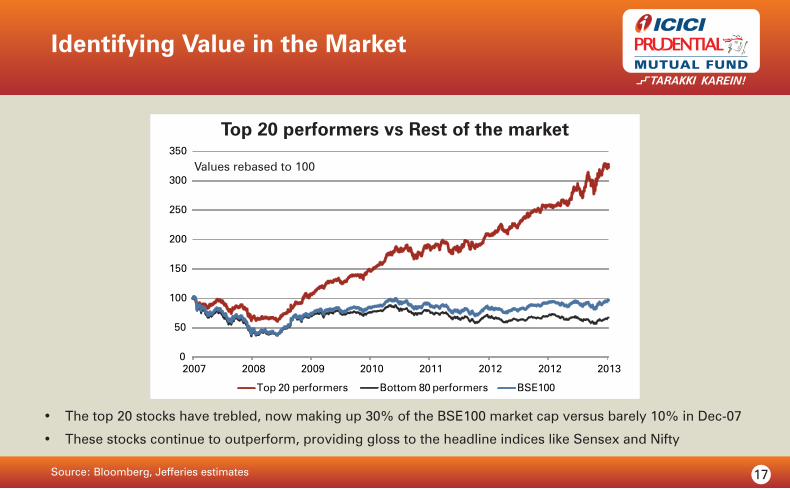
• The top 20 stocks have trebled, now making up 30% of the BSE100 market cap versus barely 10% in Dec-07
• These stocks continue to outperform, providing gloss to the headline indices like Sensex and Nifty
Identifying Value in the Market
17
Top 20 performers Bottom 80 performers BSE100
Top 20 performers vs Rest of the market
0
50
100
150
200
250
300
350
2007 2008 2009 2010 2011 2012 2012 2013
Values rebased to 100

VALUE INVESTING - GLOBALLY
18

Value Investing – Globally, is working
19Source: Bloomberg
CHINA INDICES
0
1,000
2,000
3,000
4,000
5,000
6,000
7,000MSCI China Index MSCI China Value Index
US INDICES
0
500
1,000
1,500
2,000
2,500
2000 2001 2002 2003 2004 2005 2006 2007 2008 2009 2010 2011 2012 2013
S&P 500 Value Index Russell 2000 Value Index S&P 500 Growth Index
Values rebased to 1000
RUSSIA INDICES
MSCI Russia Index MSCI Russia Value Index
0
2000
4000
6000
8000
10000
12000
2000 2001 2002 2003 2004 2005 2006 2007 2008 2009 2010 2011 2012 2013
Values rebased to 1000

20
• Long term wealth creation solution• A close-ended diversified equity fund that aims to provide capital appreciation by investing in a well
diversified portfolio of stocks through fundamental analysis.* Investors should consult their financial advisers if in doubt about whether the product is suitable for them.
HIGH RISK(BROWN)
This product is suitable for investors who are seeking*:
(BLUE) investors understand that their principal will be at low risk
(YELLOW) investors understand that their principal will be at medium risk
(BROWN) investors understand that their principal will be at high risk
Note: Risk may be represented as:
Value Fund - Series 2Value Fund - Series 2(A Close-ended Equity Scheme)
The Product

About the fund
21
• A 3 year close ended scheme of focused 25-30 high conviction stocks.#
• Aims to:
• Find commendable companies at reasonable price rather than generic companies at bargain price.
• Capture profits by selling equities or using derivatives.
• Declare commensurate dividends.*
• Invest in multi-cap stocks.
*Dividends will be declared subject to availability of distributable surplus and approval from Trustees#The number of stocks provided is to explain the investment philosophy and the actual number may go up or down depending on then prevailing market conditions at the time of investment

Why Focused Approach?
22
• Due to large fund size and liquidity condition of the above stocks, size of holding is small.
• Any favourable movement in the stock prices may have a nominal effect on the overall portfolio returns.
Some value picks in existing funds
Company/IssuerFund 1
% to NAVFund 2
% to NAV
Value Stock 1 0.21% 0.60%
Value Stock 2 0.25% 1.38%
Value Stock 3 0.56% 0.30%
Value Stock 4 0.57% 1.33%
For illustration purpose only
23
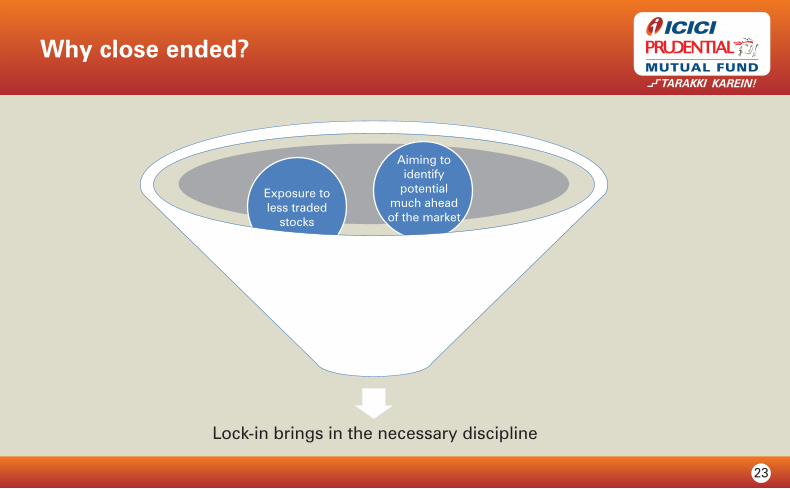
Why close ended?
Lock-in brings in the necessary discipline
Restrict in/outflow to
capture limited market
opportunity
Aiming to identify
potential much ahead of the market
Exposure toless traded
stocks

24
Investment Approach
Absolute andrelative basis
Cyclical stocks
Contra play
Growth stocks atreasonable valuations
• Low P/E, P/B• Good Dividend Yield• Valuation attractive relative to peers / market
• Demerger / Spin-offs by companies• Mergers & Acquisitions• Value unlocking from subsidiaries, sale of assets
• Aim to identify sectors in a downturn• Aiming to buy good companies to play for revival of the sector
• Companies going through bad news-flows• Increased competitive environment, etc.
• High Return on equity and capital employed• Low Debt
Others
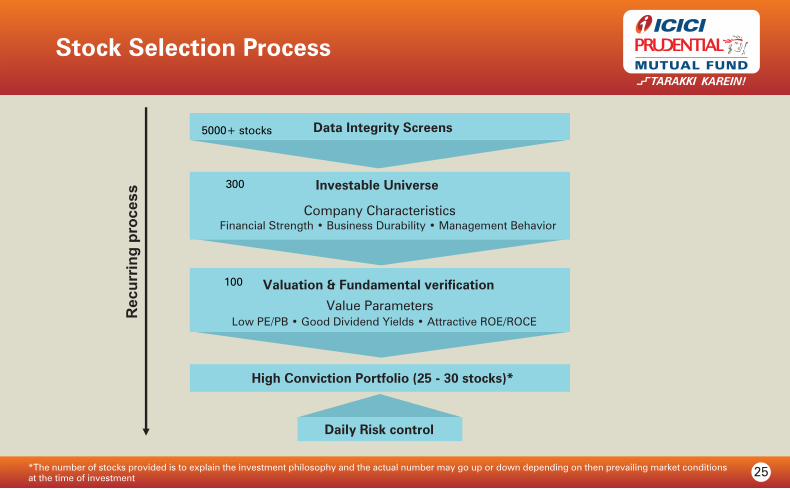
Stock Selection Process
25
High Conviction Portfolio (25 - 30 stocks)*
Data Integrity Screens
Investable Universe
Company CharacteristicsFinancial Strength • Business Durability • Management Behavior
Valuation & Fundamental verification
Value ParametersLow PE/PB • Good Dividend Yields • Attractive ROE/ROCE
Rec
urrin
g pr
oces
s
Daily Risk control
5000+ stocks
300
100
*The number of stocks provided is to explain the investment philosophy and the actual number may go up or down depending on then prevailing market conditions at the time of investment

Key Take Aways
• Institutional participation lopsided towards the top 15-20 stocks; valuations attractive in other pockets.
• The fund aims to hold limited number of stocks; allowing the scheme to benefit from potential positive price movements.
• Post 2008, the fund house has gained experience in managing close ended funds.
• Existing track record of managing value oriented funds.
• Past experience has shown that investors have earned returns when investments are made in bear phases.
26

Why are we launching Series 2, now?
• Domestic investors continue to remain under-invested in Equities
• DII sold equities of ~Rs.12400 crores (MFs~4000 crores) shows that domestic investor have not participated in the recent market run-up.
• Divergence of Large vs Mid/Small cap, Defensive vs Cyclical and Top 20 vs Rest of the market continues to offer returns potential.
» Some contraction in the divergence has started to take place.
» FMCG sector off July’13 high; Large Cap IT and Pharma may follow suit.
• With Fed tapering deferred and India’s CAD position stabilizing, shocks due to external factors is expected to stay at bay.
• Waiting and launching after value has performed, would mean giving away on some potential upside.
• There are plenty of prospects available in the current market which can be considered in the new offering.
27Data Source: AMFI, RBI, Crisil Research
In Rs. Crores Change 2013 2007
Bank Deposits 44,47,787 73,05,820 28,58,033
MF Equity AUM -612 1,77,668 1,78,280

Scheme Features
Type of scheme A Close ended equity scheme
Investment Objective The investment objective of the Scheme is to provide capital appreciation by investing in a well diversified portfolio of stocks through fundamental analysis. However, there can be no assurance that the investment objectives of the scheme will be realized.
Options Direct Plan – Dividend Option; Regular Plan – Dividend Option Only Dividend payout facility available
Minimum Application Amount Rs 5,000 (plus in multiple of Rs.10)
Entry Load Not Applicable
Exit Load Not Applicable
Benchmark Index S&P BSE 500 Index
Fund Manager Mr. Sankaran Naren & Mr. Mittul Kalawadia
28

29
Disclaimer: In the preparation of the material contained in this document, the AMC has used information that is publicly available, including information developed in-house. Some of the material used in the document may have been obtained from members/persons other than the AMC and/or its affiliates and which may have been made available to the AMC and/or to its affiliates. Information gathered and material used in this document is believed to be from reliable sources. The AMC however does not warrant the accuracy, reasonableness and / or completeness of any information. We have included statements / opinions / recommendations in this document, which contain words, or phrases such as “will”, “expect”, “should”, “believe” and similar expressions or variations of such expressions, that are “forward looking statements”. Actual results may differ materially from those suggested by the forward looking statements due to risk or uncertainties associated with our expectations with respect to, but not limited to, exposure to market risks, general economic and political conditions in India and other countries globally, which have an impact on our services and / or investments, the monetary and interest policies of India, inflation, deflation, unanticipated turbulence in interest rates, foreign exchange rates, equity prices or other rates or prices etc.
The AMC (including its affiliates), the Mutual Fund, the trust and any of its officers, directors, personnel and employees, shall not liable for any loss, damage of any nature, including but not limited to direct, indirect, punitive, special, exemplary, consequential, as also any loss of profit in any way arising from the use of this material in any manner. The recipient alone shall be fully responsible/are liable for any decision taken on this material.
The sector(s)/stock(s) mentioned in this presentation do not constitute any recommendation of the same and ICICI Prudential Mutual Fund may or may not have any future position in these sector(s)/stock(s). Past performance may or may not be sustained in the future. The portfolio of the scheme is subject to changes within the provisions of the Scheme Information document of the scheme. Please refer to the SID for investment pattern, strategy and risk factors.
Investors are advised to consult their own legal, tax and financial advisors to determine possible tax, legal and other financial implication or consequence of subscribing to the units of ICICI Prudential Mutual Fund.
Mutual Fund investments are subject to market risks, read all scheme related documents carefully.
Disclaimers

30
Note

31
Note
