value measuring methodology may 2003 council for excellence in government: benefits assessment...
TRANSCRIPT
Value Measuring Methodology
May 2003
Council for Excellence in Government: Benefits Assessment Workshop

Why isn’t “traditional” business case analysis providingthe information OMB is looking for?
Primarily focused on financial benefits (e.g., ROI) that impact the government only…
Assumption that what is good for governmentis good for citizens…
No structure to force the development of quantifiable measures…
Non-financial benefits are not directly factored into analysis…
Analysis is viewed as a means to get funding, not a tool for on-going management & evaluation…
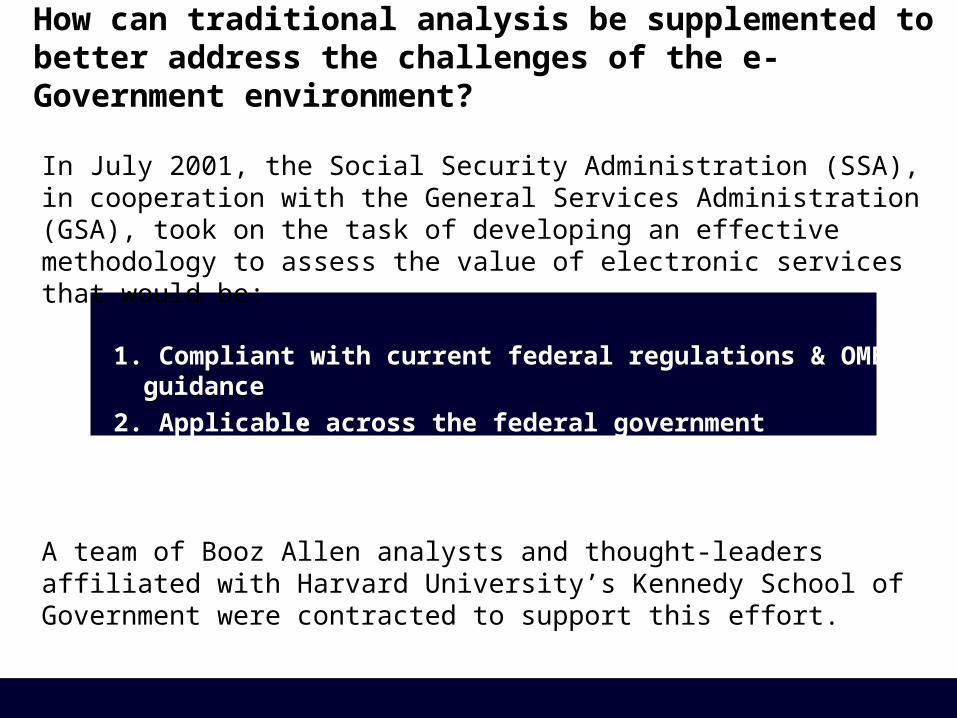
How can traditional analysis be supplemented to better address the challenges of the e-Government environment?
In July 2001, the Social Security Administration (SSA), in cooperation with the General Services Administration (GSA), took on the task of developing an effective methodology to assess the value of electronic services that would be:
1. Compliant with current federal regulations & OMB guidance
2. Applicable across the federal government
3. “Do-Able”
A team of Booz Allen analysts and thought-leaders affiliated with Harvard University’s Kennedy School of Government were contracted to support this effort.

Critical Inputs & ResearchTraditional / Emerging
Approaches Federal Agency Staff
Legislation and OMB Circulars
State Government Staff
Government Developed Training Documents Private Sector
Academic Institutions OMB
Think Tanks GAO
development presentation
research & analysis
discussion
The approach used to develop VMM was built upon the foundation of a public / private partnership
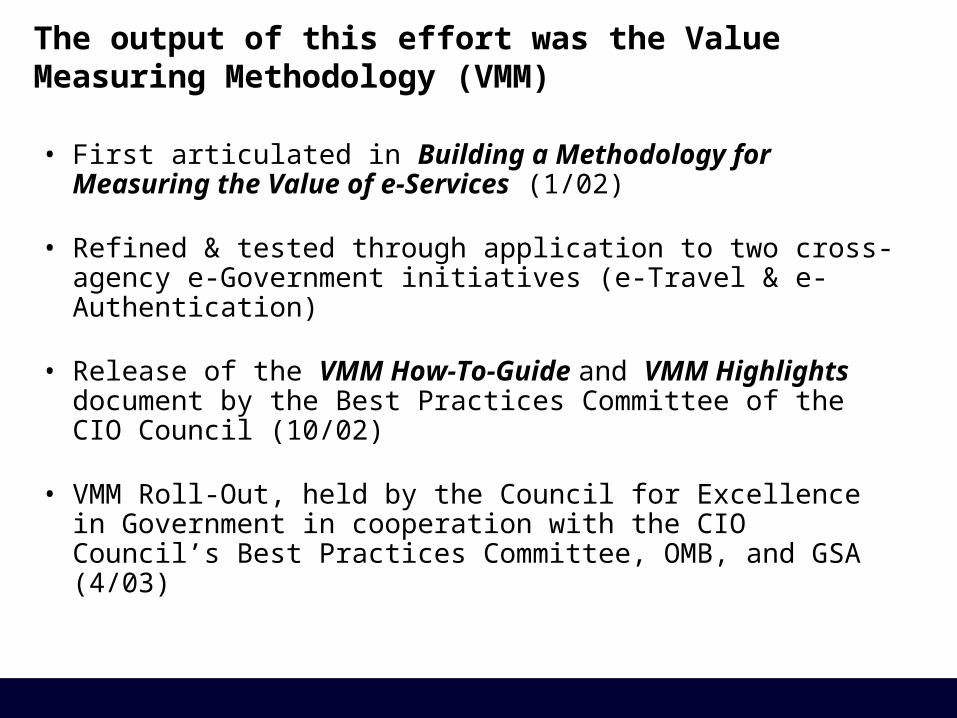
The output of this effort was the Value Measuring Methodology (VMM)
• First articulated in Building a Methodology for Measuring the Value of e-Services (1/02)
• Refined & tested through application to two cross-agency e-Government initiatives (e-Travel & e-Authentication)
• Release of the VMM How-To-Guide and VMM Highlights document by the Best Practices Committee of the CIO Council (10/02)
• VMM Roll-Out, held by the Council for Excellence in Government in cooperation with the CIO Council’s Best Practices Committee, OMB, and GSA (4/03)

VMM Overview

VMM IS…
A scalable and flexible approach for quantifying and analyzing value, risk, and cost and evaluating the relationships among them
• Helps to create a roadmap for on-going management and evaluation
• Supports the development of critical management plans
It is important to understand what VMM IS and ISN’T…
VMM IS NOT…• One Size Fits All• A Way to Avoid Analysis• Only Useful for e-Government
Initiatives
COMPLIANT WITH
GPRACCA
OMB A-11
CONSISTENT WITH THE PHILOSOPHY OF THE PMA

The Essential Factors…
What Could Make Costs Go Up or
Performance Slip From Projected
Levels?
How MuchWill It Cost?
What Benefits Will It Provide to…• Direct Users• Society• Government

A Decision Framework
V A
L U
E
Value Factors priority
value measure(s) metric, target, scale priority
R I S
KC
OS
T
CustomizedCost ElementStructure
1.0 …
2.0…
3.0 …
Risk Inventory
Risk Tolerance Boundary
Define User Needs & Priorities
Quantifiable Measures of Performance
(Metrics, Targets)
Foundation for Analysis & On-going
Performance Measurement
Early Consideration
of Risk

The technically superior digital technology offers more bandwidth than analog technology because the signal is….
OR
Communicating Value to Customers and Stakeholders
Using digital LMR will prevent the catastrophic communications malfunctions and inefficiencies that cost lives in the aftermath of 9/11 in NYC. Digital LMR will accomplish this by…
What will make an Appropriations Committee staff member or OMB care about an investment in digital Land Mobile Radio (LMR) equipment for public safety agencies across government?

• PMA Imperatives• Captures All Value
Factors/Benefits• Analytic Rigor• Clarity• Completeness• Focus On Results
VMM Effective in Building “WINNING”OMB Exhibit 300s
Part I – Capital Asset Plan and Business Case (All Assets)
Summary of Spending
Project Description and Justification
Performance Goals and Measures Program Management
Alternatives Analysis
Risk Inventory and Assessment Acquisition Strategy Project and Funding Plan
Part II – Additional Business Case Criteria for Information Technology
Enterprise Architecture Security and Privacy GPEA
OM
B 3
00
Fully satisfied by VMM outputs Supported by VMM output and process

Value

Def
init
ion
L A Y E R 1 P
roje
ct
Val
ue
Def
init
ion
Def
init
ion
Pro
jec
t V
alu
eD
efin
itio
n(M
easu
res)
Def
init
ion
Direct User(Customer)
Social(Non-Direct User)
Government Financial
Government Operational/ Foundational
Strategic/ Political
Pro
jec
t V
alu
eD
efin
itio
n(M
easu
res)
Pro
jec
t V
alu
eD
efin
itio
n(M
easu
res)
Pro
jec
t V
alu
eD
efin
itio
n(M
easu
res)
Pro
jec
t V
alu
eD
efin
itio
n(M
easu
res)
Pro
jec
t V
alu
eD
efin
itio
n(M
easu
res)
L A Y E R 2
Identifying and Defining Value

Concise, Illustrative Name Robust Reliable Service
Brief Description
Service with:• Minimal or no disruptions• Consistent service regardless of normal fluctuations in
demand• High fault tolerance with built-in redundancy• Adequate speed to meet business needs
Performance Metrics Target Scale (0-100)
Frequency of service disruptions None 0 disruptions = 1001 disruption = 954 disruptions = 60
Length of service disruptions ≤ 10 minutes ≤ 10 min. = 9011–14 min. = 60
Is an executable Continuity of Operations plan in place (with a backup NOC) sufficient to pass annual certification?
Yes No = 0 / Yes = 100
Latency ≤ 75 milliseconds
1
2
43
The way measures are articulated can directly impact the way they are perceived and understood. The definition must consist of four parts:
Structured Approach to Identifying and Defining Value Measures

Building A Direct User Measure What Do Users Want?
E-Travel Initiative
Travelers / Managers• Anytime Access to Data• Real-Time Data Availability • Simplified/Automated Trip Planning • Speed of Reimbursements
Budget & Accounting Staff • Standardized and Electronic Auditing Function / Simplified
Application and Monitoring of Travel Entitlements • Access to Reporting Information
Businesses (Travel Management Companies)• Timely & Accurate Receipt of Bill Payments
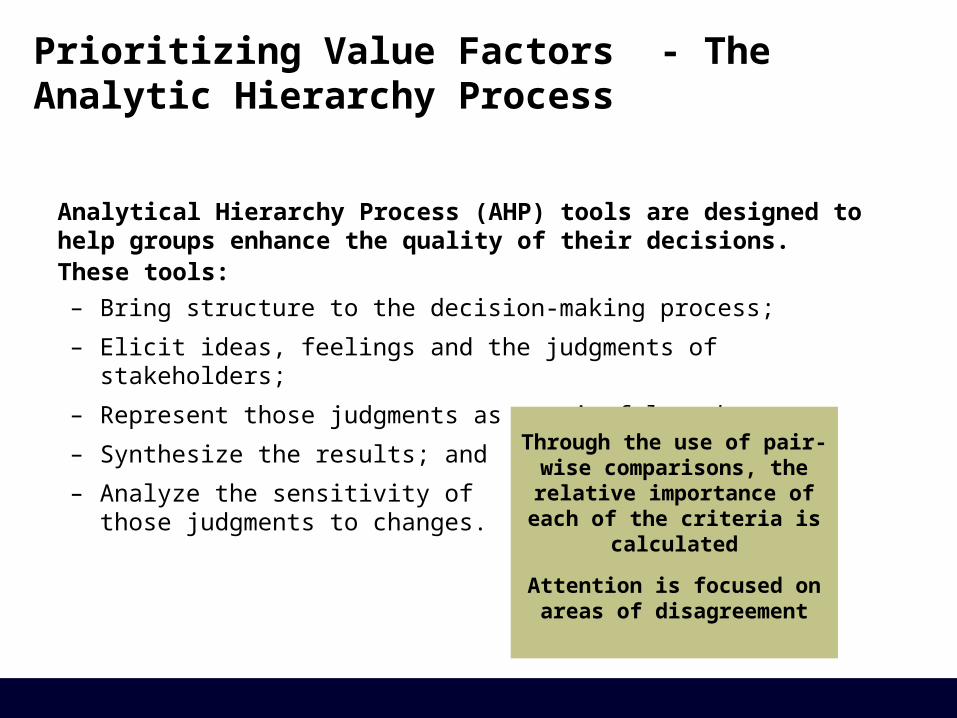
Analytical Hierarchy Process (AHP) tools are designed to help groups enhance the quality of their decisions. These tools: – Bring structure to the decision-making process;
– Elicit ideas, feelings and the judgments of stakeholders;
– Represent those judgments as meaningful numbers;
– Synthesize the results; and
– Analyze the sensitivity of those judgments to changes.
Through the use of pair-wise comparisons, the relative importance of each of the
criteria is calculated
Attention is focused on areas of disagreement
Prioritizing Value Factors - The Analytic Hierarchy Process
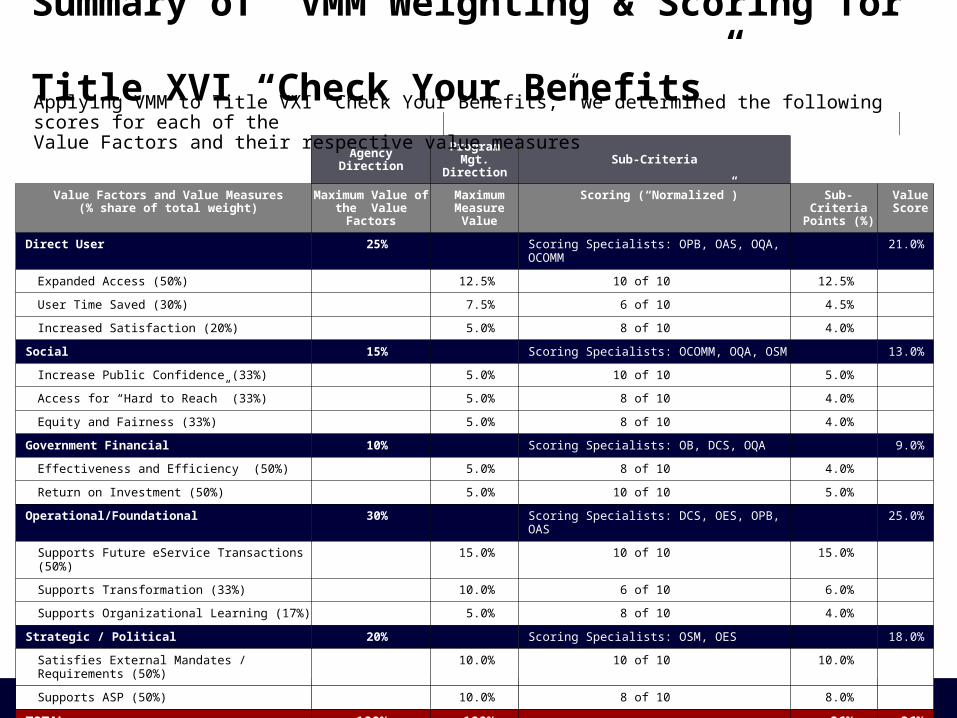
Summary of VMM Weighting & Scoring for Title XVI “Check Your Benefits”
Agency DirectionProgram
Mgt. Direction
Sub-Criteria
Value Factors and Value Measures(% share of total weight)
Maximum Value of the Value Factors
Maximum Measure
Value
Scoring (“Normalized”) Sub-Criteria Points (%)
Value Score
Direct User 25% Scoring Specialists: OPB, OAS, OQA, OCOMM 21.0%
Expanded Access (50%) 12.5% 10 of 10 12.5%
User Time Saved (30%) 7.5% 6 of 10 4.5%
Increased Satisfaction (20%) 5.0% 8 of 10 4.0%
Social 15% Scoring Specialists: OCOMM, OQA, OSM 13.0%
Increase Public Confidence (33%) 5.0% 10 of 10 5.0%
Access for “Hard to Reach” (33%) 5.0% 8 of 10 4.0%
Equity and Fairness (33%) 5.0% 8 of 10 4.0%
Government Financial 10% Scoring Specialists: OB, DCS, OQA 9.0%
Effectiveness and Efficiency (50%) 5.0% 8 of 10 4.0%
Return on Investment (50%) 5.0% 10 of 10 5.0%
Operational/Foundational 30% Scoring Specialists: DCS, OES, OPB, OAS 25.0%
Supports Future eService Transactions (50%) 15.0% 10 of 10 15.0%
Supports Transformation (33%) 10.0% 6 of 10 6.0%
Supports Organizational Learning (17%) 5.0% 8 of 10 4.0%
Strategic / Political 20% Scoring Specialists: OSM, OES 18.0%
Satisfies External Mandates / Requirements (50%) 10.0% 10 of 10 10.0%
Supports ASP (50%) 10.0% 8 of 10 8.0%
TOTAL 100% 100% 86% 86%
Applying VMM to Title VXI “Check Your Benefits,” we determined the following scores for each of the Value Factors and their respective value measures

Risk

Risk that is not identified cannot be mitigated.
Risks that are not mitigated can cause a project to fail either in the pursuit of funding or, more dramatically,
while the project is being implemented.
IDENTIFYING RISKS:
• Consider “standard” IT project risks
• Identify project specific risks via input from technical & policy staff, representatives of partner agencies collected from:
– Working Sessions– Survey Efforts
EXAMPLE OMB RISK CATEGORIES:
• Project Resources / Financial• Technical / Technology• Business / Operational• Organizational & Change Management• Data / Information• Security• Strategic• Privacy
Identifying and Defining Risk

• Organizational Tolerance For Cost Risk (increased cost)
• Organizational Tolerance for Value Risk (slippage in performance)
What is the decision processbehind the following:
1. Buying a $1 lottery ticket for the chance to win $1 million. Odds are 1 in 1,000.
2. Buying a $100 lottery ticket for the chance to win $1 million. Odds are 1 in 1,000.
3. Buying a $100 lottery ticket for the chance to win $10 million. Odds are 1 in 1,000.
Defining Risk Tolerance

As the estimated most likely value score increases, risk
tolerance is likely to increase.
VALUE TOLERANCE BOUNDARY
0%
5%
10%
15%
20%
25%
30%
35%
0 10 20 30 40 50 60 70 80 90 100
VA
LU
E R
ISK Unacceptable
Area
AcceptableArea
Value Risk Boundary
0%
5%
10%
15%
20%
25%
30%
0 10 20 30 40 50 60 70 80 90 100
VALUE SCORE
UnacceptableArea
AcceptableArea
0%
5%
10%
15%
20%
25%
30%
0 10 20 30 40 50 60 70 80 90 100
Unacceptable Area
Acceptable Area
VALUE RISK BOUNDARY
CO
ST
RIS
K
0%
5%
10%
15%
20%
25%
30%
35%
$- $5 $10 $15 $20 $25 $30 $35 $40 $45 $50
COST ($M)
Cost Risk Boundary
AcceptableArea
0%
5%
10%
15%
20%
25%
30%
35%
$- $5 $10 $15 $20 $25 $30 $35 $40 $45 $50
COST RISK BOUNDARY
Acceptable Area
Unacceptable Area
COST TOLERANCE BOUNDARY
As the estimate most likely cost increases, risk tolerance
is likely to decrease.
Value and Cost Risk Tolerance Boundaries communicate the upper limit of the range of risk an organization will accept in both areas.

Cost

Consider Value and Risk
Identifying & Defining Costs
Direct User Value
• Training• Marketing• Access (e.g., kiosks)• Incentives
Social Value
• Communications – Public awareness
Advertising– Public Relations
Government Operational / Foundational Value
• Maintain legacy systems and processes during transitions
• On-going maintenance of paper process
Ensure a complete, comprehensive cost estimate …
Alleviate the risk of missing costs or double-counting…
by developing a Cost Element Structure
Investments made on incomplete or inaccurate estimates are likely
to run out of funding and, therefore, require justification for additional funding or a reduction
of initiative scope

Estimating and Comparing Value, Cost, & Risk

Identify viable alternatives that have the potential to deliver an optimum mix of both value and cost efficiency
Alternatives Must Address People,
Process & Technology!
trainingoutreach
managementstaffing
communicationsrecruitmentsocializationuser support
508 requirementslanguage requirements
EA / FEA
BPRAcquisition
Outsourcing/in-sourcingconcept of operations
risksecurity
program managementfunding
collaborationcommunications
evaluationlegislative req.
policy req.EA / FEA
hardwaresoftwareinterfacedata req.EA / FEA
Identifying and Defining Viable Alternatives

Projects the results of maintaining current systems and processes while attempting to keep pace with changes over time.
T I M E
rising demand
workforceattritioncustomer
satisfaction
status quo
base case
The Base Case

Avoid Analysis Paralysis: Match Information to the Phase of Development
Data sources and detail depend upon the initiative’s stage of development
Use the best information available rather than looking for information that doesn’t exist
Update this information as “better” information becomes available
ALWAYS DOCUMENT DATA SOURCES & ASSUMPTIONS
Stage of Development
Data Sources
Strategic Planning
• Strategic & Performance plans• Subject Matter Expert Input• New and existing user surveys• Private/public sector best practices,
lessons learned and benchmarks• Enterprise Architecture• Modeling & simulation• Vendor / market survey
Business Modeling &
Pilots
• Subject Matter Expert input• Data from analogous government
initiatives• New & existing user surveys for each
business line• Private/public sector best practices,
lessons learned & benchmarks• Refinement of modeling & simulation
Implementation & Evaluation
• Actual data from phased implementation• Actual spending/cost data• User group / stakeholder focus groups /
surveys• Other performance measurement
Collecting Data

EXAMPLE
USE RANGES TO INCREASE CONFIDENCE IN COST ESTIMATES!
200150100# of Employees to beTrained/year
Annual Cost per Employee Trained
HighMedLow
Projected Range of Training Costs Inputs $1500$1200$1000
Inputs
Using Ranges

Conduct Uncertainty and Sensitivity Analyses on Both Cost & Value Estimates
Uncertainty Analysis • Based on considerations
of requirement, cost estimating, and technical uncertainty
• Increases confidence in the estimate. Doesn’t increase the precision of the estimate
• Tool: Monte Carlo Simulation
• Output: “Most Likely” or “Expected” Cost & Value
Sensitivity Analysis• Based on the output of the Monte
Carlo Simulation
• Sensitive variables have a significant impact on the overall estimate
• Output: Identification of which variables have a significant impact on the overall estimate. Can be used to determine which variables merit additional research
Uncertainty and Sensitivity Analysis

ALTERNATIVE 1 - COST RISK ANALYSIS
Risk Probability Cost Impacted Impact
Cost Overruns Med
1.0 System Planning & Development Low
2.0 System Acquisition & Imp. High
3.0 System Maintenance & Operations Med
Cost of Lost Info / Data High
1.0 System Planning & Development Med
2.0 System Acquisition & Imp. Med
3.0 System Maintenance & Operations Low
ALTERNATIVE 1 - VALUE RISK ANALYSIS
Risk Probability Value Impacted Impact
Cost Overruns Med
Total Cost Savings to Investment Low
Total Cost Avoidance to Investment Low
Cost of Lost Info/ Data High
Total Cost Savings to Investment Low
Total Cost Avoidance to Investment Low
HW/ SWFailure &
ReplacementMed
Accessibility of e-Gov services to Users High
User Trust In Internet Transactions High
Application Owner Confidence in Identity of Users High
Reduction of Identity Fraud High
Regulatory Compliance High
Total Cost to Savings Investment High
Total Cost Avoidance to Investment High
The probability of a specific risk
occurring remains constant through
out the analysis of a specific
alternative, regardless of
where it impacts the value or cost of
a particular alternative
The impact of a single risk factor
may differ in magnitude at each
point where it interacts with cost
and value
Analyzing Cost Risk and Value Risk

You should be able to answer the following questions…
• What is the estimated cost of each alternative?
• What is the financial return on investment associated with the alternatives?
• What is the value score associated with the alternatives?
• What are the cost and value risks associated with this alternative? What effect do they have? (value and cost risk scores)
• How do the value, risk and cost of the alternatives compare?
• Does the cost risk and value risk associated with the alternatives fall within the range represented by the relevant risk tolerance boundaries?
Pulling Together the Information

Investment Cost To Value(Expected & Risk-Adjusted)
0
10
20
30
40
50
60
70
80
90
100
$- $5 $10 $15 $20 $25 $30 $35 $40
C O S T ($M)
V A
L U
E
Expected Alt 1
Risk Adjusted Alt 1
Expected Alt 2Risk Adjusted Alt 2
Expected Alt 3Risk Adjusted Alt 3
Alt 1
Alt 2 Alt 3
Based on This Information, Which Alternative Would You Choose?
Comparing Value to Cost

The risk associated with all of the value scores fall within the acceptable area.
Alt. 2 bears the lowest value risk.
COMPARING VALUE TO VALUE RISK
14%
13%80
70
0%
5%
10%
15%
20%
25%
30%
35%
0 10 20 30 40 50 60 80 90 100
V A L U E
V A
L U
E
R I
S K
Alt 1
UnacceptableArea
Acceptable Area
Alt 3
Alt 2 7%
70
70
VALUE RISK BOUNDARY
COMPARING COST TO COST RISK
17%
10%
$30
$1012%
$25
0%
5%
10%
15%
20%
25%
30%
35%
$- $5 $10 $15 $20 $25 $30 $35 $40
C O S T ($M)
C O
S T
R
I S
K
Alt 2
Alt 1
AcceptableArea
Alt 3
UnacceptableArea
Acceptable Area
COST RISK BOUNDARY
The only alternative that falls squarely within the Cost Risk Boundary is Alt. 2.
Comparing Value to Value Risk,and Cost to Cost Risk

The VMM Guide

The VMM How-To Guide provides best practice analysis techniques, real examples and required resources
K ey Descriptive Elements for each Step
Detailed direction on how to apply VMM to evaluate an e-Government initiative.
Summary – Synopsis of key information
Required Resources – Staff resources, data resources, and tools required for a step or task
Best Practices – Recommended tools, techniques, and tips for using VMM successfully
VMM in Action – Real-world examples of how VMM is applied
KKeeyy CCoonncceeppttss –– BBrr ii eeff ddeeff ii nn ii tt ii oonn oo ff tteerrmmss aanndd mmeetthhooddss

VMM Step 1: Develop a Decision Framework
V A
L U
E
Value Factors priority
value measure(s) metric, target, scale priority
R I S
KC
OS
T
CustomizedCost ElementStructure
1.0 …
2.0…
3.0 …
Risk Inventory
Risk Tolerance Boundary
Task 4:Begin Documentation
Task 2:Identify & Define the Risk Structure
Task 3: Identify & Define the Cost Structure
Task 1: Identify & Define the Value Structure
Define User Needs & Priorities
Quantifiable Measures of Performance
(Metrics, Targets)
Foundation for Analysis & On-going
Performance Measurement
Early Consideration
of Risk

R I S
K
priority
priority
3.0 …
2.0…
V A
L U
EC
OS
T
1.0 …
metric, target, scale
value measure(s)
Value Factors
CustomizedCost ElementStructure
VMM Step 2: Alternatives Analysis (estimate value, cost, & risk)
Viable Alternatives
Base Case - What will happen if nothing
changes?
Match levelsof
information to the
phases of development
S E
N S
I T I V
I T Y
U N
C E
R T
A I N
T Y
U N
C E
R T
A I N
T Y
Risk Analysis
S E
N S
I T I V
I T Y
Step 1
Task 1: Identify & Define Alternatives
Task 4: On-going Documentation
Task 2:Estimate Value & Cost
Task 3: Conduct Risk Analysis
Risk Inventory
Risk Tolerance Boundary
Low High
Expected
Low High Expected

VMM Step 3: Pull Together the Information
Government Cost Savings/Avoidance
ExpectedValue Score
Expected Cost
Risk Adjusted Expected
Value and Cost
Risk Scores
Expected ROI
RiskAdjusted Expected
ROI
S E
N S
I T I V
I T Y
U N
C E
R T
A I N
T
Y
U N
C E
R T
A I N
T
Y
S E
N S
I T I V
I T Y
Step 1
Low High
Expected
R I S
K
Low High
Expected
priority
priority
3.0 …
2.0…
V A
L U
EC
OS
T
1.0 …
metric, target, scale
value measure(s)
Value Factors
CustomizedCost ElementStructure
Risk Analysis
Step 2
Task 5: Compare Value, Risk, & Cost
Task 1:Aggregate the Cost Estimate
Task 2: Calculate the Return-on-Investment
Task 3: Calculate the Value Score
Task 4: Calculate the Risk Scores
Risk Inventory
Risk Tolerance Boundary

VMM Step 4: Communicate and Document
Reporting Consensus Building
Investment Planning Management Planning
ExpectedValue Score
Expected Cost
Risk Adjusted Expected
Value and Cost
Risk Scores
Expected ROI
RiskAdjusted Expected
ROI
Government Cost Savings/Avoidance
S E
N S
I T I V
I T Y
U N
C E
R T
A I N
T
Y
U N
C E
R T
A I N
T
Y
Risk Inventor
y
S E
N S
I T I V
I T Y
Step 1
Low High
Expected
R I S
K
Low High
Expected
priority
priority
3.0 …
2.0…
V A
L U
EC
OS
T
1.0 …
metric, target, scale
value measure(s)
Value Factors
CustomizedCost ElementStructure
Risk Analysis
Step 2
Step 3
Task 2:Prepare Budget Justification Documents
Task 3:Satisfy Ad Hoc Reporting Requirements
Task 4:Use Lessons Learned to Improve Processes
Task 1: Communicate Value to Customers and Stakeholders
Risk Inventory
Risk Tolerance Boundary

Q & A

• Measures tangible and intangible benefits
• Accounts for risk in cost and value calculations
• Increases reliability of ROI through simulation
• Tested and proven in multiple E-Gov projects
• Flexible and adaptable
• Results and outcome driven
• Allows examination of the relationships among Value, Cost and Risk
• Feasible for portfolio management
VMM establishes an even scale for quantifying and analyzing value, risk, and cost
V A
L U
E
Value Factors priority
value measure(s) metric, target, scale priority
R I S
KC
OS
TCustomizedCost ElementStructure
1.0 …
2.0…
3.0 …
Risk Inventory
Risk Tolerance Boundary

Building a Methodology for Measuring the Value of e-Services
http://www.estrategy.gov/documents/measuring_finalreport.pdf
VMM How-To-Guide and VMM Highlights
http://www.cio.gov/ – best practices page:
- http://www.cio.gov/documents/ValueMeasuring_Methodology_HowToGuide_Oct_2002.pdf- http://www.cio.gov/documents/ValueMeasuring_Highlights_Oct_2002.pdf