value methodology – a complementary tool in a lean ... · value methodology – a complementary...
TRANSCRIPT

Value Methodology Value Methodology ––A Complementary Tool in a A Complementary Tool in a Lean Thinking CultureLean Thinking Culture
By: Drew Algase, CVSFreudenberg – NOK
International ConferenceCanadian Society of Value Analysis
October 16, 2001

16 October 2001 VM at FNGP 2
AgendaFNGP & Growtth®
VM at FNGP� Beginning� Expansion� Institutionalization
Lessons LearnedQ & A

16 October 2001 VM at FNGP 3
The Freudenberg & NOK Global PartnershipServing Customers Worldwide
FREUDENBERG-NOK
NOK CORPORATION
FREUDENBERG & COMPANY
$3.5 Billion
$1.0 Billion$3.0 Billion
WORLDWIDE� Global R & D technology exchange� Globally integrated supply of products from factories in 27 countries� One-piece-flow lean manufacturing� “Zero Warranty” focus� Over 30,000 employees serving our customers� Total global sales over $7.5 billion� Total automotive sales of approximately $4 billion

16 October 2001 VM at FNGP 4
Better Global Capabilities
57 Automotive Operations
25 in North and South America
21 in Europe
11 in the Pacific Rim
$4.0 Billion Automotive Sales
$1.5 billion in Europe
$1.5 billion in the Pacific Rim
$1.0 billion in the Americas

16 October 2001 VM at FNGP 5
Freudenberg-NOK
Annual Sales: Approximately $1.0 billionEmployees: Over 5000Headquarters: Plymouth, Michigan� Established July 1, 1989� General Partnership between Freudenberg of Germany and NOK of Japan� Integrates Japanese, German and American technology� 25 Locations in the Americas
Designs and Manufacturers:� Seals and gaskets� Custom molded rubber products� PTFE and plastic components� Anti noise, vibration and harshness products� Brake hoses� Rebuild kits

16 October 2001 VM at FNGP 6
Freudenberg-NOK Mission
Grow to be a highly profitable $1.5 billion company by 2006
as a Global Technology Specialist which incorporates Six
Sigma into the passionate practice of Growtth® -- all with the
goal of driving out warranty costs and driving up customer
satisfaction.

16 October 2001 VM at FNGP 7
Growtth Is An Acronym For Get Rid Of Get Rid Of Waste Through Team HarmonyWaste Through Team Harmony, And
Represents Freudenberg-NOK’s Company-Wide Program Stressing Lean
Business Practices.

16 October 2001 VM at FNGP 8
®
PRODUCT DESIGN� Value Engineering
Design to achieve targets� Production Preparation Process
Initial lean process design� Design for Six Sigma
Breakthrough Designs
PRODUCTION� Value AnalysisImprove existing products
� Shop Floor KaizenImprove existing processes
� Six SigmaBreakthrough Improvements

16 October 2001 VM at FNGP 9
FreudenbergFreudenberg--NOK’s Journey to LeanNOK’s Journey to Lean
1989FNGP
Established
1995 - VA/VE Introduced
1998 - 3 P Introduced
2000 - Six Sigma Introduced
1992 - GROWTTH Initiated• Kaizen• 5-S
• SMED• TPM
1999 - Lean Supplier Initiative
2000 -Six Sigma Introduced

16 October 2001 VM at FNGP 10
Value Analysis / Value Engineering
VA/VE is a proven team oriented, creative, systematic, cross-functional approach that enhances decision making, improves products and processes, and increases customer satisfaction.
Value Analysis examines current products in an effort to detect and correct value problems and reduce costs. VA is part of our Growtth® program for continuous improvement and lean manufacturing.
VA
Value Engineering focuses on new products in an effort to identify and prevent value problems before production. VE is an important feature of our product development process (APQP).
VE
The objective of VA/VE is to improve value as defined by:
Value = Function ÷ Cost

16 October 2001 VM at FNGP 11
Key Elements of VA/VE
� Focus on Improving Customer Value� Dedicated Cross-Functional Teams� Cost to Function Analysis� Competitive Product/Process Analysis� Disciplined Methodology

16 October 2001 VM at FNGP 12
VA/VE WORKPLAN
- Select Project and Team, Define Scope and - Objectives, Perform Information Gathering Tasks
- Define Functions, Assign Costs to Functions- Identify Improvement Opportunities
- Brainstorm ideas to Perform Function-“How Else Can We...” Functional Thinking-Idea Categorization, Idea Prioritization, ‘T’ Chart
- Value Ratio: V=F/C, Proposal Selection- Write Proposals and Action Plans
- Recommendation and Presentation- Implement Action Plan
Information Phase
Function Phase
Creative Phase
Evaluation Phase
Development Phase
Implementation Phase

16 October 2001 VM at FNGP 13
FNGP’s Journey to VM
Corporate “Push”� Executive Support – Lean Strategy� Corp. VM Program ManagerInitially focused on VA, hard savings on current products – “Success Stories”VE focus to get cost avoidance –Engineering supportPlant & Sales request VM – “Pull”
16 October 2001 VM at FNGP 14
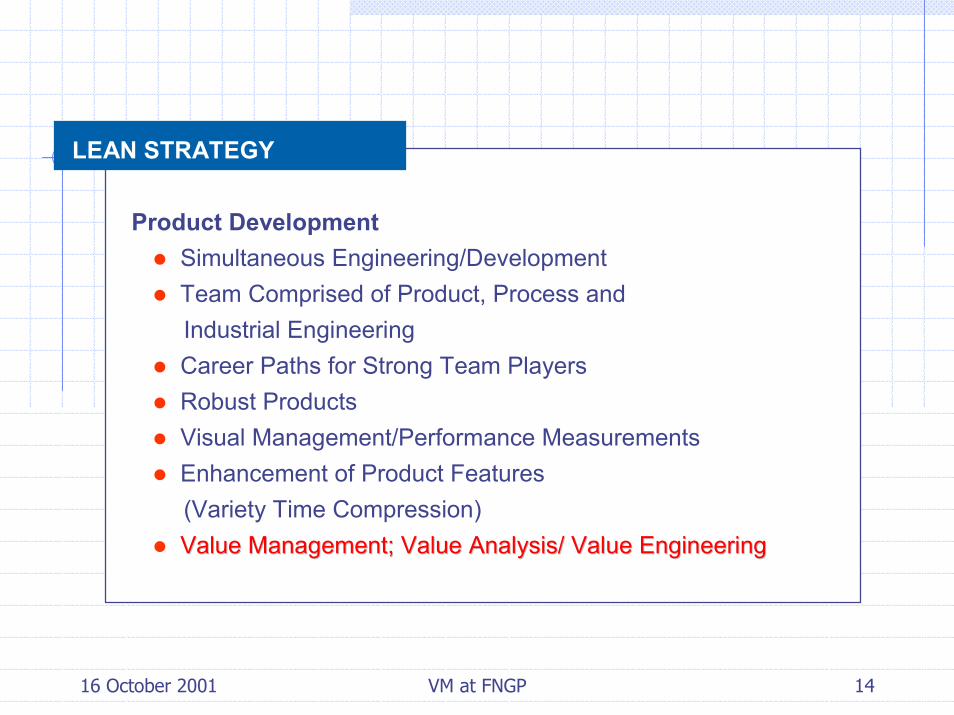
LEAN STRATEGY
Product Development� Simultaneous Engineering/Development� Team Comprised of Product, Process and
Industrial Engineering� Career Paths for Strong Team Players� Robust Products� Visual Management/Performance Measurements� Enhancement of Product Features
(Variety Time Compression)� Value Management; Value Analysis/ Value EngineeringValue Management; Value Analysis/ Value Engineering

16 October 2001 VM at FNGP 15
LEAN STRATEGY
Customer� Massive Database of Buying Preference� Target Cost; “Market Price Minus” System
� Value Engineering � Declining Price Over Life of Part
� Value Analysis� Share Cost and Production Techniques Information� Share Profit from Joint Activities
� Suppliers Keep Profits from Additional Activities� Fixed Demand

16 October 2001 VM at FNGP 16
INITIATIVE ELEMENTS
� Steering Committee
� GROWTTH Office at Each Facility� Planning� Coordination� Follow Up
� Introduction to All Employees
� Leadership Course (Vital Learning)
� Leader Training
� Inter-Plant Participation
� Cadre of Facilitators/Trainers
� Networking

16 October 2001 VM at FNGP 17
Corporate PolicyCorporate Policy(Supports Lean Strategy)(Supports Lean Strategy)
Must conduct VE and/or 3P for:� All new products & programs > $ XXX � All A/Rs > $ XXX
Built into Policies & Procedures (QS-9000)� Contract Review – Commercial Issues� Financial Review – Capital Requests
Implemented in 1998

16 October 2001 VM at FNGP 18
VA/VE Program Improvements
Incorporate VA/VE into Growtth Manager’s responsibilities (certification requirements):� Project Selection & Scheduling� Facilitation & Training� Implementation Tracking & Follow-up
Local Growtth Steering Committee to include VA/VE activities such as project selection & prioritization, Savings calculations.

16 October 2001 VM at FNGP 19
Expectations - Best PracticesSelection GuidelinesProject CharterTeam Leader & Members – R&R

16 October 2001 VM at FNGP 20
Sample ExpectationsProject Charter & SponsorLocal Manager LeadershipCustomer InvolvementMinimum Potential Savings of $100,000/YearAnnual Sales > $650,000Minimum Life of 3 Years

16 October 2001 VM at FNGP 21
Project Charter
Prepared or Approved by Project SponsorFramework for SOW or TOWS� Background - “Motivation”� Business Problem – Objective from PDM� Expectations – Realistic Deliverables� Boundaries – sacred cows, dates, resources,…
(From Project Management Tools & Techniques)

16 October 2001 VM at FNGP 22
PROJECT CHARTERTo Initiate project and framework for S.O.W.
Date: Project Sponsor: (Champion)
Project Manager:
BACKGROUND (Why is project requested?):
BUSINESS PROBLEM TO BE SOLVED:
MANAGEMENT EXPECTATIONS (What outcomes are desired?):
N BOUNDARIES (Resources, time, interfaces):sired Completion date: ential participants:
ations and Constraints:
PROJECT TITLE:
KNOW* De* Pot* Consider

16 October 2001 VM at FNGP 23
Roles & ResponsibilitiesTeam LeaderCore Team MemberSupport Team MemberFacilitatorLocal C.I. Manager� Guide Project Selection� Support Facilitator & Team Leader� Maintain visibility of projects until completion

16 October 2001 VM at FNGP 24
Cross FunctionalTeam Member Guidelines� Must be project stakeholders
(i.e.., invested in project’s success)� Consists of 7-8 members
� Do not overload in specific functional area
� Include suppliers & customers
� Support members with specific expertise

16 October 2001 VM at FNGP 25
Planning Deliverables
Approved Project CharterCustomer ParticipationCore Team Members NominatedFacilitator AssignedPre-Workshop Meeting ScheduledWorkshop Dates Scheduled

16 October 2001 VM at FNGP 26
2-5 Weeks prior to WorkshopFacilitator leadsCore Team Members must attendProject Sponsor should “Kick-Off”Agenda:� Team Organization Worksheet� Information Gathering Assignments� Workshop Logistics

16 October 2001 VM at FNGP 27
Workshop LogisticsRoom – No Distractions� Off Site or “50 Mile Rule”� Round or Conference Table set-up (not classroom)
Meals & Snacks; like KaizenThree full days + Report-out on 4th. MorningA-V Materials & Equipment� Overhead Projector & screen (or equiv)� Flip Charts, colored markers, masking tape� 3x5 Index Cards & Post-it notes� Network computer, phone, fax availability

16 October 2001 VM at FNGP 28
POST-WORKSHOP IMPLEMENTATION
Presentation to ManagementBusiness Benefits – MeasurablesProject ManagementImplementation Tracking & Follow-Up

16 October 2001 VM at FNGP 29
Management Presentation
Begins the Implementation PhaseImmediately following Workshop –Morning of 4th Day.Invite people key to implementation:� Project Sponsor & Plant Manager & Staff; Sales, Purchasing,
Finance, Engineering, Operations, etc.
Same Room as Workshop 30 – 45 Minutes- to answer Management’s Questions

16 October 2001 VM at FNGP 30
1. What did you set out to do?
2. What do you propose?
3. What are the benefits?
4. What are the costs & risks?
5. What are your plans to implement?
6. What do you need from us?

16 October 2001 VM at FNGP 31
Financial Benefits
Use C/R Form with Finance Dept. supportIdentify initial cost impact opportunities� Hard & Soft savings � Customer Benefits; Price & Operations savings
Report initial savings at next BOS Meeting (per local procedures)

16 October 2001 VM at FNGP 32
Freudenberg - NOK General Partnership
Financial Results Of Kaizen Activities (FROKA)
Project Data Financial Summary (Annualized $'s)Facility Data Project Type:
Lead Center: xxxx Major Minor FNGP Savings Customer Savings TotalLocation: xxxx Hard Soft Hard Soft Savings
Project Title: XXXX Event Type: Material $0 $0 -$ x -$ Project No.: XXXX Kaizen Pre-Production Direct Labor $0 $0 -$ -$ -$
BPR VA Variable Labor Burden $0 $0 -$ -$ -$ Part Data VE Other Variable Machine Burden $0 $0 -$ -$ -$
Scrap $0 $0 -$ -$ -$ FNGP Part No.: x Other $0 $0 -$ -$ -$
Customer: x Report Timing: Total Variable Cost Reduction -$ -$ -$ -$ -$ Customer Part No.: x Event…………………………. Less: Price Share $0 -$
Product Line No.: x Initial Follow-up……………… x Operating Income -$ -$ -$ -$ -$ EAU: 0 Implemented/Stabilized…….. Opportunity Cost Reduction $0 -$
Est. Annual Sales: 0 Total Annual Cost Reduction -$ -$ -$ -$ -$ Inventory Reduction $0 -$ -$ Investment Avoidance $0 -$ -$ Investment Requirements $0 -$ -$ Total One Time Cash Flow $0 $0 $0 $0 $0
Notes -Cash Flow -$ -$ -$ -$ -$ Payback in Years - Hard #DIV/0!Payback in Years - Soft & Hard #DIV/0!Notes - 1. Savings should only be reported on the quarterly report when the improvement is fully implemented and stabilized. 2. Amounts for Opportunity Cost and Investment Avoidance should not be included in "Hard" savings. 3. Payback includes the effect of a 40% income tax. To KIS it does not take into account the cash flow effects of book versus tax depreciation. General rule of thumb, if the payback is less than 3.5yrs, the investment required to generate the savings is worth while to pursue.
Financial Results

16 October 2001 VM at FNGP 33
Tracking & Follow-up
“30-Day” Follow-up to confirm assumptions; � design, process, quality, cost.
Report “30-Day” benefits on Quarterly VA/VE Savings ReportMonthly BOS Meetings – Regular Agenda Item� Local Metrics� Status of all open proposals

16 October 2001 VM at FNGP 34
Suggested Metrics
For each VA/VE Proposal:� Identified or Confirmed Savings� Savings Implemented/Approved� If Rejected, Reason (technical, commercial, policy)
For Total VA/VE Proposals & Projects� Total Savings Identified / Confirmed� Average Savings per Project� Total Savings Implemented / Approved� Percentage of savings Approved, Rejected, and
Open.

16 October 2001 VM at FNGP 35
VA/VE Enablers
Project “sponsored” by ManagementCustomer’s Release Engineer on TeamPreparation meeting adequate & timelyCore Team full participationWorkplan followedAction plans prepared at workshopPresentation of results to sponsorsMonthly status reporting until completion

16 October 2001 VM at FNGP 36
VA/VE Implementation Improvements
Use Growtth Cost Benefit Analysis sheet to determine hard & soft savings.
Local Emphasis for Implementation:� Local Growtth Manager to track implementation,
as with Kaizen actions.� Agenda item at Monthly BOS meetings for status
of all open proposals.� Report results on OD forms, along with other
improvement activities.
VA/VE Savings & Status as an agenda item at Senior Staff Meetings.

16 October 2001 VM at FNGP 37
DESIGN INPUT(Value engineering)
DESIGN INPUT(Value engineering)
YES
-Voice of customer-Commercial targets-Benchmarking-Assumptions-Design/Reliability goals-Management support-Form APQP team-Team feasibility
-Voice of customer-Commercial targets-Benchmarking-Assumptions-Design/Reliability goals-Management support-Form APQP team-Team feasibility
CT MatrixFM-04-TECH-009 (Value Ratio)FM-04-TECH-008 (Function Worksheet)FM-04-TECH-007 (VA/VE)FM-04-TECH-001 (Design Val)
CT MatrixFM-04-TECH-009 (Value Ratio)FM-04-TECH-008 (Function Worksheet)FM-04-TECH-007 (VA/VE)FM-04-TECH-001 (Design Val)
TARGET/PLAN/DESIGNTARGET/PLAN/DESIGN
CUSTOMERREQUEST(OP-03-SALES-002)
CUSTOMERREQUEST(OP-03-SALES-002)
MARKET NEED(From customer input)
MARKET NEED(From customer input)
TECHNOLOGY ADVANCEMENT(R&D)
TECHNOLOGY ADVANCEMENT(R&D)
INQUIRY INITIATED(WI-03-CS-001)(WI-03-SALES-021)
INQUIRY INITIATED(WI-03-CS-001)(WI-03-SALES-021)
REVIEW TO PROCEED
(WI-03-SALES-006)
REVIEW TO PROCEED
(WI-03-SALES-006)
APQP FLOW CHART
NO

16 October 2001 VM at FNGP 38
VA/VE Workplan Checklistor, you’re doing VM when the following actions are followed
VA/VE Workplan Phase & Description Suggested VA/VE Form
Used; Yes or No Documentation or Evidence of use:
INFORMATION PHASE: Cross-functional team composed of stakeholders (e.g. APQP team)
Team Organiz.
Work Sheet
Identify customer requirements; Functional & Commercial; Quality, Cost, Timing. (e.g. QFD)
TOWS or X-Y Matrix
Set specific, measurable objectives to improve value (Value = Function / Cost)
TOWS
FUNCTION PHASE:
Analysis of functions the product must do to meet customer requirements (results, not activities)
Function Worksheet
Allocate actual costs to functions Cost/Function Worksheet
Prepare (or review) Function Diagram F.A.S.T. Diagram
Select functions for value improvement (high cost, low performance); Identify value mis-matches.
CREATIVE PHASE:
Brainstorm to generate ideas to perform functions identified in Function Phase. Create by function.
Revisit ideas from previous events (kaizen, VA/VE, etc.) ; leverage your creativity.
Idea Worksheet
EVALUATION PHASE:
Select feasible solutions to improve value; categorize & prioritize.
ABCD Matrix
For feasible solutions, list advantages & disadvantages or risks, estimate magnitude of changes, identify ways to overcome disadvantages
T-Chart

16 October 2001 VM at FNGP 39
ChampionsChampions - Set The Agenda
Steering CommitteesSteering Committees - Guide the Process
+C.I. Manager/OfficeC.I. Manager/Office - Resource to just do it

16 October 2001 VM at FNGP 40
6-Sigma & VM; Problem Solving Processes
System Des.Parameter & Tolerance des.
Taguchi Product Development Cycle
?Jack Welch GEVisibility (Champion)
Function Analysis
DMAICUnique Feature
Value Impvt.V=F/C
Defect Redn.DPMO
Deliverable
Job Plan6-Phase
Breakthrough Strategy - DMAIC
Methodology
Gen. ElectricMotorolaWhere developed
VM6-Sigma