value partners group limited 惠理集團有限公司...at fair value through profit or loss 124.0...
TRANSCRIPT

1
Hong Kong Exchanges and Clearing Limited and The Stock Exchange of Hong Kong Limited take no responsibility for the contents of this announcement, make no representation as to its accuracy or completeness and expressly disclaim any liability whatsoever for any loss howsoever arising from or in reliance upon the whole or any part of the contents of this announcement.
VALUE PARTNERS GROUP LIMITED惠理集團有限公司
(Incorporated in the Cayman Islands with limited liability)
(Stock Code: 806)
FINAL RESULTS ANNOUNCEMENTFOR THE YEAR ENDED 31 DECEMBER 2019
FINANCIAL HIGHLIGHTS
The key financial highlights for the reporting period are as follows:
(In HK$ million) 2019 2018 % Change
Total revenue 1,603.9 1,641.4 -2.3%
Gross management fees 1,362.4 1,347.5 +1.1%
Gross performance fees 55.3 56.2 -1.6%
Operating profit (before other gains/losses) 343.7 399.9 -14.1%
Profit attributable to owners of the Company 513.4 229.5 +123.7%
Basic earnings per share (HK cents) 27.7 12.4 +123.4%
Diluted earnings per share (HK cents) 27.7 12.4 +123.4%
Interim dividend per share Nil Nil
Final dividend per share (HK cents) 9.0 6.0 +50.0%
Special dividend per share (HK cents) 13.0 Nil
Total dividends per share (HK cents) 22.0 6.0 +266.7%
FINAL RESULTS
The Board of Directors (the “Board”) of Value Partners Group Limited (the “Company”) is pleased to announce the consolidated results of the Company and its subsidiaries (the “Group”) for the year ended 31 December 2019.

2
CONSOLIDATED STATEMENT OF COMPREHENSIVE INCOMEFor the year ended 31 December 2019
2019 2018Note HK$’000 HK$’000
IncomeFee income 2 1,603,918 1,641,365Distribution fee expenses (807,946) (810,936)
Net fee income 795,972 830,429
Other income 100,458 104,542
Total net income 896,430 934,971
ExpensesCompensation and benefit expenses 3 (400,167) (379,228)Operating lease rentals (8,987) (43,541)Depreciation of right-of-use assets – properties (29,677) –Other expenses 4 (113,876) (112,277)
Total expenses (552,707) (535,046)
Operating profit (before other gains/losses) 343,723 399,925
Net gains/(losses) on investments 191,015 (189,721)Unrealized gain on an investment held-for-sale 5,827 –Fair value gain of an investment property 5,072 17,134Net foreign exchange (losses)/gains (8,584) 3,880Other 500 –
Other gains/(losses) – net 5 193,830 (168,707)
Operating profit (after other gains/losses) 537,553 231,218Finance costs (5,627) –Share of gains of joint ventures 32,649 68,475
Profit before tax 564,575 299,693Tax expense 6 (51,166) (70,240)
Profit for the year attributable to owners of the Company 513,409 229,453
Other comprehensive loss for the year– Items that have been reclassified or
may be subsequently reclassified to profit or lossFair value gains/(losses) on financial assets
at fair value through other comprehensive income 7 280 (281)Foreign exchange translation 7 (16,173) (7,053)
Other comprehensive loss for the year 7 (15,893) (7,334)
Total comprehensive income for the year attributable to owners of the Company 497,516 222,119
Earnings per share attributable to owners of the Company (HK cents per share)
Basic earnings per share 8 27.7 12.4Diluted earnings per share 8 27.7 12.4
3
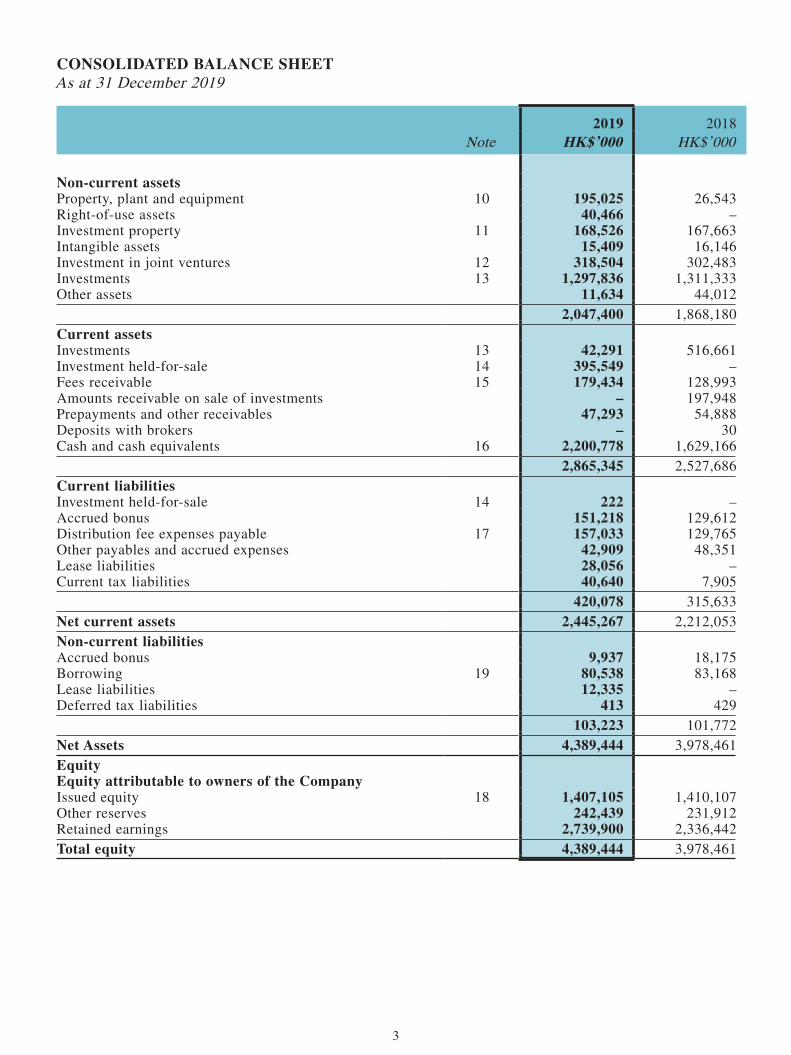
CONSOLIDATED BALANCE SHEETAs at 31 December 2019
2019 2018Note HK$’000 HK$’000
Non-current assetsProperty, plant and equipment 10 195,025 26,543Right-of-use assets 40,466 –Investment property 11 168,526 167,663Intangible assets 15,409 16,146Investment in joint ventures 12 318,504 302,483Investments 13 1,297,836 1,311,333Other assets 11,634 44,012
2,047,400 1,868,180Current assetsInvestments 13 42,291 516,661Investment held-for-sale 14 395,549 –Fees receivable 15 179,434 128,993Amounts receivable on sale of investments – 197,948Prepayments and other receivables 47,293 54,888Deposits with brokers – 30Cash and cash equivalents 16 2,200,778 1,629,166
2,865,345 2,527,686Current liabilitiesInvestment held-for-sale 14 222 –Accrued bonus 151,218 129,612Distribution fee expenses payable 17 157,033 129,765Other payables and accrued expenses 42,909 48,351Lease liabilities 28,056 –Current tax liabilities 40,640 7,905
420,078 315,633Net current assets 2,445,267 2,212,053Non-current liabilitiesAccrued bonus 9,937 18,175Borrowing 19 80,538 83,168Lease liabilities 12,335 –Deferred tax liabilities 413 429
103,223 101,772Net Assets 4,389,444 3,978,461EquityEquity attributable to owners of the CompanyIssued equity 18 1,407,105 1,410,107Other reserves 242,439 231,912Retained earnings 2,739,900 2,336,442Total equity 4,389,444 3,978,461

4
NOTES TO THE CONSOLIDATED FINANCIAL STATEMENTS
1. BASIS OF PREPARATION
The consolidated financial statements of the Company have been prepared in accordance with Hong Kong Financial Reporting Standards (the “HKFRS”) issued by the Hong Kong Institute of Certified Public Accountants.
The Group has adopted the new standards, amendments and interpretations which are effective for the Group’s financial year beginning 1 January 2019. The adoption had no significant impact on the Group’s results and financial position nor any substantial changes in the Group’s accounting policies, except for those disclosed as follows:
HKFRS 16 “Leases” results in almost all leases being recognized on the balance sheet, as the distinction between operating and finance leases is removed. Under the new standard, an asset (the right to use the leased item) and a financial liability to pay rentals are recognized. The only exceptions are short-term and low-value leases. The accounting for lessors does not significantly change. Some of the commitments may be covered by the exception for short-term and low value leases and some commitments may relate to arrangements that do not qualify as leases under HKFRS 16. The Group has applied the simplified transition approach and has not restated comparative amounts for the 2018 reporting period. Right-of-use assets for property leases are measured on transition as if the new rules had always been applied. All other right-of-use assets are measured at the amount of the lease liability on adoption (adjusted for any prepaid or accrued lease expenses).
On 1 January 2019, right-of-use assets for property leases of HK$67,801,000 and lease liabilities of HK$68,476,000 were recognized on the consolidated balance sheet.
We have summarized the rental and relevant expenses as follows:
2019 2018HK$’000 HK$’000
Operating lease rentals 8,987 43,541Depreciation of right-of-use assets – properties 29,677 –Finance costs 2,602 –
Total rental and relevant expenses 41,266 43,541
5
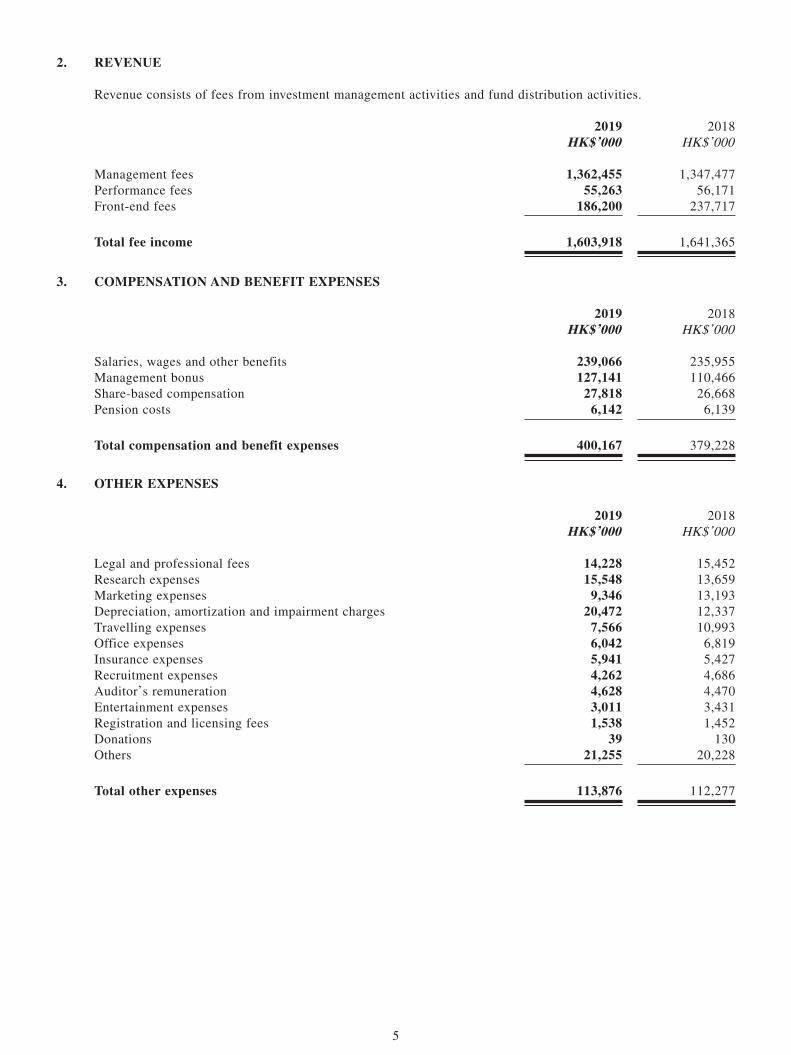
2. REVENUE
Revenue consists of fees from investment management activities and fund distribution activities.
2019 2018HK$’000 HK$’000
Management fees 1,362,455 1,347,477Performance fees 55,263 56,171Front-end fees 186,200 237,717
Total fee income 1,603,918 1,641,365
3. COMPENSATION AND BENEFIT EXPENSES
2019 2018HK$’000 HK$’000
Salaries, wages and other benefits 239,066 235,955Management bonus 127,141 110,466Share-based compensation 27,818 26,668Pension costs 6,142 6,139
Total compensation and benefit expenses 400,167 379,228
4. OTHER EXPENSES
2019 2018HK$’000 HK$’000
Legal and professional fees 14,228 15,452Research expenses 15,548 13,659Marketing expenses 9,346 13,193Depreciation, amortization and impairment charges 20,472 12,337Travelling expenses 7,566 10,993Office expenses 6,042 6,819Insurance expenses 5,941 5,427Recruitment expenses 4,262 4,686Auditor’s remuneration 4,628 4,470Entertainment expenses 3,011 3,431Registration and licensing fees 1,538 1,452Donations 39 130Others 21,255 20,228
Total other expenses 113,876 112,277

6
5. OTHER GAINS/(LOSSES) – NET
2019 2018HK$’000 HK$’000
Net gains/(losses) on investmentsNet realized gains/(losses) on financial assets at fair value through
profit or loss 124,066 (27,471)Net unrealized gains/(losses) on financial assets at fair value through
profit or loss 66,949 (162,250)Unrealized gain on an investment held-for-sale 5,827 –Fair value gain of an investment property 5,072 17,134Others
Net foreign exchange (losses)/gains (8,584) 3,880Gains on disposal of property, plant and equipment 500 –
Total other gains/(losses) – net 193,830 (168,707)
6. TAX EXPENSE
Under current tax laws of the Cayman Islands, there are no income, estate, corporation, capital gains or other taxes payable by the Group. As a result, no provision for income and capital gains taxes has been made in the consolidated financial statements.
Hong Kong profits tax has been provided on the estimated assessable profit for the year ended 31 December 2019 at the rate of 16.5% (2018: 16.5%). Tax outside Hong Kong is calculated at the rates applicable in the relevant jurisdictions.
2019 2018HK$’000 HK$’000
Current taxHong Kong profits tax 42,766 50,424Overseas tax 10,405 20,556Adjustments in respect of prior years (1,989) (1,291)
Total current tax 51,182 69,689
Deferred taxOrigination and reversal of temporary differences (16) 551
Total tax expense 51,166 70,240

7
7. OTHER COMPREHENSIVE LOSS
2019 2018HK$’000 HK$’000
Items that have been reclassified or may be subsequently reclassified to profit or loss:
Fair value gains/(losses) on financial assets at fair value through other comprehensive income 280 (281)
Foreign exchange translation (16,173) (7,053)
Total other comprehensive loss (15,893) (7,334)
8. EARNINGS PER SHARE
The calculations of basic and diluted earnings per share are based on the profit attributable to owners of the Company of HK$513,409,000 (2018: HK$229,453,000).
The basic earnings per share is based on the weighted average number of shares in issue during the year of 1,855,550,000 (2018: 1,855,528,000). The diluted earnings per share is calculated by adjusting the weighted average number of shares in issue during the year of 1,855,550,000 (2018: 1,855,528,000) by 108,000 (2018: 986,000) to assume conversion of all dilutive potential ordinary shares granted under the Company’s share option scheme.
9. DIVIDENDS
2019 2018HK$’000 HK$’000
Proposed final dividend of HK9.0 cents (2018: HK6.0 cents) per ordinary share 166,957 111,349
Proposed special dividend of HK13.0 cents (2018: Nil) per ordinary share 241,161 –
Total dividends 408,118 111,349
For the year ended 31 December 2019, the directors recommended a final dividend of HK9.0 cents per share and a special dividend of HK13.0 cents per share. The estimated total final dividend and total special dividend are HK$166,957,000 and HK$241,161,000 respectively. Such dividends are to be approved by shareholders at the Annual General Meeting of the Company on 27 April 2020 and have not been recognized as a liability at the balance sheet date.

8
10. PROPERTY, PLANT AND EQUIPMENT
On 1 August 2019, a wholly owned subsidiary of the Group signed a sale and purchase agreement and completed the transaction to acquire 100% equity interest of a Hong Kong incorporated company named King Fung Limited (Subsequently changed to “Complete Value Investing Company Limited” after this acquisition), which directly held office units in Shanghai, China with a consideration of US$23.76 million (equivalent to HK$185.8 million) and transaction costs of HK$2.0 million which were directly attributable to the acquisition. As the Group has the intention to own-use the office units, they were classified as “property, plant and equipment”.
11. INVESTMENT PROPERTY
During the year ended 31 December 2018, the Group acquired the entire interest in a student accommodation investment property located in New Zealand under a freehold land with a consideration of HK$146,390,000. The investment property was revalued at 31 December 2019 with a fair value gain of HK$5,072,000.
12. INVESTMENT IN JOINT VENTURES
As at 31 December 2019, “investment in joint ventures” on the consolidated balance sheet, amounting to HK$318,504,000 (2018: HK$302,483,000), represents the Group’s (i) 50% equity interest in Value Investing Group Company Limited, which has the trust beneficiary interests in three logistics centers in Japan, and (ii) 50% equity interest in Clear Miles Hong Kong Limited, acquired during the year, which has interest in one industrial property in Australia.
9
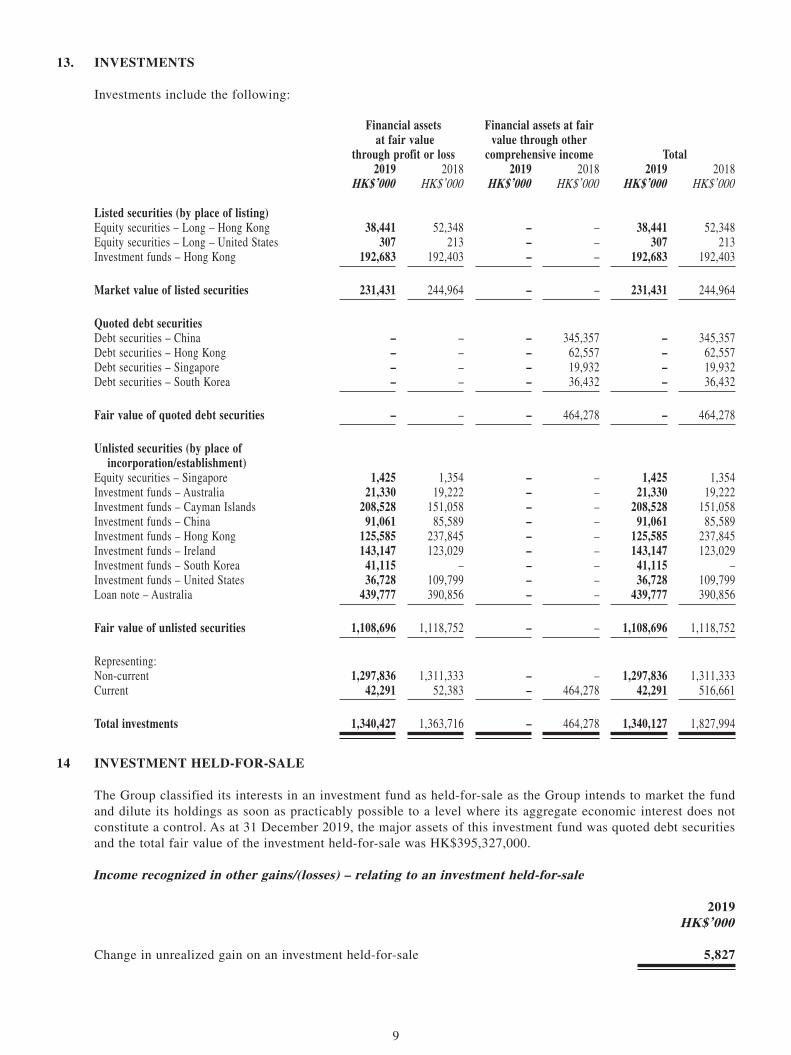
13. INVESTMENTS
Investments include the following:
Financial assets at fair value
through profit or loss
Financial assets at fair value through other
comprehensive income Total2019 2018 2019 2018 2019 2018
HK$’000 HK$’000 HK$’000 HK$’000 HK$’000 HK$’000
Listed securities (by place of listing)Equity securities – Long – Hong Kong 38,441 52,348 – – 38,441 52,348Equity securities – Long – United States 307 213 – – 307 213Investment funds – Hong Kong 192,683 192,403 – – 192,683 192,403
Market value of listed securities 231,431 244,964 – – 231,431 244,964
Quoted debt securitiesDebt securities – China – – – 345,357 – 345,357Debt securities – Hong Kong – – – 62,557 – 62,557Debt securities – Singapore – – – 19,932 – 19,932Debt securities – South Korea – – – 36,432 – 36,432
Fair value of quoted debt securities – – – 464,278 – 464,278
Unlisted securities (by place of incorporation/establishment)
Equity securities – Singapore 1,425 1,354 – – 1,425 1,354Investment funds – Australia 21,330 19,222 – – 21,330 19,222Investment funds – Cayman Islands 208,528 151,058 – – 208,528 151,058Investment funds – China 91,061 85,589 – – 91,061 85,589Investment funds – Hong Kong 125,585 237,845 – – 125,585 237,845Investment funds – Ireland 143,147 123,029 – – 143,147 123,029Investment funds – South Korea 41,115 – – – 41,115 –Investment funds – United States 36,728 109,799 – – 36,728 109,799Loan note – Australia 439,777 390,856 – – 439,777 390,856
Fair value of unlisted securities 1,108,696 1,118,752 – – 1,108,696 1,118,752
Representing:Non-current 1,297,836 1,311,333 – – 1,297,836 1,311,333Current 42,291 52,383 – 464,278 42,291 516,661
Total investments 1,340,427 1,363,716 – 464,278 1,340,127 1,827,994
14 INVESTMENT HELD-FOR-SALE
The Group classified its interests in an investment fund as held-for-sale as the Group intends to market the fund and dilute its holdings as soon as practicably possible to a level where its aggregate economic interest does not constitute a control. As at 31 December 2019, the major assets of this investment fund was quoted debt securities and the total fair value of the investment held-for-sale was HK$395,327,000.
Income recognized in other gains/(losses) – relating to an investment held-for-sale
2019HK$’000
Change in unrealized gain on an investment held-for-sale 5,827
10
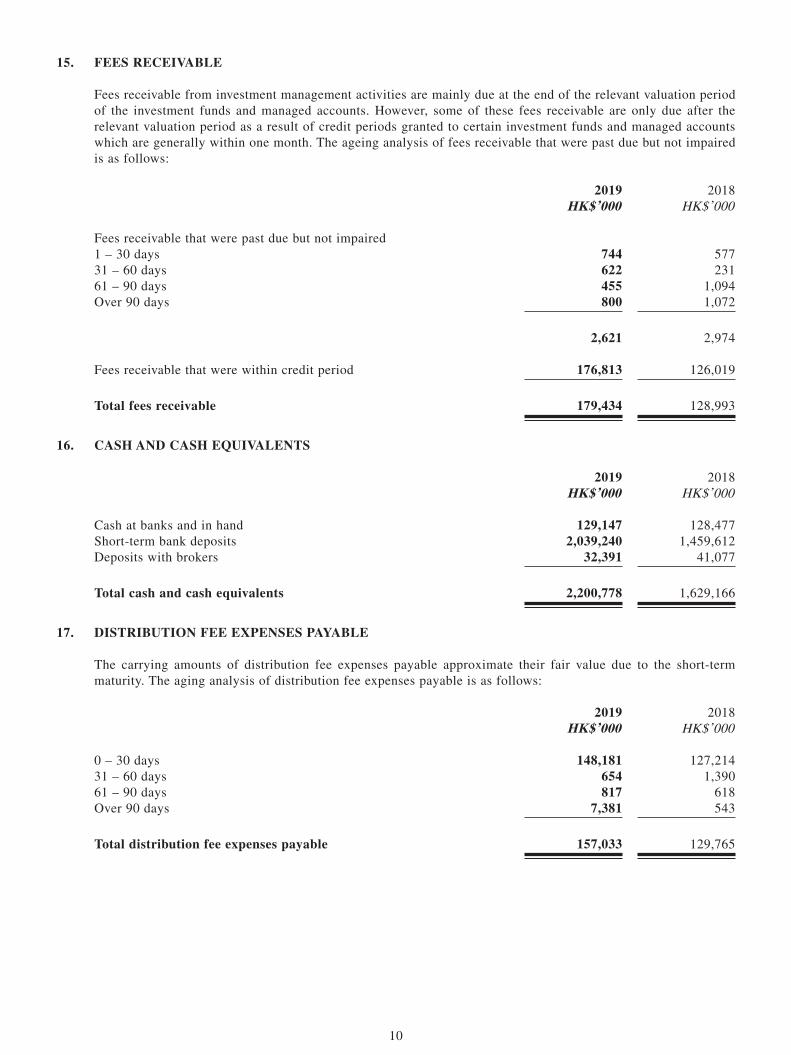
15. FEES RECEIVABLE
Fees receivable from investment management activities are mainly due at the end of the relevant valuation period of the investment funds and managed accounts. However, some of these fees receivable are only due after the relevant valuation period as a result of credit periods granted to certain investment funds and managed accounts which are generally within one month. The ageing analysis of fees receivable that were past due but not impaired is as follows:
2019 2018HK$’000 HK$’000
Fees receivable that were past due but not impaired1 – 30 days 744 57731 – 60 days 622 23161 – 90 days 455 1,094Over 90 days 800 1,072
2,621 2,974
Fees receivable that were within credit period 176,813 126,019
Total fees receivable 179,434 128,993
16. CASH AND CASH EQUIVALENTS
2019 2018HK$’000 HK$’000
Cash at banks and in hand 129,147 128,477Short-term bank deposits 2,039,240 1,459,612Deposits with brokers 32,391 41,077
Total cash and cash equivalents 2,200,778 1,629,166
17. DISTRIBUTION FEE EXPENSES PAYABLE
The carrying amounts of distribution fee expenses payable approximate their fair value due to the short-term maturity. The aging analysis of distribution fee expenses payable is as follows:
2019 2018HK$’000 HK$’000
0 – 30 days 148,181 127,21431 – 60 days 654 1,39061 – 90 days 817 618Over 90 days 7,381 543
Total distribution fee expenses payable 157,033 129,765

11
18. ISSUED EQUITY
Number ofshares Issued equity
HK$’000
As at 1 January 2019 1,855,814,831 1,410,107Share buy back (732,000) (3,002)
As at 31 December 2019 1,855,082,831 1,407,105
As at 1 January 2018 1,851,714,831 1,391,473Shares issued upon exercise of share options 4,100,000 18,634
As at 31 December 2018 1,855,814,831 1,410,107
19. BORROWING
2019 2018HK$’000 HK$’000
Non-currentBank loan 80,538 83,168
The borrowing is secured by the investment property located in New Zealand.
The maturity of borrowing is as follows:
2019 2018HK$’000 HK$’000
Between 1 and 5 years 80,538 83,168
20. SUBSEQUENT EVENT
The Group applies the fair value model to measure certain investments which are subject to significant judgement and estimates. As at 31 December 2019, the total fair value of the Group’s investment in investment property, investment in joint ventures with underlying investment properties, and Level 3 investments amounted to HK$168,526,000, HK$318,504,000 and HK$644,237,000, respectively (refer to Note 11, 12 and 13 for details of these investments). In 2020, the fair value of these investments may be subject to further fluctuation due to the coronavirus outbreak, the impact of which is still under assessment by management.

12
CHAIRMAN’S STATEMENT
Value Partners advanced strongly in 2019, achieving HK$513.4 million (per share earnings of 27.7 HK cents) in net profit, 123.7% higher than the previous year. As foreseen (see our previous-year Chairman’s Statement), a recovery occurred in regional markets in 2019, while our funds performed well, and so we benefitted.
We’re also encouraged by long-term trends that are proving very helpful, particularly the golden opportunities arising from the rapid development of financial services in China.
But huge challenges remain. Most immediately, the world faces a spread of coronavirus, which has triggered a panic reaction that in some ways is worse than the disease itself. Because the U.S. stockmarket, the world’s largest, had reached an extreme valuation, it was particularly vulnerable to bad news, and it plunged, adding a financial shock to the supply and the demand shock that had emerged already.
For Value Partners as a business, there are other, longer term challenges as well. In the fund management industry today, size matters. So Value Partners needs size to stay competitive, in an environment characterized by high costs, declining margins and a corresponding need for economies of scale. While giving priority to our fund performance, we cannot neglect the need to raise more funds for management.
Overall, however, we are optimistic.
Like all such shocks, the impact of coronavirus will subside, and governments and central banks are committed to using powerful monetary and fiscal tools to fight back. Indeed China, currently a core focus for us, may come out of this crisis looking better than was expected. Although the damage inflicted on the economy is painful, with 2020 growth projected to drop to 5% or less after last year’s 6.1%, the country remains among the world’s fastest developing, with a massive domestic-consumer market of its own providing a solid foundation. Robust measures taken by Chinese authorities in early 2020 to contain coronavirus tells the story of a China that can stay on top of crises, while avoiding the breakdown in social stability that troubles so many parts of the world today.
Currently China’s domestic “A” share market, with more than 3,800 companies listed in Shanghai and Shenzhen, is the world’s second largest stockmarket after the U.S. Foreign ownership of “A” shares, at less than 4%, remains low but as entry barriers ease, we anticipate major foreign inflows. China-related stocks, currently trading at around 10 to 12 times earnings, are cheap compared to the U.S. multiple of 17 and the global average of 151.
For Value Partners, China is a core focus not only because it is a source of attractive investments but also because it is the area where our business is expanding fastest. As can be seen in the accompanying “Management Discussion and Analysis” report, Value Partners, as a Hong Kong company, just celebrated 10 years on the Chinese mainland, and it is considered a pioneer and market leader in its sector. Funds raised directly from mainland clients account for 11% of the Group’s funds under management, and are rising quickly.
We are well-recognized in mainland China, having received a steady stream of business licences, awards and citations. We are aware that the Beijing government likes the kind of investing that we do, as it seeks to encourage an institutional culture and a value-investing style to remake its capital market into a more efficient and rational capital allocation mechanism.

13
Potential to expand
Currently, despite the strains imposed by the coronavirus outbreak, Value Partners is profitable. Funds under management remained stable at US$15.0 billion at the end of 2019, the same level as 2018. The total number of staff was 238. Worth noting is that with our well-developed infrastructure, including full-sized front, middle and back office teams, our platform can accommodate a much larger fund size than what we have today, giving us the potential to expand without undue stress.
Performance remains excellent. Taking our flagship Value Partners Classic Fund as an example (fund size: US$1.2 billion), the fund climbed by 32.4%2 net in 2019 compared to the Hang Seng Index’s 13.6% increase. Since launch in 1993, this fund has recorded a profit in 19 and a loss in eight of its 27 years in existence.
For 2019, we are proposing a final dividend of 9.0 HK cents per share and a special dividend of 13.0 HK cents per share. Total dividends per share are significantly higher than the 6.0 HK cents paid out in 2018.
Appreciation
To the many clients, shareholders and service providers who have supported and encouraged us, we shall always be grateful. Very importantly, may I express special thanks and recognition to the many outstanding people we have on our staff, who are a key part of the Value Partners success story.
Hong Kong currently faces the stress of social unrest and disruptions caused by the coronavirus outbreak, but all throughout, our head office in Hong Kong remained calm and professional. The same is true of all other offices in the group, including those on the mainland and in Southeast Asia. With integrity and pride, our staff remain dedicated to looking after our clients, who have entrusted their savings to us.
Dato’ Seri CHEAH Cheng HyeCo-Chairman and Co-Chief Investment Officer
1. Sources: Shanghai and Shenzhen Stock exchanges, Bloomberg, Wind, as at end of February 2020.
2. Annual calendar returns of Value Partners Classic Fund (A Units) over the past five years: 2015: -1.5%; 2016: -3.2%; 2017: +44.9%; 2018: -23.1%; 2019: +32.4%; 2020 (Year to date as at 29 February): -8.5%. Source for performance figures: HSBC Institutional Trust Services (Asia) Limited and Bloomberg. Past performance is not indicative of future performance. Performance in USD, NAV to NAV, with dividend reinvested and net of fees.

14
MANAGEMENT DISCUSSION AND ANALYSIS
2019 saw challenging market headwinds abating toward the end of the year as geopolitical risks receded, lifting overall investor sentiment. In spite of the external environment, we drove the business forward with new products and initiatives across channels. Noteworthy are developments in mainland China where we procured more business licenses to provide a broader range of investment services to Chinese investors. We obtained four more China onshore funds under the private fund management (“PFM”) scheme, bringing our total PFM funds to eight. Our business in mainland China continues to grow as our assets under management (“AUM”) raised from the mainland rose significantly in 2019. On the alternative space, we successfully closed our first private debt fund.
Though the new year entered into a cautionary mode, we are positioned and prepared. This is likely to be an uncertain time at least in the first half of 2020 and for stabilization or recovery thereafter. So while it is understandable to experience anxiety as a result of the coronavirus outbreak, it is more important for us as investors to keep calm and stay objective. We will optimize this period to husband our resources, that is, to invest prudently and adhere to cost targets with discipline. This will also enable us to better plan for future growth and deliver performance for investors.
Staying ahead of the competition
The Group continued to record steady inflows into our funds through intermediary channels. We successfully further penetrated different channels with new products across a wider risk spectrum to cater to varying investor appetite. This included the Value Partners Multi-Asset Fund for investors seeking diversification in climates of uncertainty, and the Value Partners Asian Total Return Bond Fund to capture the investment grade segment, which comprises a chunk of the market where we have yet to gain a foothold. We anticipate further AUM growth for the Value Partners Asian Total Return Bond Fund as it approaches a 2-year track record.
While we had earlier laid the groundwork for equities and fixed income offerings, our efforts have been extended to alternatives, a new frontier of expansion in the asset management industry as demand grows. Investors often look to alternatives as an asset class for absolute return and potentially could have a big role to play in any event of a downturn.
Even as the competition among peers intensified, our sustainable track record and solid relationship with different major distributors continued to propel our business growth.
Financial highlights
As we witnessed challenging and surprising market conditions in 2019, net profit came in at HK$513.4 million. The ending AUM remained stable at US$15.0 billion. Much redemption outflows were offset by AUM raised from strong net flows into the Value Partners Greater China High Yield Income Fund and our China business segment – this rose 60% year-on-year from US$1.1 billion to US$1.7 billion.
The net management fees dropped by 4% mainly driven by the decrease in the Group’s average AUM and increase in funds distributed through channels. Gross performance fees remained stable at HK$55.3 million as multiple funds surpassed their high-water mark levels.

15
The Group continued to scale down costs, with fixed cost coverage ratio at 2.1 times for 2019. This ratio measures the number of times that fixed operating expenses (excluding discretionary and non-recurring expenses) are covered by net management fee income. We continue to maintain a strong cash position. Overall, earnings per share increased to 27.7 HK cents, a 123.4% jump from the year earlier.
Mainland business – Our 10th anniversary in China
2019 ushered a new chapter for China’s capital markets as policymakers announced further measures to broaden the financial sector. Incidentally, it also marked the 10th anniversary of the establishment of our Shanghai office. During the past decade, we made significant inroads of opportunity in China, making them a crucial part of our success story. We are also heartened to be ranked by Z-Ben Advisors as one of the top 10 (Value Partners is at number eight) wholly foreign-owned enterprises (“WFOE”) operating in mainland China for 2019, rising from number 14 in 2018. It gives us tremendous honor to be the only Asia-based asset manager on the list serving the Chinese market amidst a landscape which is increasingly competitive.
Value Partners was also named by Shanghai Securities News as one of the “Most Promising WFOE Private Fund House” at the 10th Golden Sunshine Award and “2019 Ying Hua New-Sharp Foreign Private Fund Company Award” by China Fund . Value Partners was also conferred the “China – 2019 Best WFOE House” by Asia Asset Management .
Taking our role as a pioneer foreign investor in stride, we further consolidated our leading position – expanding our footprint and building up a seasoned and localized team of investment and business professionals. We increased four more China onshore funds under the private fund management (“PFM”) scheme, bringing our total PFM funds to eight. Our flagship Value Partners Classic Fund and Value Partners High-Dividend Stocks Fund were approved by the China Securities Regulatory Commission under the Mainland-Hong Kong Mutual Recognition of Fund (“MRF”) program with Tianhong Asset Management as the master agent of the funds on the mainland.
Our business in China continues to grow significantly – assets under management raised from China and related business rose 60% in 2019. With mainland clients growing to comprise 11% of our client base, up from 7% a year ago, we decided to curate our expertise and investment strategy outlook with our first Value Partners China Investment Forum in October 2019, held in Shanghai.
China’s asset management industry holds enormous potential and we believe we will benefit from the continuous reform and opening up of China’s financial industry. This has been evidenced by continued rapid accumulation of mainland household assets and the increasing proportion of foreign investors’ investment in the Chinese market. We take a long term perspective on China’s long term prospects, and continue to remain invested across market cycles.
Extending our footprint
In Europe, we have made significant progress in restructuring our UCITS fund platform and continuing to roll out our schedule for country registration. As such, our UCITS range is set to become available for cross-border distribution to a broad investor audience.

16
In addition, our accelerated marketing activities on the ground have greatly enhanced local recognition of Value Partners as a leading regional Asia and China specialist.
In Taiwan, we have further broadened our intermediary channels and received inflows from institutional investors.
As Southeast Asia is an important component of China’s Belt and Road initiative, we have been proactively preparing for business expansion in Malaysia, where we will be launching new innovative products, including Shariah-compliant funds and Southeast Asia-focused smart ETFs.
In Singapore, the business has experienced significant inflows via private banking and intermediary channels throughout 2019. We increased client engagement efforts and further on-boarded funds through various client platform.
Achievement and growth
For 2019, multiple funds including our flagship Value Partners Classic Fund, achieved their high-water mark, or a historical peak net asset value above which we charge performance fees. The Value Partners Classic Fund rose 32.4%1 during the year, while another fund that also hit its high-water mark, the Value Partners High-Dividend Stocks Fund, gained 14.9%2 during the year.
Over in fixed income, Value Partners Greater China High Yield Income Fund won “Best Total Return – Greater China Fixed Income (for both 3 years and 5 years)” from the Fifth Annual Offshore China Fund Awards organized by the Chinese Asset Management Association of Hong Kong and Bloomberg . In addition, the Fund also received the coveted “High Yield Fund – Platinum Winner” award from the Fund Selector Asia Awards Hong Kong 2019. For 2019, the Fund, which is now the largest fund in the China high yield segment in terms of AUM, generated a solid return of 9.4%3.
Fixed income has grown significantly as an asset class for Value Partners, accounting for 44% of the Group’s total assets under management, which has leapfrogged from 5% since 2012 when the first fixed income fund was launched.
2019 was also a good year for real estate private equity. Our existing core real estate private equity fund posted positive returns as at the end of 2019, achieving an internal rate of return above both the initial target and the hurdle rate. Driving investor interest in real estate were low global bond yields underpinned by low interest rates as a result of accommodative monetary policy.
As an asset class, core real estate remains one of the few investment opportunities currently offering solid income returns with low volatility. In view of the favourable backdrop, we plan to launch another new core fund within this year. Separately, the team will launch a Malaysia Shariah Fund in the second half of 2020. The fund had already been registered under Malaysia’s Securities Commission in February 2020 and was met by robust investor interest when the team began marketing efforts in 2019.
Value Partners’ product suite has grown from a single equity fund at the time of the Group’s founding in 1993 to what’s now a family of more than 40 funds spanning equities, fixed income, multi-asset, quantitative investment solutions and alternatives. Over the period, we made great inroads with our alternative investment capabilities, which cover private equity and private debt.

17
We launched a total of six products in 2019 including an Asian innovation fund in February and a China equity fund for European investors in October. We also initiated a credit fund that covers the Asia market under our alternative investment capabilities. We rolled out three new fixed income products, including a fixed maturity bond fund in July, Value Partners Asian Fixed Maturity Bond Fund 2022 in November, and a Greater China high yield bond fund under the UCITS scheme in December.
2020 outlook
Financial markets are set to weather risks for 2020, which could stem from geopolitical tussles, trade or diseases. The efforts made by central banks around the world to continue injecting liquidity into the system will reduce the likelihood of a global recession in 2020. For Asia, indicators suggest that the regional economies are about to, if not already, hit a trough and rebound. Forecasters are more widely anticipating economic and corporate earnings recovery. Alongside concerns of a virus outbreak, we believe a distressed scenario has been priced into several countries, including China, which lays the ground for recovery and a buying opportunity.
Appreciation
Last but not least, we would like to thank all our stakeholders – colleagues, shareholders, clients and business partners for their support. We believe that regardless of the external market environment, we can steward our capabilities and navigate the opportunities and challenges that surface.
1. Annual calendar returns of Value Partners Classic Fund (A Units) over the past five years: 2015: -1.5%; 2016: -3.2%; 2017: +44.9%; 2018: -23.1%; 2019: +32.4%; 2020 (Year to date as at 29 February): -8.5%.
2. Annual calendar returns of Value Partners High-Dividend Stocks Fund (Class A1) over the past five years: 2015: -3.7%; 2016: -0.2%; 2017: +32.9%; 2018: -14.2%; 2019: +14.9%; 2020 (Year to date as at 29 February): -8.9%.
3. Annual calendar returns of Value Partners Greater China High Yield Income Fund (Class P Acc USD) over the past five years: 2015: +6.1%; 2016: +15.9%; 2017: +10.1%; 2018: -4.9%; 2019: +9.4%; 2020 (Year to date as at 29 February): +1.0%.
Source for performance figures: HSBC Institutional Trust Services (Asia) Limited and Bloomberg. Past performance is not indicative of future performance. Performance in USD, NAV to NAV, with dividend reinvested and net of fees.
SFC authorization is not a recommendation or endorsement of a scheme nor does it guarantee the commercial merits of a scheme or its performance. It does not mean the scheme is suitable for all investors nor is it an endorsement of its suitability for any particular investor or class of investors.

18
FINANCIAL REVIEW
Assets Under Management
AUM and return
The Group’s assets under management (“AUM”) stood at US$15,007 million at the end of December 2019 (31 December 2018: US$15,025 million). The movement was mainly attributable to the positive fund returns of US$2,260 million offset by net redemptions of US$1,657 million in 2019.
Overall fund performance1, calculated as the asset-weighted average return of funds under management, rose 15.6% in 2019. Among our funds, the Value Partners Greater China High Yield Income Fund2, the Group’s largest public fund3 in Hong Kong, generated a solid return of 9.4% during the year. The Value Partners Classic Fund4, our flagship equity fund, jumped 32.4% during the year, while the Value Partners High-Dividend Stocks Fund5 gained 14.9% during the year.
As a result of major redemptions amounting to approximately US$2 billion from a white label client during the second half of the year, we recorded a net outflow of US$1,657 million in 2019, reversing a net inflow of US$1,172 million in 2018. The net outflow in 2019 was accounted for by gross subscriptions of US$7,045 million (2018: US$8,108 million) and gross redemptions of US$8,702 million (2018: US$6,936 million).
4,733
2,977
16,14516,948
17,71118,271
17,18318,052
16,00515,151 14,988 15,204 14,913 15,007
2,312
5,7257,045
8,702
2,260
15,007
15,025
7,045
10,000
8,000
6,000
4,000
0
2,000
(2,000)
(4,000)
(1,657)(3,413)
1,756
8,1086,936
1,172
(621)
(8,702)
US$ million
Gross subscriptions
Gross redemptions
Net subscriptions/(redemptions)
AUM changein the year 2019
Subscriptions andRedemptioins
Monthly AUMin the past twelve months
Average AUM16,200
US$ million
Beginning AUM
Subscriptions
Redemptions
Performance
Dividend distribution
Ending AUM
US$ million
Jan Feb Mar Apr May Jun Jul Aug Sep Oct Nov Dec
1H 2019 2H 2019 FY 2019 FY 2018

19
AUM by category
The charts below show the breakdown of the Group’s AUM as at 31 December 2019 using two classifiers: brand and strategy. Own Branded Funds (82%) remained the biggest contributor to the Group’s AUM. By strategy, Absolute Return Long-biased Funds (53%) continued to represent the largest share of the Group’s AUM, followed by Fixed Income Funds (44%), where Value Partners Greater China High Yield Income Fund was the largest contributor. The share of Group’s AUM accounted for by the Value Partners Greater China High Yield Income Fund increased steadily during the year.
82% 72%18% 28%
53%44%
2%1%
62%36%
1%1%
Own Branded FundsWhite Label & Co-branded Funds
Classi�cation by brand
Absolute Return Long-biased FundsFixed Income FundsAlternative FundsQuantitative Funds & ETF
Classi�cation by strategy
2019 2018
2019 20182018
20182019
2019
Client base
During the year, clients in the institutional segment – institutions, pension funds, high-net-worth individuals (“HNWIs”), endowments and foundations, funds of funds, and family offices and trusts – remained the Group’s primary set of fund investors, accounting for 59% of total AUM (31 December 2018: 63%). Meanwhile, retail clients contributed 41% of total AUM (31 December 2018: 37%). In terms of geography, Hong Kong clients continued as the largest segment, contributing 71% of the Group’s AUM (31 December 2018: 78%). There was a notable rise in the share of AUM attributable to clients in Mainland China, which increased to 11% (31 December 2018: 7%) as the Group’s China business witnessed solid growth in 2019. The share of AUM contributed by clients in Singapore remained stable at 8% (31 December 2018: 7%), while clients from the United States and Europe took up a combined 6% (31 December 2018: 5%).
41% 37%
20%27%
14%10% 21%
2% 2%
26%
71%11%
8%
3%1%3%
78%7%7%
2%1%2%
Client analysis by type
Hong KongChina
Others
Client analysis by geographical region
Singapore
EuropeAustralia
2019 2018
2019 2018
20192018
20192018
3% 3%United States
Retail
Pension fundsOthers
High-net-worth individualsInstitutions

20
Summary of results
Key financial highlights for the reporting period are as follows:
(In HK$ million) 2019 2018 % Change
Total revenue 1,603.9 1,641.4 -2.3%Gross management fees 1,362.4 1,347.5 +1.1%Gross performance fees 55.3 56.2 -1.6%Operating profit (before other gains/losses) 343.7 399.9 -14.1%Profit attributable to owners of the Company 513.4 229.5 +123.7%Basic earnings per share (HK cents) 27.7 12.4 +123.4%Diluted earnings per share (HK cents) 27.7 12.4 +123.4%Interim dividend per share Nil NilFinal dividend per share (HK cents) 9.0 6.0 +50.0%Special dividend per share (HK cents) 13.0 NilTotal dividends per share (HK cents) 22.0 6.0 +266.7%
Revenue and fee margin
500
1,500
1,000
2,000
2,500
1,362.455.3
186.2
(621.4)(0.4)
(186.1)
100.5
1,347.556.2
237.7
(578.8)5.0
(237.2)
104.5 0
104.5
1,641.4 (811.0)
934.9
100.5
1,603.9 (807.9)
896.5
Revenue Management fees Performance fees Front-end fees
Breakdown of total net income
(In HK$ million)
HK$ million
2019 2018
Distribution fee expenses Management fee rebate Performance fee rebate Other revenue rebate
Other income Other income
2019 2018
The Group’s profit attributable to owners of the Company increased to HK$513.4 million in 2019 (2018: HK$229.5 million). Gross management fees, the Group’s largest revenue contributor, increased 1.1% to HK$1,362.4 million (2018: HK$1,347.5 million). This was a result of an increase in our annualized gross management fee margin to 108 basis points (2018: 103 basis points) on the back of strong net flows into the Value Partners Greater China High Yield Income Fund, which has relatively higher margins, which was offset by a 3.9% decrease in the Group’s average AUM to US$16,200 million (2018: US$16,855 million).
With the increase in funds distributed through channels, the management fees rebates increased by 7.4% to HK$621.4 million (2018: HK$578.8 million). Meanwhile, our annualized net management fee margin remained stable at 60 basis points (2018: 59 basis points).

21
Gross performance fees, another source of revenue, remained stable at HK$55.3 million (2018: HK$56.2 million), as most of the Group’s funds which netted performance fees finished the year below or slightly above their high-water marks. Performance fees are generated when eligible funds, at their performance fee crystallization dates, report returns exceeding their high-water marks for the respective period up to the crystallization date.
Other revenue mainly included a front-end load, of which a substantial amount was rebated to distribution channels (a usual practice in the market).
Other income, which mainly comprised of interest income, dividend income and rental and other income from an investment property, totaled HK$100.5 million (2018: HK$104.5 million). The change was mainly due to a drop in dividend income to HK$15.0 million (2018: HK$30.3 million) and interest income to HK$65.8 million (2018: HK$67.4 million), net with a rise in the rental and other income to HK$12.7 million (2018: HK$2.5 million).
Other gains and losses
Breakdown of other gains/(losses) – net
(In HK$ million) 2019 2018
Net gains/(losses) on investmentsNet realized gains/(losses) on financial assets
at fair value through profit or loss 124.0 (27.5)Net unrealized gains/(losses) on financial
assets at fair value through profit or loss 67.0 (162.2)Unrealized gain on an investment held-for-sale 5.8 –Fair value gain of an investment property 5.1 17.1Gains on disposal of property,
plant and equipment 0.5 –Net foreign (losses)/exchange gains (8.6) 3.9
Other gains/(losses) – net 193.8 (168.7)
Other gains or losses mainly included fair value changes and realized gains or losses on seed capital investments, investments in our own funds and other investments, as well as net foreign exchange gains or losses. Seed capital investments are made by the Group to provide capital that was considered necessary to new funds during the initial phase of fund launches. The Group also invests in its own funds alongside investors, where appropriate, for better alignment of interests and investment returns. Other gains on a net basis totaled HK$193.8 million in the period including the unrealized gain of HK$50.4 million on the loan note held by the Real Estate Partnership, swinging from losses of HK$168.7 million in 2018 as some of our seed capital investments booked mark-to-market gains as a result of an improved market sentiment.
Investment in joint ventures
Investment in joint ventures represents the Group’s 50% equity interest in Value Investing Group Company Limited and its 50% equity interest in Clear Miles Hong Kong Limited. Value Investing Group Company Limited has trust beneficiary interests in three Japanese logistics centers, while Clear Miles Hong Kong Limited has 100% indirect interest in an Australian industrial property. The Group’s share of gains amounted to HK$32.6 million (2018: HK$68.5 million), which consisted of revaluation gains on properties that totaled HK$14.7 million (2018: HK$46.5 million) and rental income of HK$17.9 million (2018: HK$22.0 million).

22
Cost management
200
400
600
800
241.5127.1
3.727.8
111.314.317.5
9.5
0
238.2110.5
3.926.7
400.1
152.6
552.7
379.3
155.8
535.1
118.719.212.3
5.6
Breakdown of total expenses
(In HK$ million)
HK$ million
Compensation and bene�t expenses Fixed salaries and staff bene�ts Management bonus Staff rebates Share-based compensation expenses
Other expenses Other �xed operating costs Sales and marketing Depreciation, excluding depreciation of right-of-use assets – propertiesNon-recurring expenses
2019 2018
2019 2018
In terms of cost management, the Group continued to exercise stringent cost discipline and kept fixed operating expenses covered by net management fee income, which is a relatively stable source of income. Such coverage is measured by the “fixed cost coverage ratio”, an indicator showing the number of times that fixed operating expenses (excluding discretionary and non-recurring expenses) are covered by net management fee income. The Group aims to maintain a fixed cost coverage ratio of around 2 times. For 2019, the Group reported a fixed cost coverage ratio of 2.1 times (2018: 2.2 times).
Compensation and benefit expenses
During the year, fixed salaries and staff benefits rose by HK$3.3 million to HK$241.5 million (2018: HK$238.2 million). The increase was mainly attributable to salary increments.
As part of its compensation policy, the Group distributes 20% to 23% of its annual net profit pool as a management bonus to employees. The management bonus for 2019 totaled HK$127.1 million (2018: HK$110.5 million). The profit pool is calculated by deducting certain adjustments from net profit before the management bonus and taxation. This discretionary bonus is maintained to promote staff loyalty and performance while aligning employee and shareholder interests.
The staff of Value Partners is entitled to partial rebates of management fees and performance fees when investing in funds managed by the Group. Staff rebates for the year amounted to HK$3.7 million (2018: HK$3.9 million).
During the year, the Group recorded expenses of HK$27.8 million (2018: HK$26.7 million), which were related to stock options granted to employees. This expense item had no impact on cash flow and was recognized in accordance with Hong Kong Financial Reporting Standards.
Other expenses
Other non-staff operating costs – such as rent, legal and professional fees, investment research fees, and other administrative and office expenses – amounted to HK$111.3 million for the period (2018: HK$118.7 million), while sales and marketing expenses decreased to HK$14.3 million (2018: HK$19.2 million).

23
Dividends
The Group has been adopting a consistent dividend distribution policy that takes into account the relatively volatile nature of asset management income streams. This policy states that dividends (if any) will be declared annually at the end of each financial year to better align dividend payments with the Group’s full-year performance. Dividend per share is declared based on the Group’s realized profit, which excludes unrealized gains and losses recognized.
For 2019, the Board of Directors recommended a final dividend of HK9.0 cents per share and a special dividend of HK13.0 cents per share to shareholders.
Liquidity and financial resources
Fee income is the Group’s main source of income, while other income sources include interest income generated from bank deposits and dividend income from investments held. At the end of 2019, the Group’s balance sheet and cash flow positions remained strong, with a net cash balance of HK$2,200.8 million. Net cash inflows from operating activities amounted to HK$351.5 million, while the Group had no corporate bank borrowings and did not pledge any assets as collateral for overdrafts or other loan facilities. The Group’s debt-to-equity ratio, measured by interest bearing external borrowings (excluding borrowings by investment funds where the Group has a controlling interest) divided by shareholders’ equity, was zero, while its current ratio (current assets divided by current liabilities) was 6.8 times.
Capital structure
As at 31 December 2019, the Group’s shareholders’ equity and total number of shares issued were HK$4,389.4 million and 1.86 billion, respectively.
1. Overall fund performance is calculated by taking an asset-weighted average of returns of the most representative share class of all funds managed by Value Partners.
2. Annual calendar returns of Value Partners Greater China High Yield Income Fund (Class P Acc USD) over the past five years: 2015: +6.1%; 2016: +15.9%; 2017: +10.1%; 2018: -4.9%; 2019: +9.4%; 2020 (Year to date as at 29 February): +1.0%.
3. SFC authorization is not a recommendation or endorsement of a scheme nor does it guarantee the commercial merits of a scheme or its performance. It does not mean the scheme is suitable for all investors nor is it an endorsement of its suitability for any particular investor or class of investors.
4. Annual calendar returns of Value Partners Classic Fund (A Units) over the past five years: 2015: -1.5%; 2016: -3.2%; 2017: +44.9%; 2018: -23.1%; 2019: +32.4%; 2020 (Year to date as at 29 February): -8.5%.
5. Annual calendar returns of Value Partners High-Dividend Stocks Fund (Class A1) over the past five years: 2015: -3.7%; 2016: -0.2%; 2017: +32.9%; 2018: -14.2%; 2019: +14.9%; 2020 (Year to date as at 29 February): -8.9%.
Source for performance figures: HSBC Institutional Trust Services (Asia) Limited and Bloomberg. Past performance is not indicative of future performance. Performance in USD, NAV to NAV, with dividend reinvested and net of fees.
24
SCOPE OF WORK OF PRICEWATERHOUSECOOPERS HONG KONG
The figures in respect of the Group’s consolidated statement of comprehensive income, consolidated balance sheet and related notes thereto for the year ended 31 December 2019 as set out in the preliminary announcement have been agreed by the Group’s auditor, PricewaterhouseCoopers Hong Kong (PwC), to the amounts set out in the Group’s draft consolidated financial statements for the year. The work performed by PwC in this respect did not constitute an assurance engagement in accordance with Hong Kong Standards on Auditing, Hong Kong Standards on Review Engagements or Hong Kong Standards on Assurance Engagements issued by the Hong Kong Institute of Certified Public Accountants and consequently no assurance has been expressed by PwC on the preliminary announcement.
HUMAN RESOURCES
As at 31 December 2019, the Group employed 183 staff (2018: 190) in Hong Kong SAR, 32 staff (2018: 22) in Shanghai, 6 staff (2018: 7) in Shenzhen, 6 staff (2018: 10) in Singapore, 3 staff (2018: 3) in London, 8 staff (2018: 5) in Malaysia and nil staff (2018: 1) in United States. Remuneration packages that take into account of business performance, market practices and competitive market conditions are offered to employees in compensation for their contributions. In line with the Group’s emphasis on recognition for performance and human capital retention, the Group rewards its employees with year-end discretionary bonus which is linked to the Group’s level of profits for that financial year.
DIVIDENDS
No interim dividend was paid during the year. The Board is pleased to recommend the distribution of a final dividend of HK9.0 cents per share and a special dividend of HK13.0 cents per share for the year ended 31 December 2019. Subject to the approval of shareholders of the Company at the Annual General Meeting (“AGM”) for the year 2020, the final and special dividends will be payable on or about 21 May 2020 to shareholders whose names appear on the Registers of Members of the Company at close of business on 7 May 2020. Dividend per share is declared based on the Group’s realized profit which excluded the unrealized gains and losses recognized, the Board will continue to review the Group’s financial position and capital needs every year in deciding its dividend recommendation going forward.
ANNUAL GENERAL MEETING
It is proposed that the AGM will be held on Monday, 27 April 2020. Notice of the Annual General Meeting will be published and issued to shareholders in due course.
CLOSURE OF REGISTER OF MEMBERS
1. AGM
For determining the entitlement to attend and vote at the AGM, the Register of Members of the Company will be closed from Wednesday, 22 April 2020 to Monday, 27 April 2020 both days inclusive, during which period no transfer of shares will be effected. In order to be eligible to attend and vote at the AGM, all transfers accompanied by the relevant share certificates must be lodged with the Company’s branch share registrar in Hong Kong, Tricor Investor Services Limited at Level 54, Hopewell Centre, 183 Queen’s Road East, Hong Kong not later than 4:00 p.m. on Tuesday, 21 April 2020.
25
2. Proposed Final and Special Dividends
The proposed final and special dividends are subject to the passing of an ordinary resolution by shareholders at the AGM. The record date for entitlement to the proposed final and special dividends is 7 May 2020. For determining the entitlement to the proposed final and special dividends, the Register of Members of the Company will be closed from Tuesday, 5 May 2020 to Thursday, 7 May 2020, both days inclusive, during which period no transfer of shares will be effected. The ex-dividend date will be Wednesday, 29 April 2020. In order to qualify for the proposed final and special dividends mentioned above, all transfers accompanied by the relevant share certificates must be lodged with the Company’s branch share registrar in Hong Kong, Tricor Investor Services Limited at the abovementioned address not later than 4:00 p.m. on Monday, 4 May 2020.
PURCHASE, SALE OR REDEMPTION OF THE COMPANY’S SECURITIES
The Company has purchased a total of 732,000 Shares on the Stock Exchange during the year ended 31 December 2019 and the aggregate consideration paid was HK$3,001,854. As at 31 December 2019, the total number of Shares in issue was 1,855,082,831. All the repurchased Shares were cancelled.
Save as disclosed above, neither the Company, nor any of its subsidiaries purchased, redeemed or sold any of the Company’s listed shares during the year.
AUDIT COMMITTEE
In compliance with the Rules Governing the Listing of Securities on The Stock Exchange of Hong Kong Limited (the “Listing Rules”), the Company has an audit committee which comprises three Independent Non-executive Directors. The Audit Committee has reviewed the accounting principles and practices adopted by the Group and discussed auditing, internal controls and financial reporting matters including a review of the consolidated results of the Group for the year ended 31 December 2019.
CORPORATE GOVERNANCE
The Company is committed to maintaining high standards of corporate governance. As corporate governance requirements change from time to time, the Board periodically reviews its corporate governance practices to meet the rising expectations of shareholders and to comply with increasingly stringent regulatory requirements. In the opinion of the Directors, the Company applied the principles and complied with the relevant code provisions in the Corporate Governance Code, as set out in Appendix 14 of the Listing Rules for the year ended 31 December 2019.
MODEL CODE FOR SECURITIES TRANSACTIONS BY DIRECTORS
The Company has adopted a code of conduct regarding Directors’ securities transactions on terms no less exacting than the required standard set out in the Model Code for Securities Transactions by Directors of Listed Issuers (“Model Code”) as contained in Appendix 10 to the Listing Rules.
The Company has made specific enquiry with all Directors and all of them confirmed that they have complied with the required standard set out in the Model Code for the year ended 31 December 2019.

26
PUBLICATION OF FINAL RESULTS AND ANNUAL REPORT ON THE STOCK EXCHANGE
The final results announcement is published on the websites of the Stock Exchange (http://www.hkexnews.hk) and the Company (https://www.valuepartners-group.com). The annual report will be despatched to shareholders and will be available on the websites of the Stock Exchange and the Company in due course.
OUR APPRECIATION
Finally, we would like to express our gratitude to shareholders, business partners, distributors and customers for their unfaltering support. We would also like to thank our dedicated staff for their contributions to the success of the Group.
By order of the board ofValue Partners Group LimitedDato’ Seri CHEAH Cheng Hye
Co-Chairman and Co-Chief Investment Officer
Hong Kong, 12 March 2020
As of the date of this Announcement, our Directors are Dato’ Seri Cheah Cheng Hye, Mr. So Chun Ki Louis, Ms. Hung Yeuk Yan Renee and Mr. Ho Man Kei, Norman as Executive Directors and Dr. Chen Shih Ta Michael, Mr. Nobuo Oyama and Mr. Wong Poh Weng as Independent Non-executive Directors.