value relevance and components of deferred tax assets and
TRANSCRIPT

Value Relevance and Components of Deferred Tax Assets and Liabilities
Asian Journal of Business and Accounting, 3(1), 2010 55
Asian Journal of Business and Accounting, 3(1), 2010, 55-88 ISSN 1985-4064
* Corresponding author. Kittima Acaranupong is an Assistant Professor at the School ofAccountancy, University of the Thai Chamber of Commerce, 126/1 Vibhavadee-RangsitRoad, Dindaeng, Bangkok 10400, Thailand, e-mail: [email protected].
Value Relevance and Components of Deferred TaxAssets and Liabilities: Evidence from the Listed
Companies on SET 100 in Thailand
Kittima Acaranupong*
AbstractThis paper examines the components of deferred tax assets and liabilitiesfor early adopters of the proposed Thai Accounting Standard (TAS) No. 12Income Taxes which is expected to be adopted in 2013. It also investigatesthe value relevance of deferred tax assets and liabilities information forearly adopters and non-early adopters of the proposed standard. The resultindicates that the main components of deferred tax assets are taxable losscarryforward while those of deferred tax liabilities are deprecation. Usingthe Feltham- Ohlson (1995) Model for the period from 2004 to 2008, thisresearch reveals that deferred tax assets and deferred tax liabilities arevalue relevant information for early adopters whilst only deferred tax assetsare value relevant information for non-early adopters. The results from thisstudy also support the notion that the adoption of International AccountingStandards (IAS) and International Financial Reporting Standards (IFRS) inThailand will improve the relevance of financial statements. Furthermore,it will enhance the comparability of the financial statements of the Thailisted companies with that of listed companies in foreign countries.
Keywords: Deferred Tax Assets, Deferred Tax Liabilities, Value Relevance
JEL Classification: G14, M41
1. Introduction
The Federation of Accounting Professions of Thailand (FAP), theaccounting regulatory body in Thailand, has announced the full adoptionof the International Accounting Standards (IAS) and International FinancialReporting Standards (IFRS) for firms listed on the Stock Exchange ofThailand (SET), Market for Alternative Investment (MAI), as well as fornon-listed companies in 2011. The harmonisation of Thai Accounting

Kittima Acaranupong
56 Asian Journal of Business and Accounting, 3(1), 2010
Standards (TAS) with IAS/IFRS will increase the transparency, relevanceand comparability of the financial statements of these companies. Users ofthe financial statements can evaluate the performance of the local andforeign companies without the need to adjust for differences in accountingpolicies and practices.
The main effect of the adoption of IAS/IFRS is that many types ofassets and liabilities will be stated in the balance sheet at fair value, whichwill reflect the companies’ true financial positions. This will enhance thequalitative characteristic of the accounting information, especially forrelevance. Studies have shown that the associations between equity pricesand book value and earnings/returns in the post adoption of IAS periodsare more than those of pre adoption periods (Barth, Landsman, & Lang,2008).
IAS No. 12 Income Taxes (Revised 2008: Bound Volume 2009) is oneof the important accounting standards which are in the process of beingadopted by FAP. This standard prohibits the deferral method and allowsonly the balance sheet liability method in recording deferred tax assetsand liabilities. As at 30 June 2009, this standard is still in a draft form (draftThai Accounting Standard No. 56 Income Taxes) in Thailand, and uponadoption, it will be known as Thai Accounting Standard (TAS) No. 12Income Taxes. In 2009, FAP announced that this standard would becomeeffective from 1 January 2011; however, in 2010 FAP postponed itsimplementation to 1 January 2013.
In Thailand, one hundred and thirty six (136) listed companies onSET adopted the deferred tax accounting policy during 1995-2006. Asmentioned above, the new TAS No. 12 Income Taxes, upon implementation,will prohibit the deferral method. Although this accounting standard isnot effective yet, some listed companies on SET decided to be proactive andadopted it before it is mandated. Thus, some companies use the balancesheet liability method (the required accounting treatment prescribed in theproposed TAS No. 12) for recording deferred tax assets and liabilities. Somecompanies still continue to use the deferral method. Moreover, it should benoted that there are the reciprocal changes of accounting policies betweenthe deferral method and the balance sheet liability method during the timeperiod of 1995-2006 (Toommanon, 2007). Therefore, these differences ofaccounting practices as well as the potential impacts of the soon-to-beadopted proposed TAS No. 12 provide motivation and opportunity toinvestigate and compare the value relevance of deferred taxes for earlyadopters and non-early adopters of TAS No. 12.
Most prior studies which examined the incentives of early adoptionrevealed that the main reasons for early adoption are earnings manipulation

Value Relevance and Components of Deferred Tax Assets and Liabilities
Asian Journal of Business and Accounting, 3(1), 2010 57
incentives (Gujarathi & Hoskin, 1992), and in some cases, better futureperformances (Moyer, 1990). For example, as mentioned by Moyer (1990),increasing and maintaining the ‘capital adequacy ratio’ in accordancewith the banking regulations were among the benefits enjoyed bycompanies which early adopted the Statement of Financial AccountingStandard No. 96 (Accounting for Income Taxes) in the US.
However, the effects of the deferred tax accounting policy adoptionon value relevance are still under-explored in Thailand. Thus, the mainobjective of this study is to examine the deferred tax accounting policy andthe components of deferred tax assets and liabilities in the balance sheetsof early adopters of the proposed TAS No. 12 Income Taxes.
In this study, the early adopters are those companies which use thebalance sheet liability method while non-early adopters are the companieswhich do not adopt the deferred tax accounting policy or companies whichuse the deferral method. This study further investigates the value relevanceof deferred tax assets and liabilities, and compares the value relevance ofdeferred tax assets and liabilities of early adopters and non-early adoptersof the proposed TAS No. 12. The scope of this study is the top 100 companieslisted on SET’s main board in terms of large market capitalisation, highliquidity, and compliance with requirements regarding the distribution ofshares to minor shareholders (see details in 2.2) as at 30 June 2009.
This study is significant as it is expected to provide policy directionsto the FAP regarding the efficacy of the proposed TAS No. 12 Income Taxesfor the Thai capital market. If the results of this study prove that the valuerelevance of deferred tax assets and liabilities of early adopters is morethan those of non-early adopters, it can be foreseen that the adoption ofthis standard will enhance the ability of users to predict the true firm values.In other words, the early adoption of this accounting standard will bebeneficial to companies and users of the financial statements. Therefore,the merits of early adoption outweigh the costs incurred. This study hasalso managerial implications in that its results provide incentives formanagers to make necessary decisions as to whether to early adopt thisproposed accounting standard or not.
The outline of this paper is as follows. Section 2 reviews the previousstudies and develops the research hypotheses. Section 3 presents the dataused and the research design of this study. The empirical results areprovided in section 4. The final section concludes this paper and providessome suggestions.
For ease of reference, the term “companies” and “firms” will be usedinterchangeably throughout this paper.

Kittima Acaranupong
58 Asian Journal of Business and Accounting, 3(1), 2010
2. Literature review
2.1 Proposed Thai Accounting Standard (TAS) No. 12 Income Taxes
The objective of the proposed TAS No. 12 Income Taxes is to prescribe theaccounting treatment for income taxes. The principal issue in accountingfor income taxes is how to account for the current and future income taxconsequences of future recovery (settlement) of the carrying amount of assets(liabilities) that are recognised in an entity’s balance sheet and transactionsand other events of the current period that are recognised in an entity’sfinancial statements. The main content of this proposed standard is thesame as IAS No. 12 (Revised 2008: Bound Volume 2009). According to thisproposed standard, income taxes include not only domestic and foreigntaxes which are based on taxable profits, but also taxes such as withholdingtaxes, which are payable by a subsidiary, associate or joint venture ondistributions to the reporting entity.
2.1.1 Definitions
The following items are used in the proposed TAS No. 12 with theirmeanings specified:
Deferred tax assets are the amounts of income taxes recoverable infuture periods in respect of first, deductible temporary differences; secondly,carryforward of unused tax losses; and lastly, carryforward of unused taxcredits.
Deferred tax liabilities are the amounts of income taxes payable infuture periods in respect of taxable temporary differences. Temporarydifferences are the differences between the carrying amount of an assetand liability in the balance sheet and its tax base. Temporary differencesmay be either:
1. Taxable temporary differences which are the temporarydifferences that will result in taxable amounts in determiningtaxable profit (tax loss) of future periods when the carryingamount of the asset or liability is recovered (settled); or
2. Deductible temporary differences which are the temporarydifferences that will result in amounts that are deductible indetermining taxable profit (tax loss) of future periods when thecarrying amount of the asset or liability is recovered (settled).
The proposed TAS No. 12 requires an entity to account for deferredtax using the balance sheet liability method and prohibits the deferral

Value Relevance and Components of Deferred Tax Assets and Liabilities
Asian Journal of Business and Accounting, 3(1), 2010 59
method. The deferral method focuses on timing differences whereas thebalance sheet liability method focuses on temporary differences. Timingdifferences are differences between taxable profit and accounting profitthat originate in one period and reverse in one or more subsequent periods.Temporary differences are differences between the tax base of an asset orliability and its carrying amount in the balance sheet. The tax based of anasset or liability is the amount attributed to that asset or liability for taxpurposes.
In 2009, the proposed TAS No. 12 was still in its exposure period,inviting comments from stakeholders and the public. If there is a need, thestandard will be revised before being implemented on 1 January 2013.Therefore, it is timely to investigate whether opting for the proposed TASNo. 12 will provide value relevant information to the financial statementusers of Thai companies.
2.2 SET 100 characteristics
SET 100 companies are the top hundred (100) listed companies on SET interms of three important aspects, namely, large market capitalisation, highliquidity and compliance with requirements regarding the distribution ofshares to minor shareholders. The stocks to be included in the SET 100index are selected based on three main criteria. Firstly, eligible stock shouldhave been listed and traded on the SET for a minimum of six (6) monthsand ranked in the top two hundred (200) on the SET’s main board in termsof average daily market capitalisation for the past twelve (12) months.Secondly, they must be ‘actively’ traded and must maintain their sharedistribution of free-float qualifications, i.e. their ordinary shareholders holdshares in aggregation of no less than 20 per cent of the paid-up capital ofthe listed firms. Thirdly, if there are more than hundred (100) stocks selectedusing the above selection criteria, the top fifty (50) stocks ranked by averagedaily market capitalisation will be chosen for the SET 50 index (the 51st –55th stocks will be treated as the replacements for the SET 50 index). Then,the top fifty (50) stocks, together with the next fifty (50) stocks, (i.e. the top100 stocks) will be included in the SET 100 index (the 101st-105st stockswill be treated as replacements for the SET 100 index).
There are previous researches that investigated the efficiency of theThai Stock Market. For example, Karemera, Ojah, and Cole (1999) foundthat most of the emerging markets including the Thai Stock Market wereweak-form efficient. Yongsawadvanich (2001) examined the efficiency ofthe Thai Stock Market since its inception to December 2000. This studyemployed various methodologies such as the Variance Ratio Test, the

Kittima Acaranupong
60 Asian Journal of Business and Accounting, 3(1), 2010
Autocorrelation Coefficients Test, the Ljung-Box Test, and the Run tests.Yongsawadvanich (2001) indicated that a clear conclusion could not bedrawn whether the market was efficient or not due to its mixed results.Moreover, Kim and Shamsuddin (2006) also indicated that the Thai StockMarket attained efficiency after the 1997 Asian financial crisis period (1999-2000). However, Lim, Brooks, and Kim (2008) found that the crisis adverselyaffected the efficiency of most Asian Stock Markets including Thailand.
As these studies produced contradictory results, one cannot draw aconsistent conclusion on whether the Thai Capital Market is efficient ornot. However, it is agreed that the level of market efficiency of the ThaiStock Market has improved significantly since the Asian financial crisisperiod. The only clear inference which can be made based on the priorresearch is that the Stock Exchange of Thailand is least weak-form efficientand the efficiency level has increased after the Asian financial crisis period.
2.2.1 The number of listed companies on SET 100 classified by industries andsectors
The listed companies on SET are classified into eight (8) industries andtwenty-six (26) sectors. Table 1 presents the number of listed companies onSET 100 classified by industries and sectors.
From Table 1, it can be seen that the majority of the listed companieson SET 100 are in Resources Industry-Energy and Utilities Sector(18 companies) and Property and Construction Industry-PropertyDevelopment Sector (16 companies). There is no company in the followingsectors that is listed on SET 100: Consumer Products Industry-Home andOffice Products Sector, Consumer Products Industry-Personal Productsand Pharmaceuticals Sector, Financials Industry-Insurance Sector,Industrials Industry-Paper and Printing Materials Sector, Property andConstruction Industry-Property Fund Sector, Resources Industry-MiningSector, and Services Industry-Professional Services Sector.
2.3 The effects of IFRS adoption on value relevance of accountinginformation
There are many studies conducted on the effects of IFRS adoption on equitypricing. For example, Wang, Young, and Zhuang (2007) examined stockmarket reaction to the elaborate bureaucracy that was involved in theadoption of IFRS in the European Union (EU). Their findings suggestedthat the EU stock market reacted positively to the events which increasedthe likelihood of IFRS adoption. Similarly, Negash (2008) examined theIAS adoption effect on companies listed on the Johannesburg Securities

Value Relevance and Components of Deferred Tax Assets and Liabilities
Asian Journal of Business and Accounting, 3(1), 2010 61
Table 1: The number of listed companies on SET 100* classified byindustries and sectors
Numbers ofIndustry Sector Listed Companies
on SET 100
Agro and Food AGRI Agribusiness 3Industry FOOD Food and Beverage 4
Consumer FASHION Fashion 1Products HOME Home and Office Products 0
PERSON Personal Products and 0Pharmaceuticals
Financials BANK Banking 11FIN Finance and Securities 3INSUR Insurance 0
Industrials AUTO Automotive 2IMM Industrials Materials and 3
MachineryPAPER Paper and Printing Materials 0PETRO Petrochemicals and Chemicals 2PKG Packaging 1
Property and CONMAT Construction Materials 6Construction PFUND Property Fund 0
PROP Property Development 16
Resources ENERG Energy and Utilities 18MINE Mining 0
Services COMM Commerce 6HELTH Health Care Services 3MEDIA Media and Publishing 3PROF Professional Services 0TOURISM Tourism and Leisure 1TRANS Transportation and Logistics 6
Technology ETRON Electronic Components 3ICT Information and Communication 8
Technology
* Listed companies on SET 100 are based on the selection criteria as at 30 June 2009.
Exchange (JSE). Negash used the Ohlson (1995) model (book value plusearnings and dividends), and applied a four-year window period toexamine the value relevance of accrual accounting information in preliberalisation (pre IAS adoption of 1989-1993) and post IAS adoption period

Kittima Acaranupong
62 Asian Journal of Business and Accounting, 3(1), 2010
(1998-2004). The study had a liberalisation (integration) perspective, andconcluded that when scaled effects were controlled the difference in panelregression r-squares vanished. This suggested that the value relevance ofaccounting information did not improve in the post IAS adoption period.
In contrast, Barth et al. (2008) developed a comprehensive index forfinancial reporting quality. It composed of: (1) earnings management(including earnings smoothing) indicators; (2) timely recognition of losses;and (3) value relevance of accrual accounting information. They examinedthese indicators using cross countries data, pooled regressions, controlvariables and matched samples, in both pre and post IAS adoption periods.From the results it can be concluded that IAS adoption is associated withlower earnings management, more timely recognition of large losses andmore association between equity prices and book value and earnings/returns.
2.4 Value relevance of deferred tax assets and deferred tax liabilities
Prior research has also examined the relationship between deferred taxesand stock prices, but most of these studies focused on companies listed onthe New York Stock Exchange (NYSE) (Chaney & Jeter, 1992; Amir,Kirschenheiter, & Willard, 1997; Ayers, 1998). Chaney and Jeter (1992) foundthat there was a negative relationship between amortisation of deferredtaxes and stock’s returns. In addition, Givoly and Hayn (1992) carried outa research study focusing on the information content of the announcementof the 1986 TAX Reform Act. The result showed that the market reacted todeferred tax information, and changes of stock prices occurred when therewere reversals of deferred taxes.
Amir et al. (1997) studied the incremental value relevance of deferredtax after the adoption of SFAS No. 109 Income Taxes (repealed SFAS No.96). SFAS No. 109 required companies to disclose the components ofdeferred tax assets and deferred tax liabilities separately. The researchersused the Feltham and Ohlson (1995)’s model to investigate the relationshipbetween stock prices and net operating assets, net financial assets andunexpected operating income. They added the deferred tax items into themodel. The results indicated that the deferred taxes were related significantlyto stock prices.
Ayers (1998) ran the regression analysis between stock prices and thecomponents of balance sheet items of companies’ adoption of SFAS No.109. The model included the net deferred tax assets (liabilities). Net deferredtax assets (liabilities) were composed of the deferred taxes according toAPB No. 11 and the cumulative effect of changes in the accounting standard

Value Relevance and Components of Deferred Tax Assets and Liabilities
Asian Journal of Business and Accounting, 3(1), 2010 63
on SFAS No. 109. The result showed that the deferred taxes and thecumulative effect of changes in accounting standards were relatedsignificantly to the stock prices.
Tang (2006) examined the relationship between the book-tax difference(BTD) and one-year ahead earnings, indicating that analysts and investorsrely on the information impounded in BTD to assess companies’ futureperformances. Tang used the sample of companies listed on the StockExchange of China. The study divided BTD into normal and abnormalcomponents. Normal BTD (NBTD) was defined as the mechanicaldifferences due to different income reporting requirements in GAAP andtax laws whereas Abnormal BTD (ABTD) referred to the opportunisticdifferences due to earnings management and tax management. The evidenceshowed that this decomposition provided incremental information toinvestors. The results indicated that there was a negative associationbetween BTD and future earnings. The larger BTD signified that the currentearnings were more transitory and less persistent, thereby suggestingpoorer performance in the following years. On the other hand, smallerBTD signified the contrary.
Lynn, Seethamraju, and Seetharaman (2006) tested the incrementalvalue relevance of unrecognised deferred tax amounts report under UKSSAP No. 15 (now superseded by UK FRS No. 19) of companies listed onthe London Stock Exchange. UK SSAP No. 15 required the partial methodof accounting of deferred taxes. Under the partial method, a companyrecognises only that portion of deferred tax that is projected to reverse in ahorizon of a few years. The unrecognised portion of deferred tax must,however, be reported in footnotes. Their study examined empiricallywhether the use of the partial method provides incremental use to investors.They found positive associations between prices and net deferred tax assets-both recognised and unrecognised. They also found that both types ofdeferred tax have similar multiples. That is, both recognised andunrecognised deferred tax assets were value relevant information.
Jackson (2009) investigated the relationship between book-taxdifference (BTDs) and earnings growth of listed companies in the USA.The study hypothesised that non-temporary component of BTDs(permanent differences and tax accruals) was negatively related to futurechanges in tax expenses whereas the temporary component of BTDs(deferred taxes) was negatively related to changes in future pre-tax earnings.The results confirmed the predictions in the hypotheses. Jackson’s studyalso looked at the relationship between BTDs and earnings growth withand without earnings management. The result showed little evidence thatearnings management drives BTD/earnings growth relation. Overall, the

Kittima Acaranupong
64 Asian Journal of Business and Accounting, 3(1), 2010
researcher suggested that the various components of BTDs captureunderlying economic events and transaction that predict future changesin pre-tax earnings and tax expenses.
2.5 The adoption of deferred tax accounting policy in Thailand
Toommanon (2007) examined the auditors’ reports and accounting policiesof deferred tax assets and liabilities from the notes to financial statementsof companies listed on the Stock Exchange of Thailand during 1995-2006.The researcher discovered that one hundred and thirty six (136) companiesadopted the deferred tax accounting policy. As discussed above, the TASNo. 12 Income Taxes will become effective in 2013, thus, companies couldchoose the deferral method or the balance sheet liability method. As at 31December 2006, none of the companies listed on the Market for AlternativeInvestment (MAI) early adopted this standard except for Chuo Senko(Thailand) Public Firm and Goldfine Manufactures Public Limited Firm.The result also indicated that seventy five (75) companies changed thedeferred tax accounting method from the balance sheet liability method tothe deferral method, and nineteen (19) companies changed from the deferralmethod to the balance sheet liability method during 1995-2006. Most of thecompanies which adopted the deferred tax accounting policy were in thefollowing sectors: Financials, Property and Construction, Services, Agroand Food, Industrials, Consumer Products, Technology, and ResourcesIndustries.
It was also observed that there were the reciprocal changes betweenthe deferral method and the balance sheet liability method during 1995-2006. The change from the balance sheet liability method to the deferralmethod has effects on the firm’s net income. The net incomes of forty nine(49) companies increased whereas the net incomes of three (3) companiesdecreased. However, the net incomes of twenty three (23) companiesremained unchanged. In addition, the change from the balance sheetliability method to the deferral method also affected the debt to equity ratio.The debt to equity ratio of twenty (20) companies increased while that oftwenty eight (28) companies decreased. The change from the deferralmethod to the balance sheet liability method also affected some of thecompanies’ net income. As a result, three (3) companies’ net incomesincreased whereas three (3) companies’ net incomes decreased. However,thirteen (13) companies did not experience any effect on their net incomes.
Furthermore, Toommanon (2007)’s study also investigated the marketreaction to the change of accounting policy from the balance sheet liabilitymethod to the deferral method. The result indicated that thirteen (13) firms
Value Relevance and Components of Deferred Tax Assets and Liabilities
Asian Journal of Business and Accounting, 3(1), 2010 65
had positive cumulative abnormal returns and eleven (11) firms hadnegative cumulative abnormal returns. The moving average of cumulativeabnormal return twenty one (21) days around the changes of accountingpolicy dates1 was -6.09. That is, the market reacted negatively to the changeof accounting policy from the balance sheet liability method to the deferralmethod. However, the market reaction which occurred twenty one (21)days around the change date was not statistically significant. Toommanon(2007) did not test the market reaction to the change from the deferral methodto the balance sheet liability method.
Even if there are studies in the past which examined the effects of thedeferred tax accounting policy adoption on value relevance, this area isstill under-explored in Thailand. Therefore, this gap in the literatureprovides the opportunity to test the value relevance of deferred tax assetsand liabilities for early adopters and non-early adopters of TAS No. 12Income Taxes and to compare the differences in value relevance of earlyadopters and non-early adopters. The outcome of this study can be used asa guideline to FAP to enhance and improve the efficacy of this proposedstandard.
2.6 Research hypotheses development
Previous researches showed that the deferred tax assets and liabilitieswere related to stock prices (Amir et al., 1997; Ayers, 1998; Lynn, et al.,2006). Jackson (2009) found that the deferred taxes were related to futureearnings. A book-tax difference (BTD) between accounting income andtaxable income is the information used to predict the earnings before taxand future tax expenses. Deferred tax assets and liabilities which arisefrom temporary differences between accounting income and taxable incomewill reflect future taxable benefits and sacrifices. The balance sheets ofearly adopters should reflect their true financial positions, compared tothose of non-early adopters. The deferred taxes are expected to be valuerelevant information, deferred tax assets and liabilities are expected to besignificantly related to stock prices. Thus, this study proposes the followinghypothesis:
H1: Deferred tax assets and liabilities are significantly related to stockprices.
1 This refers to the market reaction 10 days before the date of the change in accountingpolicy, the day of the change itself and 10 days after the change date.

Kittima Acaranupong
66 Asian Journal of Business and Accounting, 3(1), 2010
3. Data collection and research design
3.1 Data collection
The data for this study is obtained from the financial statements (includingthe notes) of the listed firms on SET 100 during the years 2004-2008. Listedfirms on SET 100 in this study are based on the selection criteria as at 30June 2009 (see details in section 2.2). The data is extracted from SETSMART(SET Market Analysis and Reporting Tool) which is the online databasefrom SET. This study excludes the Non-December financial year endedfirms for controlling the same accounting period and deletes the outliersby cutting the extreme values of variables (+/-1% of samples). Thus, thefinal sample in this study comprises three hundred and ninety four (394)firms-years. Table 2 presents the detailed information of the sampledcompanies.
Table 2: The number of samples*
Sample Characteristics No. of Firms-Years
Listed firms on SET 100 during the years 2004-2008 500 firms-yearsLess Non-December Year ended 45 firms-yearsLess outlier and missing data 61 firms-yearsTotal Number of Samples 394 firms-years
* Listed firms on SET 100 in this study are based on the selection criteria as at 30 June 2009.
3.2 Research design
The main objective of this study is to investigate the components of deferredtax assets and liabilities of the early adopters of TAS No. 12 Income Taxes.The early adopters of the proposed TAS No. 12 are identified from the notesto financial statements describing the adoption of deferred tax accountingpolicy using the balance sheet liability method. Components of deferredtax assets and liabilities are analysed from the notes of the early adopters.Then, the study categorises the types of presentation of deferred tax assetsand liabilities (e.g. separate report or offsetting balance). The accountingitems which are the components of deferred tax assets and liabilities areclassified according to sectors and industries.
Further, this study investigates whether the deferred tax assets andliabilities information is value relevant. Model (1) is based on Feltham and

Value Relevance and Components of Deferred Tax Assets and Liabilities
Asian Journal of Business and Accounting, 3(1), 2010 67
Ohlson (1995)’s model, which models the linearity of the relationshipbetween companies’ market values and their accounting information. It isbased on the security valuation framework propounded by Ohlson (1995).According to Ohlson, under clean surplus accounting the market value ofequity is equal to book value of shareholders’ equity plus net present valueof expected future abnormal earnings (unrecorded goodwill). Feltham andOhlson (1995)’s model extended the Ohlson (1995)’s model by classifyinga company’s net assets into financial and operating assets. Thedistinguishing feature was that the former was assumed to be fairly valuedon the balance sheet such that abnormal earnings for financial assets werezero (0). In addition, Lo and Lys (2000) indicated that the Feltham andOhlson (1995)’s model was distinct from the Ohlson (1995)’s model becauseof the analysis of growth and conservatism; i.e. the Feltham and Ohlson(1995)’s model incorporated conservative accounting in equity valuationprocess.
However, Callen and Segal (2005) tested the Feltham and Ohlson(1995)’s model by transforming the undefined other information variablesinto expectational variables, as suggested by Liu and Ohlson (2000). Theempirical test rejected the Ohlson (1995)’s model in favour of the Felthamand Ohlson (1995)’s model, thereby conforming the importance ofincorporating conservatism into accounting valuation. The empiricalanalysis also indicated that signs of the valuation coefficient wereconsistent with the prediction of the Feltham and Ohlson (1995)’s modelfor almost all empirical variations of the model, including panel datatechniques, non-parametric estimation, reverse regression, and portfolioregressions. Nevertheless, the one year ahead equity pricing predictions ofthe Feltham and Ohlson (1995)’s model were no more accurate than that ofthe Ohlson (1995)’s model or a naive earnings valuation model.
Previous research has also used the Feltham and Ohlson (1995)’smodel to test value relevance of earnings and book values (Amir et al.,1997; Sumritpradit, 2002; Chludek, 2010). Model (1) presents therelationship between stock prices, earnings, book value, deferred tax assetsand deferred tax liabilities.
Pit = α0 + α1Eit + α2BVAit + α3DTAit + α4DTLit + εit (1)
where
Pit = stock’s price per share of firm i year t;Eit = earnings per share of firm i year t;

Kittima Acaranupong
68 Asian Journal of Business and Accounting, 3(1), 2010
BVAit = net book value per share of total asset deducted from totalliability of firm i year t excluding deferred tax asset anddeferred tax liability;
DTAit = deferred tax asset per share of firm i year t;DTLit = deferred tax liability per share of firm i year t; andεit = error term.
The sample in this study includes three hundred and ninety four(394) firms-years and it is divided into two groups: Group 1 (early adoptersof TAS No. 12) and Group 2 (non-early adopters of TAS No. 12). Firms inGroup 1 are either firms which use the balance sheet liability method (therequired accounting treatment described in TAS No. 12) in recordingdeferred tax assets and liabilities for the first time (they never recogniseddeferred tax assets and liabilities before); or firms which recognise thedeferred tax assets and liabilities and change their accounting policiesfrom the deferral method to the balance sheet liability method.
Firms in Group 2 are either firms which have not adopted the deferredtax accounting policy and therefore, do not record deferred tax assets andliabilities in their balance sheets; or firms which use the deferral method inrecording deferred tax assets and liabilities and do not change to thebalance sheet liability method.
The regression model in model (1) examined all samples, earlyadopters and non-early adopters of TAS No. 12. Then, the differences ofvalue relevance of the accounting information between the early adoptersand the non-early adopters are compared by using the F test (Zar, 1984).
F = (SSc - SSp)/ k-1
SSp/DFp
with k-1 and DFp , degree of freedom
SSc = combined residual sum of squares from multiple regressionanalysis on sum of square and sum of cross products ofexplanatory variables in model (1);
SSp = pooled residual sum of squares of regression model (1) of earlyadopters and non-early adopters;
k = numbers of regression models; andDFp = numbers of pooled residuals degree of freedom.

Value Relevance and Components of Deferred Tax Assets and Liabilities
Asian Journal of Business and Accounting, 3(1), 2010 69
If the F test is rejected, it can be inferred that the independent variablesin model (1) affect stock prices in the different levels between early adoptersand non-early adopters. That is, the value relevance of accountinginformation of early adopters differs from that of non-early adopters. Then,Model (2) is used to test whether the value relevance of deferred tax assetsand liabilities of early adopters are more than those of non-early adopters.Dummy variable (1 = early adopters; 0 = non-early adopters) is added intomodel (1). Model (2) is as follows:
Pit = β0 + β1D + β2Eit + β3BVAit + β4DTAit + β5DTLit + β6D*Eit+ β7D*BVAit + β8D*DTAit + β9D*DTLit + εit (2)
where
Pit = stock’s price per share of firm i year t;D = 1 if the firm is an early adopter of TAS No. 12, and 0 otherwise,Eit = earnings per share of firm i year t;BVAit = net book value per share of total asset deducted from total
liability of firm i year t excluding deferred tax asset anddeferred tax liability;
DTAit = deferred tax asset per share of firm i year t;DTLit = deferred tax liability per share of firm i year t; andεit = error term.
4. Empirical results
This study identifies the listed companies on SET 100 which adopt theproposed TAS No. 12 before the effective date. The study investigates thedeferred tax accounting policy of early adopters. It categorises the types ofpresentation of deferred tax assets and liabilities (e.g. separate report oroffsetting balance as net deferred tax assets or liabilities) and classifies theaccounting items which are the components of deferred tax assets andliabilities according to sectors and industries. In addition, this studyexamines whether deferred tax assets and liabilities information are valuerelevant and compares the differences of value relevance of deferred taxassets and liabilities between early adopters and non-early adopters. Theresults are presented in this section.

Kittima Acaranupong
70 Asian Journal of Business and Accounting, 3(1), 2010
4.1 The number of early adopters of TAS No.12 Income Taxes
Table 3 shows the detailed number of the firms on SET which have adoptedTAS No. 12 during the years 2004-2008. According to this Table, the numberof early adopters was on an upward trend during the period of 2004-2008.The number of early adopters of TAS No. 12 in 2008 almost doubled that in2004. Furthermore, most of them have both deferred tax assets and liabilitiesin their balance sheets. Some firms show the offsetting balances of deferredtax assets and liabilities as net deferred tax assets or liabilities dependingon which values of assets and liabilities are more. However, a very smallnumber of firms have only deferred tax assets or liabilities in their balancesheets.
Table 3: The number of early adopters of TAS No. 12 Income Taxes
Year Total Have only Have only Have Both Deferred Tax Asset (DTA)Firms Deferred Deferred Tax and Deferred Tax Liability (DTL)
Tax Asset Liabilities(DTA) (DTL)
Total Net Separate ShownDTA/DTL DTA and DTL
2004 12 2 – 10 4 62005 13 3 – 10 2 82006 17 3 1 13 3 102007 22 5 2 15 4 112008 22 4 1 17 4 13
In addition, Tables 4 and 5 present the number of the listed firms onSET 100 which have only deferred tax assets, only deferred tax liabilities,or both deferred tax assets and liabilities in their balance sheets. They areclassified by industries and sectors.
Table 4 shows the industries and sectors of the sampled firms whichhave only deferred tax assets or deferred tax liabilities in the years 2004-2008. Firms which have only deferred tax assets are all from specificindustries and sectors such as Financials Industry (Banking Sector),Property and Construction Industry (Construction Materials Sector andProperty Development Sector), and Services Industry (Transportation andLogistics Sector). None of the SET 100 firms recorded deferred tax liabilityduring the period 2004-2005. However, during the period 2006-2008, thereare firms in the Resources Industry (Energy and Utilities Sector) and

Value Relevance and Components of Deferred Tax Assets and Liabilities
Asian Journal of Business and Accounting, 3(1), 2010 71
Table 4: The number of early adopters of TAS No. 12 which have onlyDeferred Tax Assets (DTA) or Deferred Tax Liabilities (DTL)classified by industries and sectors
Listed Firms on SET 100 which have Listed Firms on SET 100 which haveonly DTA in their Balance Sheets only DTL in their Balance Sheets
Year Industry Sector Number Industry Sector Number ofof Firms Firms whichwhich have have onlyonly DTA DTL
2004 Financials Banking 1(DTA= 2 firms; Property and Construction
1None None 0
DTL = none) Construction Materials
2005 Financials Banking 1(DTA= 3 firms; Property and Construction
2None None 0
DTL = none) Construction Materials
2006 Property and Construction2(DTA= 3 firms; Construction Materials Energy and
DTL = 1 firm) Resources Utilities 1Property
1Development
2007 Financials Banking 1(DTA= 5 firms; Resources Energy and 1DTL = 2 firms) Property and Construction 1 Utilities
Construction MaterialsProperty
2Development Services Commerce 1Services Transportation
1and Logistics
2008 Property and Construction1(DTA= 4 firms; Construction Materials Services Commerce 1
DTL = 1 firm) Property2Development
Services Transportation1and Logistics
Services Industry (Commerce Sector) sectors which reported only deferredtax liabilities in their balance sheets.
Table 5 shows the number of firms which have both deferred taxassets and liabilities in their balance sheets. It is found that firms from thefollowing industries and sectors have deferred tax assets and liabilities inalmost all the years in this study: Agro and Food Industry (AgribusinessSector and Food and Beverage Sector), Financials Industry (Banking Sector

Kittima Acaranupong
72 Asian Journal of Business and Accounting, 3(1), 2010
Table 5: The number of early adopters of TAS No. 12 which have bothdeferred tax assets (DTA) and deferred tax liabilities (DTL)classified by industries and sectors*
Numbers ofYear Industry Sector Listed Firms
on SET 100
2004 Agro and Food Agribusiness 1(total 10 Industry Food and Beverage 1firms) Property and Construction Materials 1
Construction Property Development 1Resources Energy and Utilities 5Technology Information and Communication Technology 1
2005 Agro and Food Agribusiness 1(total 10 Industry Food and Beverage 1firms) Property and Property Development 2
ConstructionResources Energy and Utilities 5Technology Information and Communication Technology 1
2006 Agro and Food Agribusiness 1(total 13 Industry Food and Beverage 1firms) Financials Banking 1
Industrials Petrochemicals and Chemicals 1Property and Property Development 1ConstructionResources Energy and Utilities 4Technology Information and Communication Technology 4
2007 Agro and Food Agribusiness 1(total 15 Industry Food and Beverage 1firms) Financials Finance and Securities 1
Industrials Petrochemicals and Chemicals 1Property and Construction Materials 1Construction Property Development 1Resources Energy and Utilities 5Technology Information and Communication Technology 4
2008 Agro and Food Agribusiness 1(total 17 Industry Food and Beverage 1firms) Financials Banking 1
Finance and Securities 1Industrials Petrochemicals and Chemicals 1Property and Construction Materials 1Construction Property Development 1Resources Energy and Utilities 6Technology Information and Communication Technology 4
* Firms with both deferred tax assets and deferred tax liabilities are divided into two types. Firms whichoffset deferred tax assets and liabilities and show only net deferred tax assets or liabilities in theirbalance sheets; and firms that show both deferred tax assets and liabilities in their balance sheets, i.e.they do not offset the balance of deferred tax assets and liabilities.

Value Relevance and Components of Deferred Tax Assets and Liabilities
Asian Journal of Business and Accounting, 3(1), 2010 73
and Finance and Securities Sector), Industrials Industry (Petrochemicalsand Chemicals Sector), Property and Construction Industry (ConstructionMaterials Sector and Property Development Sector), Resources Industry(Energy and Utilities Sector), and Technology Industry (Information andCommunication Technology Sector). The largest number of firms whichrecorded both deferred tax assets and liabilities are from the ResourcesIndustry (Energy and Utilities Sector).
4.2 Descriptive statistics of the deferred tax assets and deferred taxliabilities
Table 6 presents the descriptive statistics of the deferred tax assets andliabilities of the early adopters of TAS No. 12.
According to Table 6, the values of deferred tax assets and liabilitiesshow high volatility between 2004 and 2008. Interestingly, the values of
Table 6: Descriptive statistics of deferred tax assets and liabilities of earlyadopters of TAS No. 12
Panel A: Deferred tax assets
Year Deferred Tax Assets
Mean Standard Deviation Min Max
2004 1,820,166,636.08 2,919,041,851.86 22,286,532 8,131,128,4412005 1,183,388,538.08 1,569,732,767.46 27,267,312 4,507,110,0002006 2,284,933,915.13 3,355,107,066.42 574,394 9,958,063,9742007 1,970,634,413.11 2,975,683,153.78 811,945 10,031,066,1532008 2,473,126,300.21 3,181,120,725.03 6,995,813 10,075,260,360
The amounts mentioned in the table are in Baht.
Panel B: Deferred tax liabilities
Year Deferred Tax Liabilities
Mean Standard Deviation Min Max
2004 4,254,905,905.70 4,756,712,859.00 32,713,699 10,257,015,7552005 4,003,014,803.75 5,400,058,856.83 1,196,304 12,685,241,5712006 3,621,941,107.27 5,047,662,390.72 19,447,000 13,839,224,5312007 2,618,714,592.05 5,136,662,867.53 22,899,589 14,738,003,1602008 3,156,743,876.14 6,226,870,533.63 1,750,000 19,924,960,086
The amounts mentioned in the table are in Baht.Notes: The firms which have net deferred tax assets or net deferred tax liabilities in their balance sheets
are also used in the calculation of mean and standard deviation of deferred tax assets and liabilities.If firms have net deferred tax assets, the firms will be included in the calculation of mean andstandard deviation of deferred tax assets. If firms have net deferred tax liabilities, the firms willbe included in the calculation of mean and standard deviation of deferred tax liabilities.

Kittima Acaranupong
74 Asian Journal of Business and Accounting, 3(1), 2010
the standard deviation of deferred tax assets and liabilities are more thantheir mean for every year. In other words, the range between the maximumvalue and the minimum value of deferred tax assets and liabilities aredifferent significantly.
4.3 Components of deferred tax assets and deferred tax liabilities
Deferred tax assets are the amounts of income taxes recoverable in thefuture periods in respect of deductible temporary differences, thecarryforward of unused tax losses, and the carryforward of unused taxcredits. Thus, a deferred tax asset should be recognised when it is probablethat taxable profits will be available against which the deferred tax assetcan be utilised. When an entity has a history of tax losses, the entityrecognises a deferred tax asset only to the extent that the entity has sufficienttaxable temporary differences or there is other convincing evidence thatsufficient taxable profit will be available.
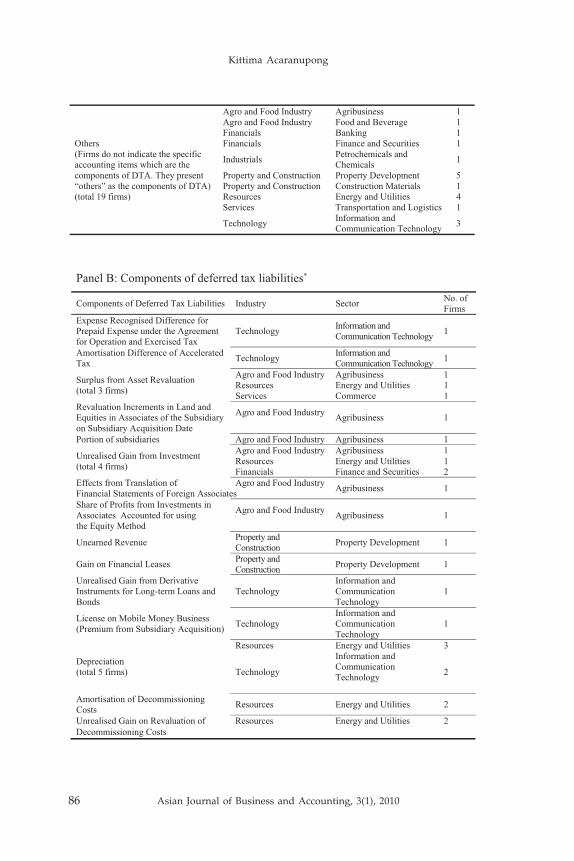
On the contrary, deferred tax liabilities are the amounts of incometaxes payable in future periods in respect of taxable temporary differences.From the notes to financial statements of the early adopters of TAS No. 12in 2008, the components of deferred tax assets and liabilities are describedin Appendix A.
Some accounting items which are components of deferred tax assetsand liabilities result from business transactions which are common inmost industries. Common transactions which are deductible temporarydifferences include allowance for impairment loss of assets, depreciation,allowance for doubtful accounts, allowance for inventory obsolescence,taxable loss carryforward, amortisation of intangible assets, and depositsfrom customers. The early adopters of TAS No. 12 which have the followingaccounting items will record deferred tax assets in their balance sheets.Accounting items which are the main components of deferred tax assetsare taxable loss carryforward, allowance for doubtful accounts, allowancefor impairment loss of assets, and depreciation.
For deferred tax liabilities, the common accounting items which aretaxable temporary differences are surplus from asset revaluation,depreciation, allowance for decline in value of inventories, and unrealisedgain from investment. The accounting items which are the maincomponents of deferred tax liabilities are depreciation, allowance for declinein value of inventories, unrealised gain from investment, and surplus fromasset revaluation.
These results correspond with the findings of Poterba, Rao, andSeidman (2007). The researchers in this study examined the components

Value Relevance and Components of Deferred Tax Assets and Liabilities
Asian Journal of Business and Accounting, 3(1), 2010 75
of deferred tax assets and liabilities of the large US corporations. As aresult, they found that firms differ substantially in the compositions oftheir deferred tax assets and liabilities. The largest components of deferredtax assets were loss and credit carryforwards and employment and post-employment benefits. The largest components of deferred tax liabilitieswere depreciation of property, plant and equipment and leases (Poterba etal., 2007).
Furthermore, Appendix A shows that nineteen (19) firms do notindicate the specific accounting items which are the components of deferredtax assets; and six (6) firms do not list liabilities, instead, they presented“others” as the components of deferred tax assets and liabilities.
In addition, Appendix A also indicates that there are some accountingitems which are components of deferred tax assets and liabilities peculiarto certain industries. Some examples are as follows. Firstly, amortisation ofdecommissioning costs is specific to the Resources Industry (Energy andUtilities Sector). Secondly, unrealised gain on the transfer of property toproperty fund and unearned revenue from construction services aretransactions found in Property and Construction Industry (PropertyDevelopment Sector). Thirdly, non-accrual of interest income is peculiarwith the transactions in Financials Industry (Banking Sector). Fourthly,the amortisation of the differences of assets under the agreement foroperation and income recognised difference of unearned income of mobileservices are among the transactions found in the Technology Industry(Information and Communication Technology Sector).
4.4 Results of test value relevance of deferred tax assets and liabilities
Regression of model (1) is applied to the whole sampled firms (394 firms-years) including both early adopters of TAS No. 12 (77 firms–years) andnon-early adopters (317 firms-years). Descriptive statistics of variables inmodel (1) are shown in Table 7. The results show that the mean of stockprices is less than the standard deviation of prices for all the groups withinthe sample, i.e. both early adopters and non-early adopters of TAS No. 12.The ranges of stock price of the listed firms on SET 100 are wide, from thelowest 0.12 baht to the highest of 322 baht; earnings per shares’ values are-2.72 to 22.40 baht; and book values range from 0.0772 to 91.9945 baht pershare. For early adopters, the range of stock prices is from 1.60 baht to 322baht; earnings per share range from 3.5332 to 22.40 baht and the bookvalue’s range is from 19.3443 to 69.1810 baht per share. For non-earlyadopters, the stock price is from 0.12 baht to 187 baht; earnings per share’svalue are from -2.72 to 15.96 baht; and book value’s range is from 0.2465 to91.9945 baht per share.

Kittima Acaranupong
76 Asian Journal of Business and Accounting, 3(1), 2010
The book values of total assets deducted from total liabilities(excluding deferred tax assets and deferred tax liabilities) are positive forall listed firms on SET 100. None of the listed firms on SET 100 has negativebook value of equities. The deferred tax assets per share and deferred taxliabilities per share also have high value of standard deviation with respectto their mean value. The minimum value of deferred tax assets and liabilitiesis zero (0). Interestingly, the mean value of deferred tax assets is much more
Table 7: Descriptive statistics of variables in model 1
Panel A: All samples (n = 394 firms-years)
Variables Mean SD Min. Max.
Pit 26.0239 40.2146 0.1200 322.0000Eit 2.4559 3.6639 -2.7200 22.4000BVAit 14.6904 17.7761 0.0772 91.9945DTA it 0.1119 0.4603 0.0000 3.5881DTLit 0.0810 0.4607 0.0000 4.6059
The amounts mentioned in the Table are in Baht.
Panel B: Early adopters of TAS No.12 (n = 77 firms-years)
Variables Mean SD Min. Max.
Pit 44.7372 66.6573 1.6000 322.0000Eit 3.5332 5.1111 3.5332 22.4000BVAit 19.3443 17.8699 19.3443 69.1810DTAit 0.5564 0.8659 0.0000 3.4018DTL it 0.3052 0.7122 0.0000 3.9735
The amounts mentioned in the Table are in Baht.
Panel C: Non-early adopters of TAS No.12 (n = 317 firms-years)
Variables Mean SD Min. Max.
Pit 21.0557 28.0951 0.1200 187.0000Eit 2.1206 3.0130 -2.7200 15.9600BVAit 13.3564 17.1874 0.2465 91.9945DTAit 0.0113 0.2015 0.0000 3.5881DTL it 0.0284 0.3572 0.0000 4.6059
The amounts mentioned in the Table are in Baht.Pit = stock’s price per share;Eit = earnings per share;BVAit = net book value per share of total asset deducted from total liability excluding
deferred tax asset and deferred tax liability;DTAit = deferred tax asset per share; andDTLit = deferred tax liability per share.

Value Relevance and Components of Deferred Tax Assets and Liabilities
Asian Journal of Business and Accounting, 3(1), 2010 77
than the mean value of deferred tax liabilities for the whole sample as wellas for the early adopters. On the other hand, the mean value of deferred taxassets is less than that of deferred tax liabilities for non-early adopters.
The regression results of the model (1) are presented in Appendix B.The results from regression model (1) show that there are significantrelationships between stock prices and earnings per share, book value oftotal assets less total liabilities (excluding deferred tax assets and deferredtax liabilities), deferred tax assets per share and deferred tax liabilities pershare for all sample, i.e. both early adopters and non-early adopters of TASNo. 12. For the results of the whole sample, the adjusted R2 of model (1)equals to 0.761. This means that the independent variables in the modelaccount for 76.1 per cent of the variance in the dependent variable which isthe stock price. Furthermore, the results show that α1, α2 are positively andsignificantly related with stock price at 1 per cent level of significance. Itcan be inferred that earnings and book value of total assets deducted fromtotal liabilities (excluding deferred tax assets and deferred tax liabilities)are value relevant information. These results corroborate the findings ofother researchers (Easton & Harris, 1991; Feltham & Ohlson, 1995; Francis& Schipper, 1999).
Furthermore, α3 is positively and significantly related to stock price.Value of α4 is also positively related to stock price; but this is not statisticallysignificant. Thus, deferred tax assets are value relevant information whiledeferred tax liabilities are not.
These results reveal that deferred tax assets are information whichinvestors use in valuing their investments. However, deferred tax liabilitiesare not used in the same manner. The plausible reason could be that thenumber of early adopters of TAS No.12 which have deferred tax liabilitiesis much less than those that have deferred tax assets. In fact, the number offirms which has only deferred tax liabilities (or net deferred tax liabilities)in their balance sheets is very small when compared with the whole samplesize. Therefore, investors pay less attention to deferred tax liabilities thandeferred tax assets. Overall, these results reveal that deferred tax assetsinformation is value relevant but this cannot be said of the deferred taxliabilities information.
Furthermore, as far as the early adopters of TAS No. 12 are concerned,the adjusted R2 from model (1) is 0.815. The values of α1 and α2 are bothpositive and significant at 1 per cent and 10 per cent significance level,respectively. This means that earnings and book value of total assetsdeducted from total liabilities (excluding deferred tax assets and deferredtax liabilities) are both value relevant information. The value of α3 is alsopositive and significant at 5 per cent level of significance. Therefore, deferred

Kittima Acaranupong
78 Asian Journal of Business and Accounting, 3(1), 2010
tax assets are also positively related to stock prices. These results correspondwith the findings of the whole sample size which includes both earlyadopters and non-early adopters of TAS No. 12. This shows that investorsperceive deferred tax assets as useful information in valuing theirinvestments. Interestingly, the value of α4 is negatively significant at 1 percent level of significance which infers that deferred tax liabilities are alsovalue relevant information. Thus, investors also use deferred tax liabilitiesin valuing their investments. In summary, the results of the regressionanalysis confirm that both deferred tax assets and deferred tax liabilities arevalue relevant information and investors perceive deferred tax assets asthe future taxable benefits and deferred tax liabilities as future taxablesacrifices. Both reflect the true firm values.
For non-early adopters, the adjusted R2 from model (1) is 0.786. Thevalues of α1 and α2 are both positive and significant at 1 per cent significancelevel. This means that earnings and book value of total assets deductedfrom total liabilities (excluding deferred tax assets and deferred tax liabilities)are value relevant information. The value of α3 is also positive andsignificant at 5 per cent significance level. Therefore, deferred tax assetsare value relevant information. The value of α4 is positive; but it isinsignificant. This shows that deferred tax liabilities are not value relevantinformation.
These results contrast with those of the early adopters of TAS No. 12,where it was found that deferred tax liabilities are value relevantinformation for them. The plausible reason could be that the early adoptersuse the balance sheet liability method to record deferred tax liabilities.Deferred tax liabilities are the amounts of income tax payable in futureperiods in respect of taxable temporary differences. Thus, the recognitionof deferred tax liabilities in the balance sheet of early adopters reflects thetrue sacrifices of economic future benefits.
4.4.1 Additional test: Differences of value relevance of deferred tax assets anddeferred tax liabilities between early adopters and non-early adopters ofTAS No. 12
The differences of value relevance of deferred tax assets and liabilitiesbetween early adopters and non-early adopters of TAS No. 12 are examinedby F test. Firstly, the multiple regression analysis are run by sum squareand cross product of explanatory variables in model (1) to obtain thecombined residual sum of squares (SSc)= 127,372.590. Secondly, we calculatethe pooled residual sum of squares (SSp) of model (1) of early adopters andnon-early adopters.

Value Relevance and Components of Deferred Tax Assets and Liabilities
Asian Journal of Business and Accounting, 3(1), 2010 79
SSp = 52,702.924+59,256.875= 111,959.799
F = (SSc - SSp)/ k-1
SSp/DFp
F = (127,372.590-111,959.799)/1
111,959.799/384
F = 15,412.791 = 52.86
291.56
F value is 52.86. It is compared with F in the Table of Critical Values ofthe F Distribution (Zar, 1984) for degree of freedom 1, 384 (α=0.05) whichapproximates to 3.87. This result leads us to conclude that all independentvariables in model (1) affect the dependent variable (which is stock price)differently between early adopters and non-early adopters of TAS No. 12.
Model (2) is used to test whether there are any differences of valuerelevance of deferred tax assets and liabilities between early adopters andnon-early adopters. The regression results of Model (2) are presented inTable 8.
The results of model (2) indicate that earnings, book values, anddeferred tax assets are related to stock prices positively and significantly.Deferred tax liabilities are related to stock prices, but this is not statisticallysignificant.
The effects of adopting TAS No. 12 on the value relevance of accountinginformation are investigated. The value of β6 is positively significant. It isalso found that the value relevance of earnings of the early adopters issignificantly more than non-early adopters. The value of β7 and β8 arenegative and statistically insignificant. Further, the value relevance of bookvalue of equities and deferred tax assets of early adopters and non-earlyadopters do not differ. Interestingly, the value of β9 is negative andstatistically significant. This means that deferred tax liabilities of earlyadopters are more value relevant compared to non-early adopters and thedirection in relation to the dependent variable or stock prices is negative.These results confirm the findings presented in Appendix B.
Therefore, deferred tax liabilities of early adopters of TAS No. 12 arevalue relevant information while those of non-early adopters are not. Thisleads us to the interpretation that the balance sheet liability method (whichis the required accounting treatment prescribed in TAS No. 12) makes thedeferred tax liabilities in balance sheets reflect the true sacrifices of futureeconomic benefits more than that of the deferral method.

Kittima Acaranupong
80 Asian Journal of Business and Accounting, 3(1), 2010
5. Conclusions and suggestions
This study was set out to investigate the impacts of voluntary, early adoptionof the proposed accounting standard TAS No. 12 Income Taxes in Thailand.It is found that the early adoption of deferred tax accounting policy arguablymakes the firms’ balance sheets reflect their true financial positions. Thedeferred tax assets reflect the future taxable benefits while deferred taxliabilities reflect the future taxable sacrifices. Also, more listed firms onSET 100 record deferred tax assets as compared to those which recorddeferred tax liabilities.
The results of our investigation of the value relevance of deferred taxassets and liabilities indicate that deferred tax assets and liabilities aresignificantly related to stock price, especially for the early adopters of TASNo. 12. The findings correspond with the results of previous studies (Amiret al., 1997; Ayers, 1998; Lynn et al., 2006). Their results reveal that therewere significant relationships between stock prices and deferred taxes.
Table 8: Regression results of stock prices on earnings, netbook values, DTA and DTL with dummy variables2
Variable Coefficient t-value Sig.
Constant 2.413 1.975 0.049**
D -5.198 -1.526 0.128E it 3.466 5.546 0.000***
BVA it 0.814 7.652 0.000***
DTA it 9.029 1.843 0.066*
DTLit 3.853 1.512 0.133D*Eit 7.061 7.113 0.000***
D* BVA it -0.216 -0.921 0.358D*DTAit -0.769 -0.141 0.888D*DTL it -22.950 -5.117 0.000***
F value = 194.316***
Adjusted R2 = 0.817
n = 394 firms-years* sig. at 0.10 level;** sig. at 0.05 level; ***sig. at 0.01 levelPit = stock’s price per share of firm i year t;D = 1 if the firm is an early adopter of TAS No.12, 0 otherwise;E it = earnings per share of firm i year t;BVA it = net book value of total asset deducted from total liability of firm i year t
excluding deferred tax asset and deferred tax liability;DTAit = deferred tax asset per share of firm i year t;DTLit = deferred tax liability per share of firm i year t; andεit = error term.
2 Pit = β0 + β1D + β2Eit + β3BVAit + β4DTAit + β5DTLit + β6D*Eit + β7D*BVAit +β8D*DTAit + β9D*DTLit + εit (2)

Value Relevance and Components of Deferred Tax Assets and Liabilities
Asian Journal of Business and Accounting, 3(1), 2010 81
Thus, it can be inferred that deferred tax assets and liabilities are usefulinformation to investors.
Moreover, the findings in this study indicate that value relevance ofdeferred tax assets of early adopters and non-early adopters do not differ,whereas deferred tax liabilities of early adopters have more value relevancethan those of non-early adopters. The adoption of TAS No. 12 makes thedeferred tax liabilities reflect the true sacrifice of the future tax benefits. Themerits of early adoption outweigh the cost of the standard applied. Thefindings in this paper will provide the managerial incentives to early adoptthe proposed TAS No.12.
These results support the balance sheet liability method in recognitionof deferred tax assets and liabilities; and they can be used as a guideline toprovide constructive feedback to the Federation of Accounting Professionsof Thailand to improve Draft No. 56 before implementing TAS No. 12 IncomeTaxes. The application of TAS No. 12 for all listed firms will be beneficialfor users of the firms’ financial statements. It will also enhance thecomparability of financial statements of all listed firms as all will then berequired to apply the same accounting policies.
In addition, the results from this study also support the adoption ofIAS and IFRS in Thailand, for it will improve the relevance of financialstatements and assist international investors in making more efficientinvestments in Thailand. Furthermore, it will enhance the comparabilityof Thai listed firms’ financial statements with other listed firms on a globalbasis.
References
Amir, E., Kirschenheiter, M., & Willard, K. (1997). The valuation of deferredtaxes. Contemporary Accounting Research, 14(4), 597-622.
Ayers, B. C. (1998). Deferred tax accounting under SFAS No.109: Anempirical investigation of its incremental value-relevance relative toAPB No.11. The Accounting Review, 73(2), 195-212.
Barth, M., Landsman, W., & Lang, M. (2008). International accountingstandards and accounting quality. Journal of Accounting Research, 46(3),467-498.
Callen, J. L., & Segal, D. (2005). Empirical tests of the Feltham and Ohlson(1995) model. Review of Accounting Studies, 10, 409-429.
Chaney, P. K., & Jeter, D. C. (1992). The effects of deferred taxes on securityprices. Journal of Accounting, Auditing and Finance, 7, 91-116.

Kittima Acaranupong
82 Asian Journal of Business and Accounting, 3(1), 2010
Chludek, A.K. (2010). Perceived versus actual cash flow implications ofdeferred taxes- An analysis of value relevance and reversal underIFRS. Retrieved September 30, 2010, fromhttp://papers.ssrn.com/sol3/papers.cfm?abstract_id=1603183
Easton, P. D., & Harris, T. S. (1991). Earnings as explanatory variables forreturns. Journal of Accounting Research, 29, 19-36.
Federation of Accounting Professions. Draft Thai accounting standard No.56income taxes. Retrieved February 10, 2009, fromhttp://www.fap.or.th/fap/?q=node/427
Federation of Accounting Professions. Thai accounting standard No.12 incometaxes. Retrieved September 10, 2010, fromhttp://www.fap.or.th/fap/?q=node/427
Feltham, G. A., & Ohlson, J. A. (1995). Valuation and clean surplusaccounting for operating and financial activities. ContemporaryAccounting Research, 11(2), 689-732.
Francis, J., & Schipper, K. (1999). Have financial statements lost their valuerelevance? Journal of Accounting Research, 37, 319-382.
Givoly, D., & Hayn, C. (1992). The valuation of the deferred tax liability:Evidence from the stock market. The Accounting Review, 67(2), 394-410.
Gujarathi, M. R., & Hoskin, R. E. (1992). Evidence of earnings managementby the early adopters of SFAS No. 96. Accounting Horizons, 6(4), 18-31.
International Accounting Standards Board. International accounting standardNo.12 Income Taxes. Retrieved February 10, 2009, fromhttp://www.ifrs.org/IFRSs/IFRS.htm
Jackson, M. (2009). Book-tax differences and earnings growth. RetrievedJanuary 22, 2010, fromhttp://papers.ssrn.com/sol3/papers.cfm?abstract_id=1410790
Karemera, D., Ojah, K., & Cole, J.A. (1999). Random walks and marketefficiency tests: Evidence from emerging equity markets. Review ofQuantitative Finance and Accounting, 13, 171-188.
Kim, J. H., & Shamsuddin, A. (2006). Are Asian stock markets efficient? Evidencefrom new multiple variance tests. Unpublished working paper,Department of Econometrics and Business Statistics, MonashUniversity.
Lim, K. P., Brooks, R. D., & Kim, J.H. (2008). Financial crisis and stockmarket efficiency: Empirical evidence from Asian countries.International Review of Financial Analysis, 17(3), 571-591.
Liu, J., & Ohlson, J.A. (2000). The Feltham-Ohlson (1995) model: Empiricalimplications. Journal of Accounting, Auditing and Finance, 15(3), 321-331.

Value Relevance and Components of Deferred Tax Assets and Liabilities
Asian Journal of Business and Accounting, 3(1), 2010 83
Lo, K., & Lys, T. (2000). The Ohlson model: Contribution to valuation theory,limitations, and empirical applications. Journal of Accounting, Auditing,and Finance, 15(3), 337-367.
Lynn, S., Seethamraju, C., & Seetharaman, A. (2006). Incremental valuerelevance of unrecognized deferred taxes: Evidence from UnitedKingdom. Retrieved June 15, 2009, fromhttp://papers.ssrn.com/sol3/papers.cfm?abstract_id=902081
Moyer, S. E. (1990). Capital adequacy ratio regulations and accountingchoices in commercial banks. Journal of Accounting and Economics, 13(2),123-154.
Negash, M. (2008). Liberalization and the value relevance of accrualaccounting information: Evidence from the Johannesburg SecuritiesExchange. Afro Asian Journal of Finance and Accounting, 1(1), 84-101.
Ohlson, J. A. (1995). Earnings, book values, and dividends in equityvaluation. Contemporary Accounting Research, 11(2), 661-687.
Poterba, J. M., Rao, N., & Seidman, J. (2007). The significance andcomposition of deferred tax assets and liabilities. Retrieved September10, 2010, from http: //www.nber.org/papers/w12923
Sumritpradit, P. (2002). A study of factors influencing value-relevance of earningsand book value in the Stock Exchange of Thailand. Unpublished doctoraldissertation, Chulalongkorn University, Bangkok, Thailand.
Tang, T.Y. H. (2006). The market perception of book-tax differences-Anempirical study in China’s capital market. Retrieved June 15, 2009,from http://papers.ssrn.com/sol3/papers.cfm?abstract_id=927167
Toommanon,V. (2007). The effects of the adoption of deferred taxesaccounting policy during B. E. 2538-2549. Journal of AccountingProfessions, 3(7), 27-47.
Wang, X., Young, D., & Zhuang, Z. (2007). The effects of mandatory adoptionof international financial reporting standards on informationenvironments. Retrieved June 15, 2009, fromhttp://aaahq.org/AM2008
Yongsawadvanich, R. (2001). Thai stock market efficiency: Random walk,mean reversion or mean aversion? Retrieved September 10, 2010, fromhttp://library.tu.ac.th/acc-pdf/mif/mif-18.pdf
Zar, J. H. (1984). Biostatistical analysis (2nd ed.). Englewood Cliffs, NJ: PrenticeHall.

Kittima Acaranupong
84 Asian Journal of Business and Accounting, 3(1), 2010
Appendix A
Components of deferred tax assets and deferred tax liabilities of early adoptersof TAS No.12

Value Relevance and Components of Deferred Tax Assets and Liabilities
Asian Journal of Business and Accounting, 3(1), 2010 85
Kittima Acaranupong
86 Asian Journal of Business and Accounting, 3(1), 2010

Value Relevance and Components of Deferred Tax Assets and Liabilities
Asian Journal of Business and Accounting, 3(1), 2010 87
* Two firms do not show the components of deferred tax assets and liabilities. It shows the balance of deferredtax assets (liabilities) at the beginning of the year, current year temporary differences, utilised during the yearand the balance of deferred tax assets (liabilities) at the end of the year.

Kittima Acaranupong
88 Asian Journal of Business and Accounting, 3(1), 2010
Ap
pen
dix
B
Reg
ress
ion
resu
lts
of s
tock
pri
ces
on e
arni
ngs,
net
boo
k va
lues
, def
erre
d ta
x as
sets
and
def
erre
d ta
x lia
bilit
ies