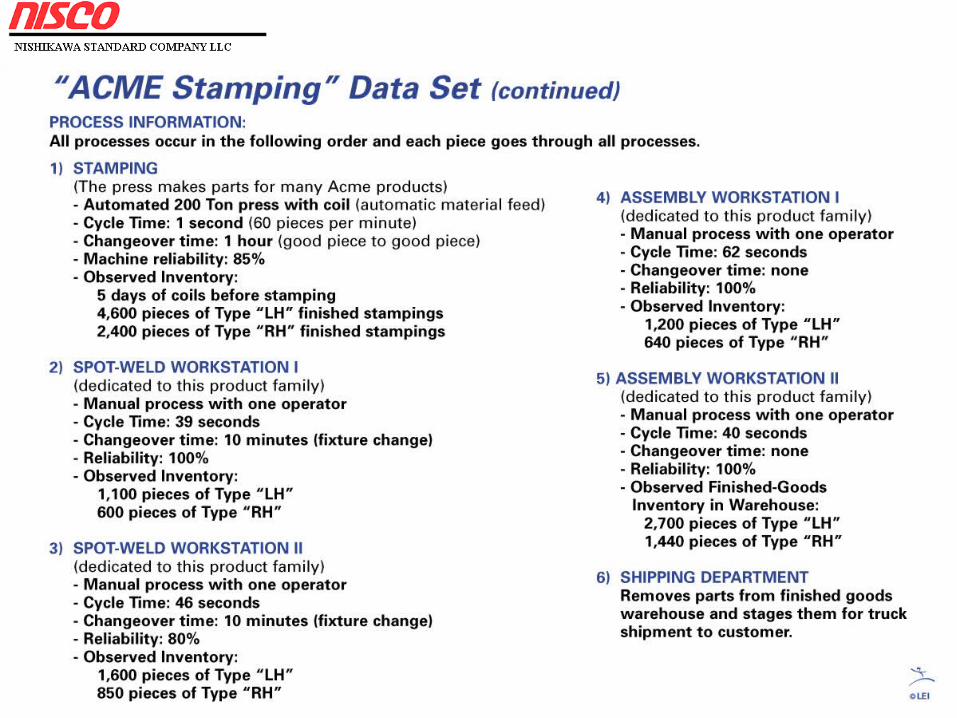
value stream mapping · seeing the whole (mapping the extended value stream) process level creating...
TRANSCRIPT
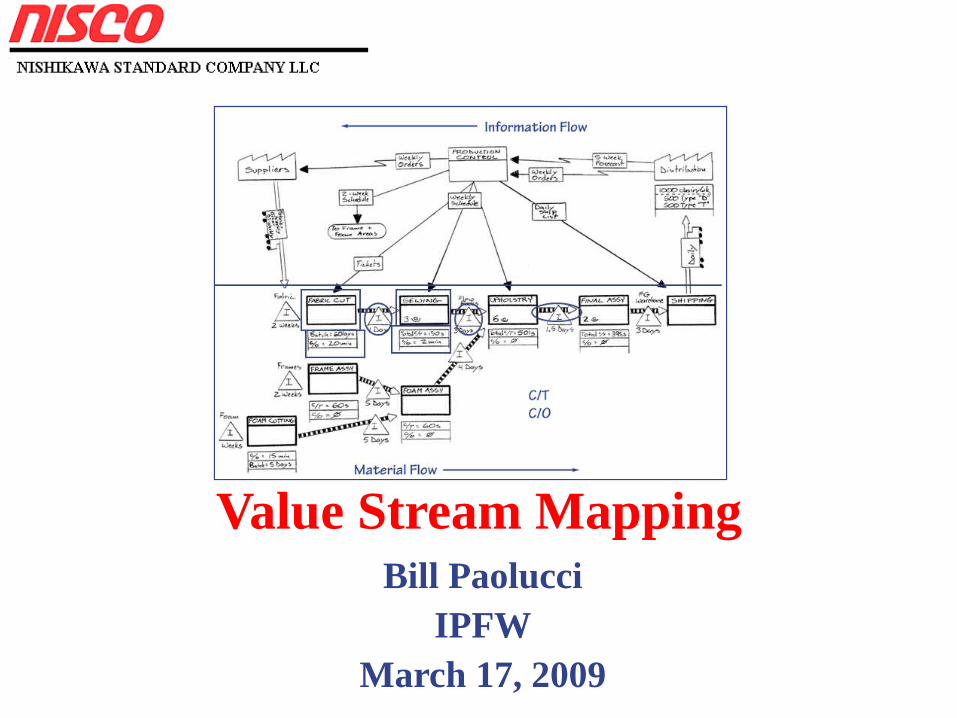
Value Stream MappingBill Paolucci
IPFWMarch 17, 2009
Discussion Points1. Introduction & Getting Started
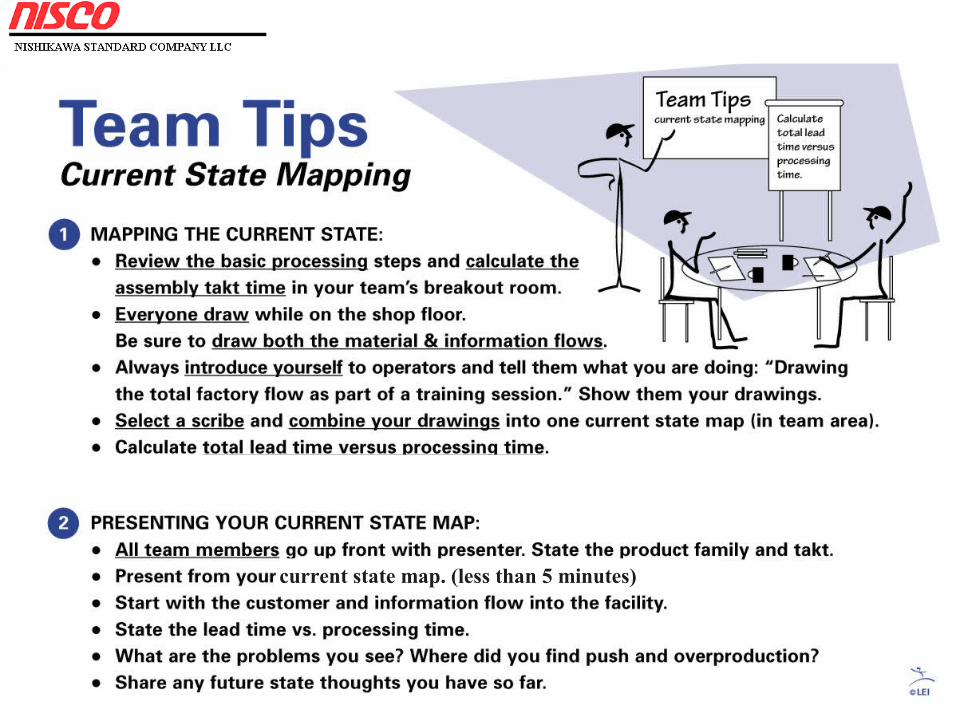
2. The Current State Map
3. Lean Value Stream
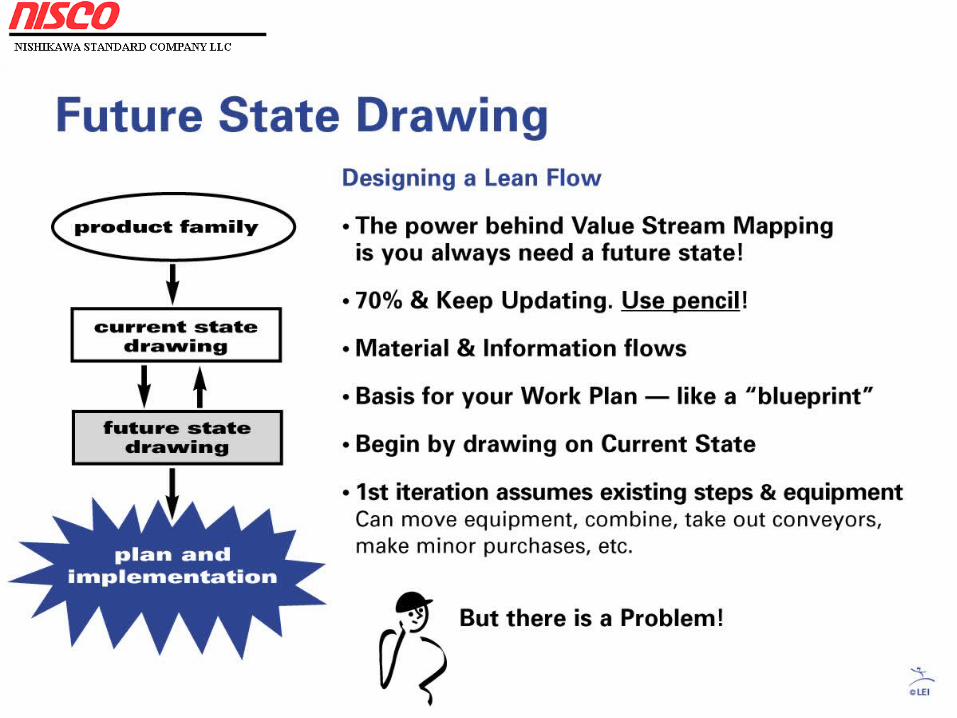
4. The Future State Map
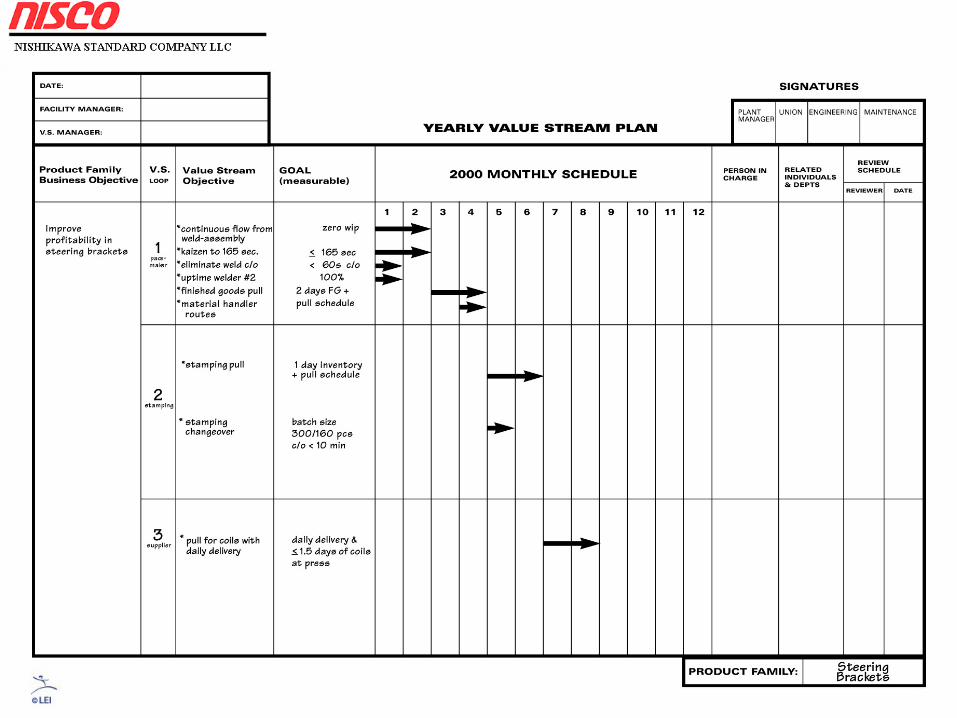
5. Achieving the Future State
6. Conclusion
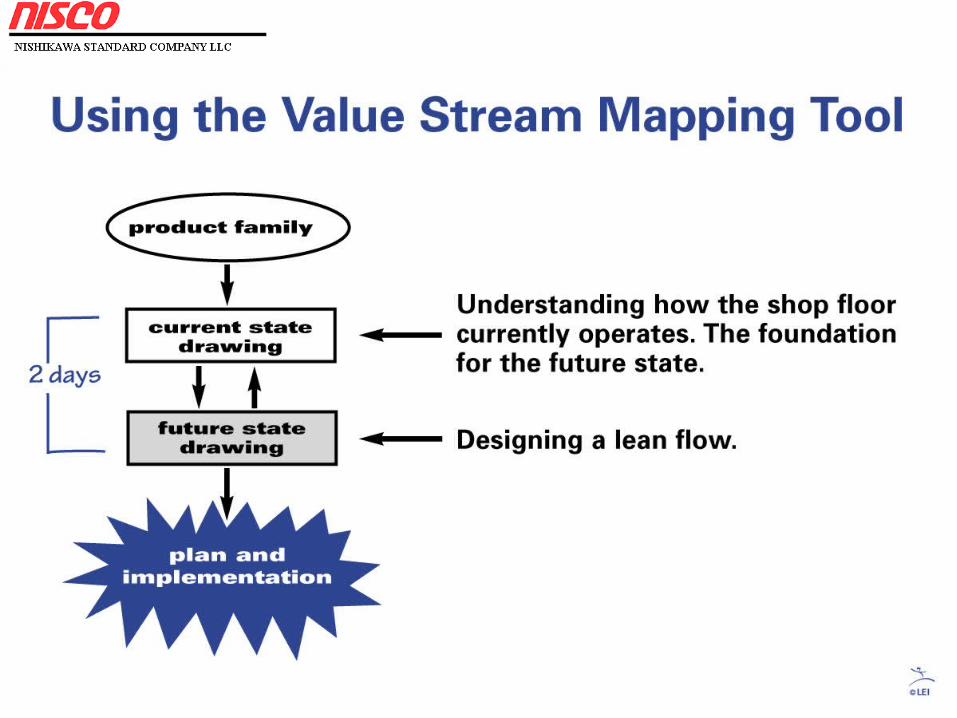
The Goal is to develop your ability to “see the flow” and design a future state
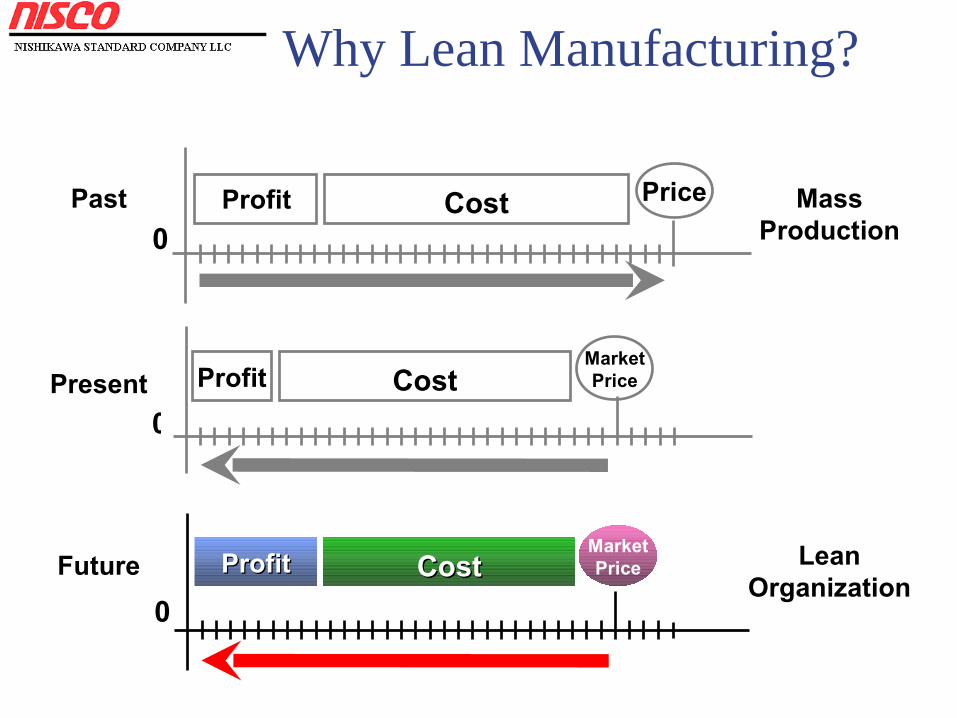
LeanOrganization
FutureMarketPrice
0CostCostProfitProfit
0Profit
MarketPriceCostPresent
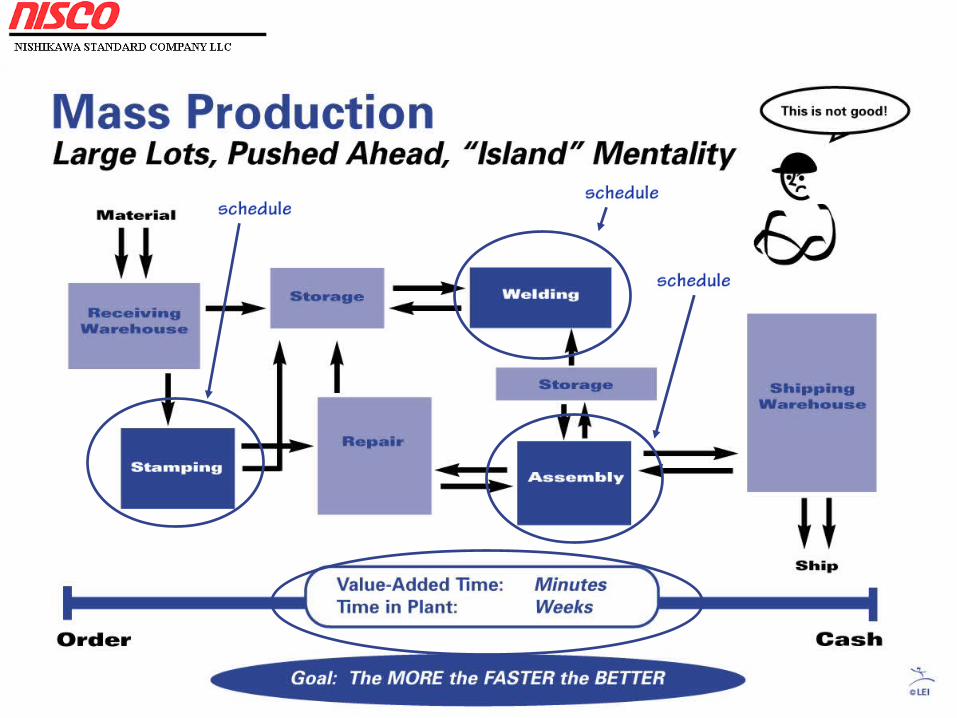
Cost MassProduction
Past Price
0Profit
Why Lean Manufacturing?
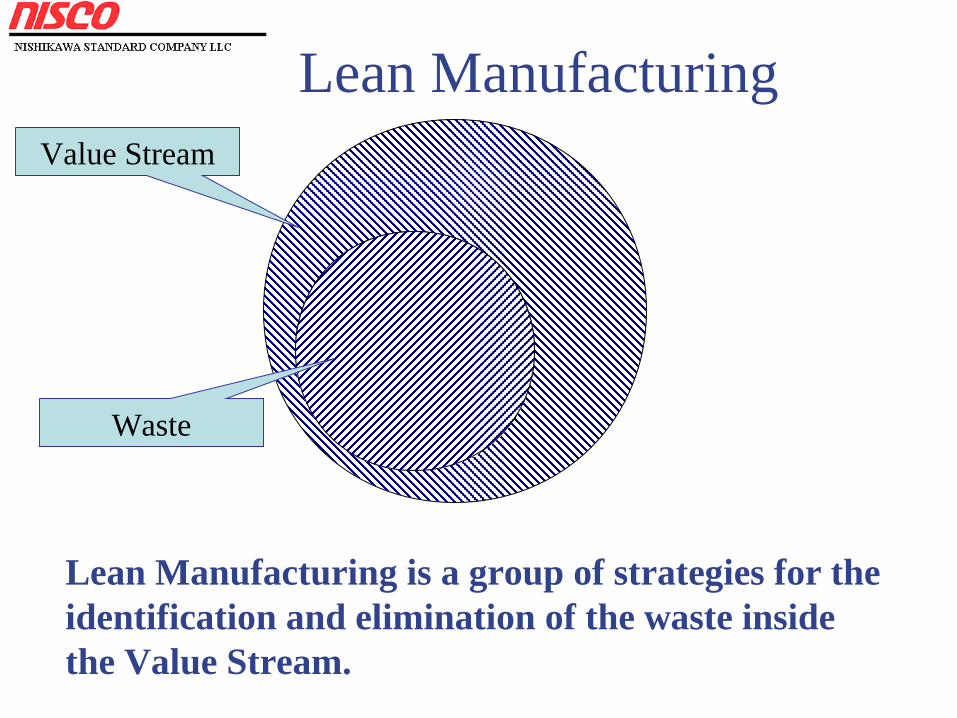
Lean Manufacturing
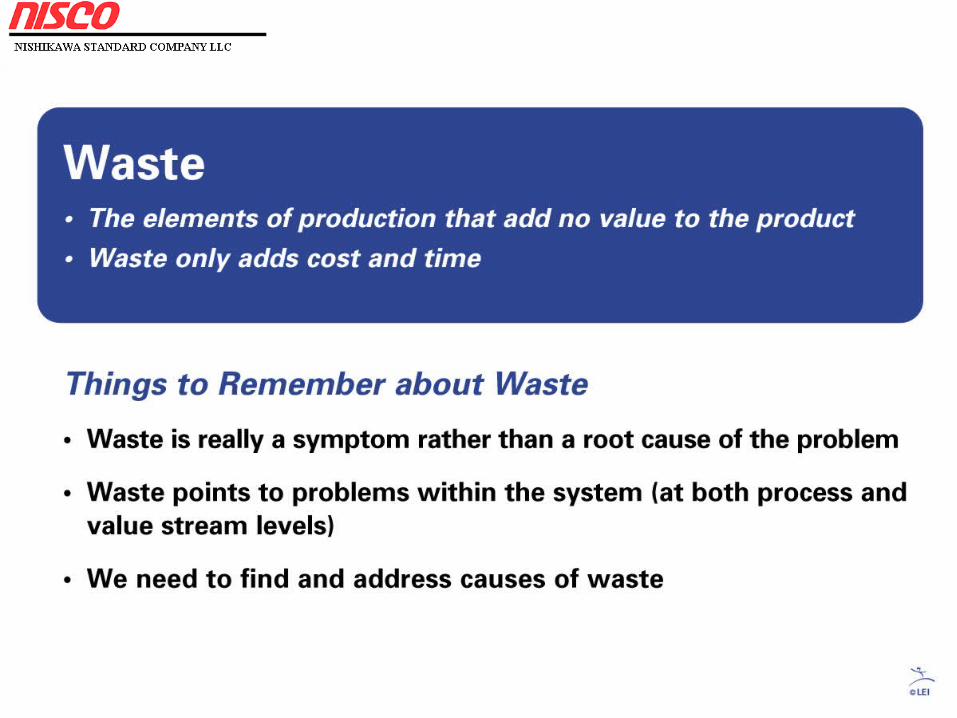
Lean Manufacturing is a group of strategies for the identification and elimination of the waste inside the Value Stream.
Value Stream
Waste
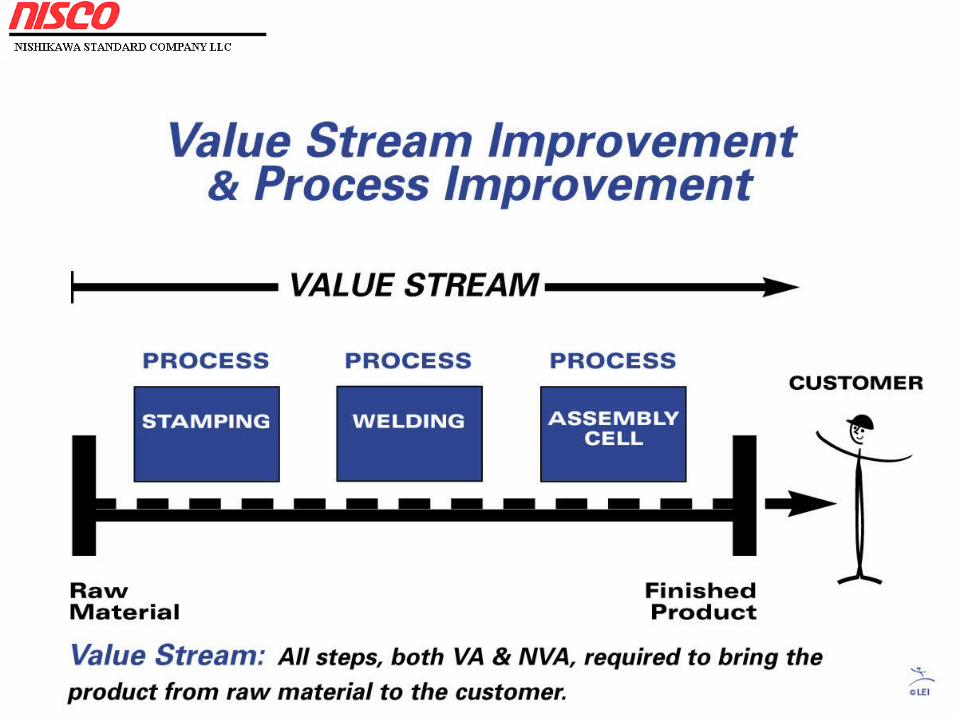
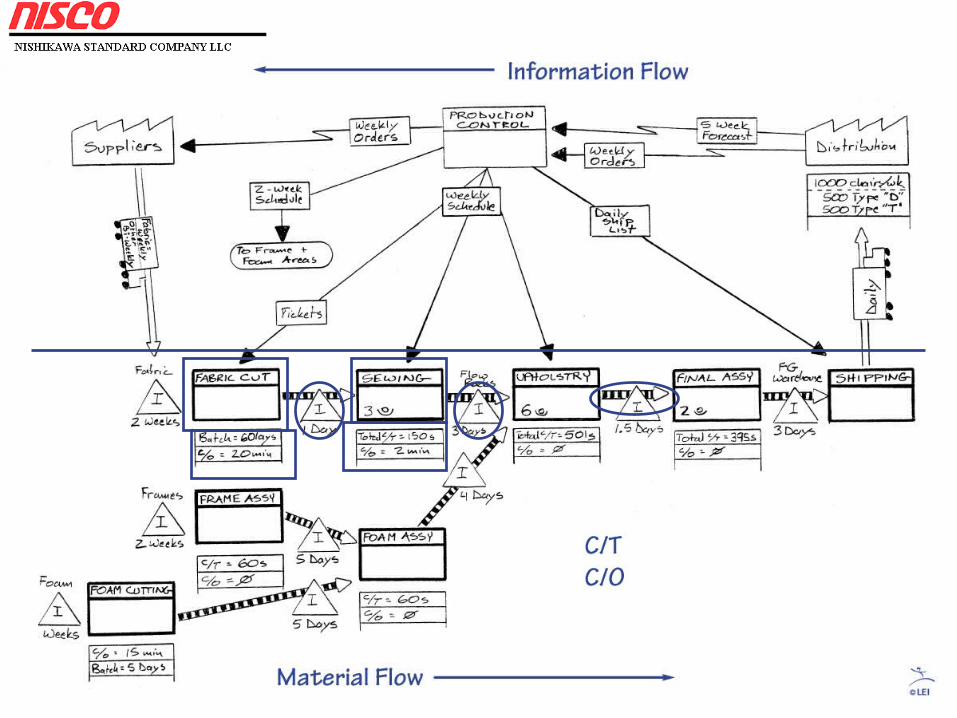
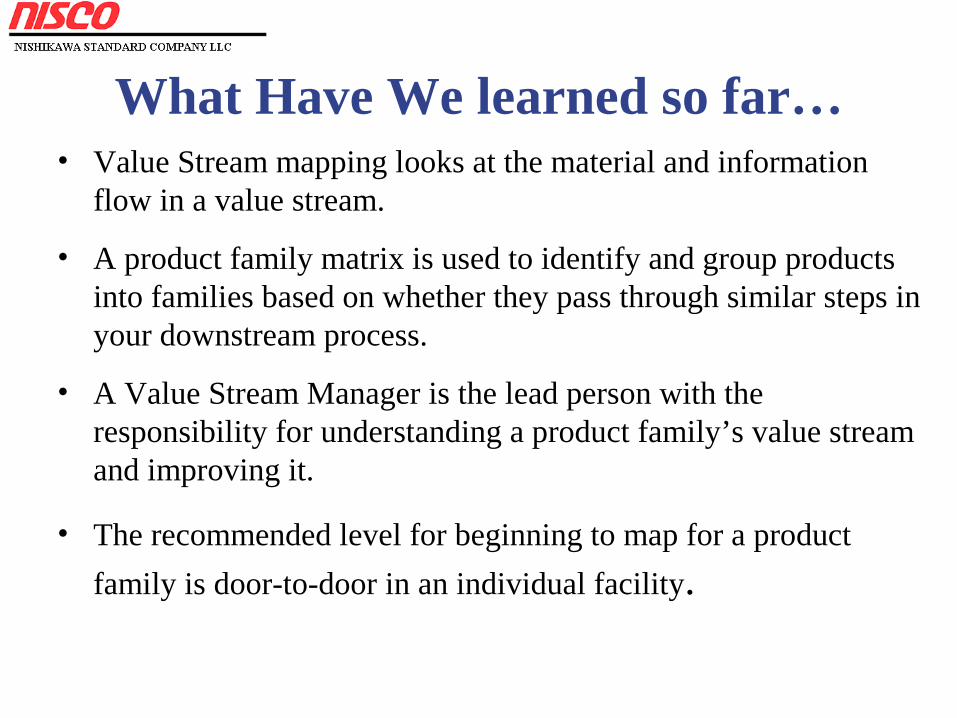
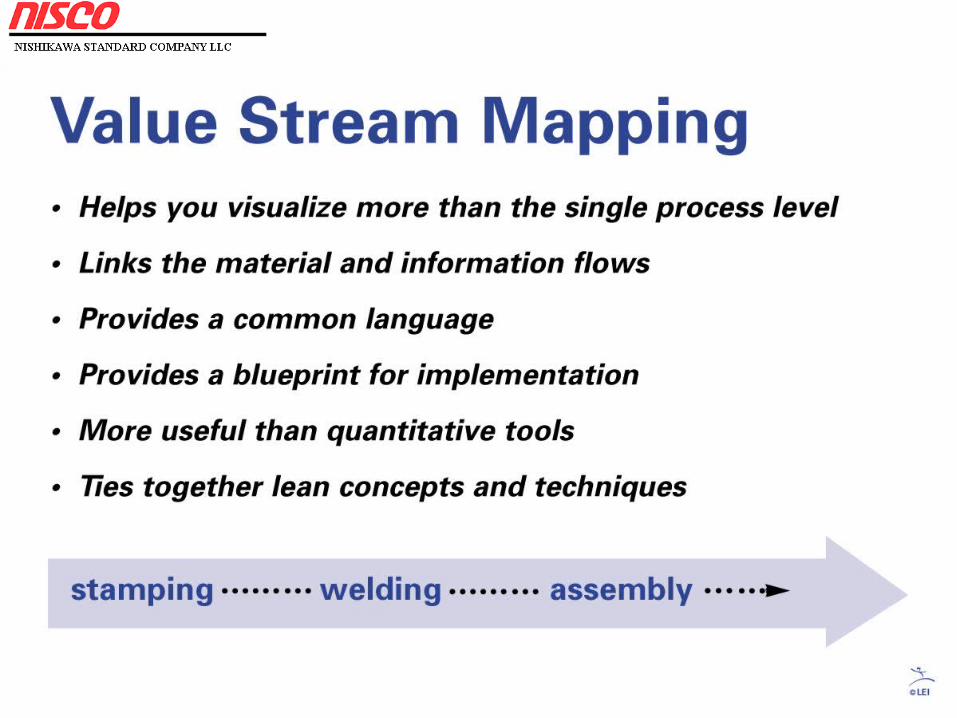
What Have We learned so far…• Value Stream mapping looks at the material and information
flow in a value stream.
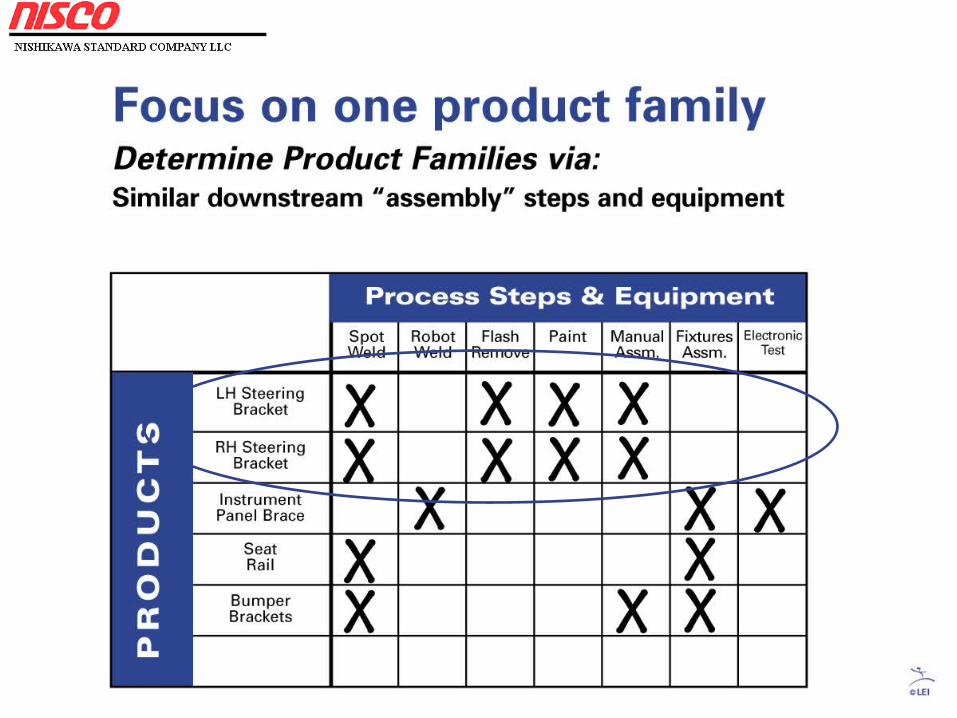
• A product family matrix is used to identify and group products into families based on whether they pass through similar steps in your downstream process.
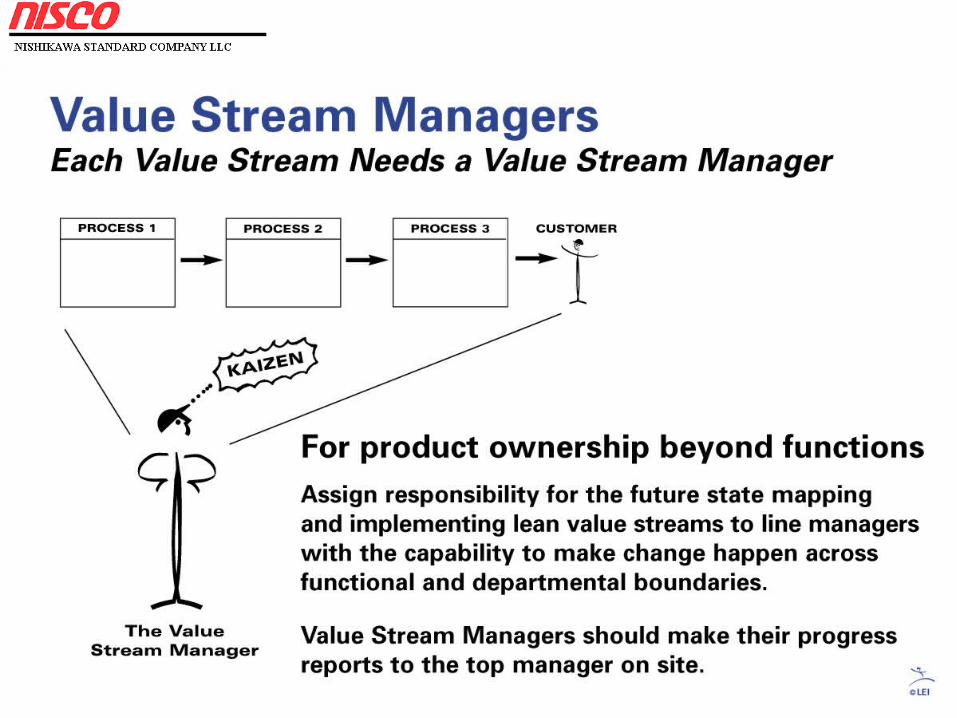
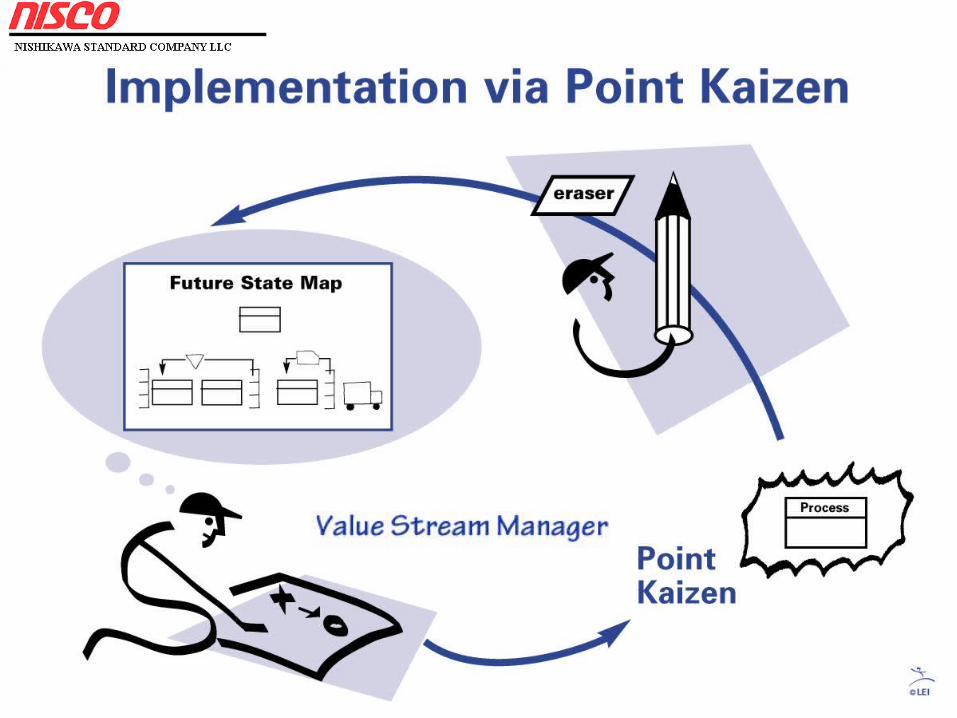
• A Value Stream Manager is the lead person with the responsibility for understanding a product family’s value stream and improving it.
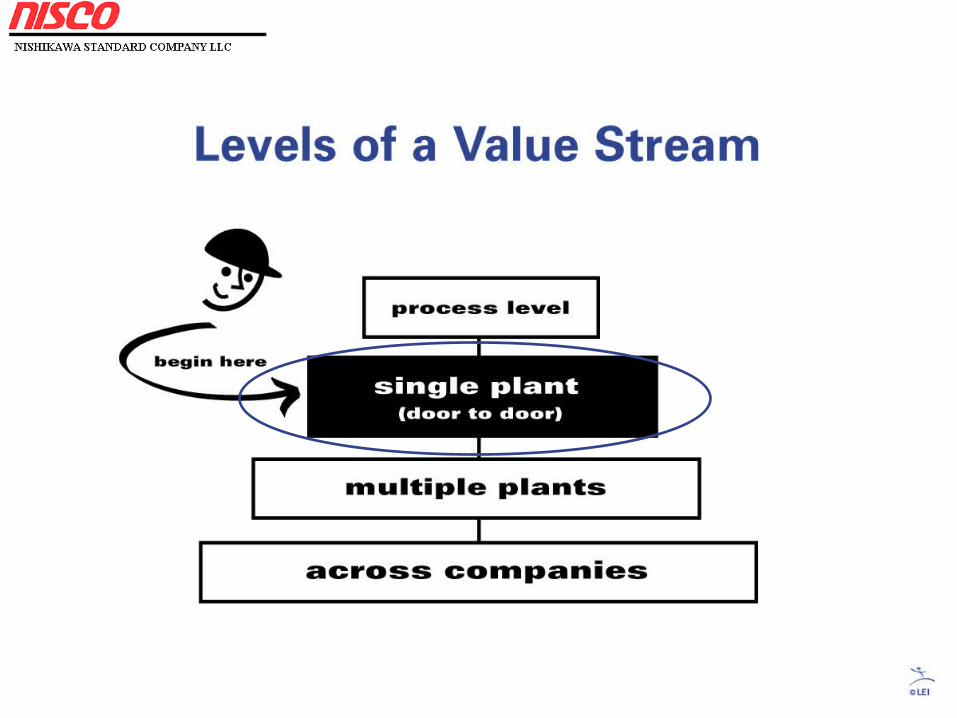
• The recommended level for beginning to map for a product
family is door-to-door in an individual facility.
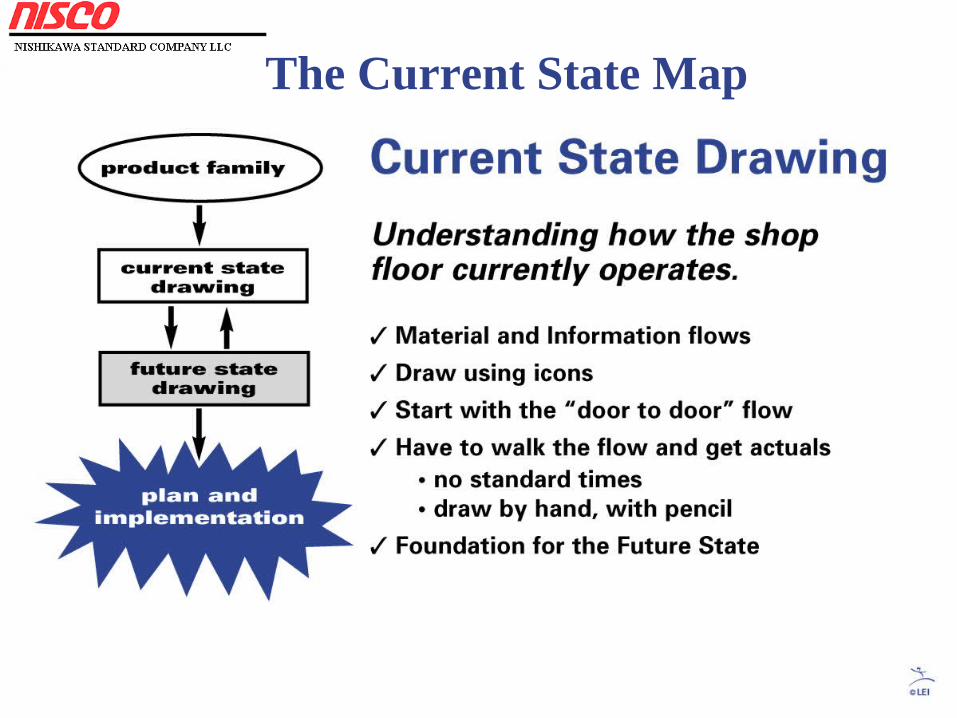
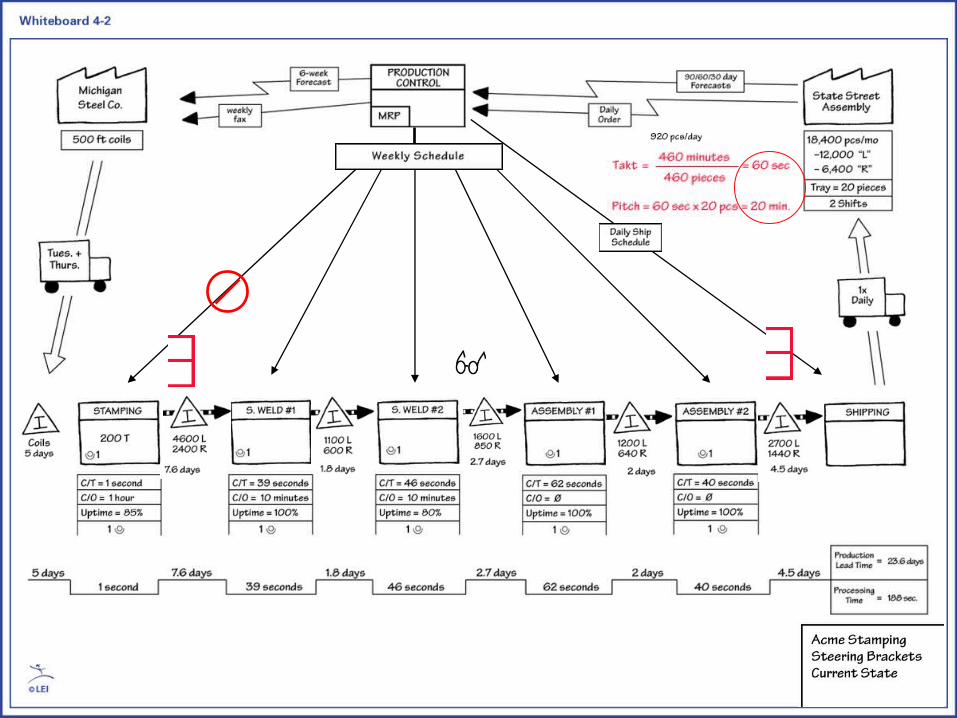
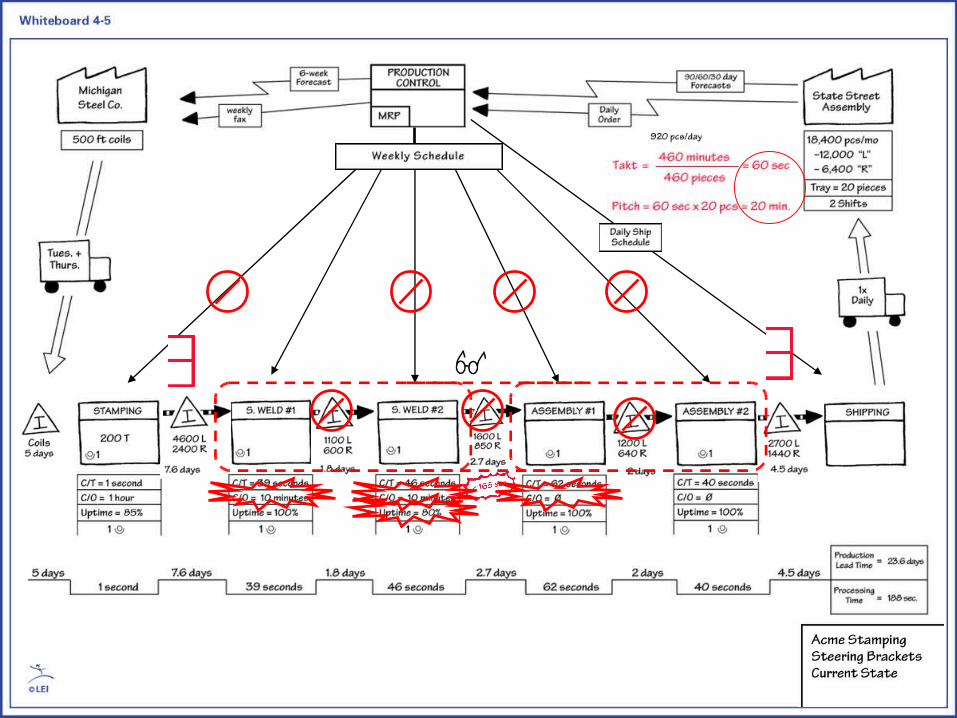
The Current State Map
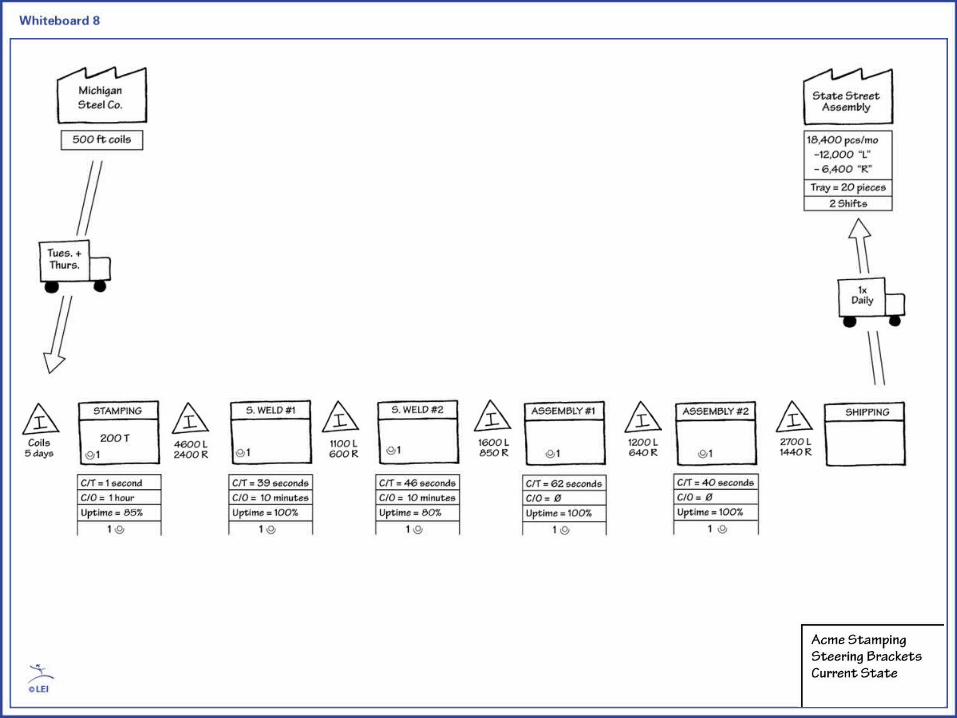
Points To Remember….
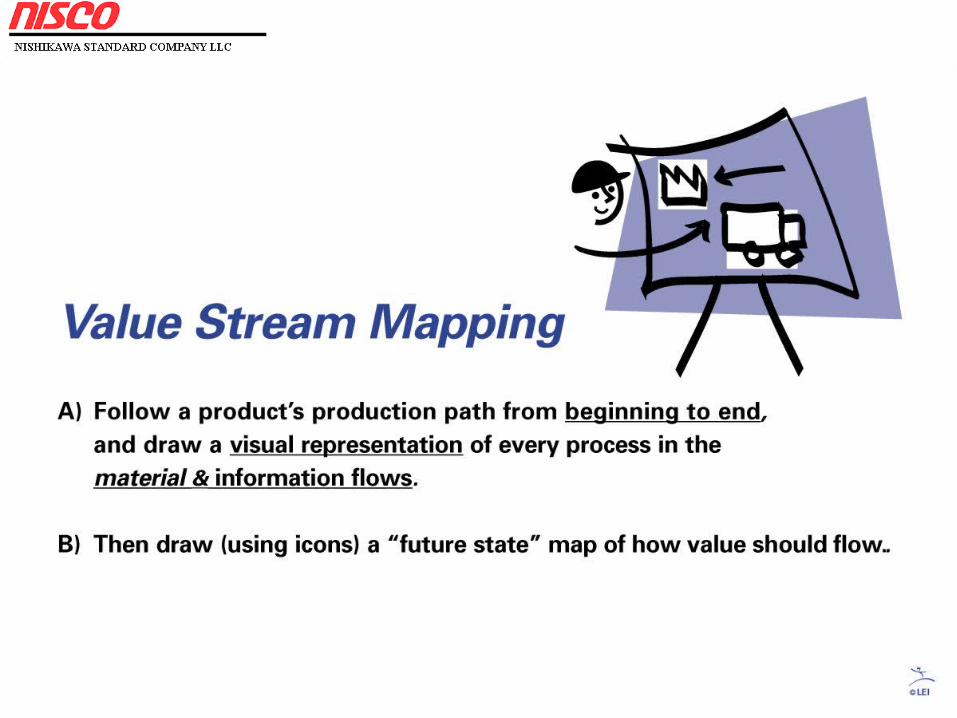
• The best way to draw a value stream map is in pencil on the work floor, mapping the whole value stream yourself.
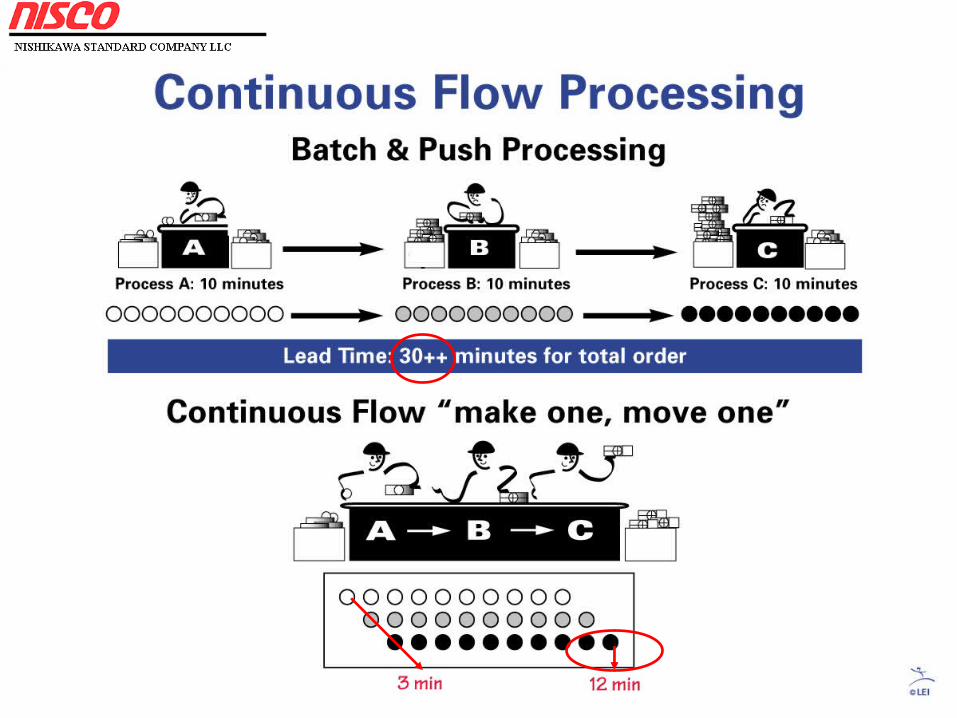
• Lead time is the time it takes one piece to move all the way through a process or a value stream from start to finish
• Data boxes should contain information based on what you observe as you draw your map.
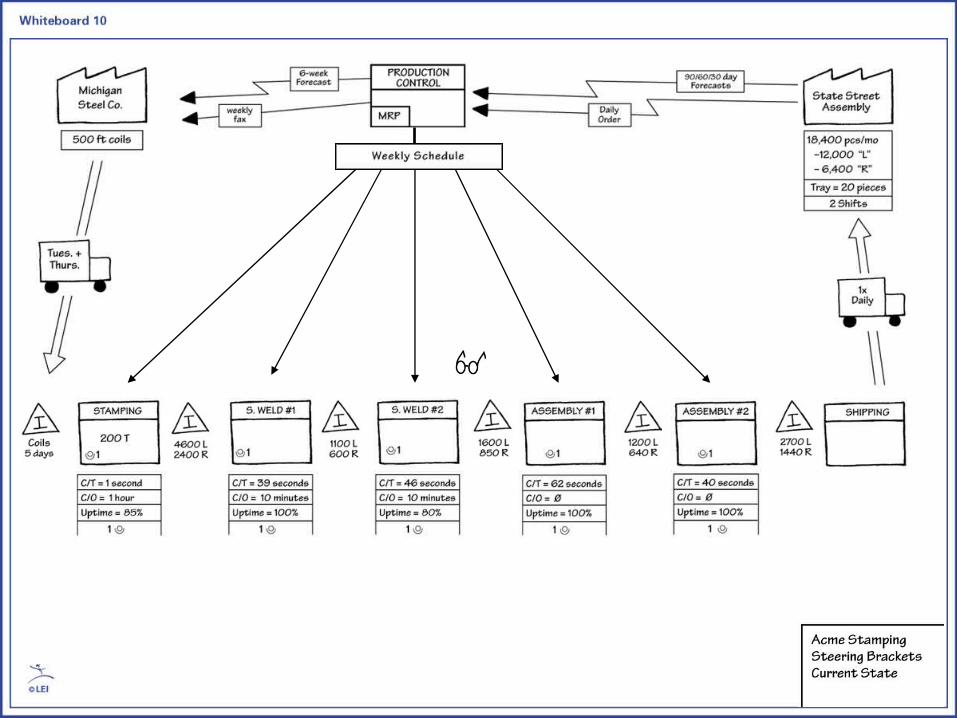
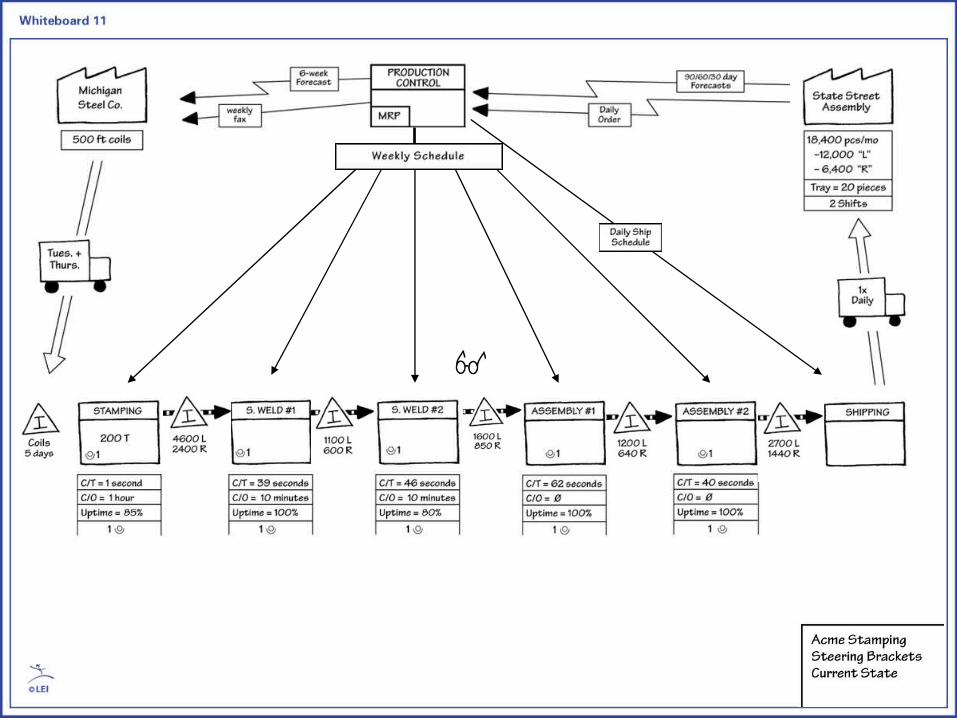
• The process of value stream mapping begins with the Supplier.
current state map. (less than 5 minutes)
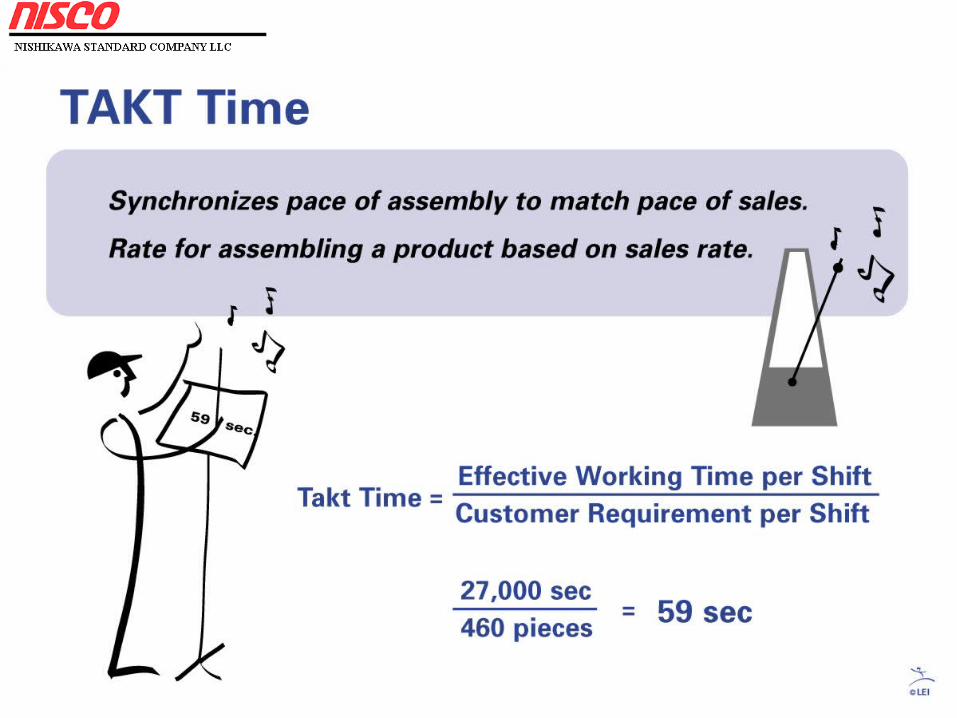
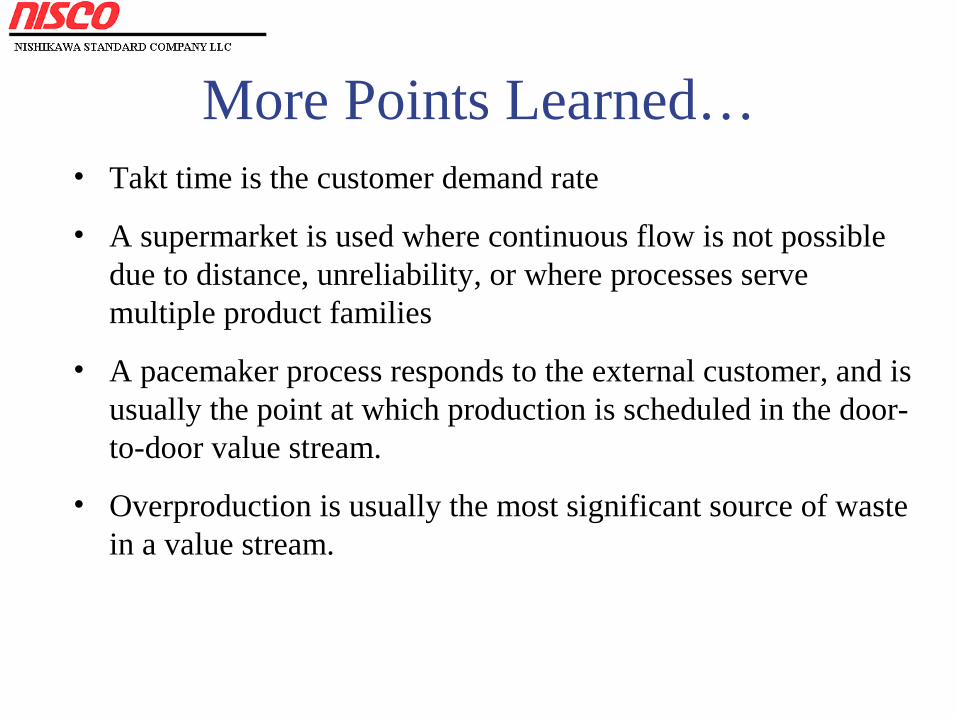
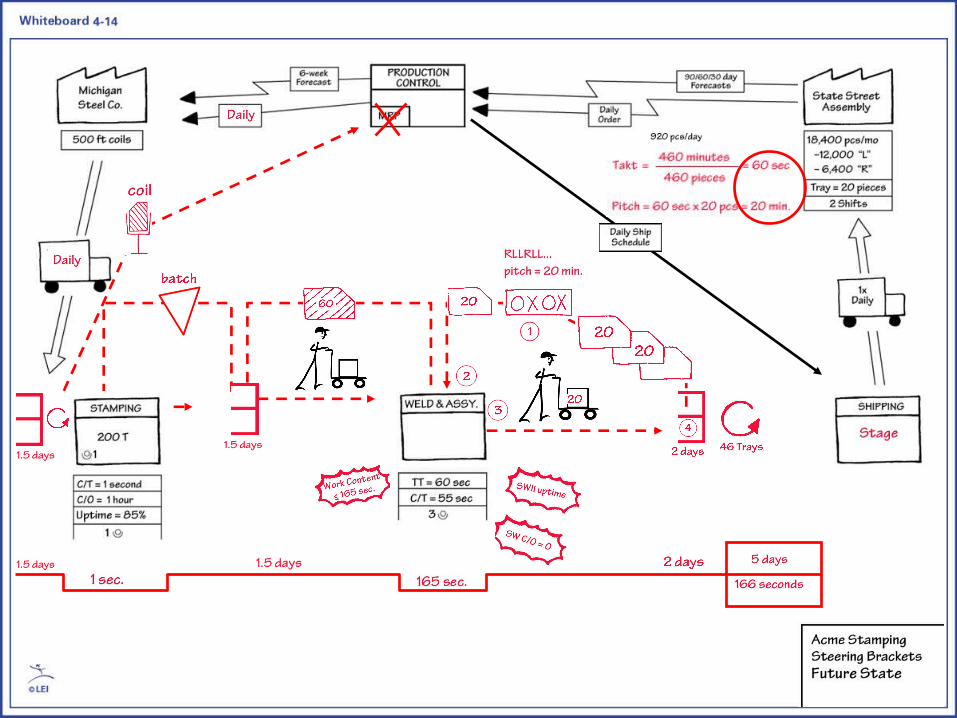
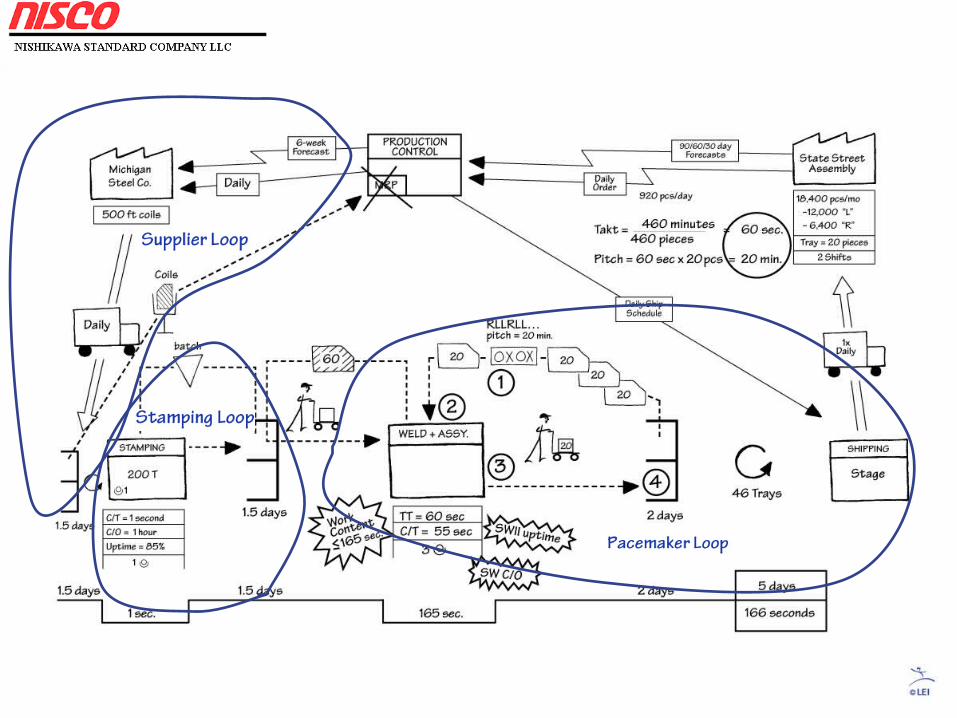
More Points Learned…• Takt time is the customer demand rate
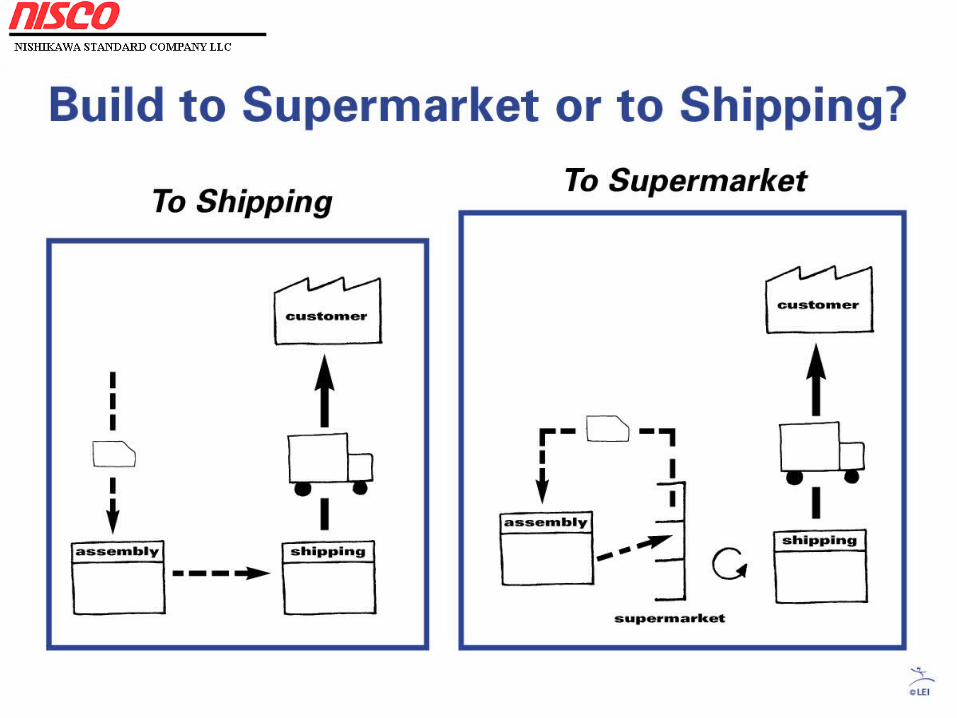
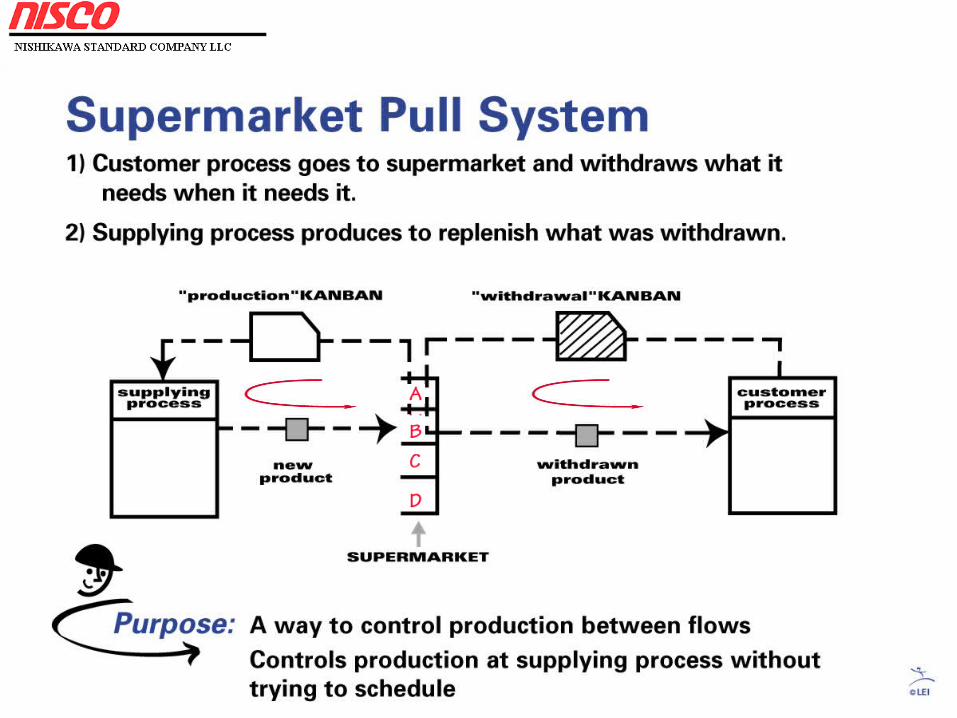
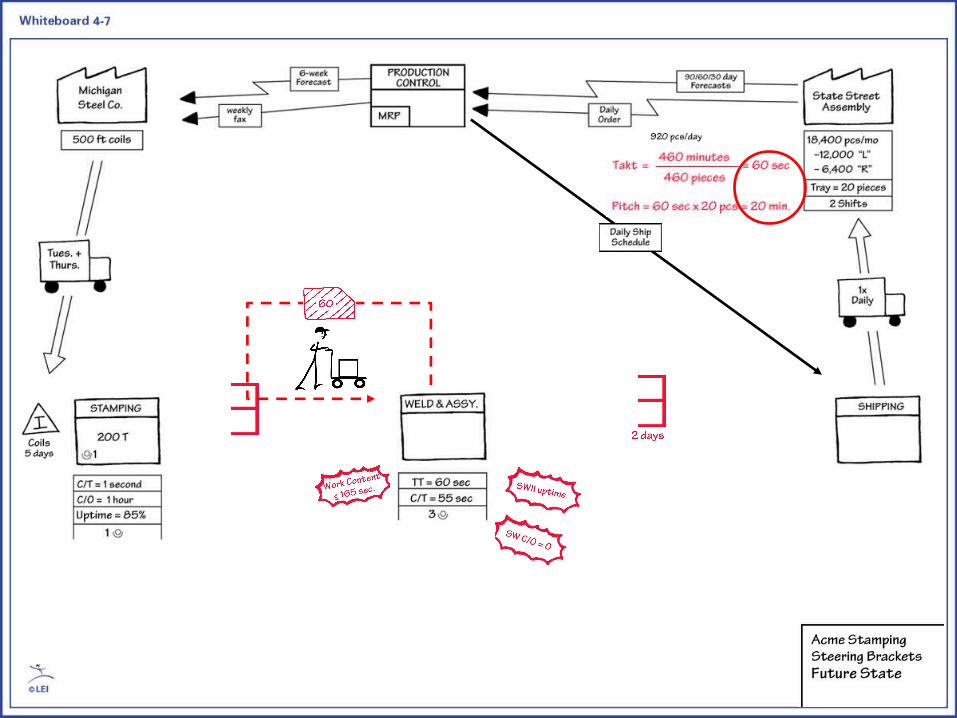
• A supermarket is used where continuous flow is not possible due to distance, unreliability, or where processes serve multiple product families
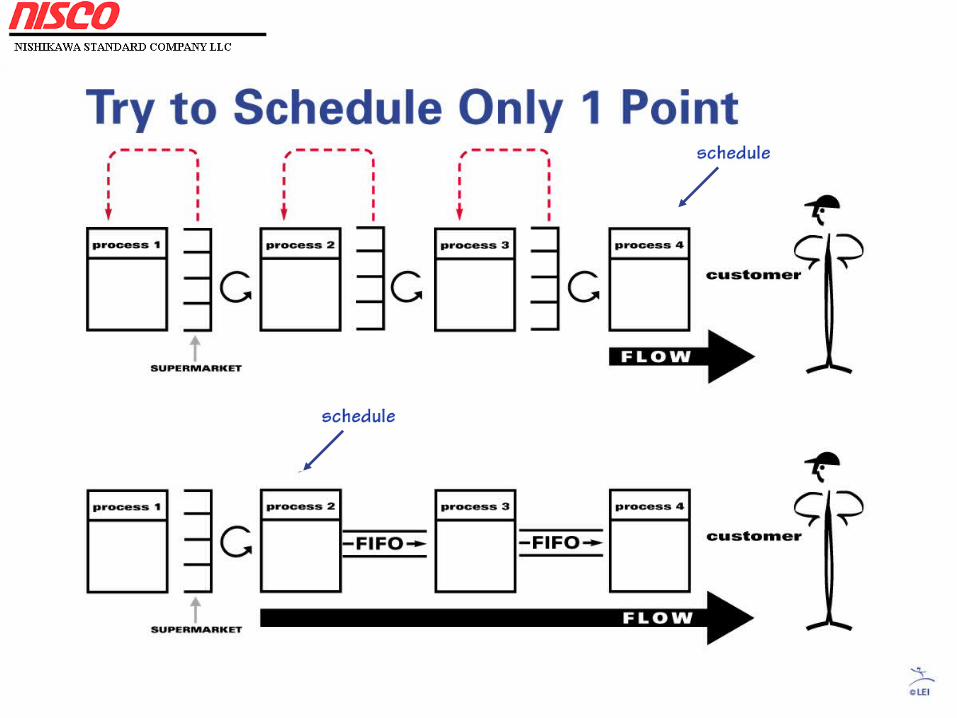
• A pacemaker process responds to the external customer, and is usually the point at which production is scheduled in the door-to-door value stream.
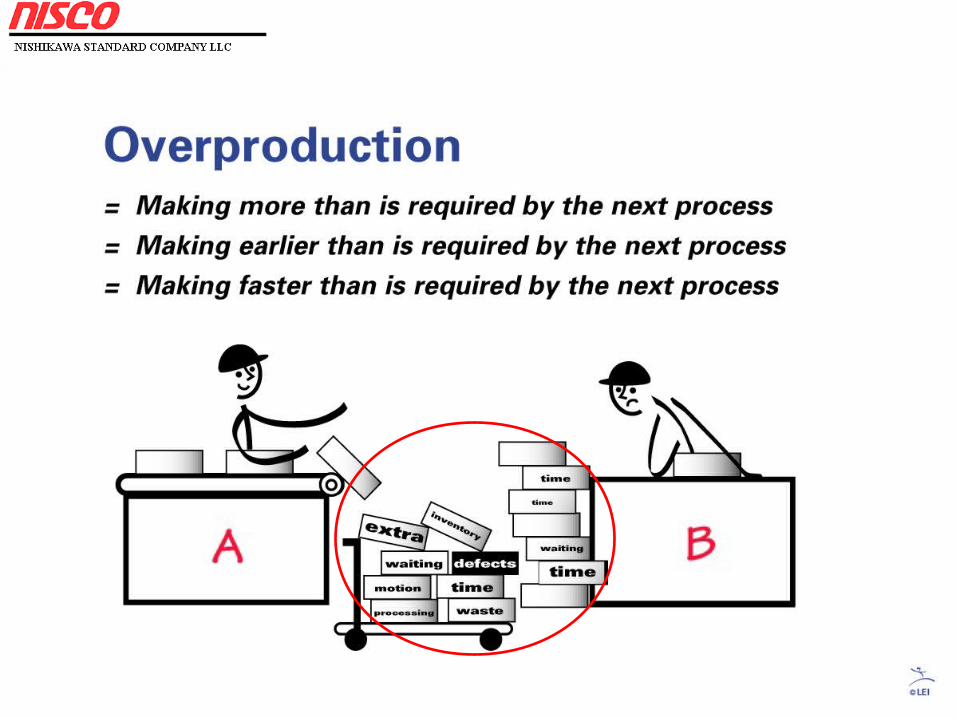
• Overproduction is usually the most significant source of waste in a value stream.
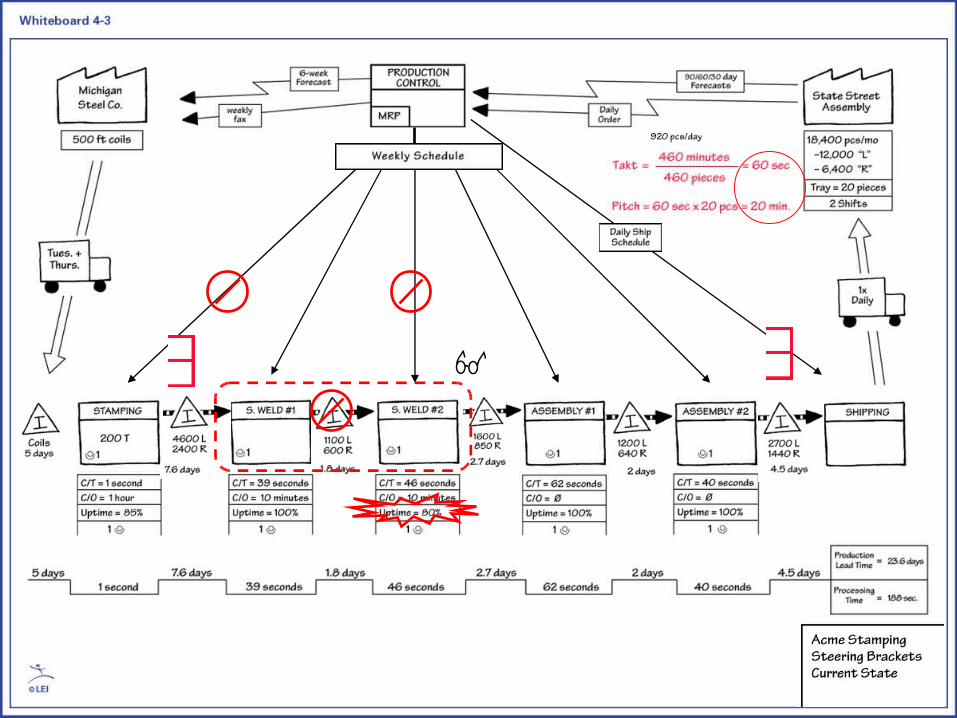
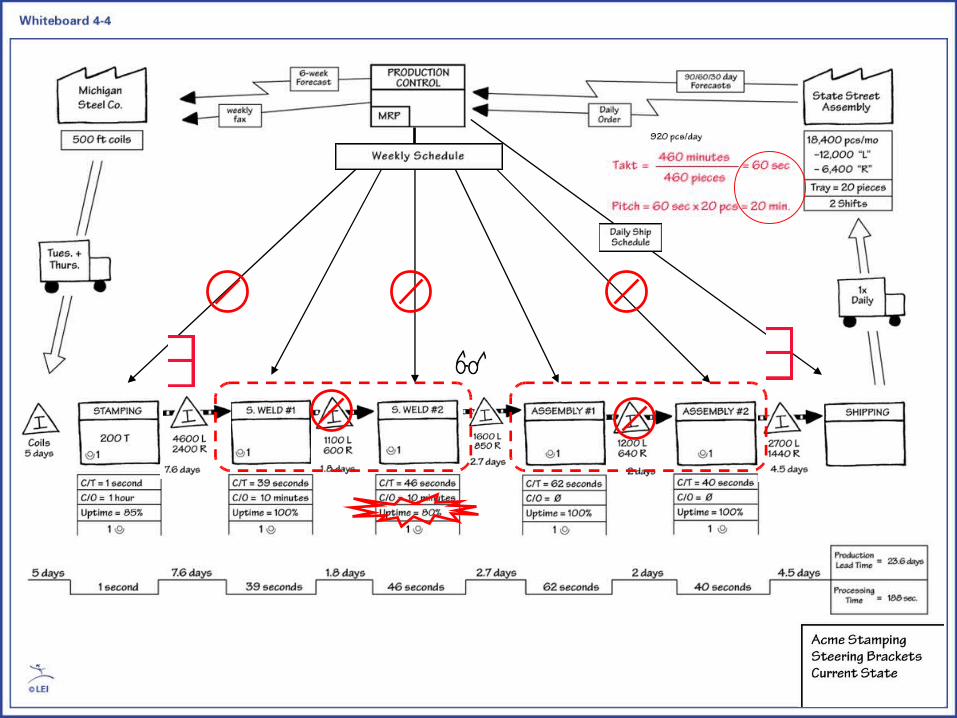
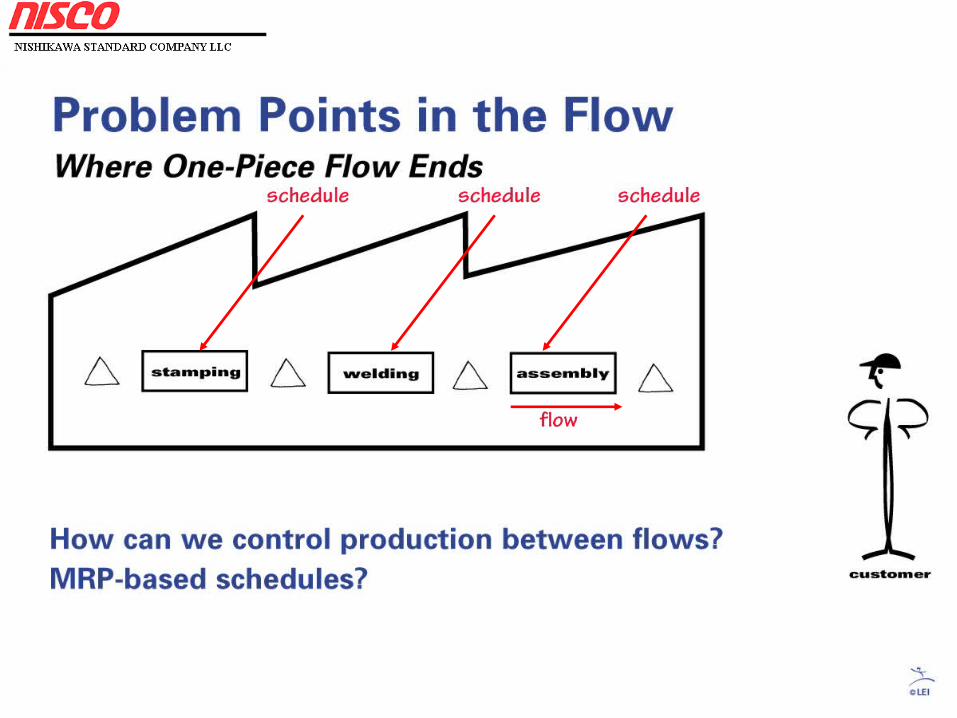
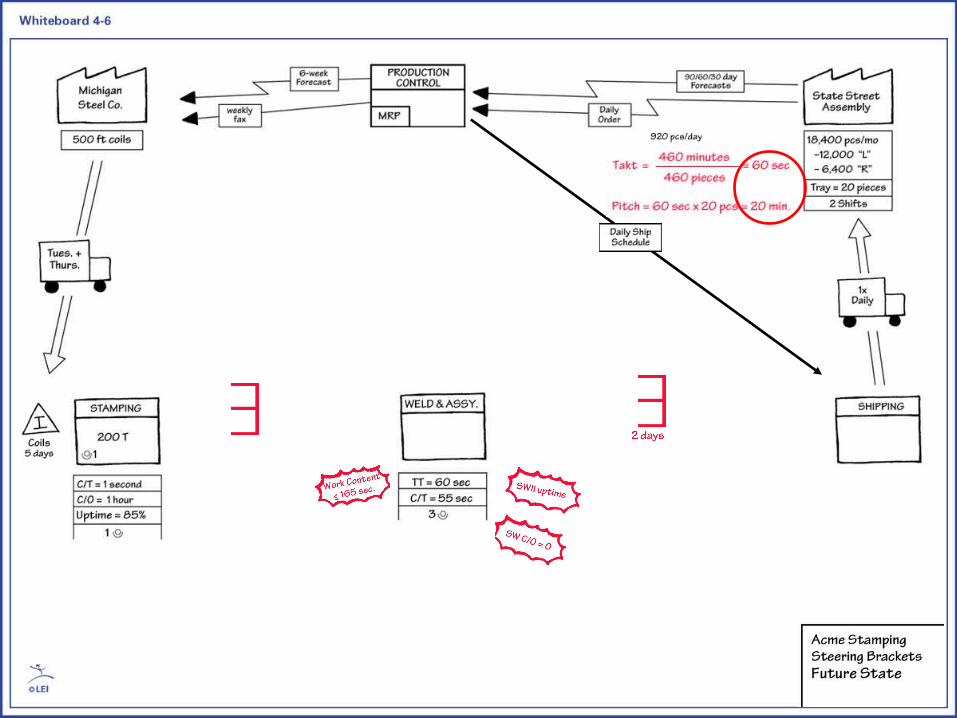
Why Not Flow From Weld - Assembly
• No Reason!!• The lean approach is to place these four
processes immediately adjacent to one another (cellular)
• Have the operators pass parts from one process to another.
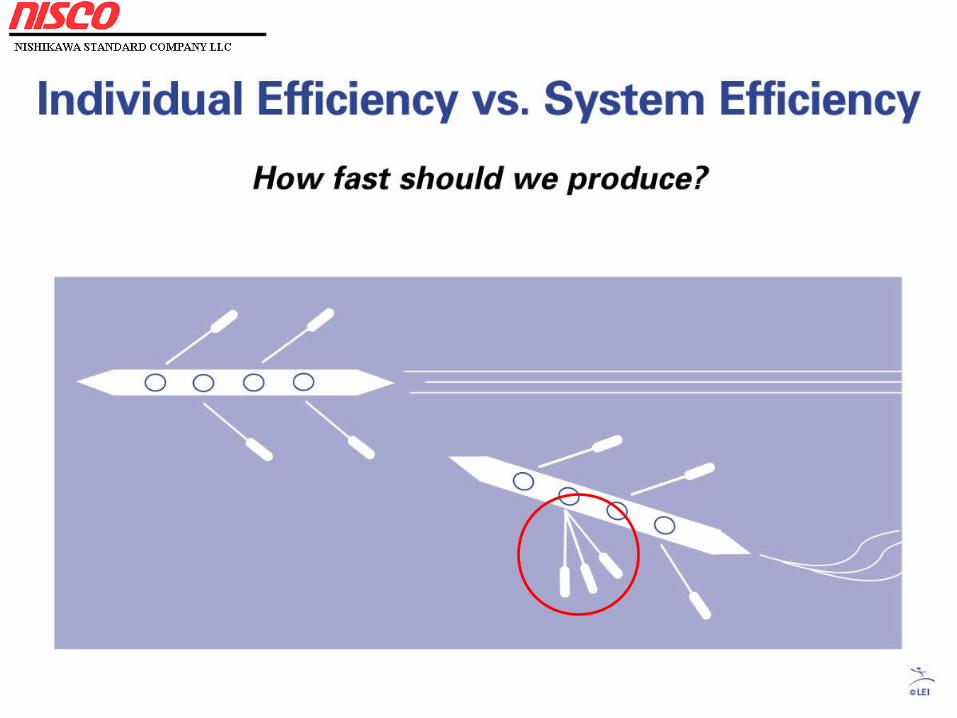
• Keep operator’s work content just below the takt time.
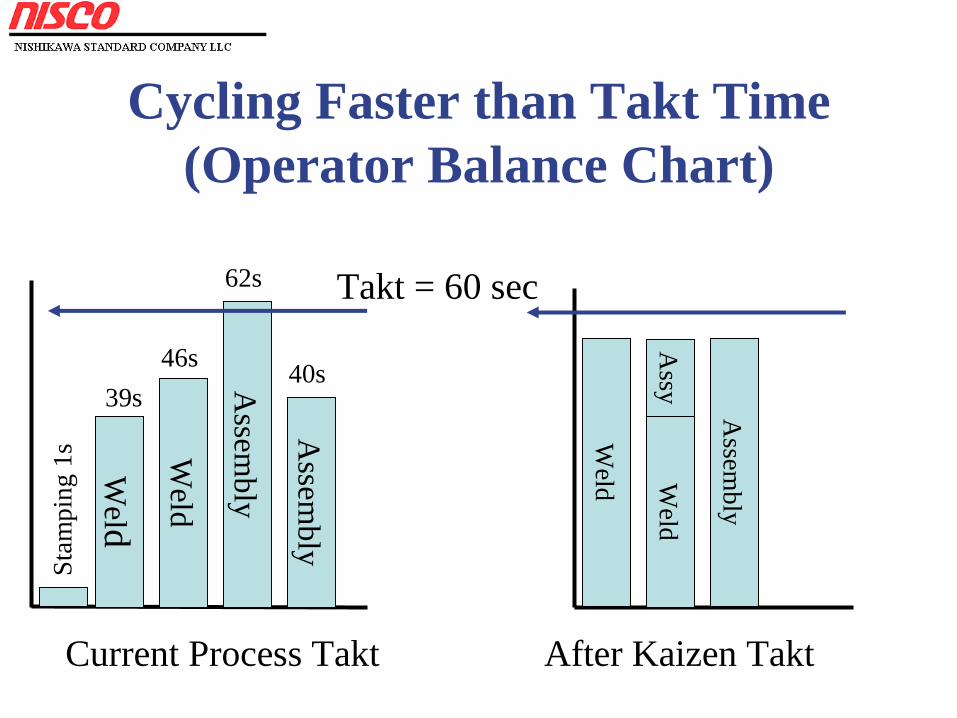
Cycling Faster than Takt Time(Operator Balance Chart)
Weld
Weld
Assem
bly
Assem
bly
Takt = 60 sec
Current Process Takt
Weld W
eldA
ssy
Assem
bly
After Kaizen Takt
Sta
mpi
ng 1
s
39s
46s
62s
40s

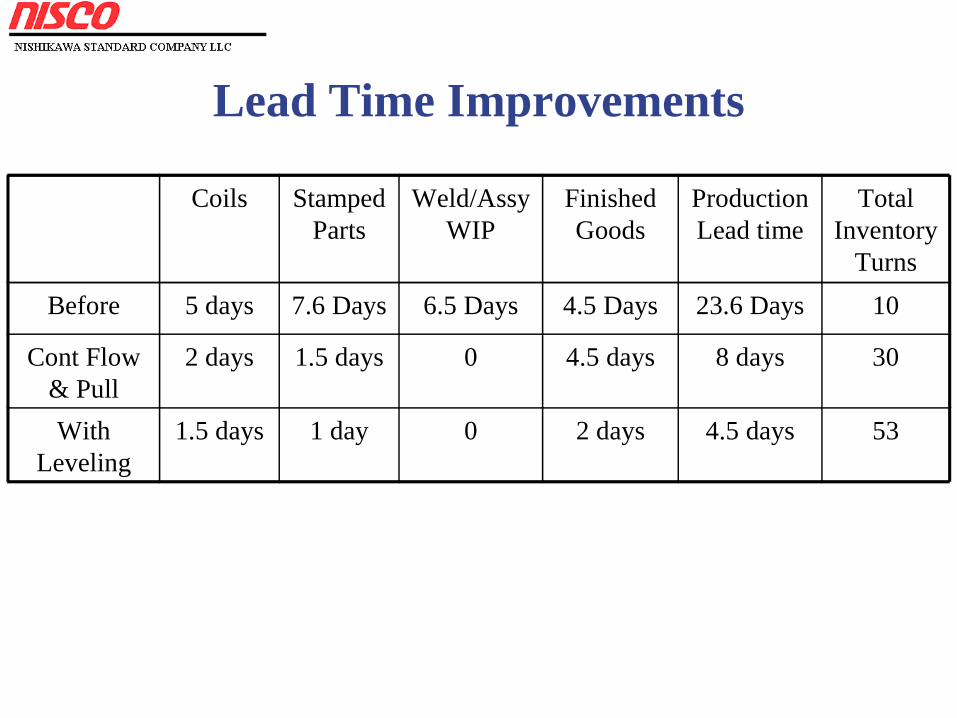
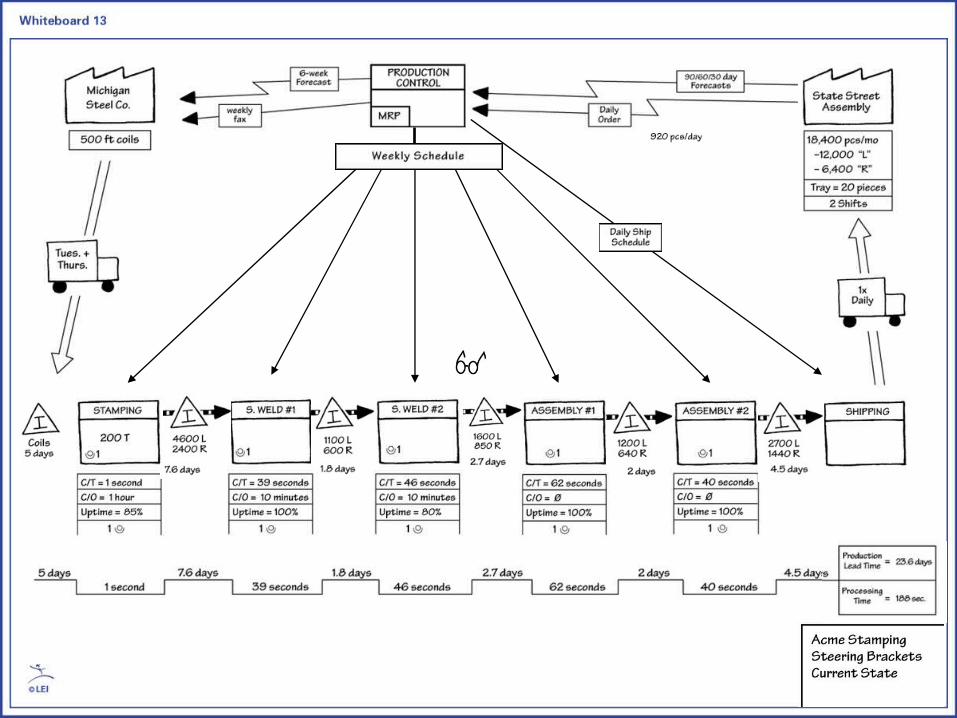
Lead Time Improvements
Coils Stamped Parts
Weld/Assy WIP
Finished Goods
Production Lead time
Total Inventory
Turns
Before 5 days 7.6 Days 6.5 Days 4.5 Days 23.6 Days 10
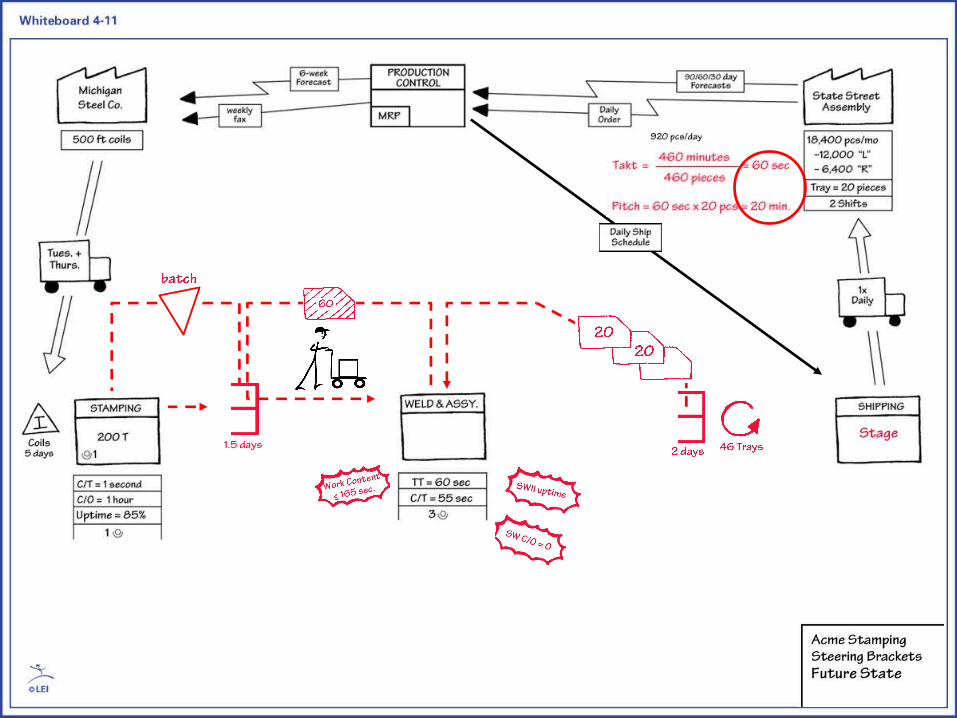
Cont Flow & Pull
2 days 1.5 days 0 4.5 days 8 days 30
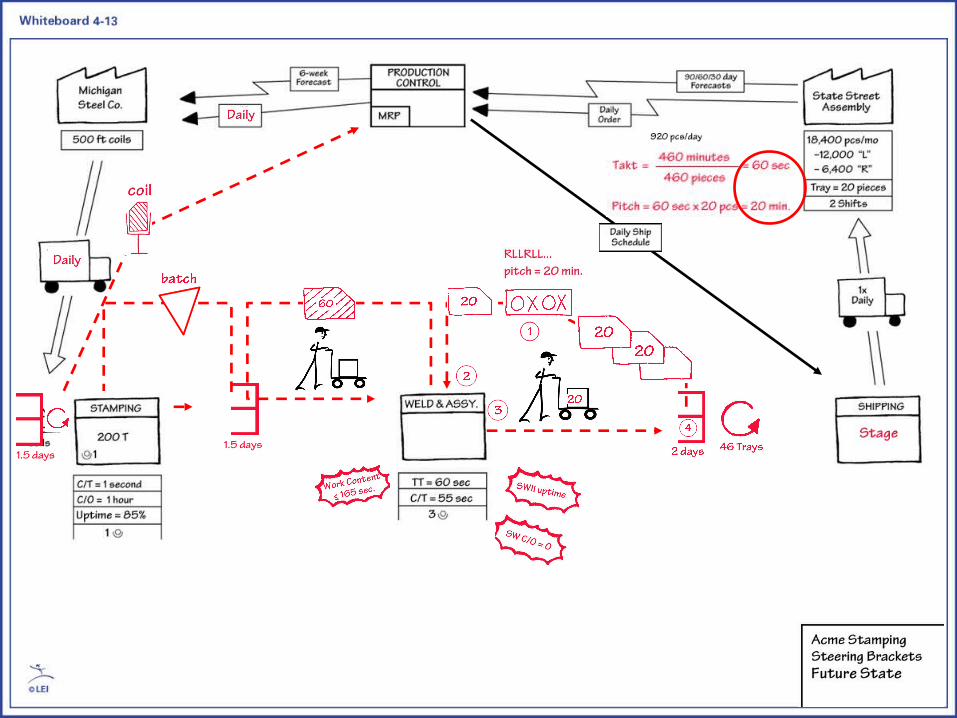
With Leveling
1.5 days 1 day 0 2 days 4.5 days 53
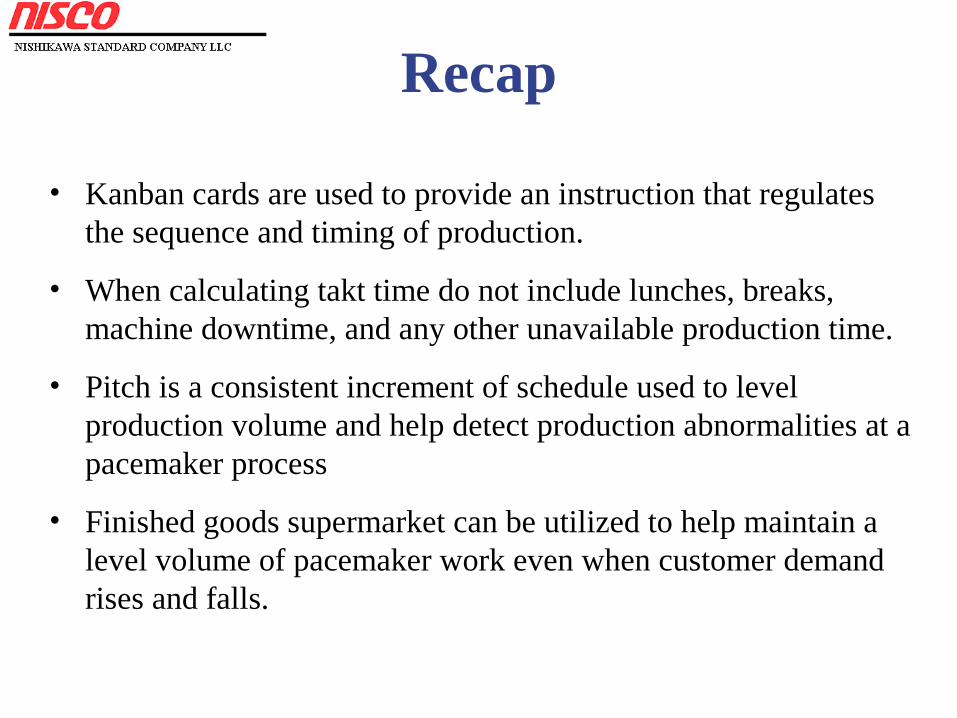
Recap
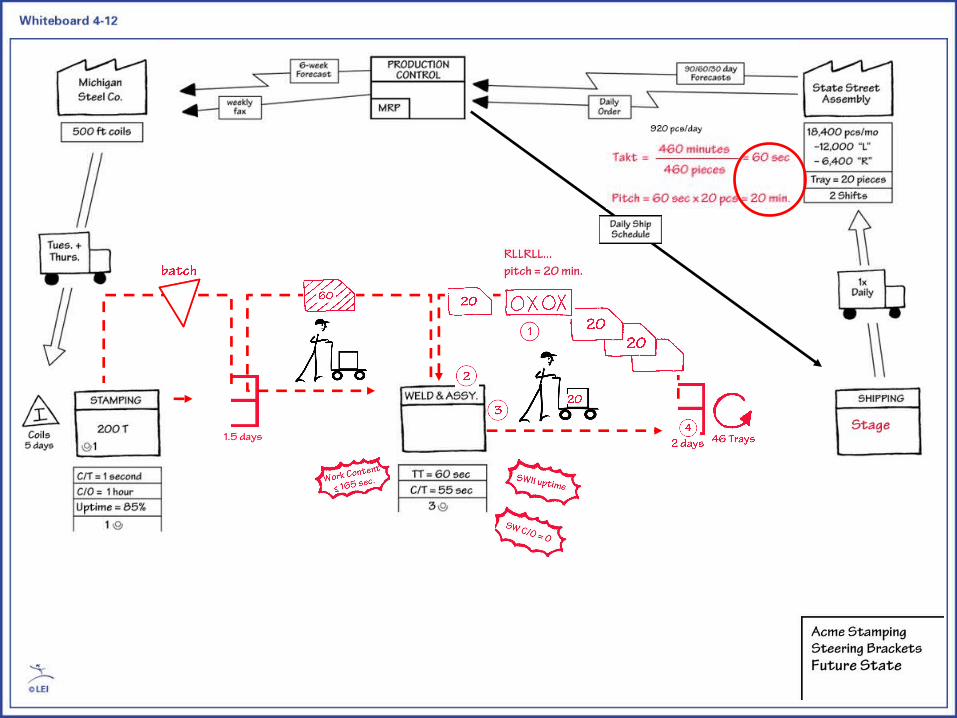
• Kanban cards are used to provide an instruction that regulates the sequence and timing of production.
• When calculating takt time do not include lunches, breaks, machine downtime, and any other unavailable production time.
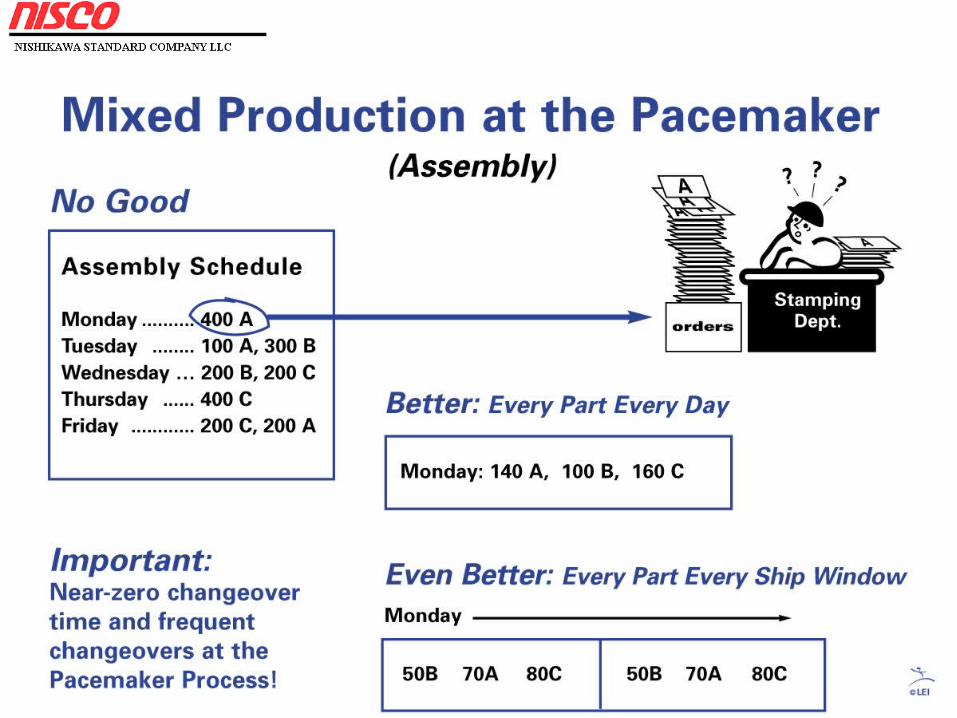
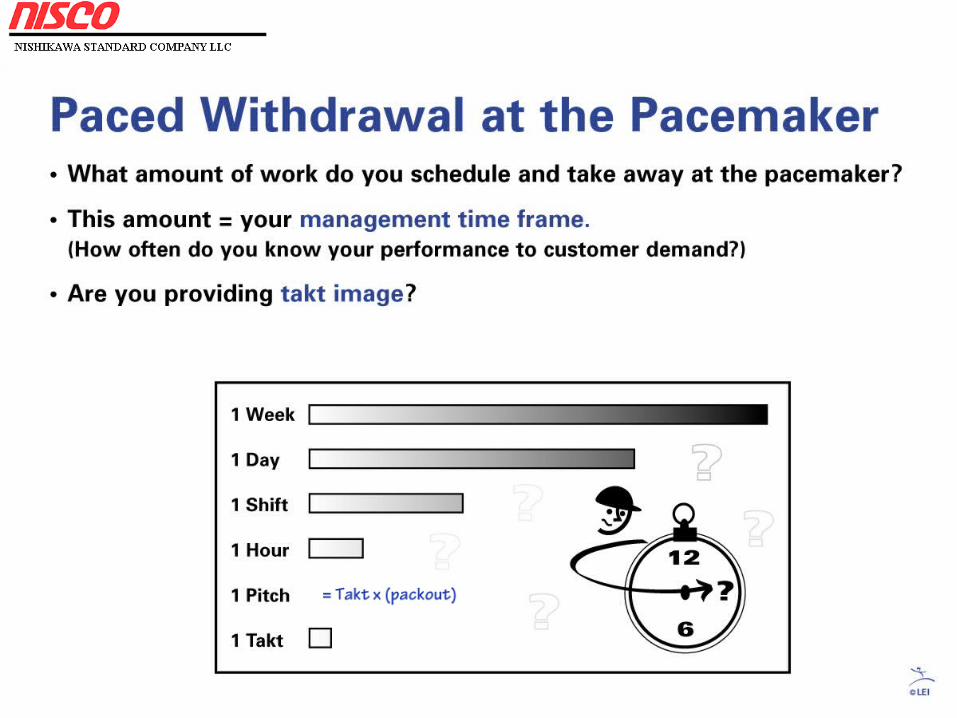
• Pitch is a consistent increment of schedule used to level production volume and help detect production abnormalities at a pacemaker process
• Finished goods supermarket can be utilized to help maintain a level volume of pacemaker work even when customer demand rises and falls.
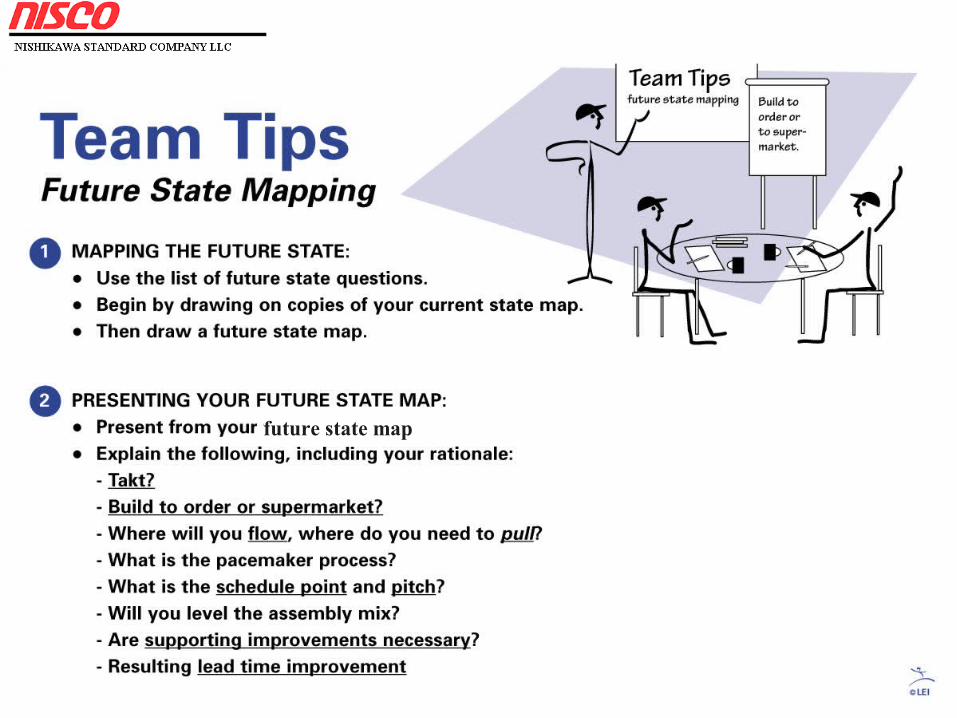
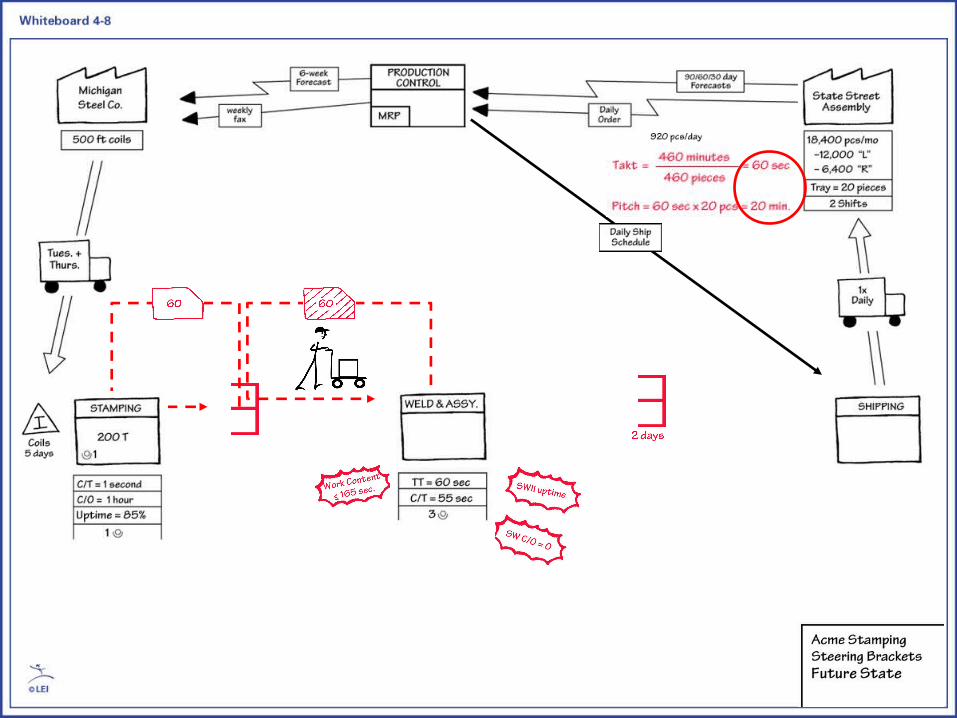
future state map
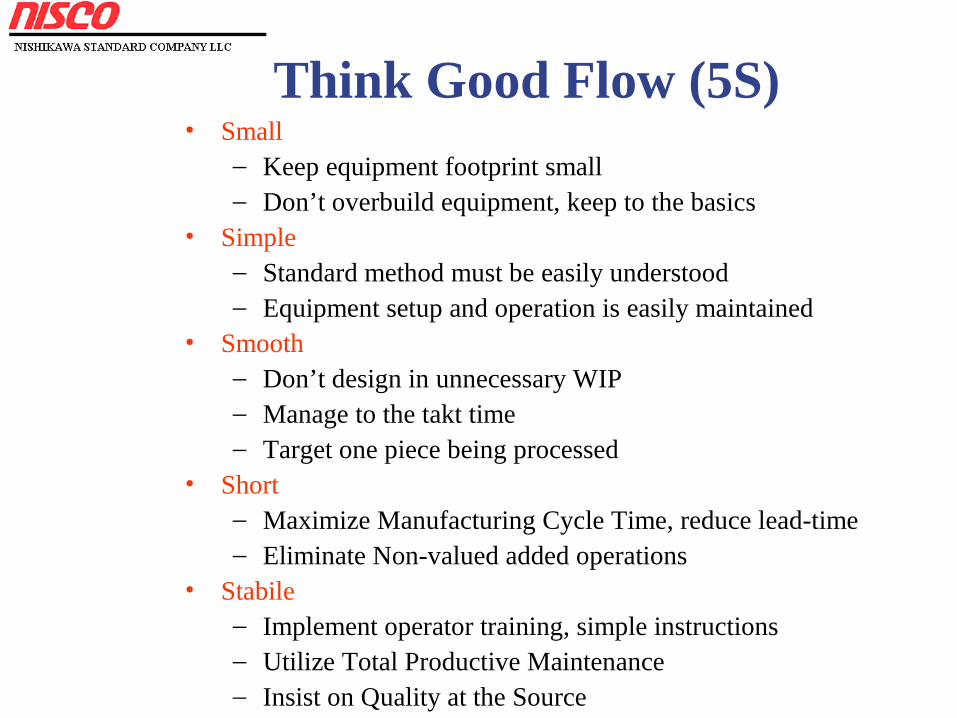
• Small– Keep equipment footprint small– Don’t overbuild equipment, keep to the basics
• Simple– Standard method must be easily understood– Equipment setup and operation is easily maintained
• Smooth– Don’t design in unnecessary WIP– Manage to the takt time– Target one piece being processed
• Short– Maximize Manufacturing Cycle Time, reduce lead-time– Eliminate Non-valued added operations
• Stabile– Implement operator training, simple instructions– Utilize Total Productive Maintenance– Insist on Quality at the Source
Think Good Flow (5S)
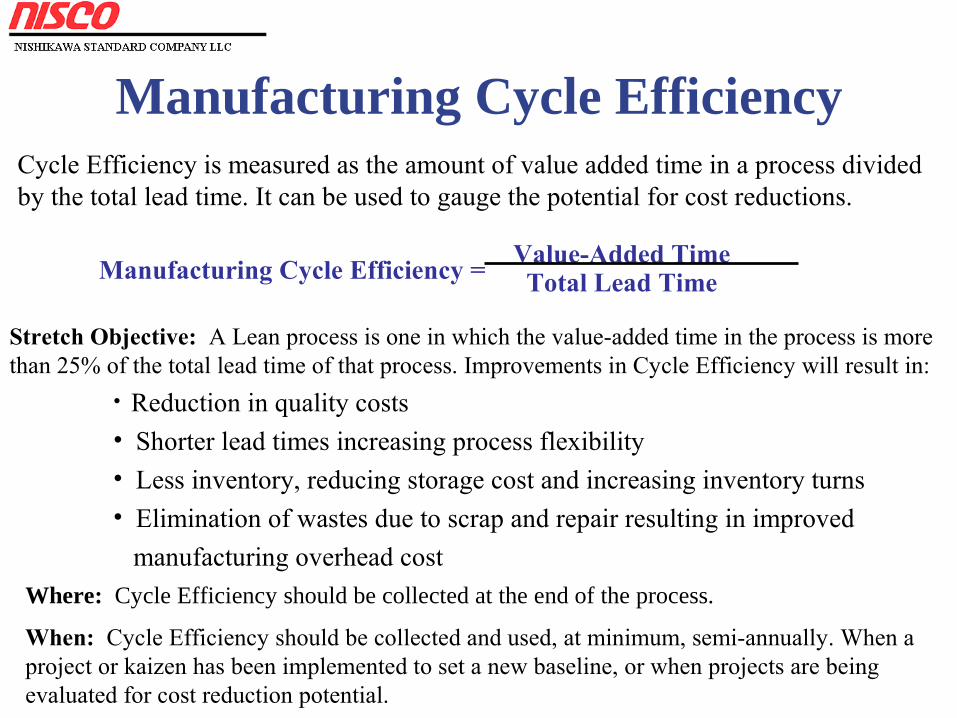
Manufacturing Cycle EfficiencyCycle Efficiency is measured as the amount of value added time in a process divided by the total lead time. It can be used to gauge the potential for cost reductions.
Stretch Objective: A Lean process is one in which the value-added time in the process is more than 25% of the total lead time of that process. Improvements in Cycle Efficiency will result in:
• Reduction in quality costs• Shorter lead times increasing process flexibility• Less inventory, reducing storage cost and increasing inventory turns• Elimination of wastes due to scrap and repair resulting in improved manufacturing overhead cost
Where: Cycle Efficiency should be collected at the end of the process.
When: Cycle Efficiency should be collected and used, at minimum, semi-annually. When a project or kaizen has been implemented to set a new baseline, or when projects are being evaluated for cost reduction potential.
Value-Added TimeTotal Lead TimeManufacturing Cycle Efficiency =
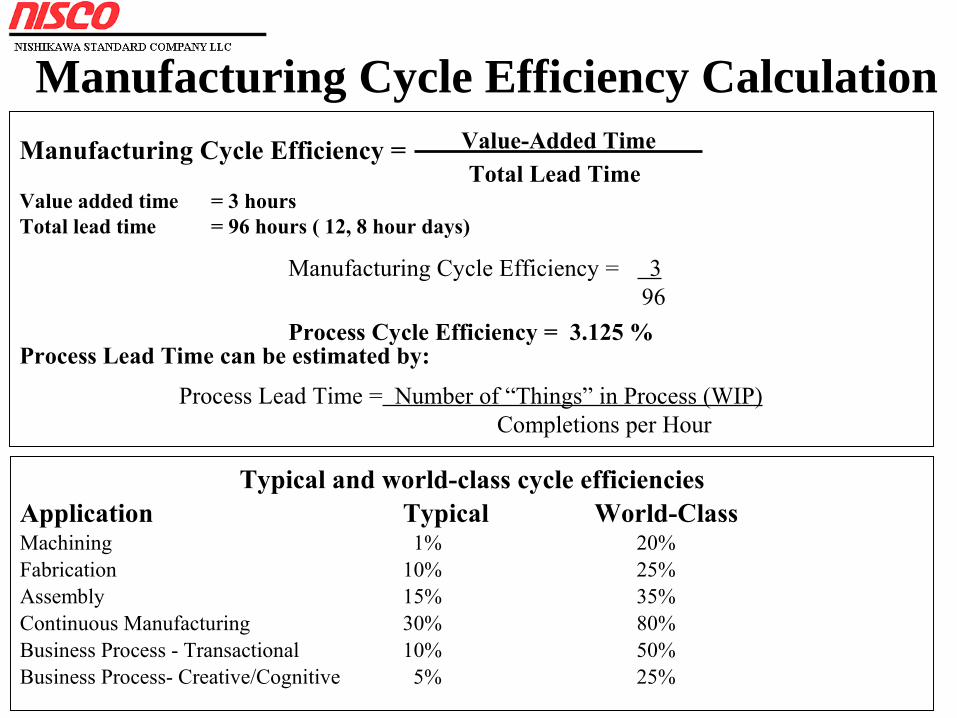
Manufacturing Cycle Efficiency Calculation
Typical and world-class cycle efficienciesApplication Typical World-ClassMachining 1% 20%Fabrication 10% 25%Assembly 15% 35%Continuous Manufacturing 30% 80%Business Process - Transactional 10% 50%Business Process- Creative/Cognitive 5% 25%
Manufacturing Cycle Efficiency =
Value added time = 3 hoursTotal lead time = 96 hours ( 12, 8 hour days)
Process Lead Time can be estimated by:Process Cycle Efficiency = 3.125 %
Manufacturing Cycle Efficiency = 3 96
Process Lead Time = Number of “Things” in Process (WIP) Completions per Hour
Value-Added TimeTotal Lead Time
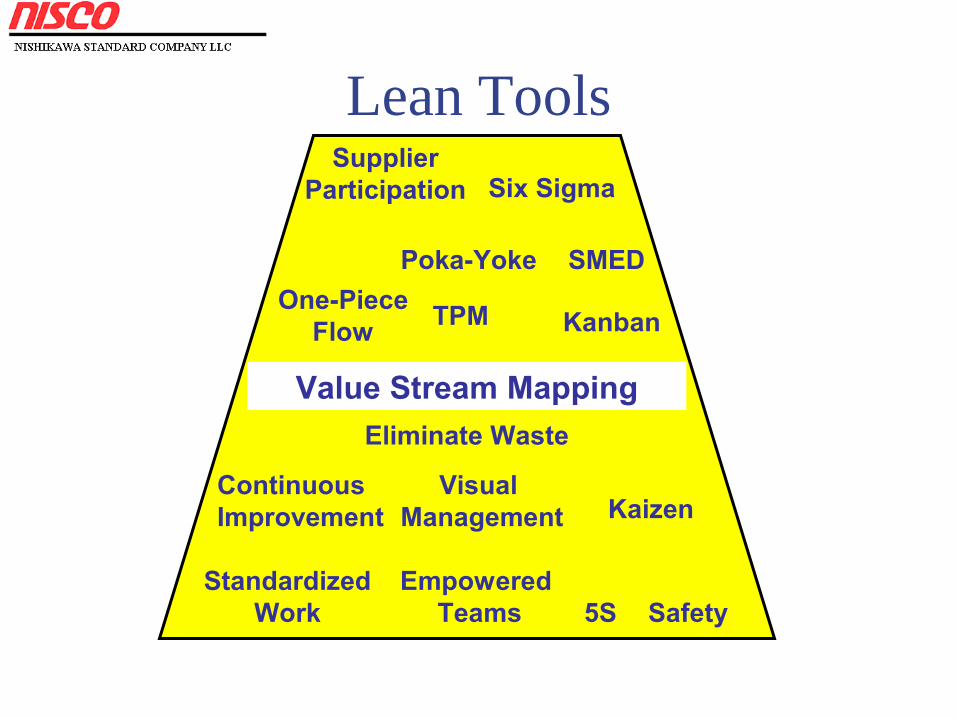
Lean Tools
Kaizen
One-Piece Flow Kanban
Value Stream Mapping
Six Sigma
Visual Management
Empowered Teams 5S
Standardized Work
SMED
TPM
Poka-Yoke
Safety
Eliminate Waste
Continuous Improvement
SupplierParticipation
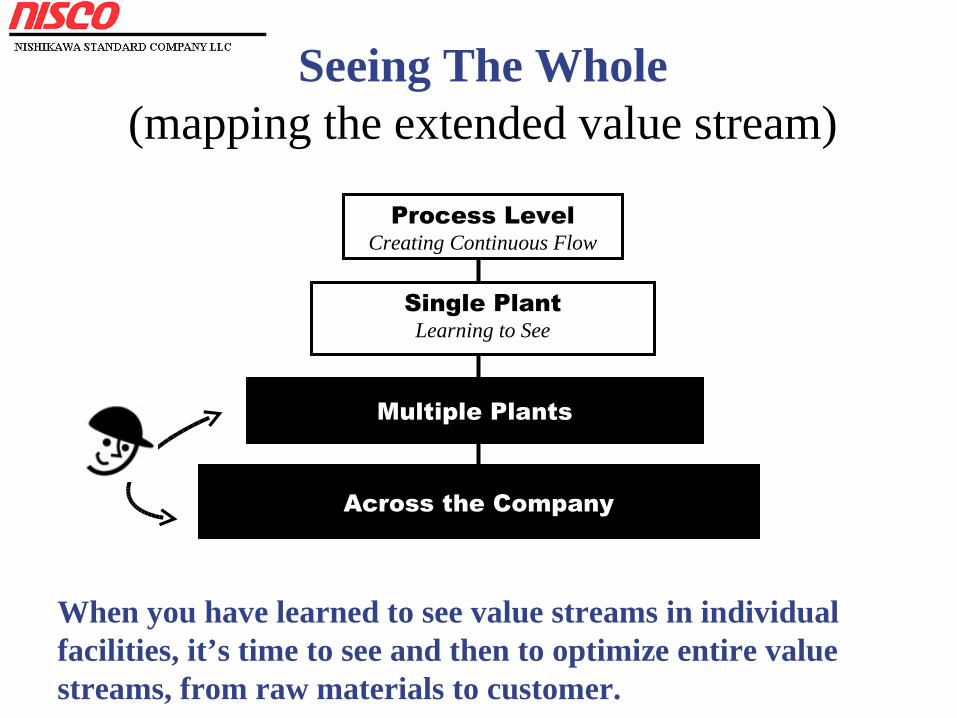
Seeing The Whole(mapping the extended value stream)
Process LevelCreating Continuous Flow
Single PlantLearning to See
Multiple Plants
Across the Company
When you have learned to see value streams in individual facilities, it’s time to see and then to optimize entire value streams, from raw materials to customer.
Acknowledgements
• Lean Enterprise Institute (LEI)• Learning to See
– Mike Rother– John Shook
Questions?
Thanks For Your Attendance