van ommen (fluidization)
TRANSCRIPT

JMBC/OSPT course Particle Technology 2010
J. Ruud van Ommen* & Naoko Ellis**
*Delft University of Technology, the Netherlands**University of British Columbia, Canada
Fluidization
Intro gas-solids fluidized bed
Fluidized bed: particles suspended in an upwardgas stream; they move
drag force
equals
gravitationalforce
Packed bed: particles are stagnant
drag force
smaller than
gravitationalforce
dense phase oremulsion phase
gas ‘bubble’
particleinterstitial gas
gas
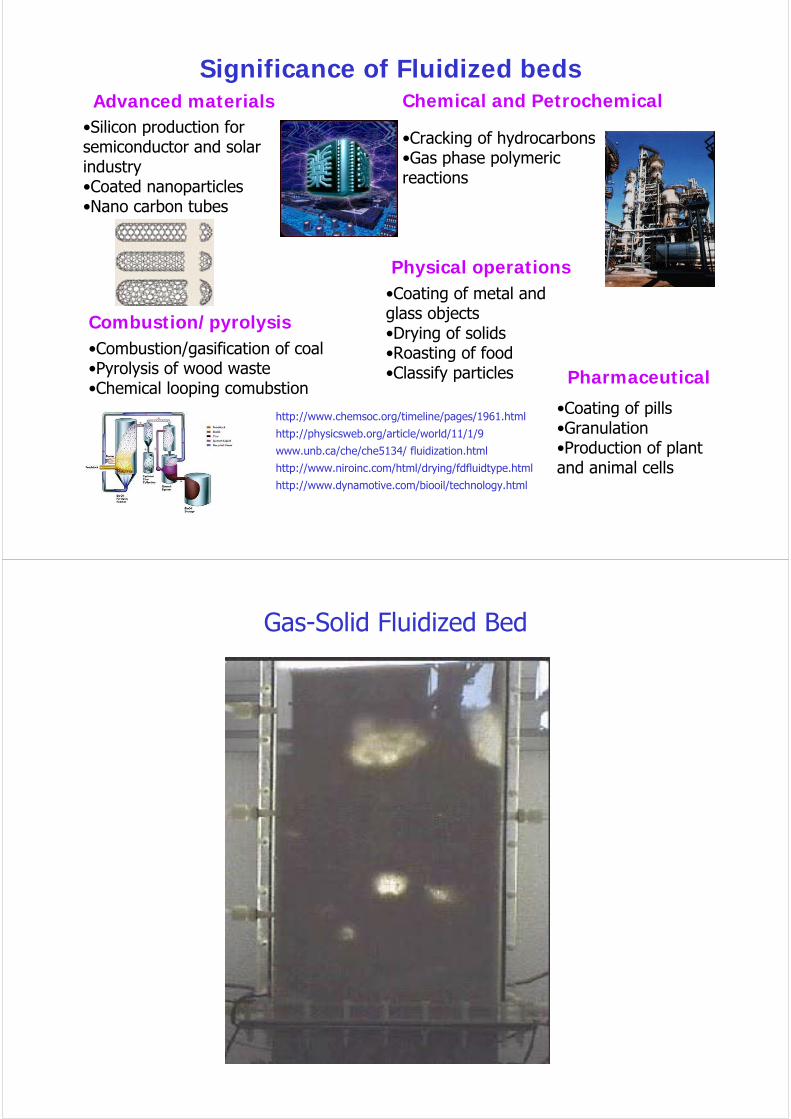
Significance of Fluidized bedsAdvanced materials Chemical and Petrochemical
Combustion/pyrolysis
Physical operations
•Silicon production for semiconductor and solar industry•Coated nanoparticles•Nano carbon tubes
•Cracking of hydrocarbons•Gas phase polymeric reactions
•Combustion/gasification of coal•Pyrolysis of wood waste•Chemical looping comubstion
•Coating of metal and glass objects•Drying of solids•Roasting of food•Classify particles
http://www.chemsoc.org/timeline/pages/1961.html
http://physicsweb.org/article/world/11/1/9
www.unb.ca/che/che5134/ fluidization.html
http://www.niroinc.com/html/drying/fdfluidtype.html
http://www.dynamotive.com/biooil/technology.html
Pharmaceutical
•Coating of pills•Granulation•Production of plant and animal cells
Gas-Solid Fluidized Bed

Characteristics of Gas Fluidized Beds
• Primary Characteristics:– Bed behaves like liquid of the same bulk density – can add or
remove particles. – Rapid particle motion – good solids mixing.– Very large surface area availableWhat is the surface area of 1 m3 of 100 μm particles?
1 m3 of 100 μm particles has a surface area of about 30,000 m2.
• Secondary Characteristics:– Good heat transfer from surface to bed, and gas to particles– Isothermal conditions radially and axially.– Pressure drop depends only on bed depth and particle density –
does not increase with gas velocity– Particle motion usually streamlines erosion and attrition
(Dis)advantages of fluid beds
Advantages
• good G-S mass transfer in dense phase
• good heat transfer• easy solids handling• low pressure drop
Disadvantages
bypass of gas in bubblesbroad RTD gas and solidserosion of internalsattrition of solidsdifficult scale-up

Basic Components
Yang W. Bubbling fluidized beds (Chapter 3). In: Handbook of Fluidization and Fluid-Particle Systems. Yang W (Ed.). Marcel Dekker, Inc., NY, NY, USA, 53–113 (2003).
1.56 m Diameter Column

Industrial Scale
Solid offtakeA Fluid Catalytic Cracking Unit. Photo courtesy of Grace Davison.
Approaches to the Study of Particulate Systems
• Totally empirical (leading to dimensional correlations)
• Empirical guided by scientific principles (e.g. Buckingham Pi Theorem to obtain dimensionally consistent correlations)
• Semi-empirical, i.e. some mechanistic basis, but with one or more empirical constants
• Mechanistic physical model without any empiricism, numerical solutions of governing equations of motion and transport

Geldart’s powder classification
hardly used
cat. reactions
drying/PE production
combustion/gasification
Geldart’s powder classification
CCCohesive
0-30 μm
flour
AAAeratable
30-100 μm
milk powder
BBBubbling
100-1000 μm
sand
DDSpoutable
>1000 μm
coffee beans
Drag
Gravity
Attraction

Group C•Cohesive•Difficult to fluidized, and channeling occurs•Interparticle forces greatly affect the fluidization behaviour of these powders•Mechanical powder compaction, prior to fluidization, greatly affected the fluidization behaviour of the powder, even after the powder had been fully fluidized for a while•Saturating the fluidization air with humidity reduced the formation of agglomerates and greatly improved the fluidization quality. The water molecules adsorbed on the particle surface presumably reduced the van der Waals forces.•dp ~ 0-30 μm•Example: flour, cement
Group A•Aeratable•Characterized by a small dp and small ρp•Umb is significantly larger than Umf•Large bed expansion before bubbling starts•Gross circulation of powder even if only a few bubbles are present•Large gas backmixing in the emulsion phase•Rate at which gas is exchanged between the bubbles and the emulsion is high•Bubble size reduced by either using a wider particle size distribution or reducing the average particle diameter•There is a maximum bubble size•dp ~ 30-100 μm•Examples: FCC, milk flour

Group B•Bubbling•Umb and Umf are almost identical•Solids recirculation rates are smaller•Less gas backmixing in the emulsion phase•Rate at which gas is exchanged between bubbles and emulsion is smaller•Bubbles size is almost independent of the mean particle diameter and the width of the particle size distribution•No observable maximum bubble size•dp ~ 100-1000 μm•Example: sand
Group D
•Spoutable•Either very large or very dense particles•Bubbles coalesce rapidly and flow to large size•Bubbles rise more slowly than the rest of the gas percolating through the emulsion•Dense phase has a low voidage•dp ~ >1000 mm•Examples: Coffee beans, wheat, lead shot

Influence of particle size distribution
wide size distribution
narrow size distribution
0 4 8Dimensionless kinetic rate constant [-]
1.0
0.5
0.0
Con
vers
ion
[-]
0 50 100 150particle diameter [micron]
20
15
10
5
0
20
15
10
5
0
mas
s%m
ass%
Adapted from Sun & Grace (1990)
Implication of Umb/Umf
• Umb/Umf could be used as an important index for the fluidization performance of fine particle fluidized beds on local hydrodynamics
• Geldart particle classification:– Group A powders
with Umb/Umf>1– Group B powders
with Umb/Umf=1

Demarcation
1UU
mf
mb ≥
Demarcation between Group A and B powders
pmb dKU =
For air at room T and P, K = 100 (Yang, W.-C., 2003)( )
1K
dg108 pp4
≤μ
ρ−ρ× −
Demarcation between Group B and D powders
For Group D powdersmf
mfB
UU
ε≤
Pressure and temperature effect: (Grace, 1986)
( )425.0
p
AB*p 101d
−
⎟⎟⎠
⎞⎜⎜⎝
⎛ρρ−ρ
=If : powder belongs to Group A or CIf : powder belongs to Group B or D
( ) ( )AB
*p
*p dd <
( ) ( )AB
*p
*p dd >
Demarcation
1UU
mf
mb ≥
Demarcation between Group A and B powders
Demarcation between Group B and D powders
For Group D powdersmf
mfB
UU
ε≤
Demarcation between Group C and A powders (Molerus, 1982)
310( ) / 0.01p f p Hd g Fρ ρ− =
FH is the adhesion force determined experimentally.(FH=8.76x10⁻⁸ N for glass beads and FCC catalysts)
10 100 1000100
1000
10000
C(cohesive)
A(aeratable)
D(spoutable)B
(bubble readily)
ρ s-ρf ,
(kg
/m3)
Mean particle diameter, dp (μm)

Characteristics of single bubble: Slow vs. fast bubbles(Davidson model)
fast bubbleslow bubble
group A & Bgroup D
Simple demarcation criteria accounting for T, P effects
Goosen’s classification:• C/A boundary: Ar=9.8• A/B boundary:
Ar=88.5• B/D boundary:
Ar=176,900
Grace’s classification:
• A/B boundary: Ar=125• B/D boundary:
Ar=145,000
( )2
3
μρρρ pgpg dg
Ar−
=

Correlations for Umb
• Abrahamsen and Geldart(1980)
Where F45 is the fraction of solids which are less than 45μm.
( )( ) 9340934080
4552301260 71602300
.gp
..p
.g
.g
mf
mb
gd
F.exp
U
U
ρρμρ
−=
Flow Regimes
gas gas gas
solids returns
solids returns
solids returns
gasgasgas
only A powdersat low gas velocity
only narrow beds
gas
fixed bed
homogeneous
bubbling
slugging
turbulent fastfluidization
pneumatictransport
gas velocity

Flow RegimesU range Regime Appearance and Principal Features
Fixed Bed Particles are quiescent; gas flows through interstices
Particulate regime
Bed expands smoothly in a homogeneous manner; top surface well defined, small-scale particle motion
Bubbling regime
Gas voids form near distributor, coalesce and grow; rise to surface and break through
Slug flow regime
Bubble size approaches column cross-section. Top surface rises and collapses with regular frequency.
Turbulent fluidization flow regime
Pressure fluctuations gradually decrease until turbulent fluidization flow regime is reached.
(Turbulent Regime)
Small gas voids and particle clusters dart to and fro. Top surface is difficult to distinguish.
Fast Fluidization
No upper surface to bed, particles transported out the top in clusters and must be replaced.
Pneumatic conveying
No bed. All particles fed in are transported out the top as a lean phase.
mfUU0 <≤
mbmf UUU <≤
msmb UUU <≤
cms UUU <≤
kc UUU <≤
trk UUU <≤
trUU ≥
trUU >>
Regime Transition Flow Chart
Fixed Bed
Bubble freefluidization
Bubblingfluidization
Sluggingfluidization
Turbulentfluidization
Umf Ums Uc
Use
DB,max<0.66DUmb
Fixed BedDense-phase
transport
Bubble-freeDense
transport
Bubblytransport
Slug flowtransport
TurbulentFlow
transportVmf Vms Vc VCA
DB,max<0.66DVmb
Bi & Grace, 1995
Core-annularDilute-phase
flow
HomogeneousDilute-phase
flow
Vmp
Increasing gas velocity
Gs = constant

Unifying Fluidization Regime Diagram
Fluidized bed lay-out
twin bed
bubblingbed
riser
turbulentbed
circulatingbed
downer
laterally staged bed
verticallystaged bed
spouted bed
floating bed

Static Head of Solids
DP
LWhen acceleration, friction and gas head are negligible
areasectionalcrossbedparticlesonupthrustparticlesofweight
P−−
=Δ
( )( )g1LP
p ρ−ρε−=Δ
Time-averaged pressure measurements•Most industrial and pilot plant fluidized beds have pressure taps.•There should be at least 2 or 3 taps within the fluidized bed.•Pressure measurement from plenum chamber must be from where it will not be affected by either the gas expansion or the contraction•For hot units, back flushed taps are often used.
(gas flowrate must be regulated)
For other measurement techniques in fluidized beds:van Ommen & Mudde, Int J Chem Reactor Eng 6 (2008) R3
Fluidization Curve
U, m/s
ΔP/
L
Umf Umb
FluidizedNon-bubblingregion
Packedbed
FluidizedBubblingRegion
U, m/s
ΔP/
L
Umf Ucf
Packedbed
Fluidized BubblingRegion
Group A particles Group B particles
Wide psd
narrow psd

Minimum Fluidization
The frictional pressure drop at the point of minimum fluidization equalizes the bed mass per unit of cross-sectional area.
( ) ( )
( )( )mfpmf
3mfsv
mfmf2mf
3mf
2sv
mf2
mfmffriction
1xg
D
x1U75.1
D
x1U150P
ε−ρ−ρΔ=ε
Δε−ρ+
εΔε−μ
=Δ−
The frictional pressure drop at the point of minimum fluidization (Umf , εmf , Δxmf), can be considered equal to the frictional pressure drop in a fixed bed (Ergun)
Minimum Fluidization Velocity (Umf)
Dimensionless relationship following from equation on previous slide
122
1Re CArCCmf −+=
μρ svmfmf DURe = ( ) 23 μρρρ svp DgAr −=
( ) 713001 mfC ε−= 75.132 mfC ε=

Minimum Fluidization
Estimation of εmf 0.4 < εmf < 0.55
• εmf ≈ εfixed bed
• εmf ≈ (14 φ)-1/3 where φ is the particle sphericity
Authors C1 C2
Wen and Yu (1966)
Richardson (1971)
Saxena and Vogel (1977)
Babu et al. (1978)
Grace (1982)
Chitester et al. (1984)
33.7
25.7
25.28
25.25
27.2
28.7
0.0408
0.0365
0.0571
0.0651
0.0408
0.0494
Freely Bubbling Beds: Bubble GrowthWhy grow?1) The hydrostatic pressure on the bubbles decreases
as they rise up the bed;2) Bubbles may coalesce by one bubble catching up
with another;3) Bubbles which are side by side may coalesce;4) Bubbles may grow by depleting the continuous phase
locally.
Mean bubble size = f(type of distributor, distance above the distributor plate, excess gas velocity) Initial bubble size
effect of wall

Freely Bubbling Beds: Bubble Size
Darton et al. (1977) ( )0.8
0.40.2( ) 0.54 4b mfor
AD z g U U z
N− ⎛ ⎞
= − +⎜ ⎟⎝ ⎠
where A/Nor is the area of distributor plate per orifice
Mori & Wen (1975)
( ) 0.41.64be mfD A U U⎡ ⎤= −⎣ ⎦
0
exp 0.3be b
be b T
D D z
D D D
⎛ ⎞−= −⎜ ⎟− ⎝ ⎠
where: ( )
( )
0.4
0 0.2
2
0
1.38
0.376
b mfor
b mf
AD U U
g N
D U U
⎡ ⎤= −⎢ ⎥
⎣ ⎦
= −
for perforated plates
for porous plates
Ranges of key variables:
m3.1D
s/m48.0UU
m450d60
s/mm200U5
T
mf
p
mf
≤
≤−
≤≤
≤≤
μ
Q=UA
QBQmf
UB
H
Two-phase theory

Two-phase theory
Total gas flow rate: Flow rate in dense phase:Gas passing through the bed as bubbles:Fraction of the bed occupied by bubbles:
UAQ =AUQ mfmf = ( )AUUQQ mfmf −=−
mf mf mfb
B
H H Q Q U U
H AU Uδ
− − −= = =
B
In practice, the two-phase theory overestimates the volume of gas passing through the bed as bubbles
Visible bubble flow rate:where 0.8 < Y< 1.0 for Group A powderswhere 0.6 < Y< 0.8 for Group B powderswhere 0.25 < Y< 0.6 for Group D powders
( )mfB UUY
AQ
−=
The distribution of the gas between the bubbles and dense phase is of interest because it influences the degree of chemical conversion.
21.027.2 −= ArY
Baeyens and Geldart (1985)
Homogeneous fluidization
Non-bubbling fluidizationParticulate or homogeneous fluidization
Bubbling fluidizationAggregative or heterogeneous fluidization
Mechanism???Delay caused in the adjustment of the mean particle velocity to a change in the local concentration resulting from the larger particle to fluid phase inertia(Didwania, 2001)

Steady-state expansion of fluidized beds
A)1(LV BB ε−=
( ) constantgVP BgpB =ρ−ρ=Δ
Homogeneous bed expansion: Richardson-Zaki relationn
tUU
ε=
HA)1(M:bedtheinpaticlesofmass
pρε−=B
VB: total volume of particles
Log U/Ut
Log ε0.4 1.0
1.0
Viscous regime: n=4.8
Inertial regime: n=2.4
12
12 H
)1()1(
Hε−ε−
=
Heat and mass transfer
Bubble:shortcutof gas
Interstitial gas:effective
Heat transfer: particle to wall or internalMass transfer: gas to particle
Fluidized beds show an excellent heat transfer
Mixing of solids by (large) bubbles almost constant temperature throughout the reactor
However, large bubbles decrease the mass transfer
Research decrease bubble size

Ways to structure a fluidized bed
Particles
Gas
GeometryDynamics
live electrodes
groundelectrodes
Qp
Qs
van Ommen et al., Ind. Eng. Chem. Res., 46 (2007) 4236
0.00
0.05
0.10
0.15
0 50 100 150 200
Particle diameter [μm]
Fra
ctio
n [
-]
Tailoring the particle size distribution
0.00
0.05
0.10
0.15
0 50 100 150 200
Particle diameter [μm]
Fra
ctio
n [
-]
0 % Fines
15 % Fines
30 % Fines
0-30%
50 μm
wide size distribution
narrow size distribution
0 4 8Dimensionless kinetic rate constant [-]
1.0
0.5
0.0
Co
nve
rsio
n [
-]
0 50 100 150particle diameter [micron]
20
15
10
5
0
20
15
10
5
0
mas
s%m
ass% narrow size distribution
O3 decomposition

air
PC
pressuredrop
sensors
pressurefluctuationsensors
Measurement techniques:
• pressure drop• pressure fluctuations• optical probes
High Throughput Experimentation
Fines effect on bubble size
0.4
0.6
0.8
1.0
0.00 0.05 0.10 0.15 0.20 0.25 0.30Fines weight fraction [-]
Re
lati
ve
bu
bb
le s
ize
[-]
6 cm/s
24 cm/sBased on pressure fluctuations
Fines are added to a powder with a D50 of 70 μm
Beetstra et al., AIChE J. 55 (2009) 2013
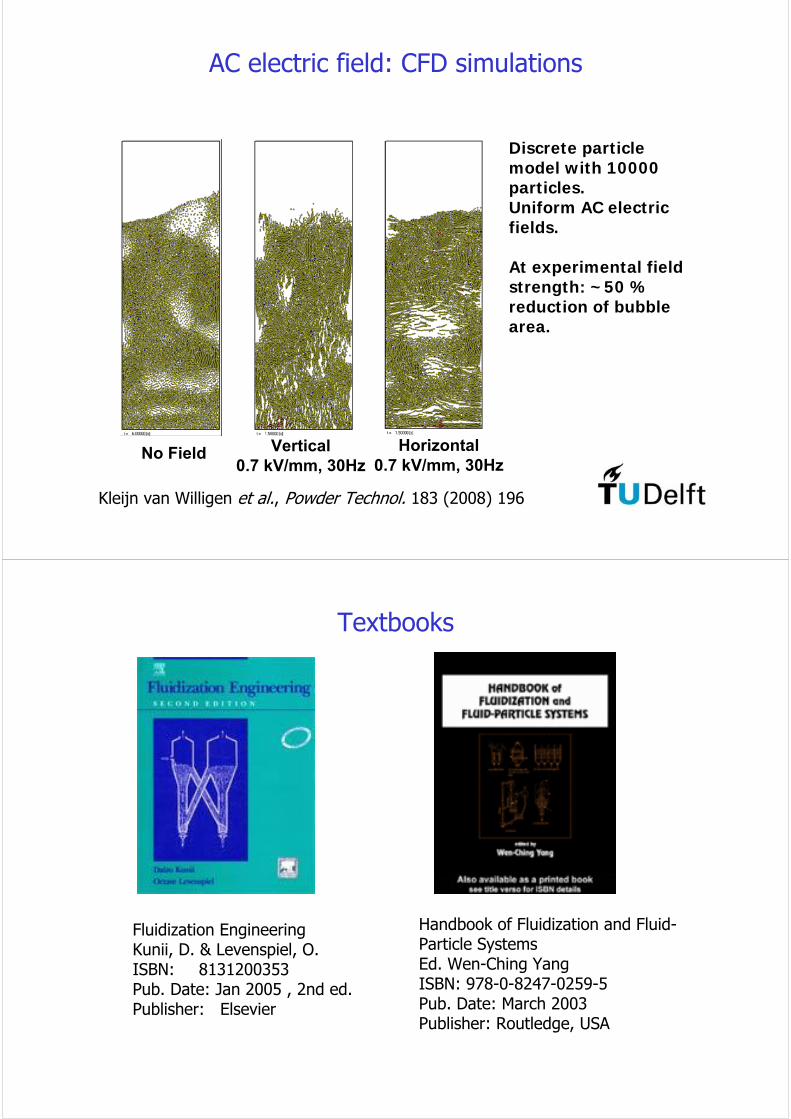
AC electric field: CFD simulations
No Field Vertical0.7 kV/mm, 30Hz
Horizontal0.7 kV/mm, 30Hz
Discrete particle model with 10000 particles. Uniform AC electric fields.
At experimental field strength: ~50 % reduction of bubble area.
Kleijn van Willigen et al., Powder Technol. 183 (2008) 196
Textbooks
Fluidization EngineeringKunii, D. & Levenspiel, O.ISBN: 8131200353Pub. Date: Jan 2005 , 2nd ed.Publisher: Elsevier
Handbook of Fluidization and Fluid-Particle SystemsEd. Wen-Ching YangISBN: 978-0-8247-0259-5 Pub. Date: March 2003 Publisher: Routledge, USA

Course Material• Additional Resource Material
http://www.erpt.org/http://www.erc.ufl.edu/http://www.chml.ubc.ca/fluidization/Rhodes, M., Introduction to Particle Technology, Wiley, Sussex England, ISBN: 0471984833, 1999.Yang, W.-C., Marcel Dekker, Handbook of Fluidization and Fluid-particle Systems, New York ISBN: 082470259, 2003.Fan, L.-S., Gas-Liquid-Solid Fluidization Engineering, Butterworth-Heinemann, Boston, 1989.Perry, R.H. and D.W. Green, Perrry’s Chemical Engineers’ Handbook, 7th Ed., McGraw-Hill, New York, 1997.Fan, L.S and C. Zhu, "Principles of gas-solid flows", Cambridge Press, Cambridge, 1998.Grace, J.R., A. Avidan and T.M. Knowlton, "Circulating Fluidized Beds," Blackie Academic press, Boston, 1997.Kunii, D. and O. Levenspiel, "Fluidization Engineering", 2nd edition, Butterworth-Heinemann, Boston, 1991.Geldart, D., "Gas Fluidization Technology", John Wiley & Sons, New York, 1986.
References• Rhodes, M., and Zakhari, A., “Laboratory Demonstrations in Particle
Technology”, CD, Monash University, Melbourne, Australia (1999).• Geldart, D., “Types of Gas Fluidization”, Powder Tech., 7, 285-292 (1973).• Yang, W.-C., “Bubbling Fluidized Beds”, in Handbook of Fluidization and Fluid-
Particle Systems, Ed. Yang, W.-C., Marcel Dekker, N.Y., pp. 53-111 (2003).• Ellis, N., “Hydrodynamics of Gas-Solid Turbulent Fluidized Beds”, Ph.D.
Dissertation, UBC (2003).• Bi, H.T., and Grace, J.R., “Flow Regime Diagrams for Gas-Solid Fluidization
and Upward Transport”, Int. J. Multiphase Flow, 21, 1229-1236 (1995).• Grace, J.R., “Contacting Modes and Behaviour Classification of Gas-Solid and
Other Two-Phase Suspensions”, Can. J. Chem. Eng., 64, 353-363 (1986). • Gidaspow, D., “Multiphase Flow and Fluidization: Continuum and Kinetic
Theory Descriptions”, Academic Press, San Diego (1994).• Kunii, D., and Levenspiel, O., “Fluidization Engineering”, Butterworth-
Heinemann, Newton, MA (1991).

References• Bird, R.B., Stewart, W.E., and Lightfoot, E.N., “Transport Phenomena”, John
Wiley & Sons, N.Y., Chapter 6: Interphase Transport in isothermal Systems (2002).
• Wen, C.Y., and Yu, Y.H., “Mechanics of Fluidization”, Chem. Eng. Prog. Symp. Series, 62, 100 - 111 (1966).
• Gidapsow, D., and Ettehadieh, B., “Fluidization in Two-Dimensional Beds with a Jet, Part II: Hydrodynamics Modeling”, I&EC Fundamentals, 22, 193-201 (1983).
• Didwania, A.K., “A New Instability Mode in Fluidized Beds”, EurophysicsLetters, 53, 478-482 (2001).
• DallaValle, J.M., “Micromeritics, the technology of fine particles”, Pitman Pub., N.Y. (1948).
• McCabe W.L., Smith, J.C., and Harriot P., “Unit operations of Chemical Engineering”, McGraw-Hill, New York (1993)
• Rhodes, M., “Introduction to Particle Technology”, Wiley, Chichester (1998)• Grace, J.R., “Fluidized-Bed Hydrodynamics”, in Handbook of Multiphase
Systems, Ed. Hetsroni, G., Hemisphere, Washington, pp., 8:5-64 (1982).