vane vd'¶(old y gustavo ferro
TRANSCRIPT

UNIVERSIDAD DEL CEMA
Buenos Aires
Argentina
Serie
DOCUMENTOS DE TRABAJO
Área: Economía
EMPIRICAL EFFICIENCY MEASUREMENT
IN HIGHER EDUCATION: AN OVERVIEW
Vanesa D’Elia y Gustavo Ferro
Diciembre 2019
Nro. 708
https://ucema.edu.ar/publicaciones/doc_trabajo.php
UCEMA: Av. Córdoba 374, C1054AAP Buenos Aires, Argentina
ISSN 1668-4575 (impreso), ISSN 1668-4583 (en línea)
Editor: Jorge M. Streb; asistente editorial: Valeria Dowding <[email protected]>


1
Empirical Efficiency Measurement in Higher Education: An Overview
Vanesa D’Elia1 and Gustavo Ferro2
Abstract This paper reviews the most recent empirical literature that assesses efficiency in higher education. We analyze 76 studies ranging from 1997 to 2018 and classify them according to the methodologies applied and to the definitions used to describe the outputs, inputs, quality and the context variables. We find that 72 percent of the empirical studies use non-parametric approaches. The most recent studies use panel data. The degrees completed are the most frequently used output variable, and only 9 papers include quality variables. Moreover, while only few parametric papers take observed heterogeneity into account, more than 40 percent include environmental variables to address for observed heterogeneity. This review is useful for researchers interested in measuring efficiency, for policy makers and for other educational stakeholders.
Keywords: Higher Education Efficiency; Efficiency Frontier Methods; Stochastic Frontier Analysis; Data Envelopment Analysis JEL Codes: I23, C13 C14 Highlights:
Most recent empirical literature on higher education efficiency is reviewed and analyzed
The paper focuses in methods and variables employed in empirical work
Most recent investigation use panel data (while initial studies were mainly cross sectional), some extension of DEA and SFA considering heterogeneity
1 Universidad del CEMA (UCEMA). [email protected]
2 Universidad del CEMA (UCEMA) and CONICET. Córdoba 374, (1054) Buenos Aires, Argentina. Telephone: +54-
11-63143000, extension 780, e-mail: [email protected] and [email protected]. Corresponding Author. The points of view of the authors do not necessarily represent the position of UCEMA.

2
Empirical Efficiency Measurement in Higher Education: An Overview
1. Introduction
In the whole world, and with different intensities, universities face resource constrains due to the explosion in enrollment rates, and are being forced to consider raising revenues and increasing productivity. The latter is a long-term response which demands knowledge of the outcome process and efficiency measurement (Gates and Stone, 1997).
According to Avkiran (2001), universities´ key characteristics are “the lack of profit motive, goal diversity and uncertain, diffuse decision making, and poorly understood production technology”. Productivity improvement is thence a poorly understood concept in the higher education context, and an issue frequently viewed with hostility by insiders. It is often associated with quality-insensitive cost cutting and focus in increasing administrative efficiency (Gates and Stone, 1997), or attempts to improve indicators with less demands on students. Information technology (e-learning) is another possibility for improving productivity, however with undetermined results to date.
Productivity is a measure of output(s) per unit of input(s). In the higher education context, productivity can be thought of as how much outcomes individuals and society are getting from the sector, given the resources they put in it. Some features of the sector -shared with other service industries- are: difficult productivity measurement, including the identification of the output unit, determining the added value for each input, isolating the consumer own contribution to the outcome (for example, personal effort devoted to study), and accounting for quality respects. The standard practice in defining output is to focus only on those that are used outside the organization under consideration (Salerno, 2003).
The absence of profit motivation, combined with the diversity of goals pursued, makes the measurement of efficiency in higher education particularly problematic (Johnes, 2006a). The major problems found in educational efficiency studies are: obtaining data to specify adequate input measures, defining the outputs clearly, and communicating the results (Worthington, 2001). Some characteristics of universities complicate the efficiency assessment. They have multiple objectives and outcomes, some of them with externalities or public good characteristics. There are often conflicting opinions regarding the goals and their relative importance. Many inputs cannot be unambiguously measured or quantified. Still, other educational outcomes such as socialization or citizenship values’ building, “defy parametrization” (Worthington, 2001).
Productivity measures are rank-free indicators of the rate at which inputs are translated into outputs. Efficiency can be seen as an index to rank the different productivity values. Technical efficiency is defined as the ability to minimize input use for a given output. Unlike cost efficiency, it does not involve the imposition of behavioral assumptions such as cost minimization (Horne and Hu, 2008). Allocative or cost efficiency measures the extent to which inefficiency occurs because a university is using suboptimal combination of inputs given their cost. Economic or overall efficiency, jointly considers technical and allocative efficiencies. If the university is allocative and technically efficient, it is overall efficient. Which independent variables are considered depends on what type of efficiency is being assessed: technical efficiency estimates routinely employ physical input units while cost efficiency normally uses expenditure-based units of input prices and physical units of output (Salerno, 2003).
In the university activities, the quality of the outcomes is closely related with the quantity and intensity of human effort devoted to that task. The difficulty of implementing labor-saving technical changes (shared with many other services’ industries) condemns the costs of those effort-

3
intensive services to keep rising year after year, in comparison with goods’ sectors whose growing automation declines unit costs. The most recent source of change in production activity in the universities is the increased use of information technology and e-learning. In teaching, these may allow class sizes to increase, but an increasing ratio of students to staff may have an adverse effect on technical efficiency (Johnes, 2007).
As Wolff et al. (2014) state, the productivity cannot be enhanced -while maintaining quality-, by putting students on an assembly line or substituting robots for teachers, or making class sizes larger and larger. It is not clear if technology-based approaches -such as e-learning- will yield educational results that match those of current educational methods.
This study seeks to describe and summarize the most relevant empirical literature that assesses efficiency in higher education. This review attempts to be context-setting and a useful background for researchers, scholars who are outlining an empirical study and for policy makers seeking informed criteria for decisions. In doing so, we analyze 76 specific studies ranging from 1997 to 2018 which assess higher education efficiency and classify them according to the methodologies applied and to the definitions used to describe the outputs, inputs, quality and the context variables. One previous study on this issue is the work of De Witte and López-Torres (2017) who provide a survey of the literature on efficiency in education in general. In this paper we focus on higher education efficiency.
The rest of the paper is organized as follows. Section 2 summarizes the different methodological options applied in the studies reviewed, Section 3 analyzes the production/cost drivers used to empirically compute efficiency. Finally, Section 4 summarizes the major contributions of the analyzed literature, evaluating the current stage of the field.
2. Frontier Methods
There are two families of techniques for measuring efficiency: parametric or regression based, and non-parametric or mathematical programming estimators. The mathematical programming methods are generally deterministic (not distinguishing between pure randomness and efficiency) and non-parametric (not assuming a functional form between the variables). They model the productive process, but they do not estimate a function nor its parameters, in the sense of economic theory. The most common non-parametric technique is Data Envelopment Analysis (DEA). This method characterizes the set of efficient producers (those on the frontier), and then derives estimates of efficiency for inefficient observations based on how far they deviate from the most efficient ones. They are Total Factor Productivity measures which require finding some way to fairly assign weights, or importance, to the various inputs and outputs included. The DEA method seeks to determine which universities form an envelope surface with respect to the sample data. The units on the frontier are considered efficient, while those below the envelope are considered inefficient.
The measurement of inefficiency is given by the distance between the individual university and the frontier. In DEA there is no need to draw assumptions about efficiency a priori or even to objective functions of the units under analysis (Salerno, 2003). Being a very sensitive method to outliers, DEA gives warnings to detect unusual data in the sample, sometimes neglected in the econometric work, especially in large samples.
For the introduction of environmental variables, there are several methods derived from the DEA technical efficiency ranks such as two stages DEA and bootstrapping methods. Moreover, the Malmquist index allows to expand the findings obtained from DEA, and to reveal changes in efficiency scores and technical change over time (De Witte and López-Torres, 2017).

4
Concerning the econometric approach, it assumes a specific functional form for the relationships (production or costs frontiers) it studies. To calculate efficiency, the actual amount of production of each unit is divided by the maximum production (or the actual cost of each unit over the minimum cost) attained at the frontier. One of the most used parametric techniques is stochastic frontier analysis (SFA), proposed by Aigner et al. (1977) and Meeusen and van den Broeck (1977). The original specification involved a production function specified for cross-sectional data. The most recent studies use panel data.
SFA approach allows to include environmental factors as dummies or ratios and the estimates (unlike in DEA approach) can be subject to statistical tests of significance (Laureti et al., 2014). In the SFA, the traditional random error term is divided into two components: a normally distributed random error term of pure randomness (with zero mean and positive variance) and an error term that captures inefficiency (strictly positive in the case of production, or strictly negative in the case of costs, with different possible statistical distributions).
In the primal (production) form of the SFA, the output is specified as a function of inputs, while in the dual (cost) form of the frontier, costs are specified as a function of output(s) and input prices. It is difficult to incorporate multiple outputs in the production form (being this one of the relative strengths of DEA models), though it is possible within the dual function (cost frontier).
The choice of the adequate functional form is a disadvantage of the regression method, as well as the need for a criterion for separating stochastic from deterministic components (there are several possible decompositions of the error term in the literature, following different statistical distributions).
In the case of stochastic frontier estimates, technical inefficiency can vary systematically across time (“time varying decay” or TVD model, originally proposed by Battese and Coelli, 1988), or it can be constant across time (“time invariant” or TI model, proposed by Battese and Coelli, 1992). Other time-varying inefficiency models include the Cornwell et al. (1990) and Lee and Schmidt (1993) models, the flexible model of Kumbhakar (1990) and the time decay and the inefficiency effects model of Battese and Coelli (1995). Regarding other time-invariant inefficiency models the random effects model of Pitt and Lee (1981) can be mentioned and the fixed effect version of the Schmidt and Sickles (1984) model.
As far as panel data analysis is concerned, the common feature of all these models is that the intercept is the same across productive units. This characteristic generates a misspecification bias in presence of time-invariant unobservable factors, unrelated with the production process but affecting the output. As a result, the effect of those factors may be captured by the inefficiency term, producing biased results. To deal with this issue, Greene (2005a) proposed two models, the “true fixed effects" or TFE and the “true random effects” or TRE, with unit-specific intercepts to disentangle time-varying inefficiency from unit specific time invariant unobserved heterogeneity. This heterogeneity is related with unobserved environmental factors that are constant for each unit.
Another important issue in SFA is the inclusion in the model of exogenous variables which are supposed to affect the distribution of inefficiency (observed heterogeneity). The most common approach is to parameterize the mean (or the mode) of the pre-truncated inefficiency distribution (Greene, 2008). An alternative approach to analyzing the effect of exogenous variables on inefficiency is to rescale its distribution allowing observable variation in the variance of the inefficiency term (Caudill and Ford, 1993, Caudill et al., 1995, and Hadri, 1999).
Choosing a functional form for the production function is not straightforward in higher education, as there is no rule upon which to base the decision. The Cobb-Douglas production function is appealing, because it involves the estimation of relatively few parameters thus allowing an easy interpretation of the results. The flexible Trans-Logarithmic functional form may be preferred to the Cobb-Douglas form due to the restrictive elasticity of substitution and the scale properties of the

5
latter. However, the quadratic and interaction terms in the Trans-Logarithmic are difficult to interpret (Laureti et al., 2014).
Table 1 summarizes the main methodological choices applied to the analyzed papers. As can be seen, the majority of the articles use non-parametric models (72 percent), and production frontier estimation predominates in the former. Besides, the use of panel data is more frequent in SFA models, while there is no difference between cross-sectional and panel data in DEA models. In DEA models different extensions can be found, such as two stages DEA, bootstrapping, Malmquist and distance function analysis. Heterogeneity aspects in SFA studies started to be considered in the most recent studies.
Several countries are analyzed in the studies reviewed. The United Kingdom (UK) and Italy are nations that appear more frequently in our search. There are also papers for other European countries (Germany, Spain, Greece, Sweden and Poland), for the United States of America (US), Australia, China, Taiwan, Malaysia, India, and for some Latin American countries (Mexico, Brazil, Colombia and Argentina). Besides, 9 percent of the empirical researches are multi-country. We also find 3 surveys, and a set of methodological and conceptual studies which shed light on the phenomena under study. With respect to the level of analysis, most of the articles study the university system (predominantly but not exclusively teaching activities) and there are 4 papers that analyze the departments of a specific university.
Table 1: Summary of the methods applied for estimating efficiency in the empirical work analyzed Approach Method Frontier Database Authors
Non-Parametric DEA (* Two Stages DEA)
Production Cross-Sectional
Altamirano-Corro and Peniche-Vega (2014), Mexico,(Departments) Aziz et al. (2013), Malaysia (Departments) Agasisti et al. (2012), Italy Kuah and Wong (2011), Malaysia Costa et al. (2011), Brazil Agasisti and Pérez-Esparrells (2010), Italy and Spain Hatharaki and Katharakis (2010), Greece Tyagi et al. (2009), India (Departments) Johnes (2006a), UK Johnes (2006b), UK Abbott and Doucouliagos (2003), Australia Avkiran (2001), Australia Marinho et al. (1997), Brazil
Production Panel Berbegal-Mirabent (2018) *, Spain Quiroga-Martínez (2018) *, Argentina Cantele et al. (2016) *, Italy Agasisti and Wolszczak-Derlacz (2017), US and European Countries Guccio et al. (2016), Italy Andersson et al. (2016), Sweden Barra and Zotti (2016b), Italy Agasisti and Bonomi (2016), Italy Agasisti and Wolszczak-Derlacz (2015) *, Poland Agasisti (2014) *, European Countries Berbegal-Mirabent et al. (2013), Spain Selim and Bursalioglu (2013), Turkey Agasisti et al. (2012) Agasisti and Johnes (2009), UK and Italy Johnes and Yu (2008), China Flegg and allen (2007), UK Kao and Hung (2006), Taiwan (Departments) Jones and Johnes (1993), UK
Cost Cross- Johnes and Tone (2016), UK

6
Sectional Alberto et al. (2010), Argentina
Cost Panel Johnes and Johnes (2009), UK
Malmquist Production Panel Meza-Ávila (2017), Colombia Wolszczak-Derlacz (2016). US + European Countries Silvestre-Ramírez, et al. (2015), Mexico Worthington and Lee (2008), Australia Johnes (2007), UK Flegg et al. (2004), UK
Distance Function
Production Panel Barra and Zotti (2016a), Italy Daraio et al. (2015), European Countries
Parametric SFA (# addressing unobserved heterogeneity)
Production Cross-Sectional
Agasisti and Johnes (2010), Italy
Production Panel D’Elia and Ferro (2018) #, Argentina Ibánez-Martín et al. (2017), Argentina (Departments) Agasisti et al. (2016) #, Italy Laureti et al. (2014), Italy Zoghbi et al. (2013), Brazil Sav (2012), US
Cost Cross-Sectional
Izadi et al. (2002), UK
Cost Panel Agasisti and Johnes (2013), US Johnes and Schwarzenberger (2010), Germany Johnes and Johnes (2009), UK Kuo and Ho (2008), Taiwan Horne and Ho (2008), Australia Johnes et al. (2008), UK
Both, Parametric and Non-Parametric
DEA and SFA Panel Barra et al. (2017), Italy Kempkes and Pohl (2010), Germany
Methodological and Conceptual Discussion
Ferreyra et al. (2017) Agasisti (2017) De Witte and López Torres (2017) (Survey) Millot (2015) Wolff et al. (2014) De Fraja and Valbonesi (2012) Johnes (2004) (Survey) Mensah and Werner (2003) Salerno (2003) Worthington (2001) (Survey) Gates and Stone (1997)
Source: Own elaboration.
Regarding other methodological methods, Barra and Zotti (2016a) and Daraio et al. (2015) employ distance functions, and 10 percent of the empirical studies apply Malmquist productivity indexes. The rationale behind distance functions is that given a frontier of possibilities of production between two different outputs, the same is attainable with different combinations of inputs. Given a directional vector for the inputs (implying for example a capital/labor ratio) and another directional vector for the outputs (for instance one combination of teaching/research activities) the directional distance among productive units to the frontier of production possibilities can be estimated as a measure of inefficiency, in an additive way and along the path defined for the directional vector of inputs (Daraio et al., 2015). Besides, when efficiency is studied in different periods, the change in productivity of each unit can be understood as catching up to the frontier, but the latter can also be shifting up. Then the Malmquist index decomposes both effects, isolating pure changes in productivity from frontier shift (Worthington and Lee, 2008).
7
3. Conceptual framework: Output and inputs definitions
3.1 Outputs
The outcomes (outputs) produced in a university can be split in teaching (knowledge dissemination), research (knowledge production; basic and/or applied, where basic research implies learning the principles which explain phenomena, without developing an immediate application), and extension / transfer / public or “third mission” services (in the form of externalities and public goods directed to varied audiences beyond campuses) (Cohn and Cooper, 2004, Johnes and Johnes, 2009).
In general, choices for empirical work are conditioned by data availability and by the possibility of measuring the phenomena under study. Most analysis omit extension activities for the difficulty in meaningfully quantifying its outcomes. In general, externalities are difficult to measure, thus also some teaching or research outcomes -which share externalities’ features- cannot be properly measured (as learning by interaction in peer groups by the students, or discoveries not subject to intellectual property rights). Nearly all efficiency studies of higher education institutions focus only on teaching, research of both products of universities, leaving aside extension services (Salerno, 2003).
The so called “Humboldt model of universities” is characterized by the coexistence of teaching and research, on the one hand, and of many disciplines within the same institutional umbrella, on the other hand (Daraio et al., 2015). The coexistence of activities and disciplines can be explained by economies of scope, due to the presence of non-specialized and indivisible inputs, and thence susceptible of being shared. In turn, different production technologies exist among academic disciplines, with varying degrees of labor/capital intensity, but administrative and supporting expenses can be shared.
Thus, connected activities are produced with the same inputs: human and non-human resources. There are also complex interactions of substitution and complementarity between teaching and research, because once recognizing the potential synergies, both teaching and research are time consuming and the short term and long term rewards are different between them (Kuo and Ho, 2008). If research activities are not included, implicitly, it is assumed that no scope exists for economies between teaching and research activities (Horne and Ho, 2008).
Teaching is a complex process whose technology is not well understood. It is subject to economies of scale since expanding the number of students attending to a lecture increases the output while keeping the input constant (teacher effort). Teaching also requires one-to-one interaction with students, such as examinations and tutoring, for which costs are roughly proportional to the output. The exact combination between these two opposite forces is responsible for the overall effect and jointly determines the optimum scale of production. Research is an even less understood production process, for which the arguments for economies of scale are mostly linked to indivisibilities in cognitive capital (minimum scale of research teams), and in physical capital (laboratories) when it applies (Daraio et al., 2015).
All the reviewed studies vary in the precise definitions of the variables used to reflect inputs and outputs. Most conclude that inputs can be grouped as student inputs, staff inputs and capital inputs, while outputs can be divided into teaching and research output. Some studies have focused on the efficiency of universities at producing either teaching only or research only, while others have attempted to measure efficiency in the joint production of the two outputs (Johnes and Yu, 2008). Table 2 presents the outputs of universities grouped in teaching, research and extension.
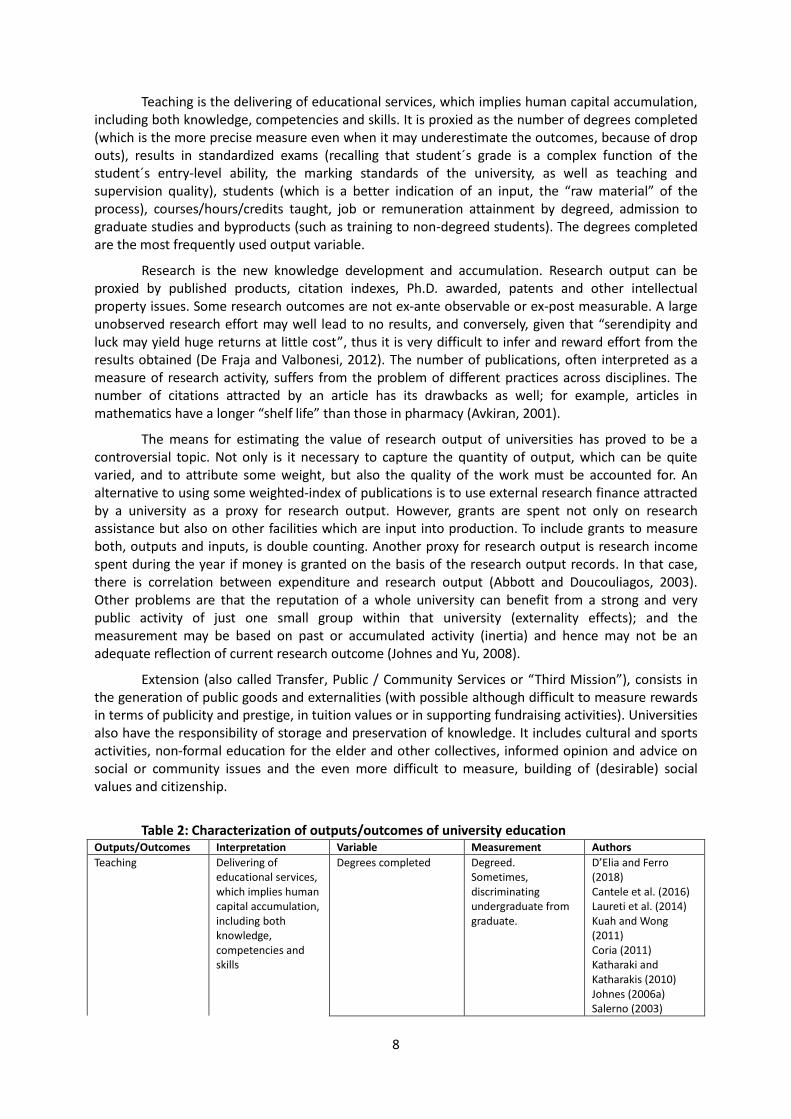
8
Teaching is the delivering of educational services, which implies human capital accumulation, including both knowledge, competencies and skills. It is proxied as the number of degrees completed (which is the more precise measure even when it may underestimate the outcomes, because of drop outs), results in standardized exams (recalling that student´s grade is a complex function of the student´s entry-level ability, the marking standards of the university, as well as teaching and supervision quality), students (which is a better indication of an input, the “raw material” of the process), courses/hours/credits taught, job or remuneration attainment by degreed, admission to graduate studies and byproducts (such as training to non-degreed students). The degrees completed are the most frequently used output variable.
Research is the new knowledge development and accumulation. Research output can be proxied by published products, citation indexes, Ph.D. awarded, patents and other intellectual property issues. Some research outcomes are not ex-ante observable or ex-post measurable. A large unobserved research effort may well lead to no results, and conversely, given that “serendipity and luck may yield huge returns at little cost”, thus it is very difficult to infer and reward effort from the results obtained (De Fraja and Valbonesi, 2012). The number of publications, often interpreted as a measure of research activity, suffers from the problem of different practices across disciplines. The number of citations attracted by an article has its drawbacks as well; for example, articles in mathematics have a longer “shelf life” than those in pharmacy (Avkiran, 2001).
The means for estimating the value of research output of universities has proved to be a controversial topic. Not only is it necessary to capture the quantity of output, which can be quite varied, and to attribute some weight, but also the quality of the work must be accounted for. An alternative to using some weighted-index of publications is to use external research finance attracted by a university as a proxy for research output. However, grants are spent not only on research assistance but also on other facilities which are input into production. To include grants to measure both, outputs and inputs, is double counting. Another proxy for research output is research income spent during the year if money is granted on the basis of the research output records. In that case, there is correlation between expenditure and research output (Abbott and Doucouliagos, 2003). Other problems are that the reputation of a whole university can benefit from a strong and very public activity of just one small group within that university (externality effects); and the measurement may be based on past or accumulated activity (inertia) and hence may not be an adequate reflection of current research outcome (Johnes and Yu, 2008).
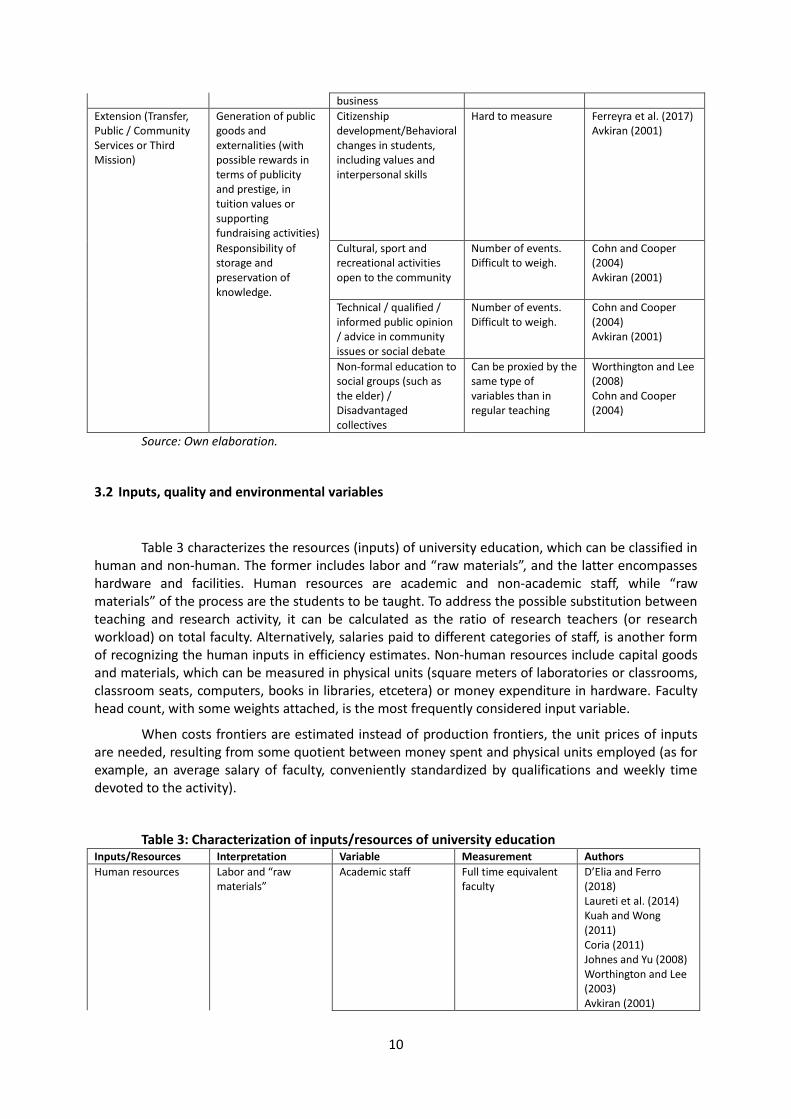
Extension (also called Transfer, Public / Community Services or “Third Mission”), consists in the generation of public goods and externalities (with possible although difficult to measure rewards in terms of publicity and prestige, in tuition values or in supporting fundraising activities). Universities also have the responsibility of storage and preservation of knowledge. It includes cultural and sports activities, non-formal education for the elder and other collectives, informed opinion and advice on social or community issues and the even more difficult to measure, building of (desirable) social values and citizenship.
Table 2: Characterization of outputs/outcomes of university education
Outputs/Outcomes Interpretation Variable Measurement Authors
Teaching
Delivering of educational services, which implies human capital accumulation, including both knowledge, competencies and skills
Degrees completed
Degreed. Sometimes, discriminating undergraduate from graduate.
D’Elia and Ferro (2018) Cantele et al. (2016) Laureti et al. (2014) Kuah and Wong (2011) Coria (2011) Katharaki and Katharakis (2010) Johnes (2006a) Salerno (2003)

9
Worthington (2001) Avkiran (2001)
Results in standardized tests
Possible if these tests are taken
Laureti et al (2014) Zoghbi et al. (2013) Kuah and Wong (2011) Johnes (2006b) Worthington (2001)
Head count of enrolled students (standardized by full time equivalent)
Actually, an input. Cantele et al. (2016) Salerno (2003)
Hours of knowledge taught / Courses /Credits
Proxy to the value added to student’s knowledge basis
Kuah and Wong (2011) Cohn and Cooper (2004)
Job attainment once graduated
Students employment potential
Zoghbi et al. (2013) Kuah and Wong (2011) Worthington (2001)
Remuneration attainment once graduated
Students earnings potential Rate of return of the degree
Zoghbi et al. (2013) Johnes and Johnes (2009) Worthington (2001)
Admission to graduate studies
Head count Ferreyra et al. (2017)
Byproducts Students which did not complete degrees, yet incorporated some qualifications
Coria (2011)
Research New knowledge development and accumulation
Published products
Some weighted sum of articles, books, conference papers, etcetera. Problems of heterogeneity and ageing of the contributions
Cantele et al. (2016) Kuah and Wong (2011) Coria (2011) Worthington and Lee (2008) Salerno (2003)
Citation indexes Impact of only part of the research outcomes
Kao and Hung (2008) Avkiran (2001)
Ph.D. awarded Head count De Fraja and Valbonesi (2012) Kuah and Wong (2011) Worthington and Lee (2008)
Patents granted Number of patents Kao and Hung (2008)
Other intellectual property obtained / Awards
Number of registers. Difficult to weigh.
Kuah and Wong (2011) Kao and Hung (2008)
Grants awarded Money achieved. Actually, an input
Kao and Hung (2016) Kuah and Wong (2011) Salerno (2003)
Research expenditures / Projects
Money spent. Actually, an input
Katharaki and Katharakis (2010) Salerno (2003)
Contract money/Partnership with
Money awarded. Actually, an input.
Cantele et al. (2016)
10
business
Extension (Transfer, Public / Community Services or Third Mission)
Generation of public goods and externalities (with possible rewards in terms of publicity and prestige, in tuition values or supporting fundraising activities)
Citizenship development/Behavioral changes in students, including values and interpersonal skills
Hard to measure Ferreyra et al. (2017) Avkiran (2001)
Responsibility of storage and preservation of knowledge.
Cultural, sport and recreational activities open to the community
Number of events. Difficult to weigh.
Cohn and Cooper (2004) Avkiran (2001)
Technical / qualified / informed public opinion / advice in community issues or social debate
Number of events. Difficult to weigh.
Cohn and Cooper (2004) Avkiran (2001)
Non-formal education to social groups (such as the elder) / Disadvantaged collectives
Can be proxied by the same type of variables than in regular teaching
Worthington and Lee (2008) Cohn and Cooper (2004)
Source: Own elaboration.
3.2 Inputs, quality and environmental variables
Table 3 characterizes the resources (inputs) of university education, which can be classified in human and non-human. The former includes labor and “raw materials”, and the latter encompasses hardware and facilities. Human resources are academic and non-academic staff, while “raw materials” of the process are the students to be taught. To address the possible substitution between teaching and research activity, it can be calculated as the ratio of research teachers (or research workload) on total faculty. Alternatively, salaries paid to different categories of staff, is another form of recognizing the human inputs in efficiency estimates. Non-human resources include capital goods and materials, which can be measured in physical units (square meters of laboratories or classrooms, classroom seats, computers, books in libraries, etcetera) or money expenditure in hardware. Faculty head count, with some weights attached, is the most frequently considered input variable.
When costs frontiers are estimated instead of production frontiers, the unit prices of inputs are needed, resulting from some quotient between money spent and physical units employed (as for example, an average salary of faculty, conveniently standardized by qualifications and weekly time devoted to the activity).
Table 3: Characterization of inputs/resources of university education Inputs/Resources Interpretation Variable Measurement Authors
Human resources Labor and “raw materials”
Academic staff Full time equivalent faculty
D’Elia and Ferro (2018) Laureti et al. (2014) Kuah and Wong (2011) Coria (2011) Johnes and Yu (2008) Worthington and Lee (2003) Avkiran (2001)

11
Worthington (2001) Johnes (1996)
Research teachers / Doctoral students
Head Count. Ratio on total. Workload on total
Coria (2011) Kao and Hung (2008) Johnes and Yu (2008)
Students to be taught Full time equivalent students who are submitted to a cultural transformation process
D’Elia and Ferro (2018) Laureti et al. (2014) Coria (2011)
Non-academic staff Head count Worthington and Lee (2008) Avkiran (2001) Worthington (2001)
Salaries paid to each category of the staff
Money spent Coria (2011)
Non-human resources Capital and other hardware or tangible items
Facilities Lecture halls square meters Labs square meters Materials Bibliography items Computers Classroom seats
Cantele et al. (2016) Laureti et al. (2014) Johnes (1996)
Non-human expenditure
Money spent Cao and Hung (2008) Worthington and Lee (2008) Worthington (2001)
Source: Own elaboration.
Table 4 presents quality variables used in university efficiency studies. Quality can be assessed either in outcomes or in resources, by using different ratios or dummy variables. They are normally indications of completion, achievements and recognition (given duration, structure and contents of the programs, time dedication and qualification of the staff). It can be also applied to expenditures. The process can be addressed by the technology in use, for example by establishing a ratio between on-line to off-line students. The quality of the staff input is reflected by faculty proportion with professor status, and/or full time on part time ratio. The premise underlying this variable is that the promoted/tenured faculty is more productive than their colleagues. Nevertheless, they may have been promoted when research demands were less than nowadays, or, once promoted, these faculty have less motivation to continue to be that productive, thus the net effect is a priori uncertain (Johnes and Yu, 2008). Youngest faculty, in turn, can be more enthusiastic, while unexperienced, or their effort applied to teach in the initial subjects, to students who will achieve their degree as well as those who will drop out. Quality variables are present in 15 percent of the studies we examined.
Table 4: Quality variables in efficiency studies of university education Quality Interpretation Variable Measurement Authors
Could be formed as ratios or dummies
Indications of completion, achievements and recognition
Drop-out rates Proportion on cohort Zoghbi et al. (2013)
(given duration, structure and contents)
Low-progress rate Proportion on cohort Coria (2011)
Student/Faculty ratio Proportion Ferreyra et al. (2017)
Staff expenditure/Total
Proportion on total Ferreyra et al. (2017)

12
expenditure Professorship /
Tenured academics
Proportion of professors over certain status / seniority
Sav (2012) Johnes and Yu (2008) Kuo and Ho (2003)
Index of full-time faculty / Research, Teaching and Administrative Workload
Full time on total faculty
Sav (2012)
On line / Off line students’ ratio
Proportion Wolff et al. (2014)
Source: Own elaboration.
Table 5 refers to environmental or contextual variables, which allow fair comparisons between institutions and permit addressing for observable heterogeneity. They are used for separating the effect of uncontrollable inputs. At least three groups of environmental variables can be distinguished: those referred to students’ intellectual, economic, and social background, those referred to place of origin (poor or rich regions, both in term of GDP and human capital, ethnicity, age and gender of students), and those referred to the type of university (big or small, old or new, private or public, profit or non-for profit, laic or religious, specialized or generalist, teaching labor-intensive or capital-intensive disciplines). Different environmental variables are included in 69 percent of the studies we analyzed.
Table 5: Environmental variables in efficiency studies of university education Environmental (contextual) variables
Interpretation Variable Measurement Authors
Used to separate the effect of uncontrollable inputs
Context (student and place characteristics, type of university)
Students intellectual background
High school completion grades. Selection process exams results. Individual effort, innate ability and academic readiness, as well as peer externalities (learning by group interaction). Difficult to measure
Ferreyra et al. (2017) Laureti et al. (2014) Worthington (2001)
Parental socioeconomic index
Family per capita GDP Laureti et al. (2014)
Parental qualification index
Years of parents’ educational training (or degrees attained)
Zoghbi et al. (2013)
Index of full-time students
Full time on total students
Zoghbi et al. (2013)
Gender composition of students
Proportion of female students
Laureti et al. (2014) Zoghbi et al. (2013) Johnes (2006b)
Ethnic composition of students
Student minority proportion
Worthington (2001)
Internationalization of students
Foreign /out of region to domestic /regional origin rate
Laureti et al. (2014)
Age of students Average age of students /Students’ age under certain value
Laureti et al. (2014)

13
Regional GDP GDP of the region with respect to national average
Cantele et al. (2016) Laureti et al. (2014) Zoghbi et al. (2013) Costa et al. (2011) Agasisti and Johnes (2009)
Regional Human Capital
Years of average educational training of region population with respect to national average
Cantele et al. (2016) Zoghbi et al. (2013)
Size of the university With respect to local context (history matters)
Cantele et al. (2016) Daraio et al. (2015)
Ownership of the university/System governance
Public or private If private, non-profit or for-profit Laic or religious
Millot (2015) Laureti et al. (2014)
Degree of specialization
Mixture of disciplines taught with different hardware intensity / Share of science, engineering and medicine on total.
Cantele et al. (2016) Daraio et al. (2015) Laureti et al. (2014) Johnes and Johnes (2009, 2004 and 1993) Horne and Ho (2008) Cohn and Cooper (2004)
Age of the university Older or newer with respect to local context
Johnes and Johnes (2009 and 1993)
Source: Own elaboration.
4. Summary and concluding remarks
There is a growing body of knowledge trying to determine relative efficiency in universities since there are increasing demands on what is expected of them in terms of productivity and efficiency. In this sense, we explore the literature of efficiency measuring in higher education by analyzing 75 specific studies ranging from 1997 to 2018 which assess higher education efficiency in different parts of the world.
The literature offers two methodological approaches, which in turn have evolved over time. One, measures relative efficiency using mathematical programming and the other employs econometric methods. Each method has relative advantages and disadvantages. The most popular mathematical programming method is the Data Envelopment Analysis (DEA). In most recent papers, DEA is complemented with some parametric analysis, such as running regression of the DEA technical efficiency measures against several possible explanatory variables.
On the other hand, SFA is the most advanced technology to deal with efficiency on econometric grounds. It allows testing hypothesis statistically, and to isolate efficiency as the part of the residuals of each observation with respect to the estimated frontier that is not deemed as pure randomness.
Most of the papers we review use non-parametric (DEA) models to estimate efficiency (72 percent), but SFA models are increasingly popular. In the last decade econometric studies advanced in the determination of observed and unobserved heterogeneity. While the separation of randomness and management capabilities is made through SFA, there are characteristics that make
14
the productive units heterogeneous. Some of this is directly observed and it can be modelled with the inclusion of explicit variables, while part of the differences, even systematic are not observable, but can be addressed with proper methods. The most recent SFA papers address heterogeneity problems and there are several methods derived from the DEA technical efficiency ranks such as: two stages DEA (the second stage is some parametric treatment of the ranks) and bootstrapping methods. Moreover, indices such as Malmquist index, allow to expand the findings obtained from DEA, and to reveal changes in efficiency scores and technical change over time.
Apart from the methodology, the other important issue in the estimation of efficiency is the choice of variables in the production (cost) process. Across the literature, the outputs considered are teaching, research and extension activities. In each case, the outcomes can be measured in terms of physical units (faculty head count, published articles or number of activities, for example) or in terms of monetary units (salaries to teachers, grants for research, money devoted to cultural or sport activities, for example). The majority of the papers we explore estimate technical efficiency, both following parametric and non-parametric methods, and also most of the studies employ physical units. Some investigations, nonetheless, concentrate in cost efficiency using parametric methods. The degrees completed are the most frequently used output variable.
Regarding inputs, they are in line with those in a theoretical production function: labor or human resources, capital or physical resources, and raw materials. Labor can be proxied by head count or by money spent; capital can be proxied by different measures of facilities or the money spent on them, and raw materials are the students, people who will be object of a cultural transformation. These persons come from different economic or social backgrounds, which can be addressed to polish the analysis and must be considered for unbiased comparisons. When costs are analyzed instead of production, the unit prices of inputs are needed, resulting from some quotient between money spent and physical units employed (as for example, an average salary of faculty, conveniently standardized by qualifications and weekly time devoted to the activity). As can be expected, given the important role of public institutions in higher education, and the dominant feature of being not-for profit institutions, most of the studies explore technical efficiency. Faculty head count, with some weights attached, is the most frequently considered input variable.
Quality and environmental variables complete the analysis. Quality variables try to address completion rates and the quality of inputs and outputs (present in 15 percent of the studies we examined), while environmental variables take into account the differences in the context (included in 69 percent of the studies we analyzed). For example, a well-known or established university is different from a brand new one; a school specialized in health or engineering has different capital intensity than a school of liberal arts or social sciences; students of universities located in poor or bad endowed human capital regions could be in disadvantage with respect to others located in richer areas, etc.
This article is useful for researchers interested in measuring efficiency. Moreover, the practical and social implications are straightforward: the discussion on productivity and efficiency in the education sector would help policy makers not to take unreflective cost or quality cuts based on partial productivity or average cost measures. In all cases, the availability of complete and high quality data is a requirement to measure efficiency in higher education.
References
Abbott, M. and C. Doucouliagos (2003). The Efficiency of Australian Universities: A Data Envelopment Analysis. Economics of Education Review 22, pp. 89-97.

15
Agasisti, Tomasso and Geraint Johnes (2009). Beyond Frontiers: Comparing the Efficiency of Higher Education Decision-Making Units Across More Than One Country. Education Economics 171:1, pp. 59-79.
Agasisti, Tommaso (2017). Management of Higher Education Institutions and the Evaluation of their Efficiency and Performance. Tertiary Education and Management, DOI: 10.1080/13583883.2017.1336250.
Agasisti, Tommaso and Geraint Johnes (2010). Heterogeneity and the Evaluation of Efficiency: the case of Italian Universities. Applied Economics, 42:11, 1365-1375.
Agasisti, Tommaso (2014). The Efficiency of Public Spending on Education: An Empirical Comparison of EU Countries. European Journal of Education, Vol. 49, Nº 4.
Agasisti, Tommaso, Giuseppe Catalano, Paolo Landoni and Roberto Verganti (2012). Evaluating the Performance of Academic Departments: An Analysis of Research-Related Output Efficiency. Research Evaluation 21, pp. 2-14.
Agasisti, Tommaso and Francesca Bonomi (2014). Benchmarking Universities’ Efficiency Indicators in the Presence of Internal Heterogeneity. Studies in Higher Education, 39:7, pp 1237-1255.
Agasisti, Tommaso and Joanna Wolszczak-Derlacz (2016). Exploring efficiency differentials between Italian and Polish universities, 2001–11. Science and Public Policy, Oxford University Press, vol. 43(1), pages 128-142.
Agasisti, Tommaso, Cristian Barra and Roberto Zotti (2016). Evaluating the Efficiency of Italian Public Universities (2008-2011) in Presence of (Unobserved Heterogeneity. Socio-Economic Planning Sciences 55, pp- 47-58.
Agasisti, Tommaso and Geraint Johnes (2013). Efficiency, Costs, Rankings and Heterogenity: the case of US Higher Education. Studies in Higher Education, DOI: 10.1080/03075079.2013.818644.
Aigner, D.J., C.A.K. Lovell and P. Schmidt (1977). Formulation and Estimation of Stochastic Frontier Production Function Models. Journal of Econometrics, 6: 21-37.
Alberto, Catalina, Claudia Carignano and Raúl Ercole (2010). Análisis de eficiencia de universidades públicas en argentina mediante métodos no paramétricos. Educare et Educare. Revista de Educaçao, vol 5, Nº 10.
Altamirano-Corro, A. and R. Peniche-Vera (2014). Measuring the Institutional Efficiency Using DEA and AHP: The Case of a Mexican University. Journal of Applied Research and Technology, vol 12 pp 63-71.
Andersson, C., J. Antelius, J. Mansson and K. Sund (2016). Technical Efficiency and Productivity for Higher Education Institutions in Sweden. Scandinavian Journal of Educational Research, DOI: 10.1080/00313831.2015.1120230.
Avkiran, Necmi K. (2001). Investigating Technical and Scale Efficiencies of Australian Universities Through Data Envelopment Analysis. Socio-Economic Planning Sciences 35, pp. 57-80.
Aziz, Nur Azlina Abd, Roziah Mohd Janor and Rasidah Mahadi (2013). Comparative Departamental Efficiency Analysis within a University: A DEA Approach. Procedia – Social and Behavioral Sciences 90, pp. 540-548.
Barra, C. R. Lagravinese and R. Zotti (2017). Does Econometric Methodology Matter to Rank Universities? An Analysis of Italian Higher Education System. Socio-Economic Planning Sciences. DOI: 10.1016/j.seps.2017.09.002.

16
Barra, Cristian and Roberto Zotti (2016a). A Directional Distance Approach Applied to Higher Education: An Analysis of Teaching-Related Output Efficiency. Annals of Public and Cooperative Economics 87:2, pp. 145-173.
Barra, Cristian and Roberto Zotti (2016b). Measuring Efficiency in Higher Education: An Empirical Study Using a Bootstrapped Data Envelopment Analysis. International Advances in Economic Research: 22, 11-33.
Battese, G., and T. Coelli (1988). Prediction of firm-level technical efficiencies with generalized frontier production function and panel data. Journal of Econometrics 38: 387-399.
Battese, G., and T. Coelli (1992). Frontier production functions, technical efficiency and panel data: with application to paddy farmers in India. Journal of Productivity Analysis 3(1/2): 153-169.
Battese, G., and T. Coelli (1995). A model for technical inefficiency effects in a stochastic frontier production function for panel data. Empirical Economics 20: 325-332.
Berbegal-Mirabent, Jasmina (2018). The influence of regulatory frameworks on research and knowledge transfer outputs: An efficiency analysis of Spanish public universities. Journal of Engineering and Technology Management Volume: 47 Issues: 68—80.
Berbegal-Mirabent, Jasmina; Esteban Lafuente and Francesc Solé (2013). The pursuit of knowledge transfer activities: An efficiency analysis of Spanish universities. Journal of Business Research Volume: 66 Issues: 10 2051—2059.
Cantele, Silvia, Andrea Guerrini and Bettina Campedelli (2016). Efficiency of Italian Universities: The Effect of Controllable and Non-Controllable environmental and Operational Variables. International Journal of Public Policy, Vol. 12, Nos. 3/4/5/6.
Caudill, S., and J. Ford (1993). Biases in frontier estimation due to heteroscedasticity. Economic Letters 41: 17-20.
Caudill, S., J. Ford, and D. Gropper (1995). Frontier estimation and firm-specific inefficiency measures in the presence of heteroscedasticity. Journal of Business Economics and Statistics 13: 105-111.
Cohn, Elchanan and Samuel T. Cooper (2004). Multi-Product Cost Functions for Universities: Economies of Scale and Scope. In International Handbook on the Economics of Education. Geraint Johnes and Jill Johnes (editors). Edgar Elgar Publishing Ltd.
Coria, María Marta (2011). Eficiencia técnica de las universidades de gestión estatal en Argentina. Ensayos de Política Económica (Vol. 5).
Cornwell, C., P. Schmidt and R. C. Sickles (1990). Production Frontiers with Time-Series Variation in Efficiency Levels. Journal of Econometrics, 46, 185–200.
Costa, Edward Martins, Francisco de Sousa Ramos and Hermíno Ramos de Souza (2011). The Productive Efficiency of Federal Institutions of Brazilian Higher Education. Encontro ANPEC 2011.
Daraio, Cinzia, Andrea Bonaccorsi and Léopold Simar (2015). Efficiency and Economies of Scale and Specialization in European Universities: A Directional Distance Approach. Journal of Informetrics 9, pp. 430-448.
De Fraja, Gianni and Paola Valbonesi (2012). The Design of the University System. Journal of Public Economics 96, pp. 317-330.
D’Elia, Vanesa and Gustavo Ferro (2018). Efficiency in Higher Education Teaching Activities: A Stochastic Frontier Analysis. LIII Reunión Anual de la Asociación Argentina de Economía Política, La Plata, November.
17
De Witte, K. and L. Lopez-Torres (2017). Efficiency in education: a review of literature and a way forward. Journal of the Operational Research Society, vol. 68, no. 4, pp. 339-363.
Ferreyra, María Marta, Ciro Avitabile, Javier Botero Álvarez, Francisco Haimovich Paz and Sergio Urzúa (2017). At a Crossroads. Higher Education in Latin America and the Caribbean. Directions in Development. Human Development. World Bank Group.
Flegg, A. T. and D. O. Allen (2007). Does Expansion Cause Congestion? The Case of the Older British Universities, 1994-2004. Education Economics, 15:1, pp 75-102.
Flegg, A. T., D. O. Allen, K. Field and T. W. Thurlow (2004). Measuring the Efficiency of British Universities: a Multi Period Data Envelopment Analysis. Education Economics, 12:3, pp. 231-249.
Gates, Susan and Ann Stone (1997). Understanding Productivity in Higher Education. Prepared for California Education Roundtable. Institute on Education and Training. RAND.
Greene, W. (2005a). Reconsidering heterogeneity in panel data estimators of the stochastic frontier model. Journal of Econometrics, 126(2): 269-303.
Greene, W. (2005b). Fixed random effects in stochastic frontier models. Journal of Productivity Analysis, 23(1): 7-32.
Greene, W. (2008). The econometric approach to efficiency analysis. In “The Measurement of
Productive Efficiency and Productivity Growth”, edited by Harold O. Fried, C. A. Knox Lovell,
Shelton S. Schmidt. Oxford University Press.
Guccio, Calogero, Marco Ferdinando Martorana and Luisa Monaco (2016). Evaluating the Impact of
the Bologna Process on the Efficiency convergence of Italian Universities: A Non-Parametric
Frontier Approach. Journal of Productivity Analysis vol 45, Issue 3, pp. 275-298.
Hadri, K. (1999). Estimation of a Doubly Heteroscedastic Stochastic Frontier Cost Function. Journal of
Business Economics and Statistics, 17(3): 359-363.
Horne, Jocelyn and Baiding Hu (2008). Estimation of Cost Efficiency of Australian Universities. Mathematics and Computing in Simulation 78, pp. 266-275.
Ibañez Martín, María, S. Morresi and F. Delbianco (2017). Una medición de la eficiencia interna en una universidad argentina usando el método de fronteras estocásticas. Revista de Educación Superior 46 (183): 47-62.
Izadi, Hooshang, Geraint Johnes, Reza Oskrochi and Robert Crouchley (2002). Stochastic Frontier Estimation of a CES Cost Function: The Case of Higher Education in Britain. Economics of Education Review 21, pp. 63-71.
Johnes, Geraint and Astrid Schwarzenberger (2011). Differences in Cost Structure and the Evaluation of Efficiency: The Case of German Universities. Education Economics, vol. 19, Nº 5, pp. 487-499.
Johnes, Geraint and Jill Johnes (2009). Higher Education Institutions’ Costs and Efficiency: Taking the Decomposition a Further Step. Economics of Education Review 28, pp. 107-113.
Johnes, Geraint and Jill Johnes (1993). Measuring the Research Performance of UK Economics Departments: An Application of Data Envelopment Analysis. Oxford Economic Papers 45, pp. 332-347.
Johnes, Geraint and Jill Johnes (2009). Higher Education Institutions’ Costs and Efficiency: Taking the Decomposition a Further Step. Economics of Education Review 28, pp. 107-113.
Johnes, Geraint, Jill Johnes and Emmanuel Thanassoulis (2008). An Analysis of Costs in Institutions of Higher Education in England. Studies in Higher Education, 33:5, pp. 527-549.

18
Johnes Geraint and Kaoru Tone (2016). The Efficiency of Higher Education Institutions in England Revisited: Comparing Alternative Measures. Tertiary Education and Management, DOI: 10.1080/13583883.2016.1203457.
Johnes, Jill (2006a). Data Envelopment Analysis and its Application to the Measurement of Efficiency in Higher Education. Economics of Education Review 25, pp. 273-288.
Johnes, Jill (2004). Efficiency Measurement. In: International Handbook on the Economics of Education. Geraint Johnes and Jill Johnes (editors). Edgar Elgar Publishing Ltd.
Johnes, Jill (2008). Efficiency and Productivity Change in the English Higher Education Sector From 1996/97 To 2004/05. Manchester School, vol. 76, issue 6, pages 653-674.
Johnes, Jill (2006b). Measuring Teaching Efficiency in Higher Education: An Application of Data Envelopment Analysis to Economics Graduates from UK Universities 1993. European Journal of Operational Research 174, pp. 443-456.
Johnes, Jill and Li Yu (2008). Measuring the Research Performance of Chinese Higher Education Institutions Using Data Envelopment Analysis. China Economic Review 19, pp. 679-696.
Kao, Chiang and His-Tai Hung (2008). Efficiency Analysis of University Departments: An Empirical Study. Omega. The International Journal of Management Science 36, pp. 653-664.
Katharaki, Maria and George Katharakis (2010). A Comparative Assessment for Greek Universities’ Efficiency Using Quantitative Analysis. International Journal of Educational Research 49, pp. 115-128.
Kempkes, Gerhard and Carsten Pohl (2010). The Efficiency of German Universities. Some Evidence from Non-Parametric and Parametric Methods. Applied Economics, 42:16, pp. 2063-2079.
Kuo, Jenn-Shyong and Yi-Cheng Ho (2008). The Cost Efficiency Impact of the University Operation Fund in Taiwan. Economics of Education Review 27, pp. 603-612.
Kuah, Chuen Tse and Kuan Yew Wong (2011). Efficiency Assessment of Universities Through Data Envelopment Analysis. Procedia Computer Science 3, pp. 499-506.
Kumbhakar, S. (1990). Production frontiers, panel data and time-varying technical inefficiency. Journal of Econometrics 46: 201-212.
Laureti, Tiziana, Luca Secondi and Luigi Biggeri (2014). Measuring the Efficiency of Teaching Activities in Italian Universities: An Information Theoretic Approach.
Lee, Boon L. and Andrew C. Worthington (2016). A Network DEA Quantity and Quality-Oriented Production Model: An Application to Australian University Research Services. Omega 60, pp. 26-33.
Marinho, Alexandre, Marcelo Resende and Luís Otávio Façanha (1997). Brazilian Federal Universities: Relative Efficiency Evaluation and Data Envelopment Analysis. Revista Brasileira de Economia 51(4), pp. 489-508.
Meza Ávila, Francisco Javier, Juan Carlos Vergara Schmalbach and Raúl Román Romero (2017). Eficiencia y productividad en la cobertura de las universidades públicas colombianas. Investigación & Desarrollo, vol. 25, Nº 2, pp. 6-33.
Meeusen, W. and van den Broeck, J. (1977). Efficiency Estimation from Cobb-Douglas Production Functions with Composed Error. International Economic Review, 18: 435-444
Mensah, Yaw M. and Robert Werner (2003). Cost Efficiency and Financial Flexibility in Institutions of Higher Education. Journal of Accounting and Public Policy 22, pp. 293-323.
Millot, Benoit (2015). International Rankings: Universities vs. Higher Education Systems. International Journal of Educational Development 40, pp. 156-165.
19
Pitt, M. and L. Lee (1981). The measurement and sources of technical inefficiency in the Indonesian weaving industry. Journal of Development Economics 9: 43-64.
Quiroga Martinez, Facundo (2018). Evaluación del Sistema de Educación Superior Argentino: Análisis de la Eficiencia de la Universidades Nacionales y de su Efecto en la Productividad de los Individuos. Doctoral Thesis. Universidad de Oviedo and Universidad Nacional de Córdoba.
Salerno, Carlo (2003). What we know about the efficiency of higher education institutions: the best
evidence. [Report].
Schmidt, P., and R. Sickles (1984). Production frontiers and panel data. Journal of Business Economics
and Statistics 2(4): 367-374.
Selim, Sibel and Sibel Aybarc Bursalioglu (2013). Analysis of the Determinants of University Efficiency in Turkey: Application of the Data Envelopment Analysis and Panel Tobit Model. Procedia – Social and Behavioral Sciences 89, pp. 895-200.
Silvestre Ramírez, Rita Nayely and Félix Chamú Nicanor (2015). Eficiencia técnica y cambio tecnológico de las unidades académicas de la Universidad Michoacana a través del Índice Malmquist. Economía y Sociedad, vol XIX, Nº 33, pp 17-35.
Tyagi, Preeti, Shiv Prasad Yadav and S. P. Singh (2009). Relative Performance of Academic Departments Using DEA With Sensitivity. Evaluation and Program Planning 32, pp. 168-177.
Sav, G. Thomas (2012). Managing Operating Efficiencies of Publicly Owned Universities: American University Stochastic Frontier Estimates Using Panel Data. Advances in Management & Applied Economics, vol. 2, Nº 1, pp. 1-23.
Wolff, Edward, William J. Baumol and Anne Noyes Saini (2014). A Comparative analysis of Education Costs and Outcomes: The United States vs. Other OECD Countries. Economics of Education Review 39, pp. 1-21.
Wolszczak-Derlacz, Joanna (2017). An evaluation and explanation of (in)efficiency in higher education institutions in Europe and the U.S. with the application of two-stage semi-parametric DEA. Research Policy, Elsevier, vol. 46(9), pages 1595-1605.
Wolszczak-Derlacz, Joanna (2016). Assessment of TFP in European and American Higher Education Institutions – Application of Malmquist Indices. Technological and Economic Development of Economy doi:10.3846/20294913.2016.1213197
Worthington, Andrew (2001). An Empirical Survey of Frontier Efficiency Measurement Techniques in Education. Education Economics 9(3), pp. 245-268.
Worthington, Andrew and Boon L. Lee (2008). Efficiency, Technology and Productivity Change in Australian Universities, 1998-2003. Economics of Education Review 27, pp. 285-298.
Zhoghbi, Ana Carolina, Fabiana Rocha and Enlinson Mattos (2013). Education Production Efficiency: Evidence from Brazilian Universities. Economic Modelling 31, pp. 94-103.