vanguard appraisals, inc. cama-x advanced query wizard and
TRANSCRIPT

Copyright© 1995 – 2007 Vanguard Appraisals, Inc. Fall 2007
Vanguard Appraisals, Inc. CAMA-X
Advanced Query Wizard
And Pro-Version Report Design

Advanced Query Wizard and Pro-Version Report Design
Copyright© 1995 – 2007 Vanguard Appraisals, Inc. Fall 2007 1
The Query Wizard is intended for use only when you want to print a query grid or for exporting query data. It will NOT create a query for use for printing a report. In other words, the running man will not be active for running a report. The following report option formats are predefined and the report format can not be changed. The ProVersion query module would allow for creating/changing report formats. Parcel Detail reports allow for the printing of reports with/without parcel values and or sketch, photo, etc for batch process. This would be the same as using Views from the parcel search and/or maintenance screen. The Parcel Lists option allows for several report choices available to print parcel lists for various purposes. Occupancy List reports are typically used to print units of comparison other than single-family properties. It often compares similar commercial occupancies (i.e. apartments, franchise restaurants, motels, etc). General Sales reports display a list of sales within a time period defined by the user. The Report shows 24 property characteristics including typical units of comparison. Note: These sales reports are NOT sales ratio reports which are located under the Sales Ratio Analysis. Group Totals reports are a series of reports that counts properties by characteristic groups (i.e. counts by age range, condition, grade, style, value range, etc).

Advanced Query Wizard and Pro-Version Report Design
Copyright© 1995 – 2007 Vanguard Appraisals, Inc. Fall 2007 2
Tables and Joining Tables
Adding Tables to a Query Vanguard has taken great steps to ensure that most data filtering options a user might desire can be found, or at least started, from a Standard Query file. However there are some instances where an additional table needs to be added or an entire query needs to be made from scratch.
To add a table to a new or existing query, press the Add Table button on the toolbar or use the Edit | Add Tables menu. The following dialog will be displayed:
Figure 19: Add Table Dialog
Database, displays the predefined database alias where tables are stored. Tables, displays the names of the tables located in the Database. With the mouse or arrow keys, highlight a table name and either double-click or press the [Add Table] button. This will add your selection to the Query Wizard Link Table workspace. Add Table, the [Add Table] button adds the currently highlighted table to your query.
TIP: It is possible to add a table more than once into a query. Under certain circumstances this may be desirable, but in every day use should be avoided. An example of using two copies of the same table would be when calculating the difference between two prior year records for the same parcel.
Removing Tables
From the Link Tables workspace, select the table you want to delete and then press the Delete Table button , or use the Edit | Drop Table menu option.

Advanced Query Wizard and Pro-Version Report Design
Copyright© 1995 – 2007 Vanguard Appraisals, Inc. Fall 2007 3
Joining Tables Together Database information is usually saved in groups of tables, each with unique information. These tables are related to each other using common fields. All tables containing parcel data, for example, have the common field GID. It is this field that is used to create joins between all the tables. Most of the main tables, when added to the Query Wizard will auto-link. But when you get into building your own queries from scratch it is important to know how to do it manually. Fortunately the Query Wizard provides a graphical way to link related tables together. You simply drag and drop the related field from one table to another, as follows:
1. Point to and press the left mouse button over the left table's linking field. 2. Drag your mouse over the right table's linking field. 3. Release the left mouse button.
Whenever you add tables to a query, the following guides should be observed:
1. If you want to use your query with a predefined Vanguard report, the Query Field Definition must contain the GID field. Some reports may require additional fields, but all require at least this one.
2. The query should contain the General table.

Advanced Query Wizard and Pro-Version Report Design
Copyright© 1995 – 2007 Vanguard Appraisals, Inc. Fall 2007 4
Types of Joins The simplest join relationship is termed “one-to-one.” That is, there is one record in table “A” that corresponds to one record in table “B.” A good example is the link between the General table and the (state specific) value table (IAVALUE, MOVALUE, ILVALUE). Each parcel has only one set of current values. Another type of join is what is called one-to-many (or zero-to-many). For example the General table and the Photo table is one to many. That is to say, for a single parcel as defined by the General, there could be zero or more Photo records. For CAMAvision Real Estate, most table relationships are of the latter kind: one parcel could have many photos, notes, sales, permits, yard items, sketches… the list goes on. The typical table join, either one-to-one or one-to-many, returns all matching records between tables. This is also the most often used type of Query Wizard search. Additionally the Query Wizard supports more complex joins between tables that return all matching records from one table and zero or more records from another. The term “outer” is used to describe these joins. So why would we use outer joins? As my example report farther in this outline illustrates, it allows us to create complex reports listing both parcels that have photos, and those that do not. If I did not join the tables together in this way my report would be limited to either parcels that only have photos or those that do not.
Table Join Types and What They Look Like
To manipulate the Join, use your mouse and click on a join line to select it (it will become bold). Next press the
Edit Join button on the toolbar .

Advanced Query Wizard and Pro-Version Report Design
Copyright© 1995 – 2007 Vanguard Appraisals, Inc. Fall 2007 5
TIP: Most databases cannot efficiently process more than seven joined tables at a time. And
with few exceptions one-to-many type joins are slower than one-to-one. Unless you are willing to wait for several minutes for a query to return results, plan your custom queries with as few tables as possible.
Removing Table Joins Removing table links from a report is a two-step process:
1. Select the table link to delete by pressing your the left mouse button over the selected table link. This will highlight the selected table link.
2. Press the tool bar button to remove the table link, or use the Edit | Unlink Tables menu.
TIP: Make sure you replace a table join, or remove the table altogether before executing your query. Unlinked tables can not be left in the query and will generate an error.
TIP: You can also remove links by removing the associated tables from your query.
Advanced Field Editing Format: The Format property determines the manner in which the field will be displayed. The field Type determines how you can format the field.
Formatting Numbers 0 Digit placeholder. If the value being formatted has a digit in the position where the '0' appears in the format string, then that digit is copied to the output string. Otherwise, a '0' is stored in that position in the output string. # Digit placeholder. If the value being formatted has a digit in the position where the '#' appears in the format string, then that digit is copied to the output string. Otherwise, nothing is stored in that position in the output string. . Decimal point. The first '.' character in the format string determines the location of the decimal separator in the formatted value; any additional '.' characters are ignored. , Thousand separator. If the format string contains one or more ',' characters, the output will have thousand separators inserted between each group of three digits to the left of the decimal point. The placement and number of ',' characters in the format string does not affect the output, except to indicate that thousand separators are wanted. $ Dollar sign. If the format string begins with the $ character, the output will be formatted with the dollar sign.
Formatting Numbers Examples 1. $#,##0.00 = $1,345.35 or $125.30 2. 0.00000 = 134.35200 or 0.50000

Advanced Query Wizard and Pro-Version Report Design
Copyright© 1995 – 2007 Vanguard Appraisals, Inc. Fall 2007 6
Formatting Dates The Format Date property determines the manner in which a Date, Time or DateTime field will be displayed. Valid formatting masks include the following: c Displays the date using the format given by the ShortDateFormat system setting, followed by the time using the format given by the LongTimeFormat system setting. The time is not displayed if the fractional part of the DateTime value is zero. d Displays the day as a number without a leading zero (1-31). dd Displays the day as a number with a leading zero (01-31). ddd Displays the day as an abbreviation (Sun-Sat) using the strings given by the ShortDayNames system setting. dddd Displays the day as a full name (Sunday-Saturday) using the strings given by the LongDayNames system setting. ddddd Displays the date using the format given by the ShortDateFormat system setting. dddddd Displays the date using the format given by the LongDateFormat system setting. m Displays the month as a number without a leading zero (1-12). If the m specifier immediately follows an h or hh specifier, the minute rather than the month is displayed. mm Displays the month as a number with a leading zero (01-12). If the mm specifier immediately follows an h or hh specifier, the minute rather than the month is displayed. mmm Displays the month as an abbreviation (Jan-Dec) using the strings given by the ShortMonthNames system setting. mmmm Displays the month as a full name (January-December) using the strings given by the LongMonthNames system setting. yy Displays the year as a two-digit number (00-99). yyyy Displays the year as a four-digit number (0000-9999). h Displays the hour without a leading zero (0-23). hh Displays the hour with a leading zero (00-23). n Displays the minute without a leading zero (0-59). nn Displays the minute with a leading zero (00-59). s Displays the second without a leading zero (0-59).

Advanced Query Wizard and Pro-Version Report Design
Copyright© 1995 – 2007 Vanguard Appraisals, Inc. Fall 2007 7
ss Displays the second with a leading zero (00-59). am/pm Uses the 12-hour clock for the preceding h or hh specifier and displays 'am' for any hour before noon, and 'pm' for any hour after noon. The am/pm specifier can use lower, upper, or mixed case, and the result is displayed accordingly. / Displays the date separator character given by the DateSeparator system setting. : Displays the time separator character given by the TimeSeparator system setting.
Formatting Date Examples 1. ddd. mmmm d, yyyy = Mon. August 5, 2007 2. mm/dd/yyyy = 08/05/2007 3. m/d/yyyy h:nn am/pm = 8/5/2007 3:42 pm
Grouping and Summation of Fields Show: The Show property determines how a field will be displayed in your report. The two most common settings are:
• Show, to include the field in Preview Records • Hide, to hide the field from Preview Records and Preview Report.

Advanced Query Wizard and Pro-Version Report Design
Copyright© 1995 – 2007 Vanguard Appraisals, Inc. Fall 2007 8
There are other settings for Show, and once mastered, can really help you unlock the value in your data. Group: Used when one or more fields has a Show setting of: Sum, Count, Average, Minimum or Maximum. Any fields that do not have one of these settings MUST be set to Group or Hide.
TIP: When using the Group setting along with a Sum, Average, Minimum or Maximum, it is best to have as few fields in your query as possible. Your query will be less prone to syntax errors and will perform better, too.
Hide: Prevents the field from displaying on the report. Use Hide when you need to search a field but do not want that field displayed. Example: Display all orders where DBA equals "McDonalds". Since there is only one company, there is little need to repeat the DBA name. Sum: Total up all the values in a set of records (field must be numeric). Count: Count the number of occurrences in a set of records. Average: Display the average value in a set of records. Minimum: Display the minimum value in a set of records. Maximum: Display the maximum value in a set of records.
Understanding Show with Aggregate Calculations The Sum, Count, Average, Minimum and Maximum values are called aggregate functions. Filter values that are used on columns with an aggregate function are treated differently. For example:
1. Maximum: Display the maximum value in a set of records. 2. "Display parcels where PermitAmount was greater than 50" displays the RECORDS that exceed a
PermitAmount greater than 50. 3. "Display parcels where the SUM of PermitAmount was greater than 500" displays the records where
their collective TOTAL of PermitAmount exceeds 500. The first example applies the filter values against the actual values of the records. The second example applies the values after a calculation has been performed on a set of records. You may have other fields and filter values as needed in a query with aggregate functions, but they must have a Show setting of Group or Hide.
Key Rules Governing Show 1. Use a Show value of "Hide" to hide fields that are only being filtered but not displayed. 2. Use a Show value of "Group" to calculate a summary values by other columns (i.e. "Show the number of
photos per MapNumber"). a. Note: The MapNumber field would have a Show setting of "Group" and the Image_Count field
would have a Show setting of "Sum."1 3. Never use a Show setting of "Group" if the report does not include aggregate functions.
1 MapNumber and Image_Count are two fields found in the General table.

Advanced Query Wizard and Pro-Version Report Design
Copyright© 1995 – 2007 Vanguard Appraisals, Inc. Fall 2007 9
Advanced Field Filters: Custom Expressions In addition to displaying fields as they exist in tables, you can also create field expressions to calculate new values from two or more fields, such as total dwelling value + total improvement value (IA_Values.Total_Dwelling_Value+ IA_Values.Total_Improved_Value). To display the "Custom Expressions" tab of the "Value Editor" dialog, double-click a blank field in the query filter grid, or invoke Value Editor on an existing field and switch to the Expression tab.
Using Custom Expressions Double-click on Tables/Fields and Operators/Functions to add them to the custom expression field. Always observe the following rules when using custom field expressions:
• When adding field names to a custom expression, always double-click on fields from the tables outline rather than entering them by hand. The Query Wizard automatically checks for reserved words and punctuation when fields are selected from the tables outline.
• Use a table name (as it appears in the Tables/Fields list) in a custom expression. • Surround table and fields names that have punctuation or spaces, or are reserved words with double
quotes.

Advanced Query Wizard and Pro-Version Report Design
Copyright© 1995 – 2007 Vanguard Appraisals, Inc. Fall 2007 10
If these rules are not followed faithfully, the SQL code that is generated may fail. If you receive a TOKEN error after executing a query, the problem is most likely a missing table name in a custom expression, or a name that cannot be processed correctly without double quotes. Resolving Token Errors The Query Wizard automatically checks for over 270 reserved words, spaces and punctuation when fields are selected from the tables outline. However, if a TOKEN error does occur on a field name chosen from the tables outline, you can use custom field expressions to work around the problem. This is a two step process:
• Add quotes to the Header if it matches the field name. • Select the field from custom field expressions and add quotes.
TIP: If you already have an existing database field selected, you create a Custom Expression from the
field by switching tabs and entering the expression text. The original field will be left intact in the query grid when you press [OK]. This allows you to convert a specific field to a custom expression without leaving the "Value Editor" dialog.
Custom Expression Syntax Differences between Firebird and MS SQL Server While most of the custom expression syntax is the same between Firebird and MS SQL Server, there are couple differences that I outline here. Most users will never encounter these differences and if you run into trouble, call VCS Technical Support – we’re glad to help! SUBSTRING() Function: This example demonstrates stripping off the first five characters of the PIN.
Firebird: SUBSTRING(General_.Parcel_Number FROM 6 FOR 255) MS SQL Server: SUBSTRING(General_.Parcel_Number, 6, 255)
String Concatenation Operator: This example demonstrates stringing the house number and address string together.
Firebird: Use the double-pipe (||) Example: General_.House_Number || ' ' || General_.Address MS SQL Server: Use the plus sign (+) Example: General_.House_Number + ' ' + General_.Address
More Custom Expression Examples Example of calculating the percentage difference from the current value to the prior year value for Missouri.
((MO_Values.MO_Total_Val - MO_Prior_Year.MO_Total_Val) / (MO_Prior_Year.MO_Total_Val + 0.001)) * 100

Advanced Query Wizard and Pro-Version Report Design
Copyright© 1995 – 2007 Vanguard Appraisals, Inc. Fall 2007 11
Example summing up the total improvement value on a parcel for IA/MN. IA_Values.Total_Dwelling_Value + IA_Values.Total_Improved_Value To avoid division-by-zero errors, the very small number 0.001 is added to the divisor. It is small enough to prevent these mathematical errors and not have an effect on the outcome of quotient. Pro-version Report Designer
The Layout Page is like a painter's canvas, and the Page Designer dialog is like a painter's palette and brush set. As a painter transforms simple colors into works of art, you will use Layout Page to transform rows and columns of raw data into professional business reports.

Advanced Query Wizard and Pro-Version Report Design
Copyright© 1995 – 2007 Vanguard Appraisals, Inc. Fall 2007 12
To place objects, press the Page Designer icon or right mouse click over the layout and select the "Place Objects" menu to display the following dialog:
Placing Objects The left side of the Page Designer's "Place" tab displays all the objects available within the designer. To place these objects, press an icon and point to the layout page (pick-and-plop). To place multiple copies of an object, hold your shift key and click on the layout page as many times as needed. To cancel the placement of an object, select the Pointer icon.
Information about specific objects follows: Object Description Label 1 to 245 characters Memo 1 to 32,767 characters. For maximum performance, use labels where
possible. Rectangle, Circle, Lines Various static shapes shapes. Image Windows Bitmap (BMP) or JPEG images. Date, Time Objects with @Date or @Time function. Page Number, Page Count Objects with the @PageNumber or @PageCount function. Fields are label objects containing a [Field Header] in square brackets. The [Field Header] must have been defined in Define Search before field data will be displayed.

Advanced Query Wizard and Pro-Version Report Design
Copyright© 1995 – 2007 Vanguard Appraisals, Inc. Fall 2007 13
Placing Fields The right-hand side displays all the fields that were previously selected from Define Search. To place fields, press the left mouse button over the selected field, move your mouse over the layout page and release the left mouse button (drag-and-drop). To place multiple fields, hold your shift key, select all desired fields and drag-and-drop them as described above (holding the shift key throughout the process).
Placing Fields without Captions Captions are normally added when placing fields. To turn this off, uncheck the "Automatically Caption Fields" option.
Placing Fields with Aggregate Calculations To place fields with aggregate calculations, select Sum, Count, Minimum, Maximum or Average from the "Calculate Field" combo box. This will cause the field name to be surrounded by a calculation function.
Using @ Functions in the Report Designer The Query Wizard supports 10 special functions available in Layout Page, as follows: @DATE Displays the current date according to the system clock. @TIME Displays the current time according to the system clock. @PAGENO Displays the current page number. @PAGECOUNT Displays total pages in the report. @SUM([FieldHeader]) Totals numeric fields within the current section. @MIN([FieldHeader]) Displays the minimum field value within the current section. If the field is a string value, only the first 15 characters are used to determine the minimum value, without regard to case. @MAX([FieldHeader]) Displays the minimum field value within the current section. If the field is a string value, only the first 15 characters are used to determine the maximum value, without regard to case. @AVG([FieldHeader]) Displays the average value of numeric fields within the current section using the formula @SUM divided by @COUNT. @COUNT([FieldHeader]) Displays the number of records within the current section.
Examples of Using @ Functions All functions are case insensitive and can be used as part of a field or label caption. Examples include:
Page @PageNo of @PageCount This caption displays "Page 1 of 10"
The minimum value is @MIN([FieldHeader]) This caption displays "The minimum value is 10"

Advanced Query Wizard and Pro-Version Report Design
Copyright© 1995 – 2007 Vanguard Appraisals, Inc. Fall 2007 14
Report printed @DATE at @TIME
This caption displays "Report printed February 15, 2007 at 12:30 pm; the actual date and time formats depend on how the ShortDate was configured in your Windows Regional Settings. The Regional Settings dialog can be found in the Windows Control Panel.
TIP: It is possible to use the SUM(), MIN(), and MAX() @ functions without the need of using Grouping and aggregete expressions in your query.

Advanced Query Wizard and Pro-Version Report Design
Copyright© 1995 – 2007 Vanguard Appraisals, Inc. Fall 2007 15
Not only can you preview the report, but you can review the data grid – of the same data – for possible export.

Advanced Query Wizard and Pro-Version Report Design
Copyright© 1995 – 2007 Vanguard Appraisals, Inc. Fall 2007 16
Pro-Version Exporting of Data To Export query results to an Excel spreadsheet:
While on the Preview screen, select File and Export. The screen below is then displayed.
Type a File name and then select the file location.
Choose Export file type: • dBase DBF • CSV (comma separated values) • Tab delimited values

Advanced Query Wizard and Pro-Version Report Design
Copyright© 1995 – 2007 Vanguard Appraisals, Inc. Fall 2007 17
For CSV (Comma Separated Value) exports, you have additional options:
1. Should a field name header line be included (useful with Excel), 2. What character to use to separate each data field, and 3. How to quote text fields (if at all). This is useful if text fields
contain commas – you don’t want those commas wreaking havoc with the commas used to separate the fields.
Selecting the file location button above, displays the Select file name dialog box. Select where you want to put the export file and click Save. Hint: I always put everything on my Desktop so I can find it.
Select OK to Save the File to your specified location.
This Information is displayed showing the file create was successful. Select OK.
Advanced Query Wizard and Pro-Version Report Design
Copyright© 1995 – 2007 Vanguard Appraisals, Inc. Fall 2007 18
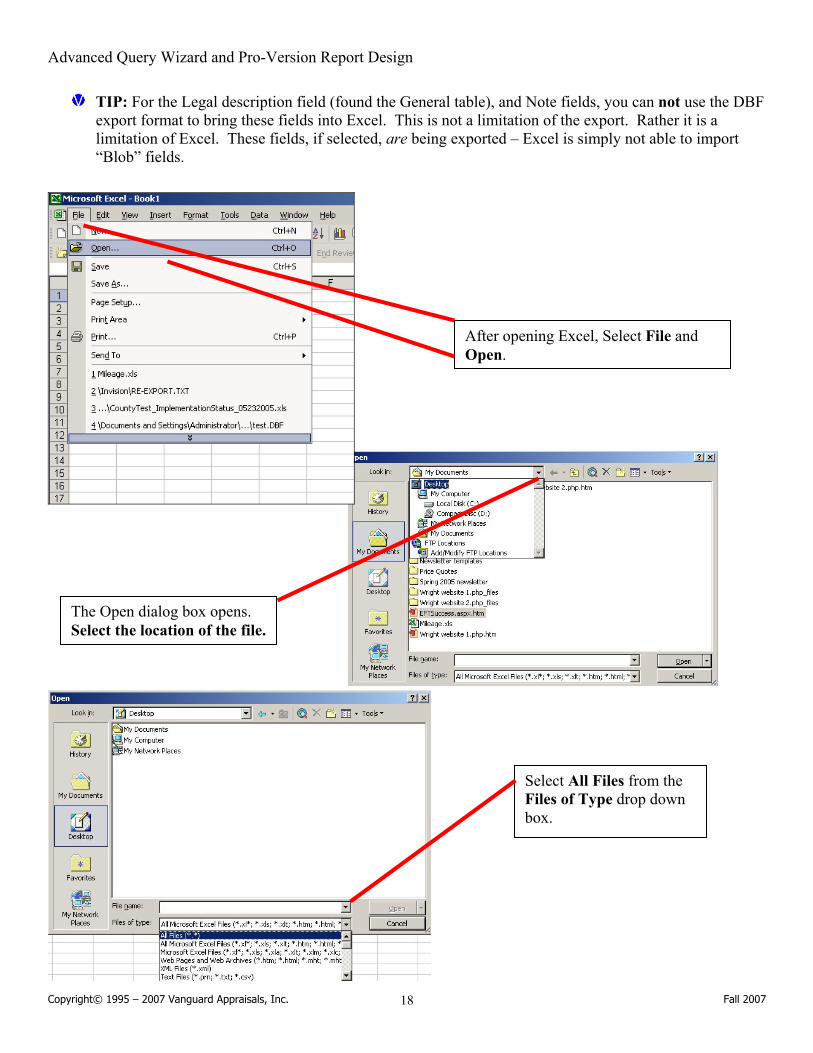
TIP: For the Legal description field (found the General table), and Note fields, you can not use the DBF export format to bring these fields into Excel. This is not a limitation of the export. Rather it is a limitation of Excel. These fields, if selected, are being exported – Excel is simply not able to import “Blob” fields.
After opening Excel, Select File and Open.
The Open dialog box opens. Select the location of the file.
Select All Files from the Files of Type drop down box.

Advanced Query Wizard and Pro-Version Report Design
Copyright© 1995 – 2007 Vanguard Appraisals, Inc. Fall 2007 19
Notice the VCS file was exported with all the field headings and each field that was included in the Query grid. Also notice it is still sorted by Appraised value.
Select the File to Open and then select the Open button.