vanguard explorer fund annual report october 31, 2012
TRANSCRIPT

Vanguard Explorer™ Fund
Annual Report | October 31, 2018

Contents
Please note: The opinions expressed in this report are just that—informed opinions. They should not be considered promisesor advice. Also, please keep in mind that the information and opinions cover the period through the date on the front of thisreport. Of course, the risks of investing in your fund are spelled out in the prospectus.
See the Glossary for definitions of investment terms used in this report.
Vanguard’s Principles for Investing Success
We want to give you the best chance of investment success. Theseprinciples, grounded in Vanguard’s research and experience, can put you onthe right path.
Goals. Create clear, appropriate investment goals.
Balance. Develop a suitable asset allocation using broadly diversified funds.
Cost. Minimize cost.
Discipline. Maintain perspective and long-term discipline.
A single theme unites these principles: Focus on the things you can control.We believe there is no wiser course for any investor.
Your Fund’s Performance at a Glance. . . . . . . . . . . . . . . . . . 1
CEO’s Perspective. . . . . . . . . . . . . . . . . . . . . . . . . . . . . . . . . 3
Advisors’ Report. . . . . . . . . . . . . . . . . . . . . . . . . . . . . . . . . . . 5
Fund Profile. . . . . . . . . . . . . . . . . . . . . . . . . . . . . . . . . . . . . .11
Performance Summary. . . . . . . . . . . . . . . . . . . . . . . . . . . . .13
Financial Statements. . . . . . . . . . . . . . . . . . . . . . . . . . . . . . 15
Your Fund’s After-Tax Returns. . . . . . . . . . . . . . . . . . . . . . . 33
About Your Fund’s Expenses. . . . . . . . . . . . . . . . . . . . . . . . 34
Glossary. . . . . . . . . . . . . . . . . . . . . . . . . . . . . . . . . . . . . . . . 36

Your Fund’s Performance at a Glance
1
Total Returns: Fiscal Year Ended October 31, 2018
TotalReturns
Vanguard Explorer Fund
Investor Shares 12.12%
Admiral™ Shares 12.24
Russell 2500 Growth Index 5.52
Small-Cap Growth Funds Average 9.65
Small-Cap Growth Funds Average: Derived from data provided by Lipper, a Thomson Reuters Company. Admiral Shares carry lower expenses and are available to investors who meet certain account-balance requirements.
Total Returns: Ten Years Ended October 31, 2018
Average
Annual Return
Explorer Fund Investor Shares 14.54%
Russell 2500 Growth Index 15.06
Small-Cap Growth Funds Average 13.51
Small-Cap Growth Funds Average: Derived from data provided by Lipper, a Thomson Reuters Company.
The figures shown represent past performance, which is not a guarantee of future results. (Currentperformance may be lower or higher than the performance data cited. For performance data current to themost recent month-end, visit our website at vanguard.com/performance.) Note, too, that both investmentreturns and principal value can fluctuate widely, so an investor’s shares, when sold, could be worth moreor less than their original cost.
• For the 12 months ended October 31, 2018, Vanguard Explorer Fund returned
12.12% for Investor Shares and 12.24% for Admiral Shares. It exceeded the return of its
benchmark, the Russell 2500 Growth Index, and the average return of its small-
capitalization growth fund peers.
• During the period, large-caps outperformed their small-cap counterparts. Growth
stocks surpassed their value counterparts.
• Consumer discretionary, health care, and information technology were the top-
performing sectors relative to the benchmark. Financials and consumer staples
detracted from relative performance.
• Each of the fund’s five independent advisors employs a growth-oriented strategy
and manages its piece of the portfolio with a long-term focus.
2
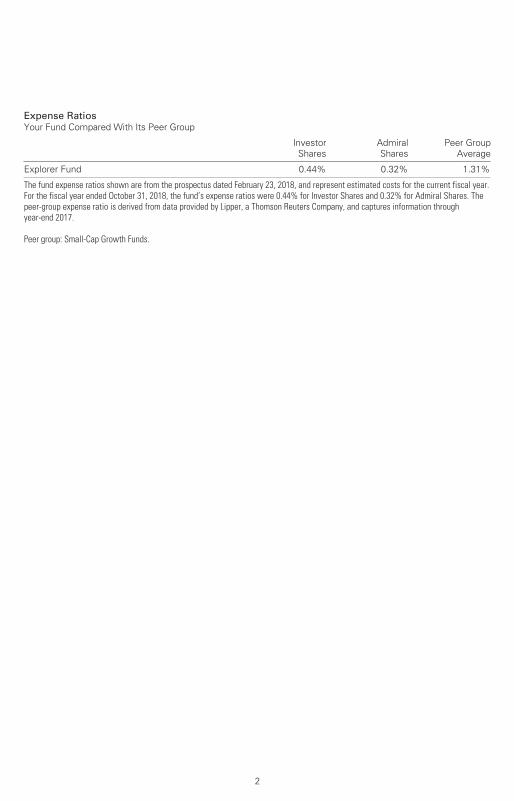
Expense RatiosYour Fund Compared With Its Peer Group
Investor
Shares
Admiral
Shares
Peer Group
Average
Explorer Fund 0.44% 0.32% 1.31%
The fund expense ratios shown are from the prospectus dated February 23, 2018, and represent estimated costs for the current fiscal year.For the fiscal year ended October 31, 2018, the fund’s expense ratios were 0.44% for Investor Shares and 0.32% for Admiral Shares. Thepeer-group expense ratio is derived from data provided by Lipper, a Thomson Reuters Company, and captures information throughyear-end 2017.
Peer group: Small-Cap Growth Funds.

Dear Shareholder,
Over the years, I’ve found that prudent
investors exhibit a common trait:
discipline. No matter how the markets
move or what new investing fad hits the
headlines, those who stay focused on
their goals and tune out the noise are
set up for long-term success.
The prime gateway to investing is saving,
and you don’t usually become a saver
without a healthy dose of discipline.
Savers make the decision to sock away
part of their income, which means
spending less and delaying gratification,
no matter how difficult that may be.
Of course, disciplined investing extends
beyond diligent saving. The financial
markets, in the short term especially,
are unpredictable; I have yet to meet the
investor who can time them perfectly.
It takes discipline to resist the urge to
go all-in when markets are frothy or to
retreat when things look bleak.
Staying put with your investments is one
strategy for handling volatility. Another,
rebalancing, requires even more discipline
because it means steering your money
away from strong performers and toward
poorer performers.
Patience—a form of discipline—is also
the friend of long-term investors. Higher
returns are the potential reward for
weathering the market’s turbulence
and uncertainty.
CEO’s Perspective
Tim Buckley
President and Chief Executive Officer
3

We have been enjoying one of the longest
bull markets in history, but it won’t continue
forever. Prepare yourself now for how
you will react when volatility comes back.
Don’t panic. Don’t chase returns or look
for answers outside the asset classes you
trust. And be sure to rebalance periodically,
even when there’s turmoil.
Whether you’re a master of self-control,
get a boost from technology, or work with
a professional advisor, know that discipline
is necessary to get the most out of your
investment portfolio. And know that
Vanguard is with you for the entire ride.
Thank you for your continued loyalty.
Sincerely,
Mortimer J. Buckley
President and Chief Executive Officer
November 16, 2018
Market Barometer Average Annual Total Returns
Periods Ended October 31, 2018
One Year Three Years Five Years
Stocks
Russell 1000 Index (Large-caps) 6.98% 11.31% 11.05%
Russell 2000 Index (Small-caps) 1.85 10.68 8.01
Russell 3000 Index (Broad U.S. market) 6.60 11.27 10.81
FTSE All-World ex US Index (International) -7.99 4.57 2.01
Bonds
Bloomberg Barclays U.S. Aggregate Bond Index
(Broad taxable market) -2.05% 1.04% 1.83%
Bloomberg Barclays Municipal Bond Index
(Broad tax-exempt market) -0.51 1.90 3.25
FTSE Three-Month U.S. Treasury Bill Index 1.67 0.86 0.52
CPI
Consumer Price Index 2.52% 2.07% 1.60%
4

5
Advisors’ Report
For the 12 months ended October 31,
2018, Vanguard Explorer Fund returned
12.12% for Investor Shares and 12.24%
for Admiral Shares. It exceeded the return
of its benchmark, the Russell 2500 Growth
Index, and the average return of its
small-capitalization growth fund peers.
Your fund is managed by five independent
advisors, a strategy that enhances its
diversification by providing exposure to
distinct yet complementary investment
approaches. It’s not uncommon for
different advisors to have different views
about individual securities or the broader
investment environment.
The advisors, the amount and percentage
of fund assets each manages, and brief
descriptions of their investment strategies
are presented in the table on page 9–10.
The advisors have provided the following
assessment of the investment
environment during the past 12 months
and the notable successes and shortfalls
in their portfolios. These comments were
prepared on November 19, 2018.
Wellington Management Company LLP
Portfolio Managers:
Kenneth L. Abrams, Senior Managing
Director and Equity Portfolio Manager
Daniel J. Fitzpatrick, CFA, Senior Managing
Director and Equity Portfolio Manager
During the 12-month period, small-
capitalization stocks benefited from
healthy corporate earnings and favorable
economic conditions. On a relative basis,
small-caps were further advantaged by
trade disputes and a strong U.S. dollar,
which disproportionately affect larger
companies. The trend toward small-caps
weakened toward the end of the period,
however, as large-caps outperformed
small-caps in the third quarter of 2018 and
overall for the 12-month period.
Our bottom-up stock selection led to
positive selection in seven of 11 sectors,
with health care, information technology,
and communication services contributing
most to relative performance. These
results were partially offset by weaker
selection within financials and consumer
staples. Sector allocation, a result of our
selection process, also detracted. Our
underweighted allocation to information
technology and health care weighed on
returns, as did an overweighted allocation
to materials.

6
The top absolute and relative contributor
was our position in Haemonetics (health
care), a global provider of blood and plasma
supplies and services. The stock rose on
better-than-expected earnings stemming
from an uptick in revenue and profits in
the company’s plasma organic segment.
Tenneco (consumer discretionary) was
among the top relative detractors. The
company designs, manufactures, and
distributes clean air and ride performance
products and systems for vehicle applications
worldwide. Tenneco’s decline was related
to its acquisition of Federal-Mogul in a deal
where it paid a premium to buy a company
with lower margins and higher capital
requirements.
Vanguard Quantitative Equity Group
Portfolio Managers:
James Stetler
Binbin Guo, Principal, Head of Alpha
Equity Investments
For the 12 months ended October 31, 2018,
our stock selection models effectively
identified industry group leaders in several
sectors. All five of our model components
boosted relative returns, with growth,
management decisions, and quality
making the most significant contributions.
Stock selection was positive in seven of
11 sectors. Selection in communication
services and consumer discretionary made
significant contributors to performance;
selection in the information technology
sector also boosted returns. Overweight
positions in Etsy, World Wrestling
Entertainment, Square, Inogen, and
Advanced Micro Devices were among
the portfolio’s top performers.
Selection in industrials, health care, and
materials detracted most from performance.
Overweight positions in Nektar Therapeutics,
Argan, and Ultra Clean Holdings held back
results, and underweight positions in
ABIOMED and DexCom were among
the worst performers.
ClearBridge Investments, LLC
Portfolio Managers:
Brian Angerame, Managing Director
Derek Deutsch, CFA, Managing Director
Aram Green, Managing Director
Jeffrey Russell, CFA, Managing Director
The portfolio’s benchmark, the Russell
2500 Growth Index of small- and mid-cap
companies, returned 5.52% for the period.
The fiscal stimulus of the tax cuts led to
robust economic growth and optimism
in the first half of calendar 2018 and
unemployment at the lowest level in
decades. A series of short-term interest
rate increases by the Federal Reserve
pushed up longer-dated bond yields. This
rise, along with a variety of international
trade and political factors, set in motion a
corrective phase in stocks in the final part
of the period.
7
The consumer discretionary sector
contributed most to the portfolio’s relative
returns. Innovators GrubHub and Carvana
are rapidly reinventing and improving
purchasing practices in staid industries.
Burlington Stores and Advance Auto Parts
improved internal execution while benefiting
from buoyant consumer sentiment.
Information technology also contributed to
performance, with Fortinet and New Relic
helped by enterprise spending for security
and analytic solutions. Health care under-
performed modestly, with Mettler-Toledo
International and Medidata Solutions
facing challenges.
We remain optimistic about our holdings.
We are confident in the ability of their
managements to navigate what are, in
some cases, rapidly changing industry
environments and in other cases, huge
opportunities for growth.
Stephens Investment Management
Group, LLC
Portfolio Manager:
Ryan E. Crane, CFA,
Chief Investment Officer
With the Federal Reserve still unwinding a
very accommodative stance, the 12 months
ended October 31, 2018, saw a significant
increase in volatility and dispersion. Interest
rates rose steadily as the economy showed
continued signs of strengthening. Tax reform
legislation spurred an additional increase in
corporate profits and helped stimulate the
economy at large. In response to rising
volatility, investors favored stable growth
companies over those with a cyclical bias
or more debt.
From a style standpoint, this environment
was ideal for our process. We had great
success in consumer discretionary with
companies, such as Burlington Stores and
Lululemon Athletica, that are unharmed by
e-commerce-related competition or that
control distribution and manage their own
e-commerce. Health care was another
bright spot; ABIOMED, a manufacturer of
percutaneous ventricular assist devices,
was our top contributor in this sector.
Over the last several years, and across all
sectors, we have focused on companies
with pricing power. With rates edging up
and some signs of inflation (or at least cost
pressures) appearing, these companies
have fared much better than their counter-
parts, as they have been able to maintain
or even expand profit margins.
Energy stocks were the only drag on
relative and absolute returns. As we had
already reduced our exposure to this sector,
the effect on the portfolio was minimal.
Incrementally, we have become more
constructive on natural gas-related
companies.
8
ArrowMark Partners
Portfolio Managers:
Chad Meade, Partner
Brian Schaub, CFA, Partner
U.S. equity markets advanced solidly
for most of the period, lifted by strong
economic and corporate earnings growth.
Volatility normalized following 2017’s
historically low levels and, as expected,
the Federal Reserve raised the benchmark
lending rate four times. Unemployment
reached its lowest level since 1969,
household spending and business fixed
investment grew, inflation hovered near
2%, and the Tax Cuts and Jobs Act
reduced the corporate tax rate from 35%
to 21%. October, however, brought
significant market turmoil because of
concerns about politics, trade, and the
potential effects of inflation on corporate
profitability. While our outlook for the
economy remains positive, we believe
higher interest rates and inflation could
pressure market multiples. Despite the
October pullback, growth stock valuations
are still stretched, and so we remain
conservatively positioned.
Consumer discretionary holdings contributed
most to returns. Standouts included
Lululemon Athletica and other apparel
names with strong brands and healthy
e-commerce growth. Grand Canyon
Education and other well-positioned
consumer services companies also
shone. In a reversal of last year, our
underweighted allocation to the materials
sector helped relative performance.
Underweighted allocations to consumer
staples and information technology, the
two best-performing market sectors, were
our biggest detractors. Valuations in both
sectors remain well above historical norms,
making it more difficult for us to find
attractively valued investments. Our
overweighted allocation to industrials,
which underperformed the overall market,
also held back performance.

9
Vanguard Explorer Fund Investment Advisors
Fund Assets Managed
Investment Advisor % $ Million Investment Strategy
Wellington ManagementCompany LLP
34 5,073 Conducts research and analysis of individualcompanies to select stocks believed to haveexceptional growth potential relative to their marketvaluations. Each stock is considered individuallybefore purchase, and company developments arecontinually monitored for comparison withexpectations for growth.
Vanguard Quantitative EquityGroup
17 2,583 Employs a quantitative fundamental managementapproach, using models that assess valuation, growthprospects, management decisions, marketsentiment, and earnings and balance-sheet quality ofcompanies as compared with their peers.
ClearBridge Investments, LLC 17 2,557 The firm seeks to invest in cash-generative, qualitygrowth companies that are category leaders (or havethe ability to become market leaders), and displaycapital allocation discipline aimed at fueling long-termsustainable growth. ClearBridge focuses oncash-flow-based metrics to value companies, as wellas revenue or earnings multiples, relying on the mostappropriate valuation metrics for each company. Thisapproach aligns with the team’s style of investing incash-generative, quality growth companies. Theresearch process is disciplined and collaborative, witheach member of the team executing on a sharedinvestment philosophy and process.
Stephens InvestmentManagement Group, LLC
15 2,265 Employs a disciplined, bottom-up investmentselection process that combines rigorousfundamental analysis with quantitative screening toidentify companies with superior earnings growthpotential. The approach screens for core growthstocks and for catalyst stocks. Core growth stockshave strong growth franchises, recurring revenue,and above-average growth rates; catalyst stocks areexperiencing changes that could lead to acceleratedearnings growth.

10
Fund Assets Managed
Investment Advisor % $ Million Investment Strategy
ArrowMark Partners 14 2,159 The firm employs a “risk-before-reward“ investmentstrategy and in-depth fundamental research touncover companies that, in its opinion, can controltheir own economic destiny across marketenvironments. The portfolio managers start byidentifying businesses with strong competitiveadvantages in industries with high barriers to entryand then narrow their focus to companies with largepotential markets and high-quality business modelsfocused on the future. Across this entire investmentprocess, the team takes steps to deliver strongdownside protection, resulting in a diversifiedportfolio of 75–100 stocks.
Cash Investments 3 399 These short-term reserves are invested by Vanguardin equity index products to simulate investment instocks. Each advisor also may maintain a modestcash position.
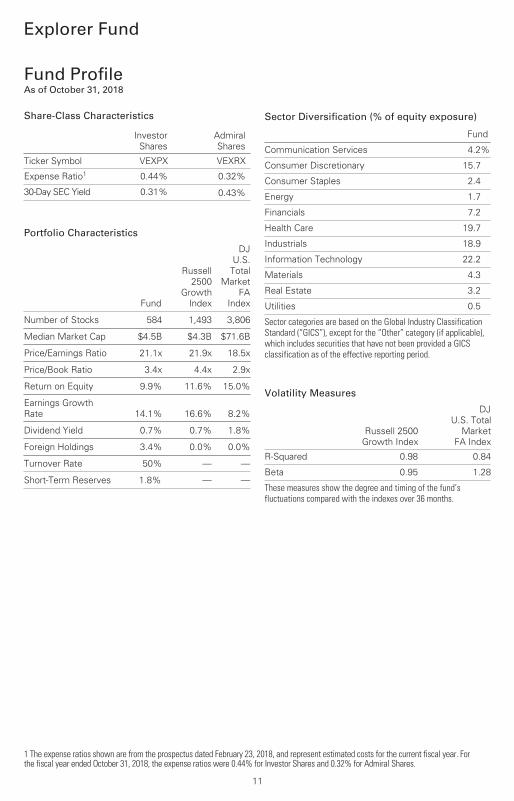
Explorer Fund
Fund ProfileAs of October 31, 2018
1 The expense ratios shown are from the prospectus dated February 23, 2018, and represent estimated costs for the current fiscal year. For the fiscal year ended October 31, 2018, the expense ratios were 0.44% for Investor Shares and 0.32% for Admiral Shares.
11
Portfolio Characteristics
Fund
Russell
2500
Growth
Index
DJ
U.S.
Total
Market
FA
Index
Number of Stocks 584 1,493 3,806
Median Market Cap $4.5B $4.3B $71.6B
Price/Earnings Ratio 21.1x 21.9x 18.5x
Price/Book Ratio 3.4x 4.4x 2.9x
Return on Equity 9.9% 11.6% 15.0%
Earnings Growth
Rate 14.1% 16.6% 8.2%
Dividend Yield 0.7% 0.7% 1.8%
Foreign Holdings 3.4% 0.0% 0.0%
Turnover Rate 50% — —
Short-Term Reserves 1.8% — —
Share-Class Characteristics
InvestorShares
AdmiralShares
Ticker Symbol VEXPX VEXRX
Expense Ratio1 0.44% 0.32%
30-Day SEC Yield 0.31% 0.43%
Sector Diversification (% of equity exposure)
Fund
Communication Services 4.2%
Consumer Discretionary 15.7
Consumer Staples 2.4
Energy 1.7
Financials 7.2
Health Care 19.7
Industrials 18.9
Information Technology 22.2
Materials 4.3
Real Estate 3.2
Utilities 0.5
Sector categories are based on the Global Industry ClassificationStandard (“GICS”), except for the “Other” category (if applicable),which includes securities that have not been provided a GICSclassification as of the effective reporting period.
Volatility Measures
Russell 2500
Growth Index
DJ
U.S. Total
Market
FA Index
R-Squared 0.98 0.84
Beta 0.95 1.28
These measures show the degree and timing of the fund’sfluctuations compared with the indexes over 36 months.
Explorer Fund-1
12
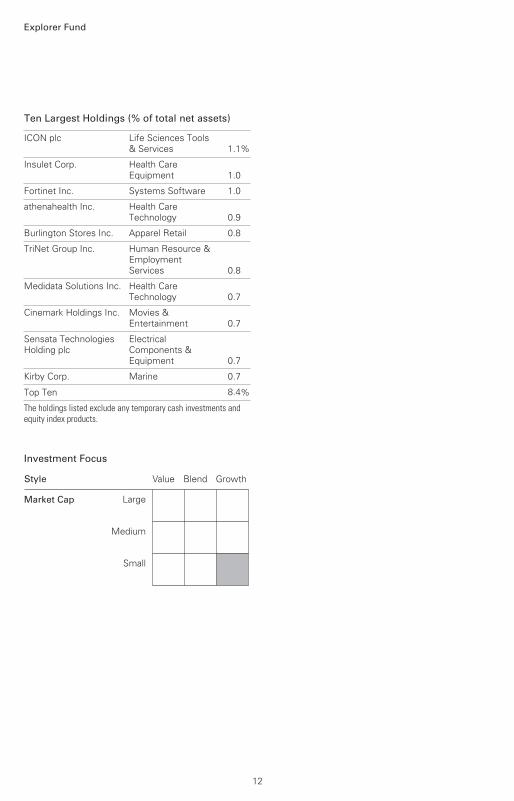
Ten Largest Holdings (% of total net assets)
ICON plc Life Sciences Tools
& Services 1.1%
Insulet Corp. Health Care
Equipment 1.0
Fortinet Inc. Systems Software 1.0
athenahealth Inc. Health Care
Technology 0.9
Burlington Stores Inc. Apparel Retail 0.8
TriNet Group Inc. Human Resource &
Employment
Services 0.8
Medidata Solutions Inc. Health Care
Technology 0.7
Cinemark Holdings Inc. Movies &
Entertainment 0.7
Sensata Technologies
Holding plc
Electrical
Components &
Equipment 0.7
Kirby Corp. Marine 0.7
Top Ten 8.4%
The holdings listed exclude any temporary cash investments andequity index products.
Investment Focus
Market Cap
Value
Large
Medium
Small
Blend Growth Style
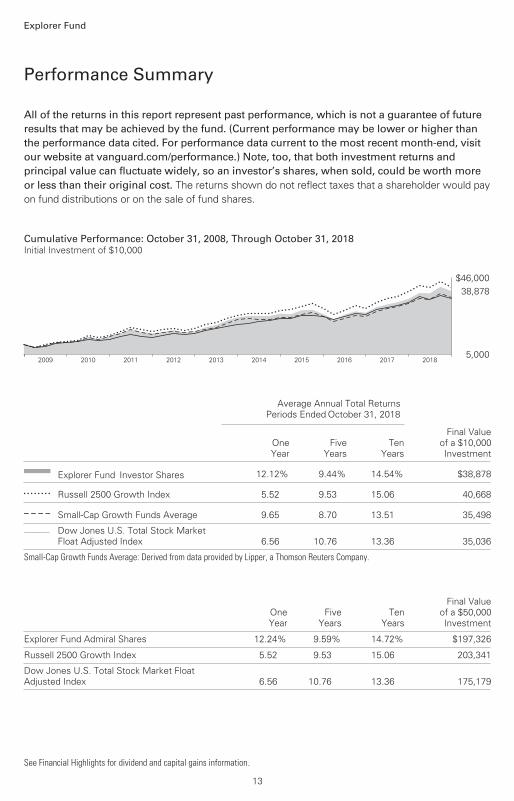
All of the returns in this report represent past performance, which is not a guarantee of future results that may be achieved by the fund. (Current performance may be lower or higher thanthe performance data cited. For performance data current to the most recent month-end, visitour website at vanguard.com/performance.) Note, too, that both investment returns and principal value can fluctuate widely, so an investor’s shares, when sold, could be worth more or less than their original cost. The returns shown do not reflect taxes that a shareholder would pay
on fund distributions or on the sale of fund shares.
Explorer Fund
Performance Summary
See Financial Highlights for dividend and capital gains information.
13
Cumulative Performance: October 31, 2008, Through October 31, 2018Initial Investment of $10,000
2018201720162015201420132012201120102009
$46,000
5,000
38,878
Average Annual Total Returns
Periods Ended October 31, 2018
OneYear
FiveYears
TenYears
Final Valueof a $10,000Investment
Explorer Fund*Investor Shares 12.12% 9.44% 14.54% $38,878
• • • • • • • • Russell 2500 Growth Index 5.52 9.53 15.06 40,668
– – – – Small-Cap Growth Funds Average 9.65 8.70 13.51 35,498________ Dow Jones U.S. Total Stock Market
Float Adjusted Index 6.56 10.76 13.36 35,036
Small-Cap Growth Funds Average: Derived from data provided by Lipper, a Thomson Reuters Company.
OneYear
FiveYears
TenYears
Final Valueof a $50,000Investment
Explorer Fund Admiral Shares 12.24% 9.59% 14.72% $197,326
Russell 2500 Growth Index 5.52 9.53 15.06 203,341
Dow Jones U.S. Total Stock Market FloatAdjusted Index 6.56 10.76 13.36 175,179
Explorer Fund
14
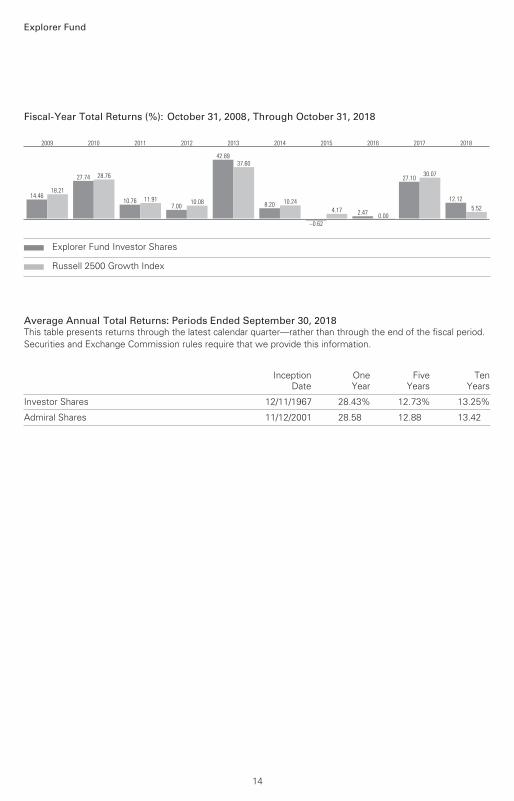
Fiscal-Year Total Returns (%): October 31, 2008, Through October 31, 2018
14.4618.21
2009
27.74 28.76
2010
10.76 11.91
2011
7.0010.08
2012
42.8937.60
2013
8.20 10.24
2014
–0.62
4.17
2015
2.470.00
2016
27.1030.07
2017
12.12
5.52
2018
Explorer Fund Investor Shares
Russell 2500 Growth Index
Average Annual Total Returns: Periods Ended September 30, 2018This table presents returns through the latest calendar quarter—rather than through the end of the fiscal period.Securities and Exchange Commission rules require that we provide this information.
InceptionDate
OneYear
FiveYears
TenYears
Investor Shares 12/11/1967 28.43% 12.73% 13.25%
Admiral Shares 11/12/2001 28.58 12.88 13.42
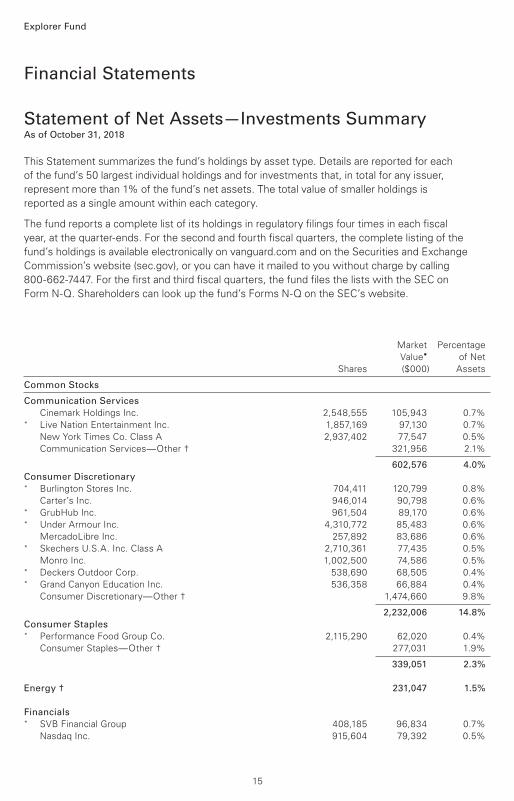
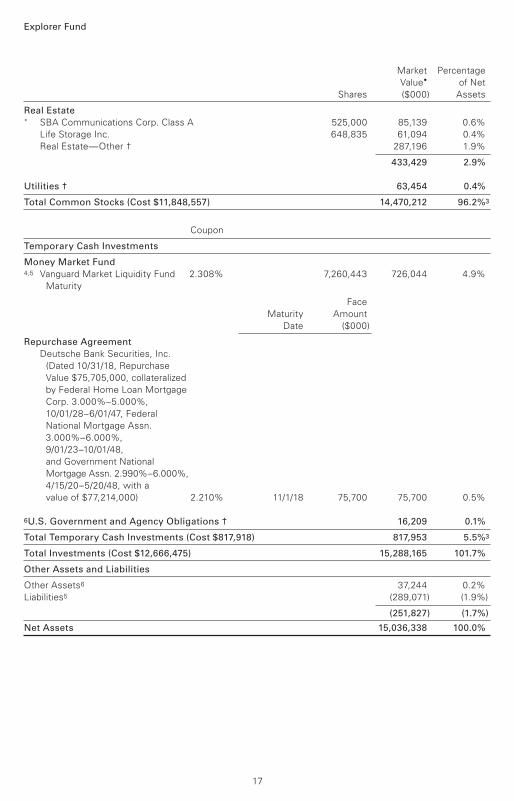
Financial Statements
Statement of Net Assets—Investments SummaryAs of October 31, 2018
Explorer Fund
Market Percentage
Value• of Net
Shares ($000) Assets
Common Stocks
Communication Services
Cinemark Holdings Inc. 2,548,555 105,943 0.7% * Live Nation Entertainment Inc. 1,857,169 97,130 0.7%
New York Times Co. Class A 2,937,402 77,547 0.5%
Communication Services—Other † 321,956 2.1%
602,576 4.0%
Consumer Discretionary* Burlington Stores Inc. 704,411 120,799 0.8%
Carter’s Inc. 946,014 90,798 0.6% * GrubHub Inc. 961,504 89,170 0.6% * Under Armour Inc. 4,310,772 85,483 0.6%
MercadoLibre Inc. 257,892 83,686 0.6% * Skechers U.S.A. Inc. Class A 2,710,361 77,435 0.5%
Monro Inc. 1,002,500 74,586 0.5% * Deckers Outdoor Corp. 538,690 68,505 0.4% * Grand Canyon Education Inc. 536,358 66,884 0.4%
Consumer Discretionary—Other † 1,474,660 9.8%
2,232,006 14.8%
Consumer Staples* Performance Food Group Co. 2,115,290 62,020 0.4%
Consumer Staples—Other † 277,031 1.9%
339,051 2.3%
Energy † 231,047 1.5%
Financials* SVB Financial Group 408,185 96,834 0.7%
Nasdaq Inc. 915,604 79,392 0.5%
This Statement summarizes the fund’s holdings by asset type. Details are reported for each
of the fund’s 50 largest individual holdings and for investments that, in total for any issuer,
represent more than 1% of the fund’s net assets. The total value of smaller holdings is
reported as a single amount within each category.
The fund reports a complete list of its holdings in regulatory filings four times in each fiscal
year, at the quarter-ends. For the second and fourth fiscal quarters, the complete listing of the
fund’s holdings is available electronically on vanguard.com and on the Securities and Exchange
Commission’s website (sec.gov), or you can have it mailed to you without charge by calling
800-662-7447. For the first and third fiscal quarters, the fund files the lists with the SEC on
Form N-Q. Shareholders can look up the fund’s Forms N-Q on the SEC’s website.
15

Explorer Fund
Assured Guaranty Ltd. 1,682,439 67,264 0.5%
Assurant Inc. 652,181 63,399 0.4%
Financials—Other † 692,267 4.6%
999,156 6.7%
Health Care* ICON plc 1,219,109 168,335 1.1% * Insulet Corp. 1,687,805 148,881 1.0% * athenahealth Inc. 1,073,278 136,886 0.9% * Medidata Solutions Inc. 1,520,494 106,891 0.7% * Haemonetics Corp. 682,851 71,337 0.5% * Amedisys Inc. 613,823 67,521 0.5% * Globus Medical Inc. 1,230,133 65,013 0.4% * Mettler-Toledo International Inc. 118,065 64,560 0.4%
Health Care—Other † 1,982,283 13.2%
2,811,707 18.7%
Industrials* TriNet Group Inc. 2,444,193 114,853 0.8% * Sensata Technologies Holding plc 2,165,465 101,560 0.7% * Kirby Corp. 1,372,199 98,716 0.6%
John Bean Technologies Corp. 855,267 88,922 0.6% * Teledyne Technologies Inc. 359,445 79,538 0.5%
Woodward Inc. 1,074,199 79,104 0.5% * Trex Co. Inc. 1,205,100 73,873 0.5% * Copart Inc. 1,448,000 70,822 0.5% * AerCap Holdings NV 1,373,256 68,773 0.5% * Chart Industries Inc. 898,800 61,163 0.4%
HEICO Corp. Class A 911,577 60,766 0.4%
Industrials—Other † 1,796,406 11.9%
2,694,496 17.9%
Information Technology* Fortinet Inc. 1,781,873 146,434 1.0% * New Relic Inc. 1,027,530 91,707 0.6% * 2U Inc. 1,451,265 91,299 0.6% * Cadence Design Systems Inc. 2,003,188 89,282 0.6% *,1 Cardtronics plc Class A 2,925,333 79,452 0.6% * GoDaddy Inc. Class A 1,077,377 78,832 0.5% * Cornerstone OnDemand Inc. 1,585,278 78,075 0.5%
CDW Corp. 749,626 67,474 0.5% * First Solar Inc. 1,540,510 64,393 0.4% * Tableau Software Inc. Class A 590,004 62,942 0.4% * Euronet Worldwide Inc. 564,984 62,815 0.4% * Ciena Corp. 1,940,576 60,662 0.4%
Information Technology—Other † 2,195,168 14.6%
3,168,535 21.1%
Materials † 602,784 4.0%
Other^,2 Vanguard Small-Cap ETF 1,561,302 228,153 1.5% ^,2 Vanguard Small-Cap Growth ETF 384,700 63,818 0.4%
291,971 1.9%
Market Percentage
Value• of Net
Shares ($000) Assets
16
Explorer Fund
Real Estate* SBA Communications Corp. Class A 525,000 85,139 0.6%
Life Storage Inc. 648,835 61,094 0.4%
Real Estate—Other † 287,196 1.9%
433,429 2.9%
Utilities † 63,454 0.4%
Total Common Stocks (Cost $11,848,557) 14,470,212 96.2% 3
Coupon
Temporary Cash Investments
Money Market Fund4,5 Vanguard Market Liquidity Fund 2.308% 7,260,443 726,044 4.9%
Maturity
Face
Maturity Amount
Date ($000)
Repurchase Agreement
Deutsche Bank Securities, Inc.
(Dated 10/31/18, Repurchase
Value $75,705,000, collateralized
by Federal Home Loan Mortgage
Corp. 3.000%–5.000%,
10/01/28–6/01/47, Federal
National Mortgage Assn.
3.000%–6.000%,
9/01/23–10/01/48,
and Government National
Mortgage Assn. 2.990%–6.000%,
4/15/20–5/20/48, with a
value of $77,214,000) 2.210% 11/1/18 75,700 75,700 0.5%
6U.S. Government and Agency Obligations † 16,209 0.1%
Total Temporary Cash Investments (Cost $817,918) 817,953 5.5% 3
Total Investments (Cost $12,666,475) 15,288,165 101.7%
Other Assets and Liabilities
Other Assets6 37,244 0.2%
Liabilities5 (289,071) (1.9%)
(251,827) (1.7%)
Net Assets 15,036,338 100.0%
Market Percentage
Value• of Net
Shares ($000) Assets
17
Explorer Fund
Amount
($000)
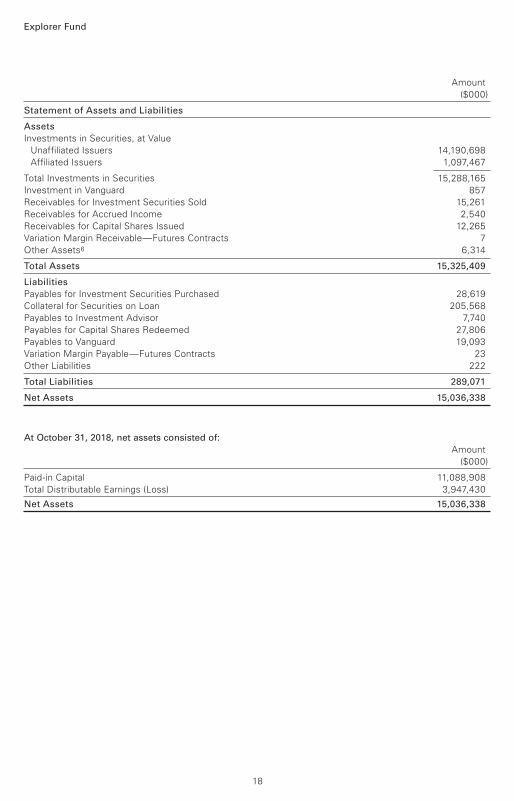
Statement of Assets and Liabilities
Assets
Investments in Securities, at Value
Unaffiliated Issuers 14,190,698
Affiliated Issuers 1,097,467
Total Investments in Securities 15,288,165
Investment in Vanguard 857
Receivables for Investment Securities Sold 15,261
Receivables for Accrued Income 2,540
Receivables for Capital Shares Issued 12,265
Variation Margin Receivable—Futures Contracts 7
Other Assets6 6,314
Total Assets 15,325,409
Liabilities
Payables for Investment Securities Purchased 28,619
Collateral for Securities on Loan 205,568
Payables to Investment Advisor 7,740
Payables for Capital Shares Redeemed 27,806
Payables to Vanguard 19,093
Variation Margin Payable—Futures Contracts 23
Other Liabilities 222
Total Liabilities 289,071
Net Assets 15,036,338
At October 31, 2018, net assets consisted of:
Amount
($000)
Paid-in Capital 11,088,908
Total Distributable Earnings (Loss) 3,947,430
Net Assets 15,036,338
18

Explorer Fund
Amount
($000)
See accompanying Notes, which are an integral part of the Financial Statements.
Investor Shares—Net Assets
Applicable to 33,449,797 outstanding $.001 par value shares of
beneficial interest (unlimited authorization) 3,420,166
Net Asset Value Per Share—Investor Shares $102.25
Admiral Shares—Net Assets
Applicable to 121,967,030 outstanding $.001 par value shares of
beneficial interest (unlimited authorization) 11,616,172
Net Asset Value Per Share—Admiral Shares $95.24
• See Note A in Notes to Financial Statements.
* Non-income-producing security.
^ Includes partial security positions on loan to broker-dealers. The total value of securities on loan is $199,760,000.
† Represents the aggregate value, by category, of securities that are not among the 50 largest holdings and, in total for any issuer, represent 1% or less of net assets.
1 Considered an affiliated company of the fund as the fund owns more than 5% of the outstanding voting securities of such company.
2 Considered an affiliated company of the fund as the issuer is another member of The Vanguard Group.
3 The fund invests a portion of its cash reserves in equity markets through the use of index futures contracts. After giving effect to futures investments, the fund’s effective common stock and temporary cash investment positions represent 98.5% and 3.2%, respectively, of net assets.
4 Affiliated money market fund available only to Vanguard funds and certain trusts and accounts managed by Vanguard. Rate shown is the 7-day yield.
5 Includes $205,568,000 of collateral received for securities on loan.
6 Securities with a value of $15,619,000 and cash of $1,487,000 have been segregated as initial margin for open futures contracts.
Derivative Financial Instruments Outstanding as of Period End
Futures Contracts
($000)
Value and
Number of Unrealized
Long (Short) Notional Appreciation
Expiration Contracts Amount (Depreciation)
Long Futures Contracts
E-mini Russell 2000 Index December 2018 4,517 341,463 (44,859)
19

Year Ended
October 31, 2018
($000)
Investment Income
Income
Dividends Received—Unaffiliated Issuers1 87,991
Dividends Received—Affiliated Issuers 2,929
Interest Received—Unaffiliated Issuers 1,263
Interest Received—Affiliated Issuers 8,794
Securities Lending—Net 9,013
Total Income 109,990
Expenses
Investment Advisory Fees—Note B
Basic Fee 25,314
Performance Adjustment 2,247
The Vanguard Group—Note C
Management and Administrative—Investor Shares 8,532
Management and Administrative—Admiral Shares 13,677
Marketing and Distribution—Investor Shares 487
Marketing and Distribution—Admiral Shares 607
Custodian Fees 143
Auditing Fees 41
Shareholders’ Reports and Proxy—Investor Shares 54
Shareholders’ Reports and Proxy—Admiral Shares 96
Trustees’ Fees and Expenses 24
Total Expenses 51,222
Net Investment Income 58,768
Realized Net Gain (Loss)
Investment Securities Sold—Unaffiliated Issuers 1,394,357
Investment Securities Sold—Affiliated Issuers 5,154
Futures Contracts 37,660
Foreign Currencies (91)
Realized Net Gain (Loss) 1,437,080
Change in Unrealized Appreciation (Depreciation)
Investment Securities—Unaffiliated Issuers 59,997
Investment Securities—Affiliated Issuers 3,249
Futures Contracts (49,135)
Foreign Currencies (1)
Change in Unrealized Appreciation (Depreciation) 14,110
Net Increase (Decrease) in Net Assets Resulting from Operations 1,509,958
1 Dividends are net of foreign withholding taxes of $634,000.
Statement of Operations
Explorer Fund
See accompanying Notes, which are an integral part of the Financial Statements.
20
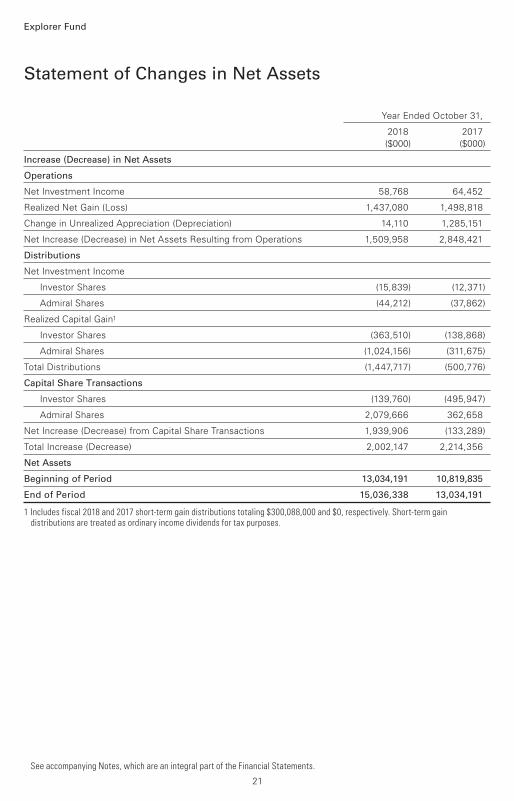
Statement of Changes in Net Assets
Explorer Fund
See accompanying Notes, which are an integral part of the Financial Statements.
Year Ended October 31,
2018 2017
($000) ($000)
Increase (Decrease) in Net Assets
Operations
Net Investment Income 58,768 64,452
Realized Net Gain (Loss) 1,437,080 1,498,818
Change in Unrealized Appreciation (Depreciation) 14,110 1,285,151
Net Increase (Decrease) in Net Assets Resulting from Operations 1,509,958 2,848,421
Distributions
Net Investment Income
Investor Shares (15,839) (12,371)
Admiral Shares (44,212) (37,862)
Realized Capital Gain1
Investor Shares (363,510) (138,868)
Admiral Shares (1,024,156) (311,675)
Total Distributions (1,447,717) (500,776)
Capital Share Transactions
Investor Shares (139,760) (495,947)
Admiral Shares 2,079,666 362,658
Net Increase (Decrease) from Capital Share Transactions 1,939,906 (133,289)
Total Increase (Decrease) 2,002,147 2,214,356
Net Assets
Beginning of Period 13,034,191 10,819,835
End of Period 15,036,338 13,034,191
1 Includes fiscal 2018 and 2017 short-term gain distributions totaling $300,088,000 and $0, respectively. Short-term gain distributions are treated as ordinary income dividends for tax purposes.
21
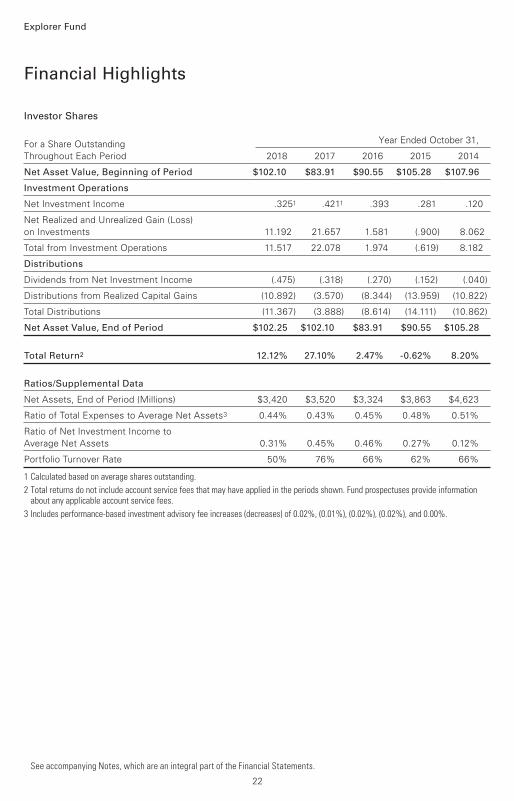
Investor Shares
For a Share Outstanding Year Ended October 31,
Throughout Each Period 2018 2017 2016 2015 2014
Net Asset Value, Beginning of Period $102.10 $83.91 $90.55 $105.28 $107.96
Investment Operations
Net Investment Income .3251 .4211 .393 .281 .120
Net Realized and Unrealized Gain (Loss)
on Investments 11.192 21.657 1.581 (.900) 8.062
Total from Investment Operations 11.517 22.078 1.974 (.619) 8.182
Distributions
Dividends from Net Investment Income (.475) (.318) (.270) (.152) (.040)
Distributions from Realized Capital Gains (10.892) (3.570) (8.344) (13.959) (10.822)
Total Distributions (11.367) (3.888) (8.614) (14.111) (10.862)
Net Asset Value, End of Period $102.25 $102.10 $83.91 $90.55 $105.28
Total Return2 12.12% 27.10% 2.47% -0.62% 8.20%
Ratios/Supplemental Data
Net Assets, End of Period (Millions) $3,420 $3,520 $3,324 $3,863 $4,623
Ratio of Total Expenses to Average Net Assets3 0.44% 0.43% 0.45% 0.48% 0.51%
Ratio of Net Investment Income to
Average Net Assets 0.31% 0.45% 0.46% 0.27% 0.12%
Portfolio Turnover Rate 50% 76% 66% 62% 66%
1 Calculated based on average shares outstanding.
2 Total returns do not include account service fees that may have applied in the periods shown. Fund prospectuses provide information about any applicable account service fees.
3 Includes performance-based investment advisory fee increases (decreases) of 0.02%, (0.01%), (0.02%), (0.02%), and 0.00%.
Financial Highlights
See accompanying Notes, which are an integral part of the Financial Statements.
Explorer Fund
22

Admiral Shares
For a Share Outstanding Year Ended October 31,
Throughout Each Period 2018 2017 2016 2015 2014
Net Asset Value, Beginning of Period $94.99 $78.07 $84.28 $98.03 $100.54
Investment Operations
Net Investment Income .4181 .4951 .473 .402 .302
Net Realized and Unrealized Gain (Loss)
on Investments 10.405 20.145 1.455 (.853) 7.466
Total from Investment Operations 10.823 20.640 1.928 (.451) 7.768
Distributions
Dividends from Net Investment Income (.438) (.403) (.383) (.324) (.216)
Distributions from Realized Capital Gains (10.135) (3.317) (7.755) (12.975) (10.062)
Total Distributions (10.573) (3.720) (8.138) (13.299) (10.278)
Net Asset Value, End of Period $95.24 $94.99 $78.07 $84.28 $98.03
Total Return2 12.24% 27.25% 2.60% -0.48% 8.37%
Ratios/Supplemental Data
Net Assets, End of Period (Millions) $11,616 $9,514 $7,496 $7,577 $7,670
Ratio of Total Expenses to Average Net Assets3 0.32% 0.31% 0.33% 0.34% 0.35%
Ratio of Net Investment Income to
Average Net Assets 0.43% 0.57% 0.58% 0.41% 0.28%
Portfolio Turnover Rate 50% 76% 66% 62% 66%
1 Calculated based on average shares outstanding.
2 Total returns do not include account service fees that may have applied in the periods shown. Fund prospectuses provide information about any applicable account service fees.
3 Includes performance-based investment advisory fee increases (decreases) of 0.02%, (0.01%), (0.02%), (0.02%), and 0.00%.
Financial Highlights
See accompanying Notes, which are an integral part of the Financial Statements.
Explorer Fund
23

Notes to Financial Statements
Explorer Fund
Vanguard Explorer Fund is registered under the Investment Company Act of 1940 as an open-end
investment company, or mutual fund. The fund offers two classes of shares: Investor Shares and
Admiral Shares. Investor Shares are available to any investor who meets the fund’s minimum
purchase requirements. Admiral Shares are designed for investors who meet certain administrative,
service, and account-size criteria.
A. The following significant accounting policies conform to generally accepted accounting
principles for U.S. investment companies. The fund consistently follows such policies in preparing
its financial statements.
1. Security Valuation: Securities are valued as of the close of trading on the New York Stock
Exchange (generally 4 p.m., Eastern time) on the valuation date. Equity securities are valued at the
latest quoted sales prices or official closing prices taken from the primary market in which each
security trades; such securities not traded on the valuation date are valued at the mean of the latest
quoted bid and asked prices. Securities for which market quotations are not readily available, or
whose values have been affected by events occurring before the fund’s pricing time but after the
close of the securities’ primary markets, are valued at their fair values calculated according to
procedures adopted by the board of trustees. These procedures include obtaining quotations from
an independent pricing service, monitoring news to identify significant market- or security-specific
events, and evaluating changes in the values of foreign market proxies (for example, ADRs, futures
contracts, or exchange-traded funds), between the time the foreign markets close and the fund’s
pricing time. When fair-value pricing is employed, the prices of securities used by a fund to
calculate its net asset value may differ from quoted or published prices for the same securities.
Investments in Vanguard Market Liquidity Fund are valued at that fund’s net asset value. Temporary
cash investments are valued using the latest bid prices or using valuations based on a matrix
system (which considers such factors as security prices, yields, maturities, and ratings), both as
furnished by independent pricing services.
2. Foreign Currency: Securities and other assets and liabilities denominated in foreign currencies
are translated into U.S. dollars using exchange rates obtained from an independent third party as of
the fund’s pricing time on the valuation date. Realized gains (losses) and unrealized appreciation
(depreciation) on investment securities include the effects of changes in exchange rates since the
securities were purchased, combined with the effects of changes in security prices. Fluctuations in
the value of other assets and liabilities resulting from changes in exchange rates are recorded as
unrealized foreign currency gains (losses) until the assets or liabilities are settled in cash, at which
time they are recorded as realized foreign currency gains (losses).
3. Futures Contracts: The fund uses index futures contracts to a limited extent, with the objective
of maintaining full exposure to the stock market while maintaining liquidity. The fund may purchase
or sell futures contracts to achieve a desired level of investment, whether to accommodate
portfolio turnover or cash flows from capital share transactions. The primary risks associated with
the use of futures contracts are imperfect correlation between changes in market values of stocks
held by the fund and the prices of futures contracts, and the possibility of an illiquid market.
Counterparty risk involving futures is mitigated because a regulated clearinghouse is the
counterparty instead of the clearing broker. To further mitigate counterparty risk, the fund trades
futures contracts on an exchange, monitors the financial strength of its clearing brokers and
clearinghouse, and has entered into clearing agreements with its clearing brokers. The
24

Explorer Fund
clearinghouse imposes initial margin requirements to secure the fund’s performance and requires
daily settlement of variation margin representing changes in the market value of each contract. Any
assets pledged as initial margin for open contracts are noted in the Statement of Net Assets.
Futures contracts are valued at their quoted daily settlement prices. The notional amounts of the
contracts are not recorded in the Statement of Net Assets. Fluctuations in the value of the
contracts are recorded in the Statement of Assets and Liabilities as an asset (liability) and in the
Statement of Operations as unrealized appreciation (depreciation) until the contracts are closed,
when they are recorded as realized futures gains (losses).
During the year ended October 31, 2018, the fund’s average investments in long and short futures
contracts represented 2% and 0% of net assets, respectively, based on the average of the notional
amounts at each quarter-end during the period.
4. Repurchase Agreements: The fund enters into repurchase agreements with institutional
counterparties. Securities pledged as collateral to the fund under repurchase agreements are held
by a custodian bank until the agreements mature, and in the absence of a default, such collateral
cannot be repledged, resold, or rehypothecated. Each agreement requires that the market value of
the collateral be sufficient to cover payments of interest and principal. The fund further mitigates its
counterparty risk by entering into repurchase agreements only with a diverse group of prequalified
counterparties, monitoring their financial strength, and entering into master repurchase agreements
with its counterparties. The master repurchase agreements provide that, in the event of a
counterparty’s default (including bankruptcy), the fund may terminate any repurchase agreements
with that counterparty, determine the net amount owed, and sell or retain the collateral up to the
net amount owed to the fund. Such action may be subject to legal proceedings, which may delay or
limit the disposition of collateral.
5. Federal Income Taxes: The fund intends to continue to qualify as a regulated investment
company and distribute all of its taxable income. Management has analyzed the fund’s tax positions
taken for all open federal income tax years (October 31, 2015–2018), and has concluded that no
provision for federal income tax is required in the fund’s financial statements.
6. Distributions: Distributions to shareholders are recorded on the ex-dividend date. Distributions
are determined on a tax basis and may differ from net investment income and realized capital gains
for financial reporting purposes.
7. Securities Lending: To earn additional income, the fund lends its securities to qualified
institutional borrowers. Security loans are subject to termination by the fund at any time, and are
required to be secured at all times by collateral in an amount at least equal to the market value of
securities loaned. Daily market fluctuations could cause the value of loaned securities to be more
or less than the value of the collateral received. When this occurs, the collateral is adjusted and
settled before the opening of the market on the next business day. The fund further mitigates its
counterparty risk by entering into securities lending transactions only with a diverse group of
prequalified counterparties, monitoring their financial strength, and entering into master securities
lending agreements with its counterparties. The master securities lending agreements provide that,
in the event of a counterparty’s default (including bankruptcy), the fund may terminate any loans
with that borrower, determine the net amount owed, and sell or retain the collateral up to the net
amount owed to the fund; however, such actions may be subject to legal proceedings. While
collateral mitigates counterparty risk, in the event of a default, the fund may experience delays and
costs in recovering the securities loaned. The fund invests cash collateral received in Vanguard
25

Explorer Fund
Market Liquidity Fund, and records a liability in the Statement of Assets and Liabilities for the return
of the collateral, during the period the securities are on loan. Securities lending income represents
fees charged to borrowers plus income earned on invested cash collateral, less expenses
associated with the loan. During the term of the loan, the fund is entitled to all distributions made
on or in respect of the loaned securities.
8. Credit Facility: The fund and certain other funds managed by The Vanguard Group (“Vanguard”)
participate in a $3.1 billion committed credit facility provided by a syndicate of lenders pursuant to a
credit agreement that may be renewed annually; each fund is individually liable for its borrowings, if
any, under the credit facility. Borrowings may be utilized for temporary and emergency purposes,
and are subject to the fund’s regulatory and contractual borrowing restrictions. The participating
funds are charged administrative fees and an annual commitment fee of 0.10% of the undrawn
amount of the facility; these fees are allocated to the funds based on a method approved by the
fund’s board of trustees and included in Management and Administrative expenses on the fund’s
Statement of Operations. Any borrowings under this facility bear interest at a rate based upon the
higher of the one-month London Interbank Offered Rate, federal funds effective rate, or overnight
bank funding rate plus an agreed-upon spread.
The fund had no borrowings outstanding at October 31, 2018, or at any time during the period
then ended.
9. Other: Dividend income is recorded on the ex-dividend date. Interest income includes income
distributions received from Vanguard Market Liquidity Fund and is accrued daily. Premiums and
discounts on debt securities purchased are amortized and accreted, respectively, to interest income
over the lives of the respective securities. Security transactions are accounted for on the date
securities are bought or sold. Costs used to determine realized gains (losses) on the sale of
investment securities are those of the specific securities sold.
Each class of shares has equal rights as to assets and earnings, except that each class separately
bears certain class-specific expenses related to maintenance of shareholder accounts (included in
Management and Administrative expenses), shareholder reporting, and the proxy. Marketing and
distribution expenses are allocated to each class of shares based on a method approved by the
board of trustees. Income, other non-class-specific expenses, and gains and losses on investments
are allocated to each class of shares based on its relative net assets.
B. The investment advisory firms Wellington Management Company LLP, ClearBridge Investments,
LLC, Stephens Investment Management Group, LLC, and ArrowMark Colorado Holdings, LLC,
each provide investment advisory services to a portion of the fund for a fee calculated at an
annual percentage rate of average net assets managed by the advisor. The basic fee of Wellington
Management Company LLP is subject to quarterly adjustments based on performance relative to
the Russell 2500 Growth Index for the preceding three years. In accordance with the advisory
contract entered into with ClearBridge Investments, LLC, beginning May 1, 2018, the basic fee is
subject to quarterly adjustments based on performance relative to the Russell 2500 Growth Index
since April 30, 2017. The basic fee of Stephens Investment Management Group, LLC, is subject to
quarterly adjustments based on performance relative to the Russell 2500 Growth Index for the
preceding five years. The basic fee of ArrowMark Colorado Holdings, LLC, is subject to quarterly
adjustments based on performance relative to the Russell 2500 Growth Index since July 31, 2014.
Vanguard provides investment advisory services to a portion of the fund as described below; the
fund paid Vanguard advisory fees of $1,230,000 for the year ended October 31, 2018.
26
Explorer Fund
For the year ended October 31, 2018, the aggregate investment advisory fee paid to all advisors
represented an effective annual basic rate of 0.17% of the fund’s average net assets, before an
increase of $2,247,000 (0.02%) based on performance.
C. In accordance with the terms of a Funds’ Service Agreement (the “FSA”) between Vanguard
and the fund, Vanguard furnishes to the fund investment advisory, corporate management,
administrative, marketing, and distribution services at Vanguard’s cost of operations (as defined by
the FSA). These costs of operations are allocated to the fund based on methods and guidelines
approved by the board of trustees. Vanguard does not require reimbursement in the current period
for certain costs of operations (such as deferred compensation/benefits and risk/insurance costs);
the fund’s liability for these costs of operations is included in Payables to Vanguard on the
Statement of Assets and Liabilities. All other costs of operations payable to Vanguard are generally
settled twice a month.
Upon the request of Vanguard, the fund may invest up to 0.40% of its net assets as capital in
Vanguard. At October 31, 2018, the fund had contributed to Vanguard capital in the amount of
$857,000, representing 0.01% of the fund’s net assets and 0.34% of Vanguard’s capitalization.
The fund’s trustees and officers are also directors and employees, respectively, of Vanguard.
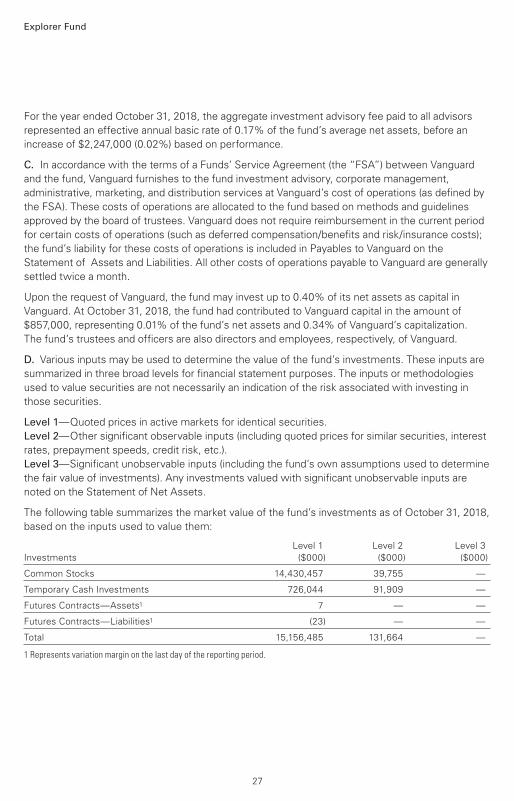
D. Various inputs may be used to determine the value of the fund’s investments. These inputs are
summarized in three broad levels for financial statement purposes. The inputs or methodologies
used to value securities are not necessarily an indication of the risk associated with investing in
those securities.
Level 1—Quoted prices in active markets for identical securities.
Level 2—Other significant observable inputs (including quoted prices for similar securities, interest
rates, prepayment speeds, credit risk, etc.).
Level 3—Significant unobservable inputs (including the fund’s own assumptions used to determine
the fair value of investments). Any investments valued with significant unobservable inputs are
noted on the Statement of Net Assets.
The following table summarizes the market value of the fund’s investments as of October 31, 2018,
based on the inputs used to value them:
Level 1 Level 2 Level 3
Investments ($000) ($000) ($000)
Common Stocks 14,430,457 39,755 —
Temporary Cash Investments 726,044 91,909 —
Futures Contracts—Assets1 7 — —
Futures Contracts—Liabilities1 (23) — —
Total 15,156,485 131,664 —
1 Represents variation margin on the last day of the reporting period.
27
28
Explorer Fund
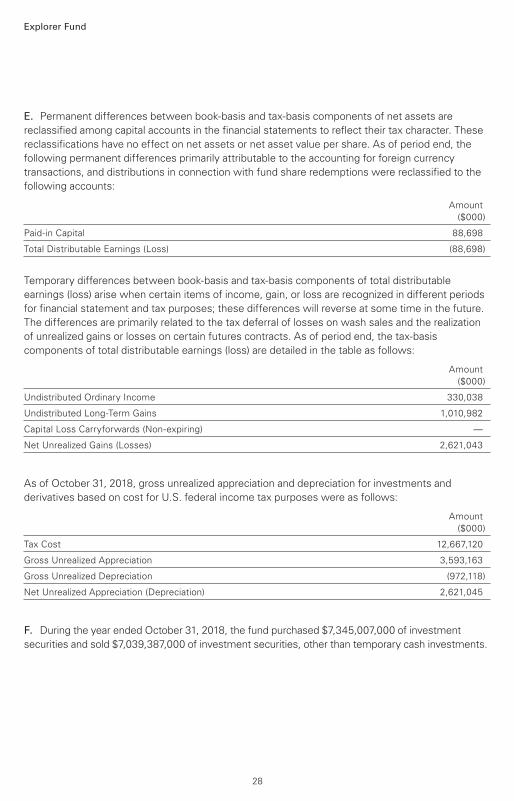
E. Permanent differences between book-basis and tax-basis components of net assets are
reclassified among capital accounts in the financial statements to reflect their tax character. These
reclassifications have no effect on net assets or net asset value per share. As of period end, the
following permanent differences primarily attributable to the accounting for foreign currency
transactions, and distributions in connection with fund share redemptions were reclassified to the
following accounts:
Amount
($000)
Paid-in Capital 88,698
Total Distributable Earnings (Loss) (88,698)
Temporary differences between book-basis and tax-basis components of total distributable
earnings (loss) arise when certain items of income, gain, or loss are recognized in different periods
for financial statement and tax purposes; these differences will reverse at some time in the future.
The differences are primarily related to the tax deferral of losses on wash sales and the realization
of unrealized gains or losses on certain futures contracts. As of period end, the tax-basis
components of total distributable earnings (loss) are detailed in the table as follows:
Amount
($000)
Undistributed Ordinary Income 330,038
Undistributed Long-Term Gains 1,010,982
Capital Loss Carryforwards (Non-expiring) —
Net Unrealized Gains (Losses) 2,621,043
As of October 31, 2018, gross unrealized appreciation and depreciation for investments and
derivatives based on cost for U.S. federal income tax purposes were as follows:
Amount
($000)
Tax Cost 12,667,120
Gross Unrealized Appreciation 3,593,163
Gross Unrealized Depreciation (972,118)
Net Unrealized Appreciation (Depreciation) 2,621,045
F. During the year ended October 31, 2018, the fund purchased $7,345,007,000 of investment
securities and sold $7,039,387,000 of investment securities, other than temporary cash investments.

Explorer Fund
G. Capital share transactions for each class of shares were:
Year Ended October 31,
2018 2017
Amount Shares Amount Shares
($000) (000) ($000) (000)
Investor Shares
Issued 679,093 6,415 241,157 2,593
Issued in Lieu of Cash Distributions 372,091 3,912 148,985 1,706
Redeemed (1,190,944) (11,352) (886,089) (9,437)
Net Increase (Decrease)—Investor Shares (139,760) (1,025) (495,947) (5,138)
Admiral Shares
Issued 2,622,158 26,577 1,314,009 15,041
Issued in Lieu of Cash Distributions 995,253 11,246 325,490 4,011
Redeemed (1,537,745) (16,017) (1,276,841) (14,911)
Net Increase (Decrease)—Admiral Shares 2,079,666 21,806 362,658 4,141
29

Explorer Fund
H. Certain of the fund’s investments are in companies that are considered to be affiliated
companies of the fund because the fund owns more than 5% of the outstanding voting securities
of the company or the issuer is another member of The Vanguard Group. Transactions during the
period in securities of these companies were as follows:
Current Period Transactions
Oct. 31, Proceeds Realized Oct. 31,
2017 from Net Change in Capital Gain 2018
Market Purchases Securities Gain Unrealized Distributions Market
Value at Cost Sold (Loss) App. (Dep.) Income Received Value
($000) ($000) ($000) ($000) ($000) ($000) ($000) ($000)
Cardtronics plc
Class A NA1 23,935 — — 8,365 — — 79,452
Kindred Healthcare
Inc. 30,653 — 45,746 (4,877) 19,970 — — —
Switch Inc. NA2 26,615 1,667 (387) (15,854) 90 — NA2
Vanguard Market
Liquidity Fund 565,395 NA3 NA3 (107) 35 8,794 — 726,044
Vanguard
Small-Cap ETF 68,655 704,215 542,243 10,525 (12,999) 2,332 — 228,153
Vanguard
Small-Cap Growth
ETF 60,086 — — — 3,732 507 — 63,818
Total 724,789 5,154 3,249 11,723 — 1,097,467
1 Not applicable—at October 31, 2017, the issuer was not an affiliated company of the fund.
2 Not applicable—at October 31, 2017, and October 31, 2018, the issuer was not an affiliated company of the fund, but it was affiliated during the year.
3 Not applicable—purchases and sales are for temporary cash investment purposes.
I. Management has determined that no events or transactions occurred subsequent to October 31,
2018, that would require recognition or disclosure in these financial statements.
30

To the Board of Trustees and Shareholders of Vanguard Explorer Fund
Opinion on the Financial Statements
We have audited the accompanying statement of net assets—investments summary and
statement of assets and liabilities of Vanguard Explorer Fund, (the “Fund”) as of October 31, 2018,
the related statement of operations for the year ended October 31, 2018, the statement of changes
in net assets for each of the two years in the period ended October 31, 2018, including the related
notes, and the financial highlights for each of the five years in the period ended October 31, 2018
(collectively referred to as the “financial statements”). In our opinion, the financial statements
present fairly, in all material respects, the financial position of the Fund as of October 31, 2018, the
results of its operations for the year then ended, the changes in its net assets for each of the two
years in the period ended October 31, 2018 and the financial highlights for each of the five years in
the period ended October 31, 2018 in conformity with accounting principles generally accepted in
the United States of America.
Basis for Opinion
These financial statements are the responsibility of the Fund’s management. Our responsibility is
to express an opinion on the Fund’s financial statements based on our audits. We are a public
accounting firm registered with the Public Company Accounting Oversight Board (United States)
(“PCAOB”) and are required to be independent with respect to the Fund in accordance with the
U.S. federal securities laws and the applicable rules and regulations of the Securities and Exchange
Commission and the PCAOB.
We conducted our audits of these financial statements in accordance with the standards of the
PCAOB. Those standards require that we plan and perform the audit to obtain reasonable
assurance about whether the financial statements are free of material misstatement, whether due
to error or fraud.
Our audits included performing procedures to assess the risks of material misstatement of the
financial statements, whether due to error or fraud, and performing procedures that respond to
those risks. Such procedures included examining, on a test basis, evidence regarding the amounts
and disclosures in the financial statements. Our audits also included evaluating the accounting
principles used and significant estimates made by management, as well as evaluating the overall
presentation of the financial statements. Our procedures included confirmation of securities owned
as of October 31, 2018 by correspondence with the custodians and brokers and by agreement to
the underlying ownership records of the transfer agent; when replies were not received from
brokers, we performed other auditing procedures. We believe that our audits provide a reasonable
basis for our opinion.
/s/PricewaterhouseCoopers LLP
Philadelphia, Pennsylvania
December 13, 2018
We have served as the auditor of one or more investment companies in The Vanguard Group of
Funds since 1975.
Report of Independent Registered Public Accounting Firm
31
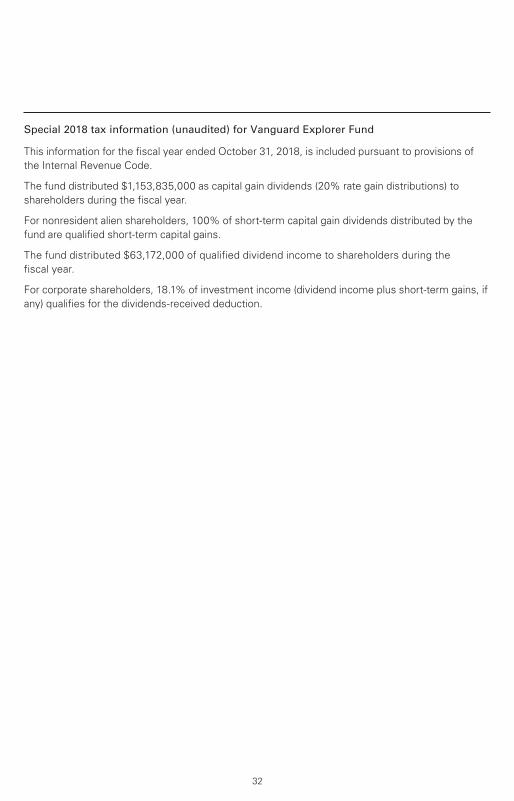
Special 2018 tax information (unaudited) for Vanguard Explorer Fund
This information for the fiscal year ended October 31, 2018, is included pursuant to provisions of
the Internal Revenue Code.
The fund distributed $1,153,835,000 as capital gain dividends (20% rate gain distributions) to
shareholders during the fiscal year.
For nonresident alien shareholders, 100% of short-term capital gain dividends distributed by the
fund are qualified short-term capital gains.
The fund distributed $63,172,000 of qualified dividend income to shareholders during the
fiscal year.
For corporate shareholders, 18.1% of investment income (dividend income plus short-term gains, if
any) qualifies for the dividends-received deduction.
32
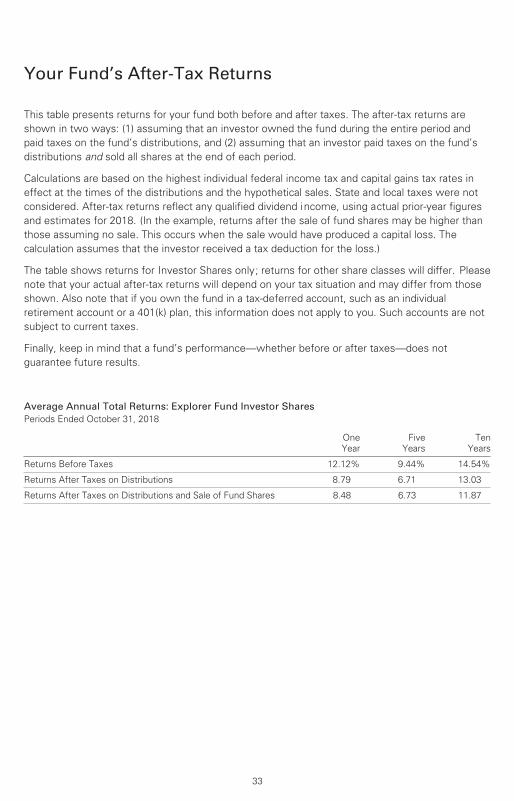
Your Fund’s After-Tax Returns
33
This table presents returns for your fund both before and after taxes. The after-tax returns are
shown in two ways: (1) assuming that an investor owned the fund during the entire period and
paid taxes on the fund’s distributions, and (2) assuming that an investor paid taxes on the fund’s
distributions and sold all shares at the end of each period.
Calculations are based on the highest individual federal income tax and capital gains tax rates in
effect at the times of the distributions and the hypothetical sales. State and local taxes were not
considered. After-tax returns reflect any qualified dividend income, using actual prior-year figures
and estimates for 2018. (In the example, returns after the sale of fund shares may be higher than
those assuming no sale. This occurs when the sale would have produced a capital loss. The
calculation assumes that the investor received a tax deduction for the loss.)
The table shows returns for Investor Shares only; returns for other share classes will differ. Please
note that your actual after-tax returns will depend on your tax situation and may differ from those
shown. Also note that if you own the fund in a tax-deferred account, such as an individual
retirement account or a 401(k) plan, this information does not apply to you. Such accounts are not
subject to current taxes.
Finally, keep in mind that a fund’s performance—whether before or after taxes—does not
guarantee future results.
Average Annual Total Returns: Explorer Fund Investor Shares Periods Ended October 31, 2018
One
Year
Five
Years
Ten
Years
Returns Before Taxes 12.12% 9.44% 14.54%
Returns After Taxes on Distributions 8.79 6.71 13.03
Returns After Taxes on Distributions and Sale of Fund Shares 8.48 6.73 11.87

About Your Fund’s Expenses
34
As a shareholder of the fund, you incur ongoing costs, which include costs for portfolio management,
administrative services, and shareholder reports (like this one), among others. Operating expenses,
which are deducted from a fund’s gross income, directly reduce the investment return of the fund.
A fund’s expenses are expressed as a percentage of its average net assets. This figure is known as
the expense ratio. The following examples are intended to help you understand the ongoing costs (in
dollars) of investing in your fund and to compare these costs with those of other mutual funds. The
examples are based on an investment of $1,000 made at the beginning of the period shown and held
for the entire period.
The accompanying table illustrates your fund’s costs in two ways:
• Based on actual fund return. This section helps you to estimate the actual expenses that you
paid over the period. The ”Ending Account Value“ shown is derived from the fund‘s actual return,
and the third column shows the dollar amount that would have been paid by an investor who started
with $1,000 in the fund. You may use the information here, together with the amount you invested,
to estimate the expenses that you paid over the period.
To do so, simply divide your account value by $1,000 (for example, an $8,600 account value divided
by $1,000 = 8.6), then multiply the result by the number given for your fund under the heading
”Expenses Paid During Period.“
• Based on hypothetical 5% yearly return. This section is intended to help you compare your
fund‘s costs with those of other mutual funds. It assumes that the fund had a yearly return of 5%
before expenses, but that the expense ratio is unchanged. In this case—because the return used is
not the fund’s actual return—the results do not apply to your investment. The example is useful in
making comparisons because the Securities and Exchange Commission requires all mutual funds to
calculate expenses based on a 5% return. You can assess your fund’s costs by comparing this
hypothetical example with the hypothetical examples that appear in shareholder reports of other
funds.
Note that the expenses shown in the table are meant to highlight and help you compare ongoingcosts only and do not reflect transaction costs incurred by the fund for buying and sellingsecurities. Further, the expenses do not include any purchase, redemption, or account servicefees described in the fund prospectus. If such fees were applied to your account, your costswould be higher. Your fund does not carry a “sales load.”
The calculations assume no shares were bought or sold during the period. Your actual costs may
have been higher or lower, depending on the amount of your investment and the timing of any
purchases or redemptions.
You can find more information about the fund’s expenses, including annual expense ratios, in the
Financial Statements section of this report. For additional information on operating expenses and
other shareholder costs, please refer to your fund’s current prospectus.
35
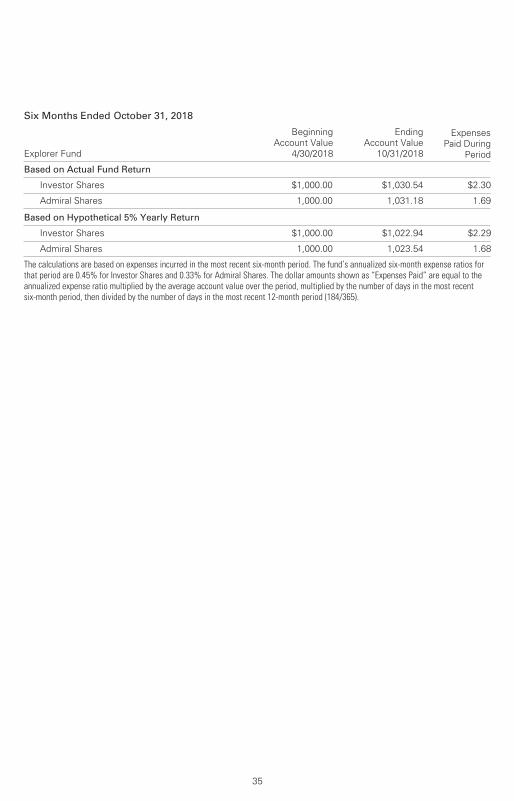
Six Months Ended October 31, 2018
Explorer Fund
Beginning
Account Value
4/30/2018
Ending
Account Value
10/31/2018
Expenses
Paid During
Period
Based on Actual Fund Return
Investor Shares $1,000.00 $1,030.54 $2.30
Admiral Shares 1,000.00 1,031.18 1.69
Based on Hypothetical 5% Yearly Return
Investor Shares $1,000.00 $1,022.94 $2.29
Admiral Shares 1,000.00 1,023.54 1.68
The calculations are based on expenses incurred in the most recent six-month period. The fund’s annualized six-month expense ratios forthat period are 0.45% for Investor Shares and 0.33% for Admiral Shares. The dollar amounts shown as “Expenses Paid” are equal to theannualized expense ratio multiplied by the average account value over the period, multiplied by the number of days in the most recentsix-month period, then divided by the number of days in the most recent 12-month period (184/365).
Glossary
36
30-Day SEC Yield. A fund’s 30-day SEC yield is derived using a formula specified by the U.S.
Securities and Exchange Commission. Under the formula, data related to the fund’s security
holdings in the previous 30 days are used to calculate the fund’s hypothetical net income for that
period, which is then annualized and divided by the fund’s estimated average net assets over the
calculation period. For the purposes of this calculation, a security’s income is based on its current
market yield to maturity (for bonds), its actual income (for asset-backed securities), or its
projected dividend yield (for stocks). Because the SEC yield represents hypothetical annualized
income, it will differ—at times significantly—from the fund’s actual experience. As a result, the
fund’s income distributions may be higher or lower than implied by the SEC yield.
Beta. A measure of the magnitude of a fund’s past share-price fluctuations in relation to the ups
and downs of a given market index. The index is assigned a beta of 1.00. Compared with a given
index, a fund with a beta of 1.20 typically would have seen its share price rise or fall by 12%
when the index rose or fell by 10%. For this report, beta is based on returns over the past 36
months for both the fund and the index. Note that a fund’s beta should be reviewed in conjunction
with its R-squared (see definition). The lower the R-squared, the less correlation there is between
the fund and the index, and the less reliable beta is as an indicator of volatility.
Dividend Yield. Dividend income earned by stocks, expressed as a percentage of the aggregate
market value (or of net asset value, for a fund). The yield is determined by dividing the amount of
the annual dividends by the aggregate value (or net asset value) at the end of the period. For a
fund, the dividend yield is based solely on stock holdings and does not include any income
produced by other investments.
Earnings Growth Rate. The average annual rate of growth in earnings over the past five years for
the stocks now in a fund.
Equity Exposure. A measure that reflects a fund’s investments in stocks and stock futures. Any
holdings in short-term reserves are excluded.
Expense Ratio. A fund’s total annual operating expenses expressed as a percentage of the fund’s
average net assets. The expense ratio includes management and administrative expenses, but
does not include the transaction costs of buying and selling portfolio securities.
Foreign Holdings. The percentage of a fund represented by securities or depositary receipts of
companies based outside the United States.
Inception Date. The date on which the assets of a fund (or one of its share classes) are first
invested in accordance with the fund’s investment objective. For funds with a subscription period,
the inception date is the day after that period ends. Investment performance is measured from
the inception date.
Median Market Cap. An indicator of the size of companies in which a fund invests; the midpoint
of market capitalization (market price x shares outstanding) of a fund’s stocks, weighted by the
proportion of the fund’s assets invested in each stock. Stocks representing half of the fund’s
assets have market capitalizations above the median, and the rest are below it.
Price/Book Ratio. The share price of a stock divided by its net worth, or book value, per share.
For a fund, the weighted average price/book ratio of the stocks it holds.
37
Price/Earnings Ratio. The ratio of a stock’s current price to its per-share earnings over the past
year. For a fund, the weighted average P/E of the stocks it holds. P/E is an indicator of market
expectations about corporate prospects; the higher the P/E, the greater the expectations for a
company’s future growth.
R-Squared. A measure of how much of a fund’s past returns can be explained by the returns
from the market in general, as measured by a given index. If a fund’s total returns were precisely
synchronized with an index’s returns, its R-squared would be 1.00. If the fund’s returns bore no
relationship to the index’s returns, its R-squared would be 0. For this report, R-squared is based
on returns over the past 36 months for both the fund and the index.
Return on Equity. The annual average rate of return generated by a company during the past five
years for each dollar of shareholder’s equity (net income divided by shareholder’s equity). For a
fund, the weighted average return on equity for the companies whose stocks it holds.
Short-Term Reserves. The percentage of a fund invested in highly liquid, short-term securities
that can be readily converted to cash.
Turnover Rate. An indication of the fund’s trading activity. Funds with high turnover rates incur
higher transaction costs and may be more likely to distribute capital gains (which may be taxable
to investors). The turnover rate excludes in-kind transactions, which have minimal impact on
costs.

The Global Industry Classification Standard (“GICS”) was developed by and is the exclusive property and a service mark
of MSCI Inc. (“MSCI”) and Standard and Poor’s, a division of McGraw-Hill Companies, Inc. (“S&P”), and is licensed for use
by Vanguard. Neither MSCI, S&P nor any third party involved in making or compiling the GICS or any GICS classification
makes any express or implied warranties or representations with respect to such standard or classification (or the results
to be obtained by the use thereof), and all such parties hereby expressly disclaim all warranties of originality, accuracy,
completeness, merchantability or fitness for a particular purpose with respect to any such standard or classification.
Without limiting any of the foregoing, in no event shall MSCI, S&P, any of its affiliates or any third party involved in
making or compiling the GICS or any GICS classification have any liability for any direct, indirect, special, punitive,
consequential or any other damages (including lost profits) even if notified of the possibility of such damages.
38
The People Who Govern Your Fund
The trustees of your mutual fund are there to see that the fund is operated and managed in your
best interests since, as a shareholder, you are a part owner of the fund. Your fund’s trustees also
serve on the board of directors of The Vanguard Group, Inc., which is owned by the Vanguard
funds and provides services to them on an at-cost basis.
A majority of Vanguard’s board members are independent, meaning that they have no affiliation
with Vanguard or the funds they oversee, apart from the sizable personal investments they have
made as private individuals. The independent board members have distinguished backgrounds
in business, academia, and public service. Each of the trustees and executive officers oversees
211 Vanguard funds.
Information for each trustee and executive officer of the fund appears below. The mailing address
of the trustees and officers is P.O. Box 876, Valley Forge, PA 19482. More information about the
trustees is in the Statement of Additional Information, which can be obtained, without charge,
by contacting Vanguard at 800-662-7447, or online at vanguard.com.
Interested Trustees1
F. William McNabb III
Born in 1957. Trustee since July 2009. Principal
occupation(s) during the past five years and
other experience: chairman of the board
(January 2010–present) of Vanguard and of each
of the investment companies served by Vanguard,
trustee (2009–present) of each of the investment
companies served by Vanguard, and director
(2008–present) of Vanguard. Chief executive officer
and president (2008–2017) of Vanguard and each
of the investment companies served by Vanguard,
managing director (1995–2008) of Vanguard,
and director (1997–2018) of Vanguard Marketing
Corporation. Director (2018–present) of
UnitedHealth Group.
Mortimer J. Buckley
Born in 1969. Trustee since January 2018. Principal
occupation(s) during the past five years and
other experience: chief executive officer
(January 2018–present) of Vanguard; chief executive
officer, president, and trustee (January 2018–present)
of each of the investment companies served by
Vanguard; president and director (2017–present) of
Vanguard; and president (February 2018–present) of
Vanguard Marketing Corporation. Chief investment
officer (2013–2017), managing director (2002–2017),
head of the Retail Investor Group (2006–2012), and
chief information officer (2001–2006) of Vanguard.
Chairman of the board (2011–2017) of the Children’s
Hospital of Philadelphia.
Independent Trustees
Emerson U. Fullwood
Born in 1948. Trustee since January 2008. Principal
occupation(s) during the past five years and other
experience: executive chief staff and marketing officer
for North America and corporate vice president (retired
2008) of Xerox Corporation (document management
products and services). Former president of the
Worldwide Channels Group, Latin America, and
Worldwide Customer Service and executive chief
staff officer of Developing Markets of Xerox. Executive
in residence and 2009–2010 Distinguished Minett
Professor at the Rochester Institute of Technology.
Lead director of SPX FLOW, Inc. (multi-industry
manufacturing). Director of the University of Rochester
Medical Center, the Monroe Community College
Foundation, the United Way of Rochester, North
Carolina A&T University, and Roberts Wesleyan
College. Trustee of the University of Rochester.
Amy Gutmann
Born in 1949. Trustee since June 2006. Principal
occupation(s) during the past five years and other
experience: president (2004–present) of the University
of Pennsylvania. Christopher H. Browne Distinguished
Professor of Political Science, School of Arts and
Sciences, and professor of communication, Annenberg
School for Communication, with secondary faculty
appointments in the Department of Philosophy, School
of Arts and Sciences, and at the Graduate School of
Education, University of Pennsylvania. Trustee of the
National Constitution Center.
1 Mr. McNabb and Mr. Buckley are considered “interested persons,” as defined in the Investment Company Act of 1940, because they are officers of the Vanguard funds.

JoAnn Heffernan Heisen
Born in 1950. Trustee since July 1998. Principal
occupation(s) during the past five years and other
experience: corporate vice president of Johnson &
Johnson (pharmaceuticals/medical devices/consumer
products) and member of its executive committee
(1997–2008). Chief global diversity officer (retired
2008), vice president and chief information officer
(1997–2006), controller (1995–1997), treasurer
(1991–1995), and assistant treasurer (1989–1991)
of Johnson & Johnson. Director of Skytop Lodge
Corporation (hotels) and the Robert Wood Johnson
Foundation. Member of the advisory board of the
Institute for Women’s Leadership at Rutgers University.
F. Joseph Loughrey
Born in 1949. Trustee since October 2009. Principal
occupation(s) during the past five years and other
experience: president and chief operating officer
(retired 2009) and vice chairman of the board
(2008–2009) of Cummins Inc. (industrial machinery).
Chairman of the board of Hillenbrand, Inc. (specialized
consumer services), Oxfam America, and the Lumina
Foundation for Education. Director of the V Foundation
for Cancer Research. Member of the advisory council
for the College of Arts and Letters and chair of the
advisory board to the Kellogg Institute for International
Studies, both at the University of Notre Dame.
Mark Loughridge
Born in 1953. Trustee since March 2012. Principal
occupation(s) during the past five years and other
experience: senior vice president and chief financial
officer (retired 2013) of IBM (information technology
services). Fiduciary member of IBM’s Retirement
Plan Committee (2004–2013), senior vice president
and general manager (2002–2004) of IBM Global
Financing, vice president and controller (1998–2002)
of IBM, and a variety of other prior management roles
at IBM. Member of the Council on Chicago Booth.
Scott C. Malpass
Born in 1962. Trustee since March 2012. Principal
occupation(s) during the past five years and other
experience: chief investment officer (1989–present)
and vice president (1996–present) of the University
of Notre Dame. Assistant professor of finance at the
Mendoza College of Business, University of Notre
Dame, and member of the Notre Dame 403(b)
Investment Committee. Chairman of the board of
TIFF Advisory Services, Inc. Member of the board
of Catholic Investment Services, Inc. (investment
advisors), the board of advisors for Spruceview
Capital Partners, and the board of superintendence
of the Institute for the Works of Religion.
Deanna Mulligan
Born in 1963. Trustee since January 2018. Principal
occupation(s) during the past five years and other
experience: president (2010–present) and chief
executive officer (2011–present) of The Guardian
Life Insurance Company of America. Chief operating
officer (2010–2011) and executive vice president
(2008–2010) of Individual Life and Disability of
The Guardian Life Insurance Company of America.
Member of the board of The Guardian Life Insurance
Company of America, the American Council of Life
Insurers, the Partnership for New York City (business
leadership), and the Committee Encouraging Corporate
Philanthropy. Trustee of the Economic Club of New
York and the Bruce Museum (arts and science).
Member of the Advisory Council for the Stanford
Graduate School of Business.
André F. Perold
Born in 1952. Trustee since December 2004. Principal
occupation(s) during the past five years and other
experience: George Gund Professor of Finance and
Banking, Emeritus at the Harvard Business School
(retired 2011). Chief investment officer and co-
managing partner of HighVista Strategies LLC
(private investment firm). Overseer of the Museum
of Fine Arts Boston.
Sarah Bloom Raskin
Born in 1961. Trustee since January 2018. Principal
occupation(s) during the past five years and other
experience: deputy secretary (2014–2017) of
the United States Department of the Treasury.
Governor (2010–2014) of the Federal Reserve Board.
Commissioner (2007–2010) of financial regulation
for the State of Maryland. Member of the board of
directors (2012–2014) of Neighborhood Reinvestment
Corporation. Director of i(x) Investments, LLC.
Peter F. Volanakis
Born in 1955. Trustee since July 2009. Principal
occupation(s) during the past five years and other
experience: president and chief operating officer
(retired 2010) of Corning Incorporated (communications
equipment) and director of Corning Incorporated
(2000–2010) and Dow Corning (2001–2010).
Director (2012) of SPX Corporation (multi-industry
manufacturing). Overseer of the Amos Tuck School
of Business Administration, Dartmouth College
(2001–2013). Chairman of the board of trustees of
Colby-Sawyer College. Member of the Board of
Hypertherm Inc. (industrial cutting systems, software,
and consumables).
Executive Officers
Glenn Booraem
Born in 1967. Principal occupation(s) during the past
five years and other experience: principal of Vanguard.
Investment stewardship officer (2017–present),
treasurer (2015–2017), controller (2010–2015),
and assistant controller (2001–2010) of each of
the investment companies served by Vanguard.
Christine M. Buchanan
Born in 1970. Principal occupation(s) during the past
five years and other experience: principal of Vanguard
and global head of Fund Administration at Vanguard.
Treasurer (2017–present) of each of the investment
companies served by Vanguard. Partner (2005–2017)
at KPMG LLP (audit, tax, and advisory services).
Brian Dvorak
Born in 1973. Principal occupation(s) during the past
five years and other experience: principal of Vanguard.
Chief compliance officer (2017–present) of Vanguard
and each of the investment companies served by
Vanguard. Assistant vice president (2017–present) of
Vanguard Marketing Corporation. Vice president and
director of Enterprise Risk Management (2011–2013)
at Oppenheimer Funds, Inc.
Thomas J. Higgins
Born in 1957. Principal occupation(s) during the past
five years and other experience: principal of Vanguard.
Chief financial officer (2008–present) and treasurer
(1998–2008) of each of the investment companies
served by Vanguard.
Peter Mahoney
Born in 1974. Principal occupation(s) during the past
five years and other experience: principal of Vanguard.
Controller (2015–present) of each of the investment
companies served by Vanguard. Head of International
Fund Services (2008–2014) at Vanguard.
Anne E. Robinson
Born in 1970. Principal occupation(s) during the
past five years and other experience: general
counsel (2016–present) of Vanguard. Secretary
(2016–present) of Vanguard and of each of the
investment companies served by Vanguard.
Managing director (2016–present) of Vanguard.
Director and senior vice president (2016–2018)
of Vanguard Marketing Corporation. Managing
director and general counsel of Global Cards and
Consumer Services (2014–2016) at Citigroup.
Counsel (2003–2014) at American Express.
Michael Rollings
Born in 1963. Principal occupation(s) during the
past five years and other experience: finance
director (2017–present) and treasurer (2017) of each
of the investment companies served by Vanguard.
Managing director (2016–present) of Vanguard. Chief
financial officer (2016–present) of Vanguard. Director
(2016–present) of Vanguard Marketing Corporation.
Executive vice president and chief financial officer
(2006–2016) of MassMutual Financial Group.
Vanguard Senior Management Team
Joseph Brennan Chris D. McIsaac
Mortimer J. Buckley James M. Norris
Gregory Davis Thomas M. Rampulla
John James Karin A. Risi
Martha G. King Anne E. Robinson
John T. Marcante Michael Rollings
Chairman Emeritus and Senior Advisor
John J. Brennan
Chairman, 1996–2009
Chief Executive Officer and President, 1996–2008
Founder
John C. Bogle
Chairman and Chief Executive Officer, 1974–1996

P.O. Box 2600
Valley Forge, PA 19482-2600
Connect with Vanguard® > vanguard.com
Fund Information > 800-662-7447
Direct Investor Account Services > 800-662-2739
Institutional Investor Services > 800-523-1036
Text Telephone for PeopleWho Are Deaf or Hard of Hearing > 800-749-7273
This material may be used in conjunctionwith the offering of shares of any Vanguardfund only if preceded or accompanied bythe fund’s current prospectus.
All comparative mutual fund data are from Lipper, aThomson Reuters Company, or Morningstar, Inc., unlessotherwise noted.
You can obtain a free copy of Vanguard’s proxy votingguidelines by visiting vanguard.com/proxyreporting or bycalling Vanguard at 800-662-2739. The guidelines arealso available from the SEC’s website, sec.gov. Inaddition, you may obtain a free report on how your fundvoted the proxies for securities it owned during the 12months ended June 30. To get the report, visit eithervanguard.com/proxyreporting or sec.gov.
You can review information about your fund on theSEC’s website, and you can receive copies of thisinformation, for a fee, by sending a request via emailaddressed to [email protected].
Source for Bloomberg Barclays indexes: BloombergIndex Services Limited. Copyright 2018, Bloomberg. Allrights reserved.
CFA® is a registered trademark owned by CFA Institute.
© 2018 The Vanguard Group, Inc.All rights reserved.Vanguard Marketing Corporation, Distributor.
Q240 122018
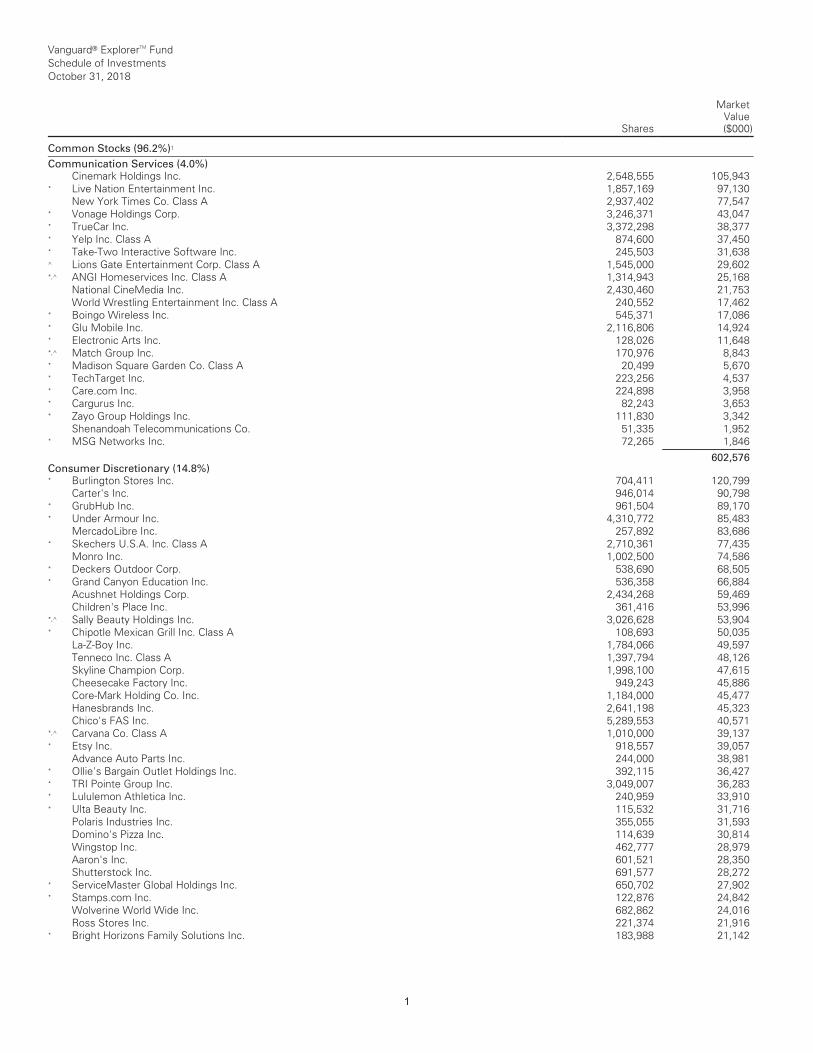
Vanguard® ExplorerTM Fund Schedule of Investments October 31, 2018
Shares
MarketValue($000)
__________________________________________________________________________________________________________________________________________________________________________________________________________________________________________________________________________________________________________________________________________________________________________________________________________________________________________________________________________________________________________________________________________________________________________________________________________________________________________________________________________________________ __________________________________________________________________________________________________________________________________________________________________________________________________________________________________________________________________________________________________________________________________________________________________________________________________________________________________________________________________________________________________________________________________________________________________________________________________________________________________________________________________________________________
Common Stocks (96.2%)1 __________________________________________________________________________________________________________________________________________________________________________________________________________________________________________________________________________________________________________________________________________________________________________________________________________________________________________________________________________________________________________________________________________________________________________________________________________________________________________________________________________________________ __________________________________________________________________________________________________________________________________________________________________________________________________________________________________________________________________________________________________________________________________________________________________________________________________________________________________________________________________________________________________________________________________________________________________________________________________________________________________________________________________________________________
Communication Services (4.0%)Cinemark Holdings Inc. 2,548,555 105,943
* Live Nation Entertainment Inc. 1,857,169 97,130 New York Times Co. Class A 2,937,402 77,547
* Vonage Holdings Corp. 3,246,371 43,047* TrueCar Inc. 3,372,298 38,377* Yelp Inc. Class A 874,600 37,450* Take-Two Interactive Software Inc. 245,503 31,638 ^ Lions Gate Entertainment Corp. Class A 1,545,000 29,602 *,^ ANGI Homeservices Inc. Class A 1,314,943 25,168
National CineMedia Inc. 2,430,460 21,753World Wrestling Entertainment Inc. Class A 240,552 17,462
* Boingo Wireless Inc. 545,371 17,086* Glu Mobile Inc. 2,116,806 14,924* Electronic Arts Inc. 128,026 11,648*,^ Match Group Inc. 170,976 8,843* Madison Square Garden Co. Class A 20,499 5,670 * TechTarget Inc. 223,256 4,537* Care.com Inc. 224,898 3,958* Cargurus Inc. 82,243 3,653* Zayo Group Holdings Inc. 111,830 3,342
Shenandoah Telecommunications Co. 51,335 1,952 * MSG Networks Inc. 72,265 1,846___________
602,576 Consumer Discretionary (14.8%)* Burlington Stores Inc. 704,411 120,799
Carter's Inc. 946,014 90,798* GrubHub Inc. 961,504 89,170* Under Armour Inc. 4,310,772 85,483
MercadoLibre Inc. 257,892 83,686* Skechers U.S.A. Inc. Class A 2,710,361 77,435
Monro Inc. 1,002,500 74,586* Deckers Outdoor Corp. 538,690 68,505* Grand Canyon Education Inc. 536,358 66,884
Acushnet Holdings Corp. 2,434,268 59,469 Children's Place Inc. 361,416 53,996
*,^ Sally Beauty Holdings Inc. 3,026,628 53,904 * Chipotle Mexican Grill Inc. Class A 108,693 50,035
La-Z-Boy Inc. 1,784,066 49,597Tenneco Inc. Class A 1,397,794 48,126Skyline Champion Corp. 1,998,100 47,615 Cheesecake Factory Inc. 949,243 45,886 Core-Mark Holding Co. Inc. 1,184,000 45,477 Hanesbrands Inc. 2,641,198 45,323Chico's FAS Inc. 5,289,553 40,571
*,^ Carvana Co. Class A 1,010,000 39,137* Etsy Inc. 918,557 39,057
Advance Auto Parts Inc. 244,000 38,981 * Ollie's Bargain Outlet Holdings Inc. 392,115 36,427 * TRI Pointe Group Inc. 3,049,007 36,283* Lululemon Athletica Inc. 240,959 33,910 * Ulta Beauty Inc. 115,532 31,716
Polaris Industries Inc. 355,055 31,593Domino's Pizza Inc. 114,639 30,814Wingstop Inc. 462,777 28,979Aaron's Inc. 601,521 28,350Shutterstock Inc. 691,577 28,272
* ServiceMaster Global Holdings Inc. 650,702 27,902 * Stamps.com Inc. 122,876 24,842
Wolverine World Wide Inc. 682,862 24,016 Ross Stores Inc. 221,374 21,916
* Bright Horizons Family Solutions Inc. 183,988 21,142
1

Vanguard® Explorer Fund Schedule of Investments October 31, 2018
Shares
MarketValue($000)
__________________________________________________________________________________________________________________________________________________________________________________________________________________________________________________________________________________________________________________________________________________________________________________________________________________________________________________________________________________________________________________________________________________________________________________________________________________________________________________________________________________________ __________________________________________________________________________________________________________________________________________________________________________________________________________________________________________________________________________________________________________________________________________________________________________________________________________________________________________________________________________________________________________________________________________________________________________________________________________________________________________________________________________________________
PulteGroup Inc. 675,389 16,594 * Weight Watchers International Inc. 248,649 16,436 * frontdoor Inc. 479,704 16,334 Bloomin' Brands Inc. 814,026 16,240 *,^ RH 138,920 16,074 Expedia Group Inc. 118,134 14,818 * Urban Outfitters Inc. 359,947 14,203 * LKQ Corp. 515,098 14,047 * Crocs Inc. 678,374 13,934 Tailored Brands Inc. 660,038 13,867 Lear Corp. 88,911 11,816 BJ's Restaurants Inc. 191,026 11,687 * Planet Fitness Inc. Class A 233,478 11,461 *,^ Under Armour Inc. Class A 511,000 11,298 Dunkin' Brands Group Inc. 145,383 10,549 Dick's Sporting Goods Inc. 292,082 10,331 * MCBC Holdings Inc. 343,850 10,205 * Chegg Inc. 366,687 10,003 * Five Below Inc. 85,514 9,733 Brinker International Inc. 219,633 9,521 Ruth's Hospitality Group Inc. 328,100 8,869 H&R Block Inc. 316,440 8,398 * Boot Barn Holdings Inc. 330,830 8,165 * Shake Shack Inc. Class A 150,644 7,968 Churchill Downs Inc. 31,712 7,916 Nordstrom Inc. 117,486 7,727 Dine Brands Global Inc. 93,752 7,598 * Penn National Gaming Inc. 302,114 7,335 *,^ Fossil Group Inc. 321,676 6,984 Winnebago Industries Inc. 244,186 6,730 American Eagle Outfitters Inc. 289,597 6,678 * SeaWorld Entertainment Inc. 238,510 6,230 Red Rock Resorts Inc. Class A 263,206 6,091 * NVR Inc. 2,509 5,618 ^ PetMed Express Inc. 174,917 4,887 Movado Group Inc. 126,261 4,862 * G-III Apparel Group Ltd. 120,199 4,791 * Sleep Number Corp. 120,737 4,391 * Zumiez Inc. 171,866 3,998 * ZAGG Inc. 264,135 3,199 Tilly's Inc. Class A 174,336 3,093 Extended Stay America Inc. 176,950 2,881 Columbia Sportswear Co. 29,763 2,687 * Taylor Morrison Home Corp. Class A 132,952 2,199 * Visteon Corp. 23,355 1,846 *,^ Conn's Inc. 62,214 1,728 * Fox Factory Holding Corp. 27,912 1,500 * Career Education Corp. 102,653 1,476 Vail Resorts Inc. 5,653 1,421 Service Corp. International 34,111 1,415 MDC Holdings Inc. 45,412 1,276 * Eldorado Resorts Inc. 30,774 1,123 * Malibu Boats Inc. Class A 27,178 1,093 ___________ 2,232,006 Consumer Staples (2.3%)
* Performance Food Group Co. 2,115,290 62,020 * Post Holdings Inc. 620,697 54,882 Nu Skin Enterprises Inc. Class A 757,279 53,176 Casey's General Stores Inc. 345,338 43,551 ^ Calavo Growers Inc. 387,226 37,561 * Monster Beverage Corp. 473,203 25,009 Medifast Inc. 88,536 18,741 MGP Ingredients Inc. 213,586 15,201 Cal-Maine Foods Inc. 145,737 7,093
2

Vanguard® Explorer Fund Schedule of Investments October 31, 2018
Shares
MarketValue($000)
__________________________________________________________________________________________________________________________________________________________________________________________________________________________________________________________________________________________________________________________________________________________________________________________________________________________________________________________________________________________________________________________________________________________________________________________________________________________________________________________________________________________ __________________________________________________________________________________________________________________________________________________________________________________________________________________________________________________________________________________________________________________________________________________________________________________________________________________________________________________________________________________________________________________________________________________________________________________________________________________________________________________________________________________________
Lamb Weston Holdings Inc. 89,859 7,024 * BJ's Wholesale Club Holdings Inc. 238,066 5,273 * Boston Beer Co. Inc. Class A 15,517 4,768 Spectrum Brands Holdings Inc. 46,591 3,026 * US Foods Holding Corp. 59,172 1,726 ___________ 339,051 Energy (1.5%)
*,^ Jagged Peak Energy Inc. 4,243,618 52,281 Delek US Holdings Inc. 1,074,785 39,466 ^ Core Laboratories NV 282,190 24,054 Cabot Oil & Gas Corp. 876,691 21,242 * Carrizo Oil & Gas Inc. 673,672 12,268 * RigNet Inc. 665,780 11,385 * Apergy Corp. 277,875 10,834 * Callon Petroleum Co. 1,051,287 10,481 * ProPetro Holding Corp. 514,820 9,087 Range Resources Corp. 536,457 8,503 * Forum Energy Technologies Inc. 867,000 7,768 * Renewable Energy Group Inc. 249,448 7,753 * Denbury Resources Inc. 1,022,981 3,529 Mammoth Energy Services Inc. 128,438 3,206 * CONSOL Energy Inc. 74,172 2,955 * Northern Oil and Gas Inc. 762,432 2,242 * W&T Offshore Inc. 252,712 1,703 * Laredo Petroleum Inc. 228,699 1,198 * Abraxas Petroleum Corp. 593,365 1,092 ___________ 231,047 Financials (6.7%)
* SVB Financial Group 408,185 96,834 Nasdaq Inc. 915,604 79,392 Assured Guaranty Ltd. 1,682,439 67,264 Assurant Inc. 652,181 63,399 * MGIC Investment Corp. 4,808,540 58,712 LPL Financial Holdings Inc. 919,600 56,647 Sterling Bancorp 3,092,926 55,611 Hannon Armstrong Sustainable Infrastructure Capital Inc. 2,521,363 52,318 Redwood Trust Inc. 3,113,939 51,131 * Texas Capital Bancshares Inc. 777,048 50,687 BOK Financial Corp. 575,432 49,332 * Green Dot Corp. Class A 432,454 32,754 WisdomTree Investments Inc. 4,164,638 32,359 MarketAxess Holdings Inc. 148,121 31,057 Solar Capital Ltd. 1,263,598 26,030 Affiliated Managers Group Inc. 185,000 21,027 FirstCash Inc. 235,324 18,920 Primerica Inc. 162,506 17,833 * Credit Acceptance Corp. 38,241 16,230 MSCI Inc. Class A 97,363 14,642 *,^ PRA Group Inc. 451,360 13,920 Universal Insurance Holdings Inc. 304,171 12,769 Walker & Dunlop Inc. 223,420 9,375 Synovus Financial Corp. 234,342 8,802 Bank OZK 272,467 7,455 Bank of NT Butterfield & Son Ltd. 183,791 7,405 * Essent Group Ltd. 167,267 6,594 * Axos Financial Inc. 197,208 5,987 Evercore Inc. Class A 69,334 5,664 East West Bancorp Inc. 107,181 5,621 * Blucora Inc. 163,043 4,715 Greenhill & Co. Inc. 206,445 4,552 * Enova International Inc. 130,924 3,096 * Regional Management Corp. 104,227 3,008 Cadence BanCorp Class A 131,974 2,911 Voya Financial Inc. 61,567 2,694
3
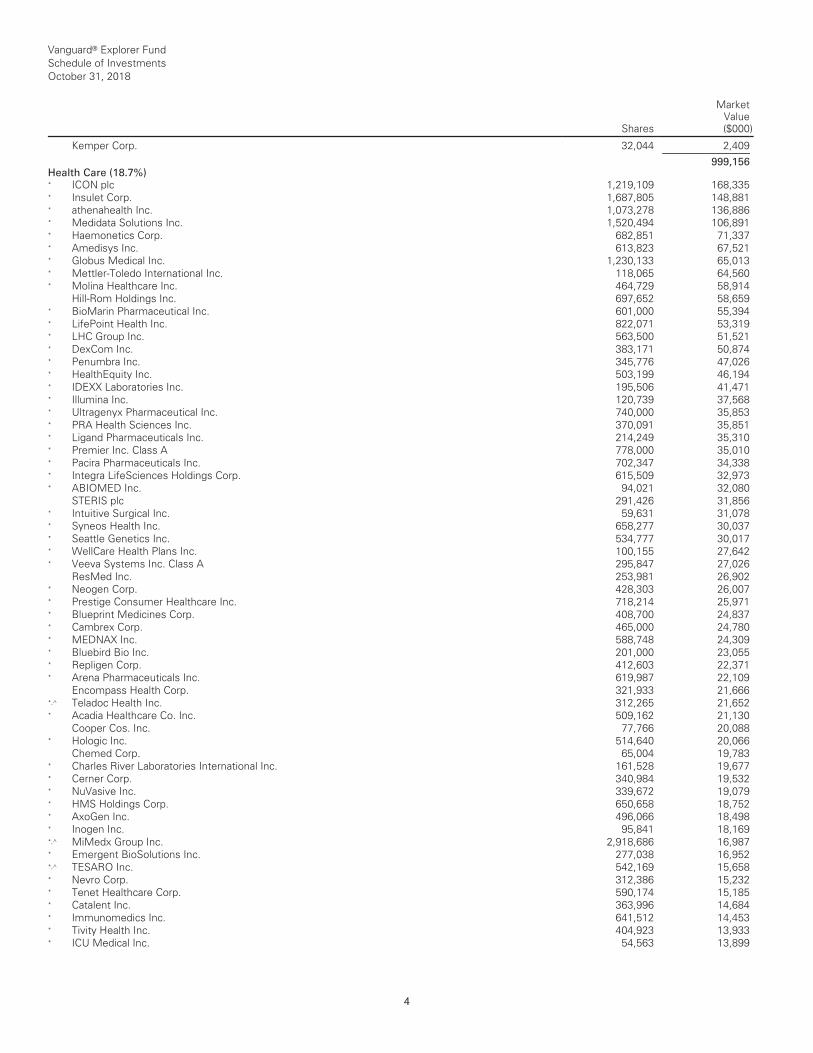
Vanguard® Explorer Fund Schedule of Investments October 31, 2018
Shares
MarketValue($000)
__________________________________________________________________________________________________________________________________________________________________________________________________________________________________________________________________________________________________________________________________________________________________________________________________________________________________________________________________________________________________________________________________________________________________________________________________________________________________________________________________________________________ __________________________________________________________________________________________________________________________________________________________________________________________________________________________________________________________________________________________________________________________________________________________________________________________________________________________________________________________________________________________________________________________________________________________________________________________________________________________________________________________________________________________
Kemper Corp. 32,044 2,409 ___________ 999,156 Health Care (18.7%)
* ICON plc 1,219,109 168,335 * Insulet Corp. 1,687,805 148,881 * athenahealth Inc. 1,073,278 136,886 * Medidata Solutions Inc. 1,520,494 106,891 * Haemonetics Corp. 682,851 71,337 * Amedisys Inc. 613,823 67,521 * Globus Medical Inc. 1,230,133 65,013 * Mettler-Toledo International Inc. 118,065 64,560 * Molina Healthcare Inc. 464,729 58,914 Hill-Rom Holdings Inc. 697,652 58,659 * BioMarin Pharmaceutical Inc. 601,000 55,394 * LifePoint Health Inc. 822,071 53,319 * LHC Group Inc. 563,500 51,521 * DexCom Inc. 383,171 50,874 * Penumbra Inc. 345,776 47,026 * HealthEquity Inc. 503,199 46,194 * IDEXX Laboratories Inc. 195,506 41,471 * Illumina Inc. 120,739 37,568 * Ultragenyx Pharmaceutical Inc. 740,000 35,853 * PRA Health Sciences Inc. 370,091 35,851 * Ligand Pharmaceuticals Inc. 214,249 35,310 * Premier Inc. Class A 778,000 35,010 * Pacira Pharmaceuticals Inc. 702,347 34,338 * Integra LifeSciences Holdings Corp. 615,509 32,973 * ABIOMED Inc. 94,021 32,080 STERIS plc 291,426 31,856 * Intuitive Surgical Inc. 59,631 31,078 * Syneos Health Inc. 658,277 30,037 * Seattle Genetics Inc. 534,777 30,017 * WellCare Health Plans Inc. 100,155 27,642 * Veeva Systems Inc. Class A 295,847 27,026 ResMed Inc. 253,981 26,902 * Neogen Corp. 428,303 26,007 * Prestige Consumer Healthcare Inc. 718,214 25,971 * Blueprint Medicines Corp. 408,700 24,837 * Cambrex Corp. 465,000 24,780 * MEDNAX Inc. 588,748 24,309 * Bluebird Bio Inc. 201,000 23,055 * Repligen Corp. 412,603 22,371 * Arena Pharmaceuticals Inc. 619,987 22,109 Encompass Health Corp. 321,933 21,666 *,^ Teladoc Health Inc. 312,265 21,652 * Acadia Healthcare Co. Inc. 509,162 21,130 Cooper Cos. Inc. 77,766 20,088 * Hologic Inc. 514,640 20,066 Chemed Corp. 65,004 19,783 * Charles River Laboratories International Inc. 161,528 19,677 * Cerner Corp. 340,984 19,532 * NuVasive Inc. 339,672 19,079 * HMS Holdings Corp. 650,658 18,752 * AxoGen Inc. 496,066 18,498 * Inogen Inc. 95,841 18,169 *,^ MiMedx Group Inc. 2,918,686 16,987 * Emergent BioSolutions Inc. 277,038 16,952 *,^ TESARO Inc. 542,169 15,658 * Nevro Corp. 312,386 15,232 * Tenet Healthcare Corp. 590,174 15,185 * Catalent Inc. 363,996 14,684 * Immunomedics Inc. 641,512 14,453 * Tivity Health Inc. 404,923 13,933 * ICU Medical Inc. 54,563 13,899
4
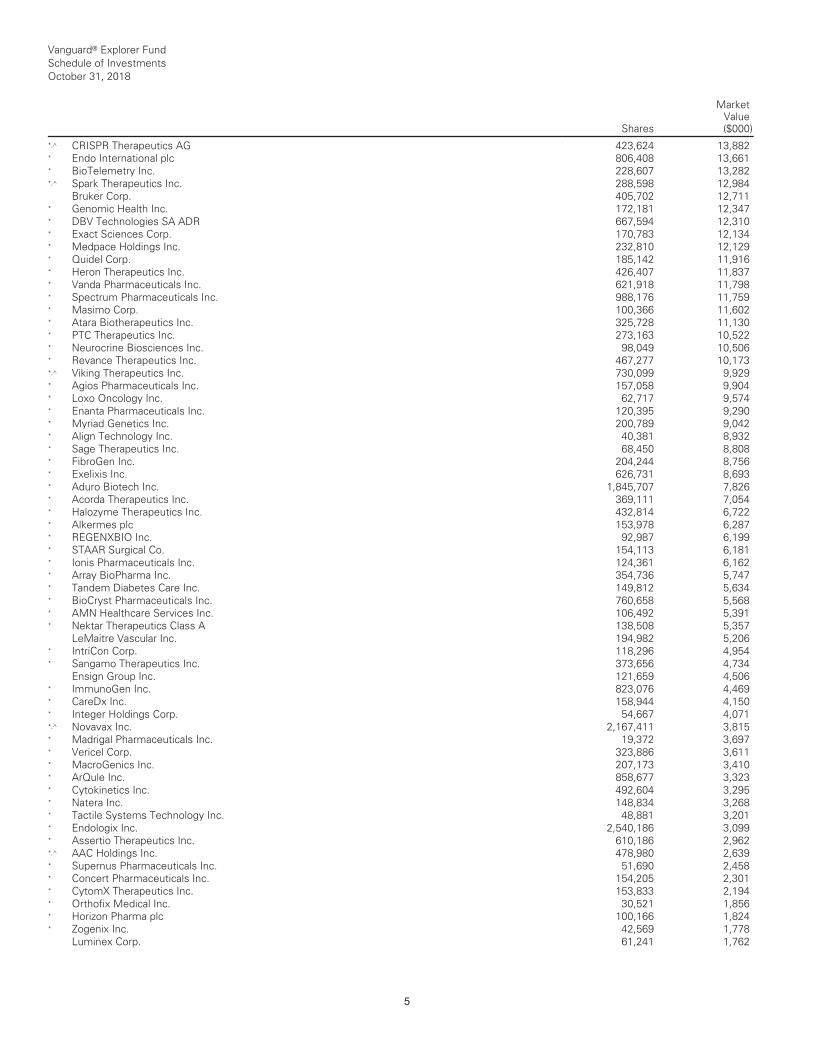
Vanguard® Explorer Fund Schedule of Investments October 31, 2018
Shares
MarketValue($000)
__________________________________________________________________________________________________________________________________________________________________________________________________________________________________________________________________________________________________________________________________________________________________________________________________________________________________________________________________________________________________________________________________________________________________________________________________________________________________________________________________________________________ __________________________________________________________________________________________________________________________________________________________________________________________________________________________________________________________________________________________________________________________________________________________________________________________________________________________________________________________________________________________________________________________________________________________________________________________________________________________________________________________________________________________
*,^ CRISPR Therapeutics AG 423,624 13,882 * Endo International plc 806,408 13,661 * BioTelemetry Inc. 228,607 13,282 *,^ Spark Therapeutics Inc. 288,598 12,984 Bruker Corp. 405,702 12,711 * Genomic Health Inc. 172,181 12,347 * DBV Technologies SA ADR 667,594 12,310 * Exact Sciences Corp. 170,783 12,134 * Medpace Holdings Inc. 232,810 12,129 * Quidel Corp. 185,142 11,916 * Heron Therapeutics Inc. 426,407 11,837 * Vanda Pharmaceuticals Inc. 621,918 11,798 * Spectrum Pharmaceuticals Inc. 988,176 11,759 * Masimo Corp. 100,366 11,602 * Atara Biotherapeutics Inc. 325,728 11,130 * PTC Therapeutics Inc. 273,163 10,522 * Neurocrine Biosciences Inc. 98,049 10,506 * Revance Therapeutics Inc. 467,277 10,173 *,^ Viking Therapeutics Inc. 730,099 9,929 * Agios Pharmaceuticals Inc. 157,058 9,904 * Loxo Oncology Inc. 62,717 9,574 * Enanta Pharmaceuticals Inc. 120,395 9,290 * Myriad Genetics Inc. 200,789 9,042 * Align Technology Inc. 40,381 8,932 * Sage Therapeutics Inc. 68,450 8,808 * FibroGen Inc. 204,244 8,756 * Exelixis Inc. 626,731 8,693 * Aduro Biotech Inc. 1,845,707 7,826 * Acorda Therapeutics Inc. 369,111 7,054 * Halozyme Therapeutics Inc. 432,814 6,722 * Alkermes plc 153,978 6,287 * REGENXBIO Inc. 92,987 6,199 * STAAR Surgical Co. 154,113 6,181 * Ionis Pharmaceuticals Inc. 124,361 6,162 * Array BioPharma Inc. 354,736 5,747 * Tandem Diabetes Care Inc. 149,812 5,634 * BioCryst Pharmaceuticals Inc. 760,658 5,568 * AMN Healthcare Services Inc. 106,492 5,391 * Nektar Therapeutics Class A 138,508 5,357 LeMaitre Vascular Inc. 194,982 5,206 * IntriCon Corp. 118,296 4,954 * Sangamo Therapeutics Inc. 373,656 4,734 Ensign Group Inc. 121,659 4,506 * ImmunoGen Inc. 823,076 4,469 * CareDx Inc. 158,944 4,150 * Integer Holdings Corp. 54,667 4,071 *,^ Novavax Inc. 2,167,411 3,815 * Madrigal Pharmaceuticals Inc. 19,372 3,697 * Vericel Corp. 323,886 3,611 * MacroGenics Inc. 207,173 3,410 * ArQule Inc. 858,677 3,323 * Cytokinetics Inc. 492,604 3,295 * Natera Inc. 148,834 3,268 * Tactile Systems Technology Inc. 48,881 3,201 * Endologix Inc. 2,540,186 3,099 * Assertio Therapeutics Inc. 610,186 2,962 *,^ AAC Holdings Inc. 478,980 2,639 * Supernus Pharmaceuticals Inc. 51,690 2,458 * Concert Pharmaceuticals Inc. 154,205 2,301 * CytomX Therapeutics Inc. 153,833 2,194 * Orthofix Medical Inc. 30,521 1,856 * Horizon Pharma plc 100,166 1,824 * Zogenix Inc. 42,569 1,778 Luminex Corp. 61,241 1,762
5

Vanguard® Explorer Fund Schedule of Investments October 31, 2018
Shares
MarketValue($000)
__________________________________________________________________________________________________________________________________________________________________________________________________________________________________________________________________________________________________________________________________________________________________________________________________________________________________________________________________________________________________________________________________________________________________________________________________________________________________________________________________________________________ __________________________________________________________________________________________________________________________________________________________________________________________________________________________________________________________________________________________________________________________________________________________________________________________________________________________________________________________________________________________________________________________________________________________________________________________________________________________________________________________________________________________
* Amphastar Pharmaceuticals Inc. 83,144 1,492 CONMED Corp. 21,848 1,473 *,^ TransEnterix Inc. 427,039 1,396 * Innoviva Inc. 97,824 1,366 * AnaptysBio Inc. 16,338 1,221 * Voyager Therapeutics Inc. 74,653 1,013 * Ophthotech Corp. 420,409 950 *,^ Sorrento Therapeutics Inc. 258,433 824 * Arbutus Biopharma Corp. 188,366 799 ___________ 2,811,707 Industrials (17.9%)
* TriNet Group Inc. 2,444,193 114,853 * Sensata Technologies Holding plc 2,165,465 101,560 * Kirby Corp. 1,372,199 98,716 John Bean Technologies Corp. 855,267 88,922 * Teledyne Technologies Inc. 359,445 79,538 Woodward Inc. 1,074,199 79,104 * Trex Co. Inc. 1,205,100 73,873 * Copart Inc. 1,448,000 70,822 * AerCap Holdings NV 1,373,256 68,773 * Chart Industries Inc. 898,800 61,163 HEICO Corp. Class A 911,577 60,766 Advanced Drainage Systems Inc. 2,116,945 58,830 MSC Industrial Direct Co. Inc. Class A 717,341 58,148 EnerSys 718,000 57,131 * Spirit Airlines Inc. 1,076,381 55,864 IDEX Corp. 438,334 55,589 AGCO Corp. 960,474 53,825 * United Rentals Inc. 419,361 50,353 Actuant Corp. Class A 2,045,019 48,774 * XPO Logistics Inc. 521,706 46,630 * Proto Labs Inc. 389,124 46,481 TransUnion 690,915 45,428 Watts Water Technologies Inc. Class A 644,118 45,120 * Clean Harbors Inc. 656,364 44,659 * SPX FLOW Inc. 1,279,887 43,810 * Middleby Corp. 382,891 42,999 Kennametal Inc. 1,154,219 40,917 Multi-Color Corp. 719,229 38,234 GATX Corp. 498,557 37,357 Heartland Express Inc. 1,865,619 36,324 * Masonite International Corp. 615,000 34,065 * Cimpress NV 271,075 33,882 * CoStar Group Inc. 91,243 32,977 * Verisk Analytics Inc. Class A 268,691 32,200 ABM Industries Inc. 1,046,585 32,182 Forward Air Corp. 517,840 31,065 * JELD-WEN Holding Inc. 1,865,600 30,335 Allegion plc 319,209 27,366 * MRC Global Inc. 1,721,000 27,243 Tennant Co. 407,783 24,924 Huntington Ingalls Industries Inc. 107,536 23,494 Harris Corp. 155,695 23,153 Spirit AeroSystems Holdings Inc. Class A 248,093 20,842 * WABCO Holdings Inc. 190,000 20,415 Allison Transmission Holdings Inc. 450,971 19,879 * WageWorks Inc. 493,207 19,635 * Axon Enterprise Inc. 312,597 19,293 * Mercury Systems Inc. 411,366 19,277 Ritchie Bros Auctioneers Inc. 561,995 18,889 * SiteOne Landscape Supply Inc. 270,162 18,382 * Harsco Corp. 660,790 18,152 * RBC Bearings Inc. 117,200 17,308 Robert Half International Inc. 278,194 16,839
6
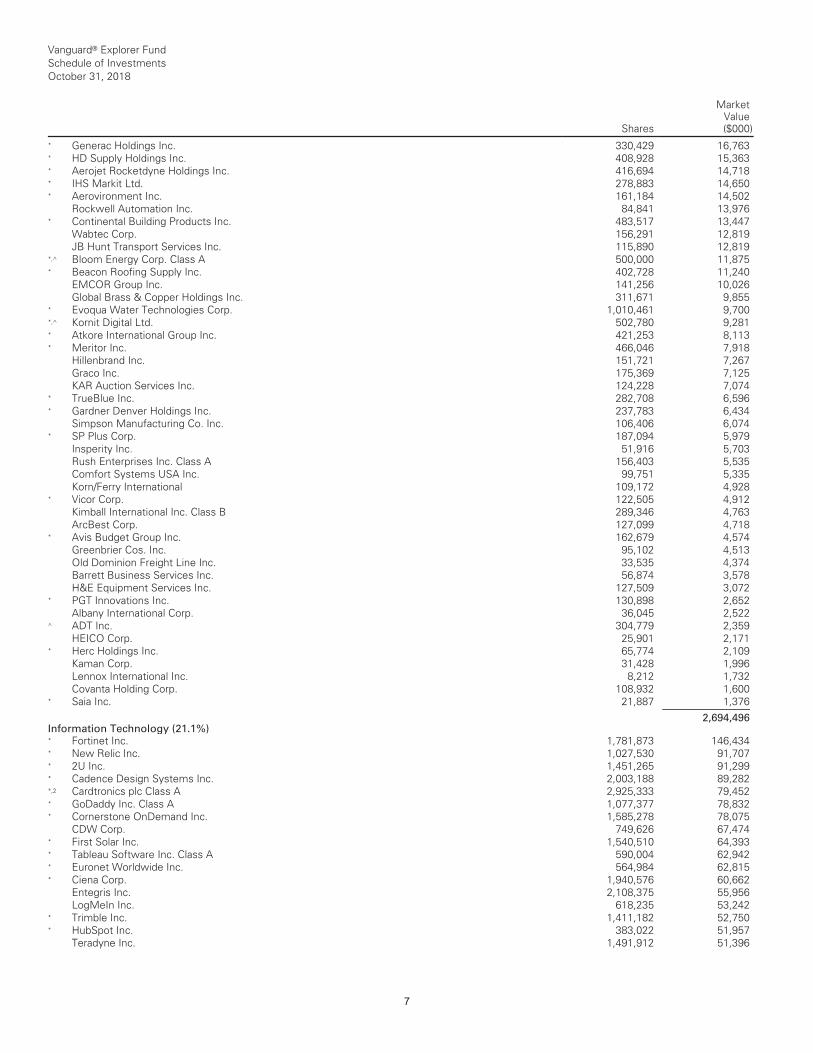
Vanguard® Explorer Fund Schedule of Investments October 31, 2018
Shares
MarketValue($000)
__________________________________________________________________________________________________________________________________________________________________________________________________________________________________________________________________________________________________________________________________________________________________________________________________________________________________________________________________________________________________________________________________________________________________________________________________________________________________________________________________________________________ __________________________________________________________________________________________________________________________________________________________________________________________________________________________________________________________________________________________________________________________________________________________________________________________________________________________________________________________________________________________________________________________________________________________________________________________________________________________________________________________________________________________
* Generac Holdings Inc. 330,429 16,763 * HD Supply Holdings Inc. 408,928 15,363 * Aerojet Rocketdyne Holdings Inc. 416,694 14,718 * IHS Markit Ltd. 278,883 14,650 * Aerovironment Inc. 161,184 14,502 Rockwell Automation Inc. 84,841 13,976 * Continental Building Products Inc. 483,517 13,447 Wabtec Corp. 156,291 12,819 JB Hunt Transport Services Inc. 115,890 12,819 *,^ Bloom Energy Corp. Class A 500,000 11,875 * Beacon Roofing Supply Inc. 402,728 11,240 EMCOR Group Inc. 141,256 10,026 Global Brass & Copper Holdings Inc. 311,671 9,855 * Evoqua Water Technologies Corp. 1,010,461 9,700 *,^ Kornit Digital Ltd. 502,780 9,281 * Atkore International Group Inc. 421,253 8,113 * Meritor Inc. 466,046 7,918 Hillenbrand Inc. 151,721 7,267 Graco Inc. 175,369 7,125 KAR Auction Services Inc. 124,228 7,074 * TrueBlue Inc. 282,708 6,596 * Gardner Denver Holdings Inc. 237,783 6,434 Simpson Manufacturing Co. Inc. 106,406 6,074 * SP Plus Corp. 187,094 5,979 Insperity Inc. 51,916 5,703 Rush Enterprises Inc. Class A 156,403 5,535 Comfort Systems USA Inc. 99,751 5,335 Korn/Ferry International 109,172 4,928 * Vicor Corp. 122,505 4,912 Kimball International Inc. Class B 289,346 4,763 ArcBest Corp. 127,099 4,718 * Avis Budget Group Inc. 162,679 4,574 Greenbrier Cos. Inc. 95,102 4,513 Old Dominion Freight Line Inc. 33,535 4,374 Barrett Business Services Inc. 56,874 3,578 H&E Equipment Services Inc. 127,509 3,072 * PGT Innovations Inc. 130,898 2,652 Albany International Corp. 36,045 2,522 ^ ADT Inc. 304,779 2,359 HEICO Corp. 25,901 2,171 * Herc Holdings Inc. 65,774 2,109 Kaman Corp. 31,428 1,996 Lennox International Inc. 8,212 1,732 Covanta Holding Corp. 108,932 1,600 * Saia Inc. 21,887 1,376 ___________ 2,694,496 Information Technology (21.1%)
* Fortinet Inc. 1,781,873 146,434 * New Relic Inc. 1,027,530 91,707 * 2U Inc. 1,451,265 91,299 * Cadence Design Systems Inc. 2,003,188 89,282 *,2 Cardtronics plc Class A 2,925,333 79,452 * GoDaddy Inc. Class A 1,077,377 78,832 * Cornerstone OnDemand Inc. 1,585,278 78,075 CDW Corp. 749,626 67,474 * First Solar Inc. 1,540,510 64,393 * Tableau Software Inc. Class A 590,004 62,942 * Euronet Worldwide Inc. 564,984 62,815 * Ciena Corp. 1,940,576 60,662 Entegris Inc. 2,108,375 55,956 LogMeIn Inc. 618,235 53,242 * Trimble Inc. 1,411,182 52,750 * HubSpot Inc. 383,022 51,957 Teradyne Inc. 1,491,912 51,396
7

Vanguard® Explorer Fund Schedule of Investments October 31, 2018
Shares
MarketValue($000)
__________________________________________________________________________________________________________________________________________________________________________________________________________________________________________________________________________________________________________________________________________________________________________________________________________________________________________________________________________________________________________________________________________________________________________________________________________________________________________________________________________________________ __________________________________________________________________________________________________________________________________________________________________________________________________________________________________________________________________________________________________________________________________________________________________________________________________________________________________________________________________________________________________________________________________________________________________________________________________________________________________________________________________________________________
* Five9 Inc. 1,302,013 51,247 * Arrow Electronics Inc. 725,889 49,150 * Cloudera Inc. 3,491,552 48,044 * Itron Inc. 900,200 46,936 * Aspen Technology Inc. 552,084 46,866 * Trade Desk Inc. Class A 367,781 45,439 Power Integrations Inc. 800,661 45,093 * Wix.com Ltd. 453,000 44,100 MAXIMUS Inc. 651,856 42,351 * Square Inc. 534,034 39,225 * CyberArk Software Ltd. 558,371 38,114 * Atlassian Corp. plc Class A 501,815 38,093 * Twilio Inc. Class A 503,882 37,902 * ServiceNow Inc. 189,870 34,374 * Zendesk Inc. 624,702 34,340 *,^ DocuSign Inc. Class A 763,924 32,039 * WEX Inc. 179,649 31,611 * Advanced Micro Devices Inc. 1,701,792 30,990 SS&C Technologies Holdings Inc. 598,569 30,623 * Guidewire Software Inc. 316,037 28,118 * Proofpoint Inc. 306,169 27,846 * Ultimate Software Group Inc. 103,366 27,561 j2 Global Inc. 376,918 27,455 * RealPage Inc. 514,945 27,292 * Carbonite Inc. 797,167 27,271 * IPG Photonics Corp. 198,242 26,475 * Imperva Inc. 477,000 26,402 FLIR Systems Inc. 561,859 26,020 * Semtech Corp. 578,845 26,013 * Acacia Communications Inc. 736,107 25,374 * Zebra Technologies Corp. 151,533 25,200 *,^ Ambarella Inc. 709,022 24,660 * Envestnet Inc. 468,792 24,387 * Inphi Corp. 748,000 23,936 Booz Allen Hamilton Holding Corp. Class A 460,117 22,794 * ON Semiconductor Corp. 1,337,966 22,745 * RingCentral Inc. Class A 286,022 22,233 *,^ SolarWinds Corp. 1,500,911 21,898 Alliance Data Systems Corp. 102,000 21,030 * Tyler Technologies Inc. 95,855 20,289 ^ Microchip Technology Inc. 305,587 20,102 Presidio Inc. 1,492,500 20,000 * Gartner Inc. 134,761 19,880 * Manhattan Associates Inc. 406,834 19,422 * PTC Inc. 235,300 19,391 Switch Inc. 2,162,346 19,180 * Red Hat Inc. 111,379 19,117 Cognex Corp. 445,909 19,103 Sabre Corp. 753,635 18,577 * Shopify Inc. 128,913 17,809 Belden Inc. 326,425 17,643 * Silicon Laboratories Inc. 213,581 17,413 * Q2 Holdings Inc. 312,751 16,648 Jack Henry & Associates Inc. 110,000 16,481 * Unisys Corp. 880,957 16,218 Broadridge Financial Solutions Inc. 132,554 15,501 National Instruments Corp. 308,157 15,090 * Qualys Inc. 210,820 15,019 * Workiva Inc. 428,875 14,620 * Palo Alto Networks Inc. 74,950 13,719 * Box Inc. 758,510 13,653 * FireEye Inc. 707,047 13,073 Monolithic Power Systems Inc. 110,370 13,037 * ANSYS Inc. 80,683 12,066
8
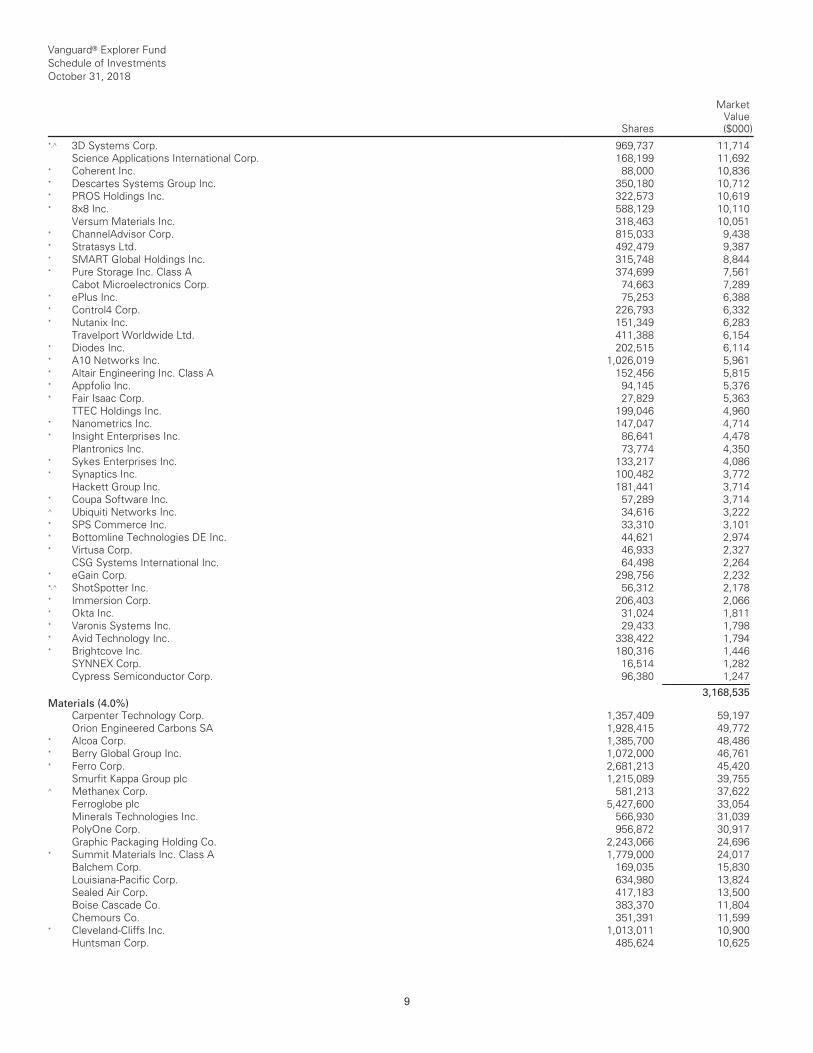
Vanguard® Explorer Fund Schedule of Investments October 31, 2018
Shares
MarketValue($000)
__________________________________________________________________________________________________________________________________________________________________________________________________________________________________________________________________________________________________________________________________________________________________________________________________________________________________________________________________________________________________________________________________________________________________________________________________________________________________________________________________________________________ __________________________________________________________________________________________________________________________________________________________________________________________________________________________________________________________________________________________________________________________________________________________________________________________________________________________________________________________________________________________________________________________________________________________________________________________________________________________________________________________________________________________
*,^ 3D Systems Corp. 969,737 11,714 Science Applications International Corp. 168,199 11,692 * Coherent Inc. 88,000 10,836 * Descartes Systems Group Inc. 350,180 10,712 * PROS Holdings Inc. 322,573 10,619 * 8x8 Inc. 588,129 10,110 Versum Materials Inc. 318,463 10,051 * ChannelAdvisor Corp. 815,033 9,438 * Stratasys Ltd. 492,479 9,387 * SMART Global Holdings Inc. 315,748 8,844 * Pure Storage Inc. Class A 374,699 7,561 Cabot Microelectronics Corp. 74,663 7,289 * ePlus Inc. 75,253 6,388 * Control4 Corp. 226,793 6,332 * Nutanix Inc. 151,349 6,283 Travelport Worldwide Ltd. 411,388 6,154 * Diodes Inc. 202,515 6,114 * A10 Networks Inc. 1,026,019 5,961 * Altair Engineering Inc. Class A 152,456 5,815 * Appfolio Inc. 94,145 5,376 * Fair Isaac Corp. 27,829 5,363 TTEC Holdings Inc. 199,046 4,960 * Nanometrics Inc. 147,047 4,714 * Insight Enterprises Inc. 86,641 4,478 Plantronics Inc. 73,774 4,350 * Sykes Enterprises Inc. 133,217 4,086 * Synaptics Inc. 100,482 3,772 Hackett Group Inc. 181,441 3,714 * Coupa Software Inc. 57,289 3,714 ^ Ubiquiti Networks Inc. 34,616 3,222 * SPS Commerce Inc. 33,310 3,101 * Bottomline Technologies DE Inc. 44,621 2,974 * Virtusa Corp. 46,933 2,327 CSG Systems International Inc. 64,498 2,264 * eGain Corp. 298,756 2,232 *,^ ShotSpotter Inc. 56,312 2,178 * Immersion Corp. 206,403 2,066 * Okta Inc. 31,024 1,811 * Varonis Systems Inc. 29,433 1,798 * Avid Technology Inc. 338,422 1,794 * Brightcove Inc. 180,316 1,446 SYNNEX Corp. 16,514 1,282 Cypress Semiconductor Corp. 96,380 1,247 ___________ 3,168,535 Materials (4.0%)
Carpenter Technology Corp. 1,357,409 59,197 Orion Engineered Carbons SA 1,928,415 49,772 * Alcoa Corp. 1,385,700 48,486 * Berry Global Group Inc. 1,072,000 46,761 * Ferro Corp. 2,681,213 45,420 Smurfit Kappa Group plc 1,215,089 39,755 ^ Methanex Corp. 581,213 37,622 Ferroglobe plc 5,427,600 33,054 Minerals Technologies Inc. 566,930 31,039 PolyOne Corp. 956,872 30,917 Graphic Packaging Holding Co. 2,243,066 24,696 * Summit Materials Inc. Class A 1,779,000 24,017 Balchem Corp. 169,035 15,830 Louisiana-Pacific Corp. 634,980 13,824 Sealed Air Corp. 417,183 13,500 Boise Cascade Co. 383,370 11,804 Chemours Co. 351,391 11,599 * Cleveland-Cliffs Inc. 1,013,011 10,900 Huntsman Corp. 485,624 10,625
9
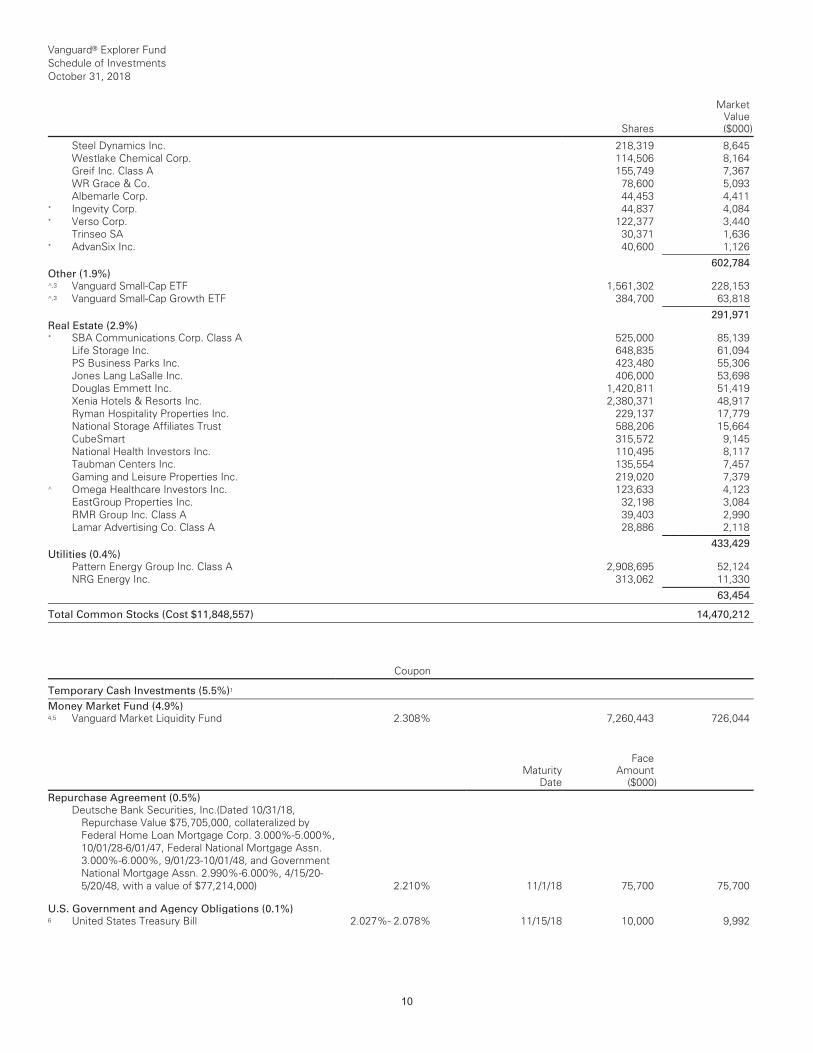
Vanguard® Explorer Fund Schedule of Investments October 31, 2018
Shares
MarketValue($000)
__________________________________________________________________________________________________________________________________________________________________________________________________________________________________________________________________________________________________________________________________________________________________________________________________________________________________________________________________________________________________________________________________________________________________________________________________________________________________________________________________________________________ __________________________________________________________________________________________________________________________________________________________________________________________________________________________________________________________________________________________________________________________________________________________________________________________________________________________________________________________________________________________________________________________________________________________________________________________________________________________________________________________________________________________
Steel Dynamics Inc. 218,319 8,645Westlake Chemical Corp. 114,506 8,164 Greif Inc. Class A 155,749 7,367WR Grace & Co. 78,600 5,093Albemarle Corp. 44,453 4,411
* Ingevity Corp. 44,837 4,084* Verso Corp. 122,377 3,440
Trinseo SA 30,371 1,636* AdvanSix Inc. 40,600 1,126___________
602,784 Other (1.9%)^,3 Vanguard Small-Cap ETF 1,561,302 228,153 ^,3 Vanguard Small-Cap Growth ETF 384,700 63,818___________
291,971 Real Estate (2.9%)* SBA Communications Corp. Class A 525,000 85,139
Life Storage Inc. 648,835 61,094PS Business Parks Inc. 423,480 55,306Jones Lang LaSalle Inc. 406,000 53,698Douglas Emmett Inc. 1,420,811 51,419Xenia Hotels & Resorts Inc. 2,380,371 48,917 Ryman Hospitality Properties Inc. 229,137 17,779 National Storage Affiliates Trust 588,206 15,664 CubeSmart 315,572 9,145National Health Investors Inc. 110,495 8,117 Taubman Centers Inc. 135,554 7,457Gaming and Leisure Properties Inc. 219,020 7,379
^ Omega Healthcare Investors Inc. 123,633 4,123 EastGroup Properties Inc. 32,198 3,084 RMR Group Inc. Class A 39,403 2,990 Lamar Advertising Co. Class A 28,886 2,118 ___________
433,429 Utilities (0.4%)
Pattern Energy Group Inc. Class A 2,908,695 52,124 NRG Energy Inc. 313,062 11,330___________
63,454 __________________________________________________________________________________________________________________________________________________________________________________________________________________________________________________________________________________________________________________________________________________________________________________________________________________________________________________________________________________________________________________________________________________________________________________________________________________________________________________________________________________________ __________________________________________________________________________________________________________________________________________________________________________________________________________________________________________________________________________________________________________________________________________________________________________________________________________________________________________________________________________________________________________________________________________________________________________________________________________________________________________________________________________________________
Total Common Stocks (Cost $11,848,557) 14,470,212 __________________________________________________________________________________________________________________________________________________________________________________________________________________________________________________________________________________________________________________________________________________________________________________________________________________________________________________________________________________________________________________________________________________________________________________________________________________________________________________________________________________________ __________________________________________________________________________________________________________________________________________________________________________________________________________________________________________________________________________________________________________________________________________________________________________________________________________________________________________________________________________________________________________________________________________________________________________________________________________________________________________________________________________________________
Coupon __________________________________________________________________________________________________________________________________________________________________________________________________________________________________________________________________________________________________________________________________________________________________________________________________________________________________________________________________________________________________________________________________________________________________________________________________________________________________________________________________________________________ __________________________________________________________________________________________________________________________________________________________________________________________________________________________________________________________________________________________________________________________________________________________________________________________________________________________________________________________________________________________________________________________________________________________________________________________________________________________________________________________________________________________
Temporary Cash Investments (5.5%)1 __________________________________________________________________________________________________________________________________________________________________________________________________________________________________________________________________________________________________________________________________________________________________________________________________________________________________________________________________________________________________________________________________________________________________________________________________________________________________________________________________________________________ __________________________________________________________________________________________________________________________________________________________________________________________________________________________________________________________________________________________________________________________________________________________________________________________________________________________________________________________________________________________________________________________________________________________________________________________________________________________________________________________________________________________
Money Market Fund (4.9%)4,5 Vanguard Market Liquidity Fund 2.308% 7,260,443 726,044
MaturityDate
FaceAmount
($000) __________________________________________________________________________________________________________________________________________________________________________________________________________________________________________________________________________________________________________________________________________________________________________________________________________________________________________________________________________________________________________________________________________________________________________________________________________________________________________________________________________________________ __________________________________________________________________________________________________________________________________________________________________________________________________________________________________________________________________________________________________________________________________________________________________________________________________________________________________________________________________________________________________________________________________________________________________________________________________________________________________________________________________________________________
Repurchase Agreement (0.5%)Deutsche Bank Securities, Inc.(Dated 10/31/18,
Repurchase Value $75,705,000, collateralized by Federal Home Loan Mortgage Corp. 3.000%-5.000%, 10/01/28-6/01/47, Federal National Mortgage Assn. 3.000%-6.000%, 9/01/23-10/01/48, and Government National Mortgage Assn. 2.990%-6.000%, 4/15/20-5/20/48, with a value of $77,214,000) 2.210% 11/1/18 75,700 75,700
U.S. Government and Agency Obligations (0.1%)6 United States Treasury Bill 2.027%- 2.078% 11/15/18 10,000 9,992
10

Vanguard® Explorer Fund Schedule of Investments October 31, 2018
Coupon Maturity
Date
FaceAmount
($000)
MarketValue($000)
__________________________________________________________________________________________________________________________________________________________________________________________________________________________________________________________________________________________________________________________________________________________________________________________________________________________________________________________________________________________________________________________________________________________________________________________________________________________________________________________________________________________ __________________________________________________________________________________________________________________________________________________________________________________________________________________________________________________________________________________________________________________________________________________________________________________________________________________________________________________________________________________________________________________________________________________________________________________________________________________________________________________________________________________________
6 United States Treasury Bill 2.037%- 2.040% 11/29/18 1,550 1,547 6 United States Treasury Bill 2.199% 1/24/19 2,000 1,990 6 United States Treasury Bill 2.292% 2/21/19 2,000 1,986 6 United States Treasury Bill 2.302% 2/28/19 500 496 6 United States Treasury Bill 2.365% 3/21/19 200 198 ___________ 16,209 __________________________________________________________________________________________________________________________________________________________________________________________________________________________________________________________________________________________________________________________________________________________________________________________________________________________________________________________________________________________________________________________________________________________________________________________________________________________________________________________________________________________ __________________________________________________________________________________________________________________________________________________________________________________________________________________________________________________________________________________________________________________________________________________________________________________________________________________________________________________________________________________________________________________________________________________________________________________________________________________________________________________________________________________________
Total Temporary Cash Investments (Cost $817,918) 817,953 __________________________________________________________________________________________________________________________________________________________________________________________________________________________________________________________________________________________________________________________________________________________________________________________________________________________________________________________________________________________________________________________________________________________________________________________________________________________________________________________________________________________ __________________________________________________________________________________________________________________________________________________________________________________________________________________________________________________________________________________________________________________________________________________________________________________________________________________________________________________________________________________________________________________________________________________________________________________________________________________________________________________________________________________________
Total Investments (101.7%) (Cost $12,666,475) 15,288,165 __________________________________________________________________________________________________________________________________________________________________________________________________________________________________________________________________________________________________________________________________________________________________________________________________________________________________________________________________________________________________________________________________________________________________________________________________________________________________________________________________________________________ __________________________________________________________________________________________________________________________________________________________________________________________________________________________________________________________________________________________________________________________________________________________________________________________________________________________________________________________________________________________________________________________________________________________________________________________________________________________________________________________________________________________
Other Assets and Liabilities—Net (-1.7%)5,6 (251,827) __________________________________________________________________________________________________________________________________________________________________________________________________________________________________________________________________________________________________________________________________________________________________________________________________________________________________________________________________________________________________________________________________________________________________________________________________________________________________________________________________________________________ __________________________________________________________________________________________________________________________________________________________________________________________________________________________________________________________________________________________________________________________________________________________________________________________________________________________________________________________________________________________________________________________________________________________________________________________________________________________________________________________________________________________
Net Assets (100%) 15,036,338 __________________________________________________________________________________________________________________________________________________________________________________________________________________________________________________________________________________________________________________________________________________________________________________________________________________________________________________________________________________________________________________________________________________________________________________________________________________________________________________________________________________________ __________________________________________________________________________________________________________________________________________________________________________________________________________________________________________________________________________________________________________________________________________________________________________________________________________________________________________________________________________________________________________________________________________________________________________________________________________________________________________________________________________________________
* Non-income-producing security. ^ Includes partial security positions on loan to broker-dealers. The total value of securities on loan is $199,760,000. 1 The fund invests a portion of its cash reserves in equity markets through the use of index futures contracts. After giving effect to futures
investments, the fund's effective common stock and temporary cash investment positions represent 98.5% and 3.2%, respectively, of net assets.
2 Considered an affiliated company of the fund as the fund owns more than 5% of the outstanding voting securities of such company. 3 Considered an affiliated company of the fund as the issuer is another member of The Vanguard Group. 4 Affiliated money market fund available only to Vanguard funds and certain trusts and accounts managed by Vanguard. Rate shown is the 7-day
yield. 5 Includes $205,568,000 of collateral received for securities on loan. 6 Securities with a value of $15,619,000,000 and cash of $1,487,000 have been segregated as initial margin for open futures contracts. ADR—American Depositary Receipt.
11

© 2018 The Vanguard Group, Inc. All rights reserved. Vanguard Marketing Corporation, Distributor.
SNA240 1 2018