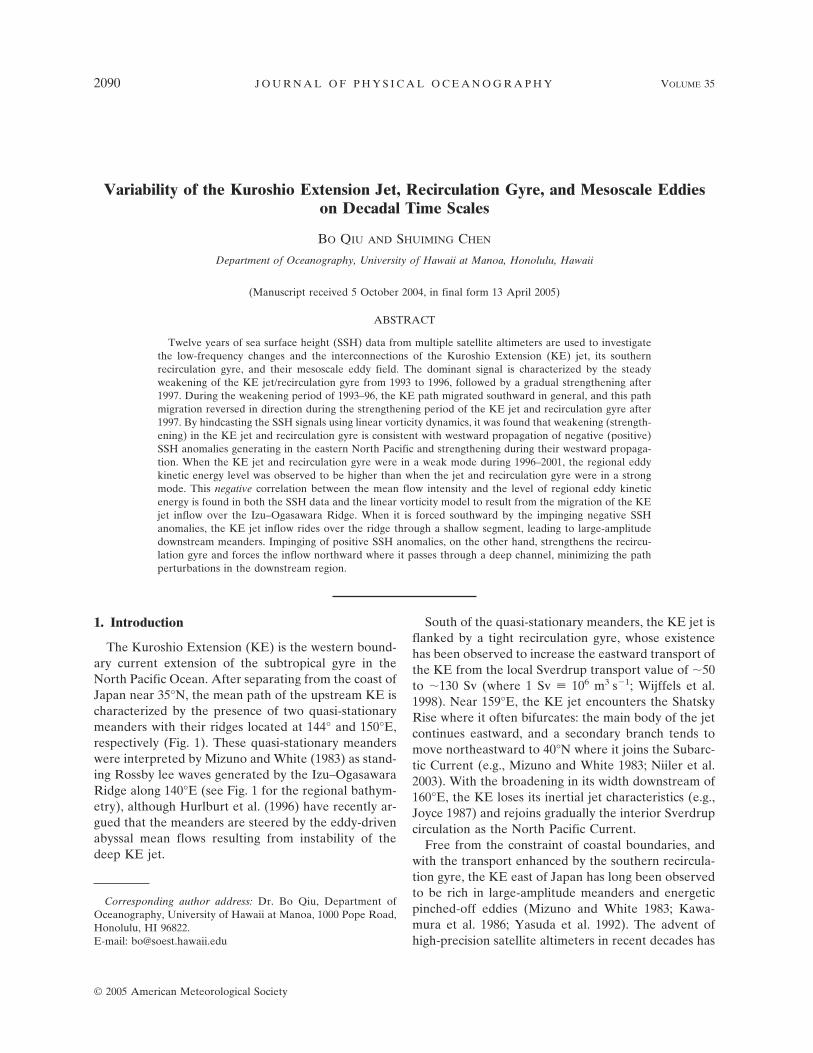
variability of the kuroshio extension jet, recirculation ... · pdf fileimpinging of positive...
TRANSCRIPT
Variability of the Kuroshio Extension Jet, Recirculation Gyre, and Mesoscale Eddieson Decadal Time Scales
BO QIU AND SHUIMING CHEN
Department of Oceanography, University of Hawaii at Manoa, Honolulu, Hawaii
(Manuscript received 5 October 2004, in final form 13 April 2005)
ABSTRACT
Twelve years of sea surface height (SSH) data from multiple satellite altimeters are used to investigatethe low-frequency changes and the interconnections of the Kuroshio Extension (KE) jet, its southernrecirculation gyre, and their mesoscale eddy field. The dominant signal is characterized by the steadyweakening of the KE jet/recirculation gyre from 1993 to 1996, followed by a gradual strengthening after1997. During the weakening period of 1993–96, the KE path migrated southward in general, and this pathmigration reversed in direction during the strengthening period of the KE jet and recirculation gyre after1997. By hindcasting the SSH signals using linear vorticity dynamics, it was found that weakening (strength-ening) in the KE jet and recirculation gyre is consistent with westward propagation of negative (positive)SSH anomalies generating in the eastern North Pacific and strengthening during their westward propaga-tion. When the KE jet and recirculation gyre were in a weak mode during 1996–2001, the regional eddykinetic energy level was observed to be higher than when the jet and recirculation gyre were in a strongmode. This negative correlation between the mean flow intensity and the level of regional eddy kineticenergy is found in both the SSH data and the linear vorticity model to result from the migration of the KEjet inflow over the Izu–Ogasawara Ridge. When it is forced southward by the impinging negative SSHanomalies, the KE jet inflow rides over the ridge through a shallow segment, leading to large-amplitudedownstream meanders. Impinging of positive SSH anomalies, on the other hand, strengthens the recircu-lation gyre and forces the inflow northward where it passes through a deep channel, minimizing the pathperturbations in the downstream region.
1. Introduction
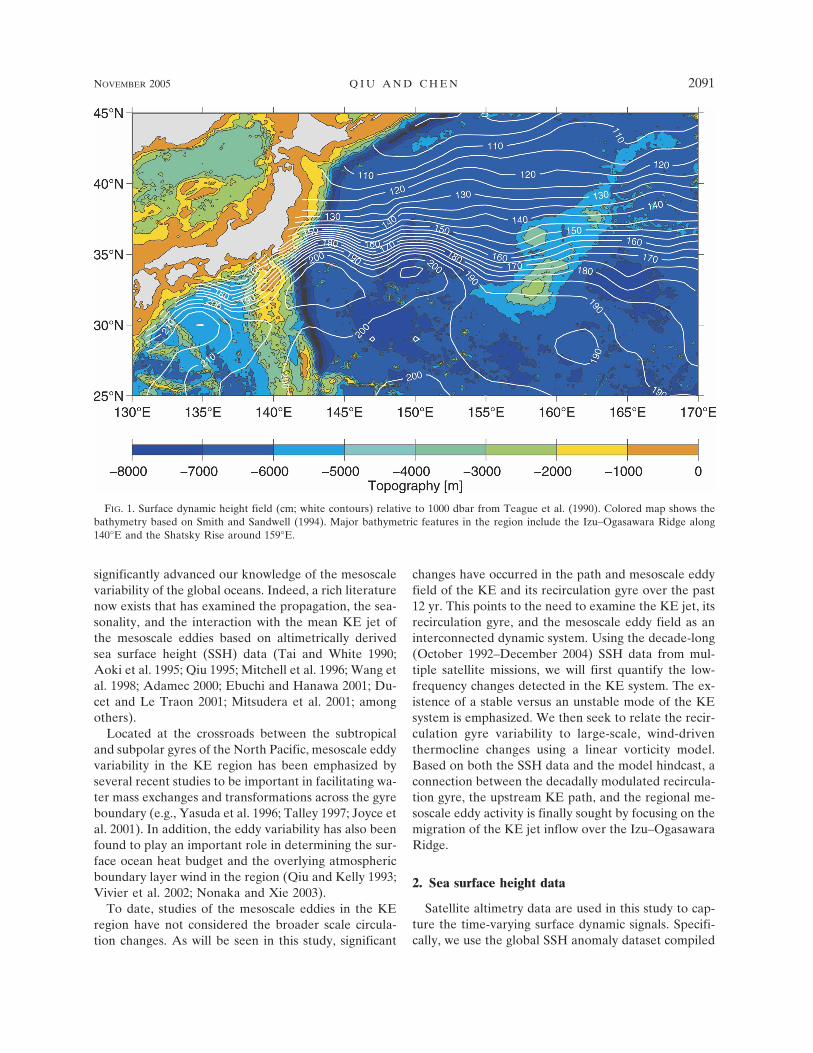
The Kuroshio Extension (KE) is the western bound-ary current extension of the subtropical gyre in theNorth Pacific Ocean. After separating from the coast ofJapan near 35°N, the mean path of the upstream KE ischaracterized by the presence of two quasi-stationarymeanders with their ridges located at 144° and 150°E,respectively (Fig. 1). These quasi-stationary meanderswere interpreted by Mizuno and White (1983) as stand-ing Rossby lee waves generated by the Izu–OgasawaraRidge along 140°E (see Fig. 1 for the regional bathym-etry), although Hurlburt et al. (1996) have recently ar-gued that the meanders are steered by the eddy-drivenabyssal mean flows resulting from instability of thedeep KE jet.
South of the quasi-stationary meanders, the KE jet isflanked by a tight recirculation gyre, whose existencehas been observed to increase the eastward transport ofthe KE from the local Sverdrup transport value of �50to �130 Sv (where 1 Sv � 106 m3 s�1; Wijffels et al.1998). Near 159°E, the KE jet encounters the ShatskyRise where it often bifurcates: the main body of the jetcontinues eastward, and a secondary branch tends tomove northeastward to 40°N where it joins the Subarc-tic Current (e.g., Mizuno and White 1983; Niiler et al.2003). With the broadening in its width downstream of160°E, the KE loses its inertial jet characteristics (e.g.,Joyce 1987) and rejoins gradually the interior Sverdrupcirculation as the North Pacific Current.
Free from the constraint of coastal boundaries, andwith the transport enhanced by the southern recircula-tion gyre, the KE east of Japan has long been observedto be rich in large-amplitude meanders and energeticpinched-off eddies (Mizuno and White 1983; Kawa-mura et al. 1986; Yasuda et al. 1992). The advent ofhigh-precision satellite altimeters in recent decades has
Corresponding author address: Dr. Bo Qiu, Department ofOceanography, University of Hawaii at Manoa, 1000 Pope Road,Honolulu, HI 96822.E-mail: [email protected]
2090 J O U R N A L O F P H Y S I C A L O C E A N O G R A P H Y VOLUME 35
© 2005 American Meteorological Society
JPO2807
significantly advanced our knowledge of the mesoscalevariability of the global oceans. Indeed, a rich literaturenow exists that has examined the propagation, the sea-sonality, and the interaction with the mean KE jet ofthe mesoscale eddies based on altimetrically derivedsea surface height (SSH) data (Tai and White 1990;Aoki et al. 1995; Qiu 1995; Mitchell et al. 1996; Wang etal. 1998; Adamec 2000; Ebuchi and Hanawa 2001; Du-cet and Le Traon 2001; Mitsudera et al. 2001; amongothers).
Located at the crossroads between the subtropicaland subpolar gyres of the North Pacific, mesoscale eddyvariability in the KE region has been emphasized byseveral recent studies to be important in facilitating wa-ter mass exchanges and transformations across the gyreboundary (e.g., Yasuda et al. 1996; Talley 1997; Joyce etal. 2001). In addition, the eddy variability has also beenfound to play an important role in determining the sur-face ocean heat budget and the overlying atmosphericboundary layer wind in the region (Qiu and Kelly 1993;Vivier et al. 2002; Nonaka and Xie 2003).
To date, studies of the mesoscale eddies in the KEregion have not considered the broader scale circula-tion changes. As will be seen in this study, significant
changes have occurred in the path and mesoscale eddyfield of the KE and its recirculation gyre over the past12 yr. This points to the need to examine the KE jet, itsrecirculation gyre, and the mesoscale eddy field as aninterconnected dynamic system. Using the decade-long(October 1992–December 2004) SSH data from mul-tiple satellite missions, we will first quantify the low-frequency changes detected in the KE system. The ex-istence of a stable versus an unstable mode of the KEsystem is emphasized. We then seek to relate the recir-culation gyre variability to large-scale, wind-driventhermocline changes using a linear vorticity model.Based on both the SSH data and the model hindcast, aconnection between the decadally modulated recircula-tion gyre, the upstream KE path, and the regional me-soscale eddy activity is finally sought by focusing on themigration of the KE jet inflow over the Izu–OgasawaraRidge.
2. Sea surface height data
Satellite altimetry data are used in this study to cap-ture the time-varying surface dynamic signals. Specifi-cally, we use the global SSH anomaly dataset compiled
FIG. 1. Surface dynamic height field (cm; white contours) relative to 1000 dbar from Teague et al. (1990). Colored map shows thebathymetry based on Smith and Sandwell (1994). Major bathymetric features in the region include the Izu–Ogasawara Ridge along140°E and the Shatsky Rise around 159°E.
NOVEMBER 2005 Q I U A N D C H E N 2091
Fig 1 live 4/C

by the CLS Space Oceanographic Division of Toulouse,France. The dataset merges the Ocean Topography Ex-periment (TOPEX)/Poseidon, Jason-1, and EuropeanRemote Sensing Satellite ERS-1/2 along-track SSHmeasurements and has a much improved capability ofdetecting the mesoscale SSH signals (Le Traon andDibarboure 1999; Ducet et al. 2000). The CLS SSHdataset used in this study has a 7-day temporal resolu-tion and a 1/3° � 1/3° spatial resolution and covers theperiod from October 1992 to December 2004.
In a midlatitude western boundary current outflowregion such as the KE, part of the altimetrically mea-sured SSH anomaly signals reflects the seasonally vary-ing surface heat flux forcing that causes expansion orcontraction of the water column (e.g., Stammer 1997;Gilson et al. 1998). As these steric height changes arenot of interest to this study, they are removed from theweekly SSH anomaly dataset by using the surface heatflux product from the National Centers for Environ-mental Prediction (NCEP) reanalysis (Kalnay et al.1996).1 Once the SSH anomaly field h�(x, y, t) is deter-mined, the total SSH field h(x, y, t) is simply the sum ofthe climatological SSH field h(x, y) (see Fig. 1) and theanomaly field: h � h � h�. For brevity, the total SSHfield will be referred to simply as the SSH field below.
3. Low-frequency changes in the KE system
To explore the low-frequency changes in the KE jetand its surrounding areas, we start with Fig. 2 showingthe annually averaged SSH fields for the past 12 yr. In1993/94, the averaged SSH field had a spatial patternvery similar to the climatological SSH field (cf. Fig. 1):the two quasi-stationary meanders were well-developedand so was the southern recirculation gyre. This close-to-climatology SSH pattern, however, started to degen-erate during 1995–96, and by 1997 the averaged SSHpattern had almost no resemblance to that of the cli-matology: both the quasi-stationary meanders and thesouthern recirculation gyre are barely discernible.From 2000 to 2001, the quasi-stationary meanders canbe seen to reemerge and the southern recirculation gyreto restrengthen. In 2002–04, the averaged SSH shows
again a spatial pattern very similar to that of the clima-tology. While similar in pattern, it is important to em-phasize that the mean KE jet in 2003/04 is 2 times asstrong as the climatological KE jet (e.g., the SSH dif-ference across the first meander of the KE jet is 1.4 min 2003/04 in Fig. 2 as compared with 0.7 m in Fig. 1).
The low-frequency changes just described can also beseen in Fig. 3 in which we superimposed snapshots ofthe KE paths in individual years. Here, the paths of theKE jet are defined by the 170-cm SSH contours in theSSH maps. As indicated by the thick black lines in Fig.2, the 170-cm SSH contours are consistently located at,or near, the �h/�y maxima and are a good indicator forthe KE jet axis. As may be expected, the KE path tendsto be more variable during the period when the quasi-stationary meanders are obscure in the averaged SSHmaps (e.g., 1996–99) than when the quasi-stationarymeanders are well-defined in the average. Indeed, themost stable path of the KE jet is seen in 2002–04 whenthe quasi-stationary meanders and the southern recir-culation gyre are most fully developed.
To further understand the variability shown in Figs. 2and 3, we will divide our analyses below into four geo-graphical regions that encompass the KE system.
a. Upstream KE jet (141°–153°E)
As we noted in the introduction, the KE jet in thisupstream region is characterized by the presence of twoquasi-stationary meanders. Using the weekly SSH data,we plot in Fig. 4a the time series of the path length ofthe KE jet integrated in this region. Note that a straightzonal path in the region would have a length of 1090 kmand a larger value in Fig. 4a indicates a more convo-luted path taken by the KE jet. It is clear from the timeseries that the upstream KE jet in the last decade hadtwo distinct modes: a stable mode in which the KE jethad a short path accompanied by weak temporal vari-ability, and an unstable mode in which the KE path wasconvoluted and exhibited monthly time-scale fluctua-tions resulting from the shedding and merging of me-soscale eddies. The stable mode of the upstream KE jetexisted before May 1995 and after January 2002,whereas the unstable mode persisted from mid 1995 tothe end of 2001.
A look into the eddy kinetic energy level in the up-stream KE region (32°–38°N and 141°–153°E) revealsthat its variability correlates well the regional KE pathvariability. As shown in Fig. 4b, the eddy kinetic energylevel tends to be higher when the upstream KE path ismore convoluted and vice versa. Notice that becausethe “mean” KE jet also modulates with time (e.g., Fig.2), the eddy kinetic energy is calculated here based on
1 Using the surface meteorological data measured by a JapanMeteorological Agency buoy at 29°N, 135°E, we recently carriedout an in-depth comparison between the daily NCEP air–sea fluxproduct and the buoy estimate (Qiu et al. 2004). The rms ampli-tude of the NCEP net heat flux was found to be biased high by23%. Despite this amplitude bias, however, the NCEP productcaptures the timing and relative strength of the synoptic-scale netheat flux forcing very well. Based on this finding, the magnitude ofthe NCEP heat flux data used in this study is scaled down by18.7%.
2092 J O U R N A L O F P H Y S I C A L O C E A N O G R A P H Y VOLUME 35
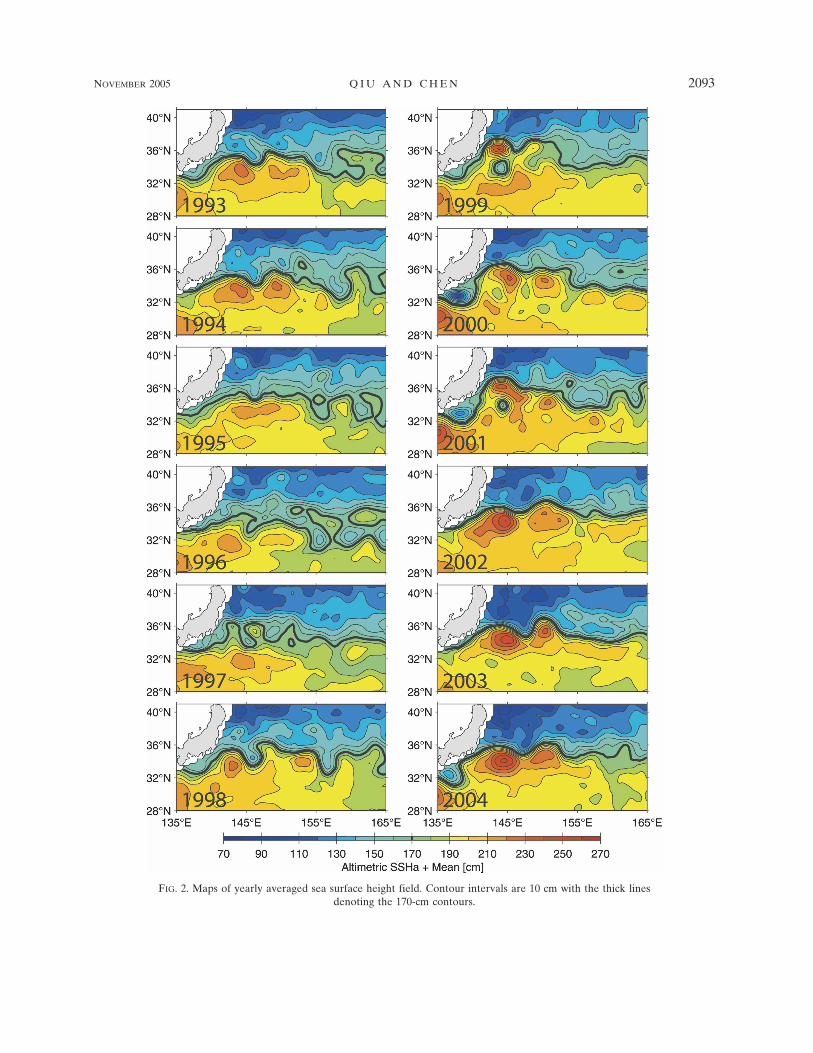
FIG. 2. Maps of yearly averaged sea surface height field. Contour intervals are 10 cm with the thick linesdenoting the 170-cm contours.
NOVEMBER 2005 Q I U A N D C H E N 2093
Fig 2 live 4/C
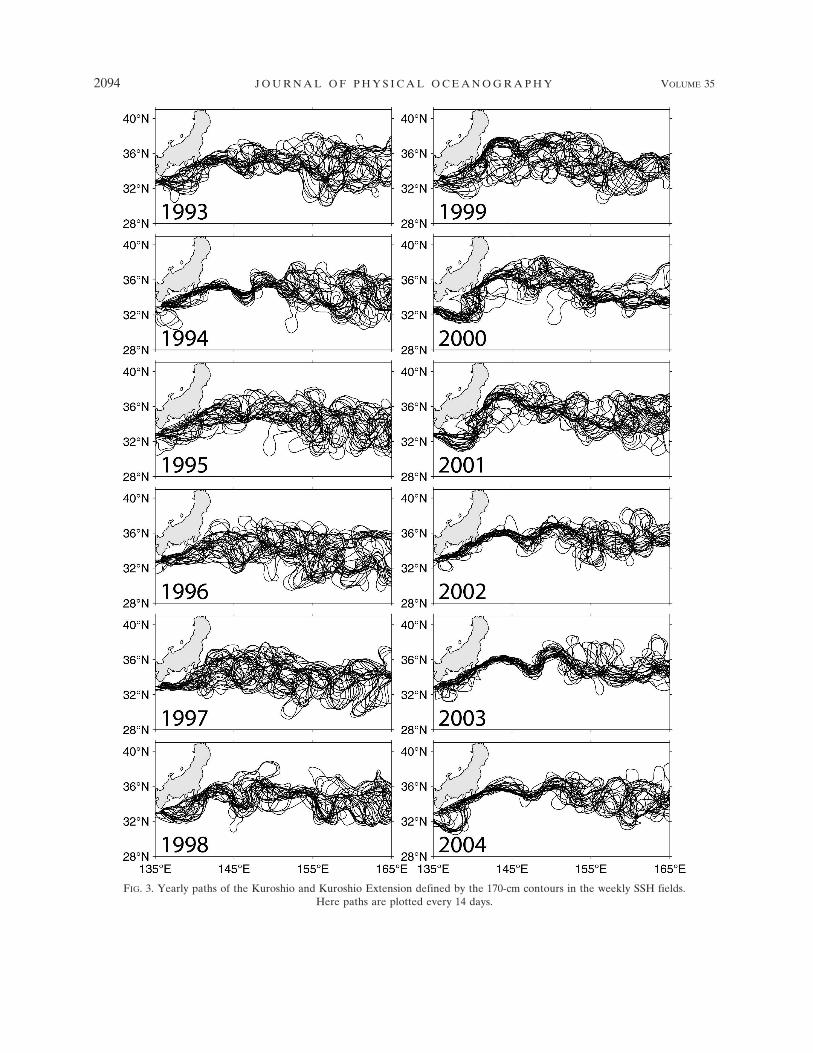
FIG. 3. Yearly paths of the Kuroshio and Kuroshio Extension defined by the 170-cm contours in the weekly SSH fields.Here paths are plotted every 14 days.
2094 J O U R N A L O F P H Y S I C A L O C E A N O G R A P H Y VOLUME 35

the high-pass filtered SSH anomaly data with timescales shorter than 300 days.
Figure 4c shows the time series of the mean latitudi-nal position of the KE jet averaged in the upstreamregion. Aside from the monthly time-scale signals in-duced by mesoscale eddies, the time series reveals aclear decadal modulation, with the zonal-mean KE jetlocated near 35.5°N in 1993/94, migrating southward in1996–97, shifting northward in 1998–99, and returningto its climatological latitude of 35.5°N in 2003–04.
Decadal modulation is also clear in Fig. 4d, whichshows the time series of the SSH difference h� acrossthe KE jet averaged from 141° to 153°E. Here, h isevaluated at each longitude by first averaging the SSHvalues over the 1.5° bins centered 1° north and south ofthe KE’s axis (hN and hS), and then taking the differ-ence h � hS � hN. From geostrophy, h� gives a mea-sure of the mean strength of the upstream KE jet. Con-sistent with the yearly SSH maps of Fig. 2, the upstreamKE jet was strong in 1992–93 and had a decreasing
trend in strength from 1994 to 1997. This trend reversedafter 1998 and the upstream KE jet increased itsstrength to the level of 1992–93 in recent years.
b. Downstream KE jet (153°–165°E)
The KE jet downstream of 153°E is in general morevariable than its upstream counterpart both because itis farther away from the coastal boundary and becausethe jet here has to negotiate with the presence of theShatsky Rise (see Fig. 1). Similar to Fig. 4, we plot inFig. 5a the time series of the KE path length integratedfrom 153° to 165°E. Interestingly, the downstream KEpath shows a time evolution different from that of Fig.4a: the KE path was long during 1993–97 and remainedrelatively short after 1998. Also unlike the upstreamKE jet, Fig. 5b shows that the variability of the KE pathlength in the downstream region does not correlate wellwith the regional eddy kinetic energy signals. This lackof correlation is particularly obvious in 2001–04 duringwhich an increase in the regional eddy kinetic energylevel was not accompanied by the lengthening of the
FIG. 4. (a) Upstream KE path length integrated from 141° to153°E. (b) Eddy kinetic energy in the upstream KE region of32°–38°N and 141°–153°E. (c) Latitudinal position of the KE av-eraged from 141° to 153°E. (d) SSH difference across the KE jetaveraged from 141° to 153°E. Gray lines denote the mean valuesof the quantity over the period of analysis.
FIG. 5. Same as Fig. 4 but for the downstream KE jet(153°–165°E).
NOVEMBER 2005 Q I U A N D C H E N 2095
KE path. Inspection of the sequential SSH maps (notshown) indicates that after 2001 the meandering KE jetin the downstream region tended to displace zonally,rather than meridionally. While elevating the regionaleddy kinetic energy level, this east–west displacementof the meandering jet leads to no lengthening of the KEpath.
Although temporally more variable, the zonal meanposition of the downstream KE jet exhibits a decadalchange quite similar to that of the upstream KE jet (cf.Figs. 4c and 5c): the zonal mean jet position had a gen-erally southward migration during 1994–97, but re-versed the direction during 1997–2002. When comparedwith the time series of Fig. 4d, Fig. 5d shows a similardecadal trend in the strength of the downstream KE jet:the zonal-mean SSH difference h� was high in 1992–93, dropped to a low level during 1994–96, and re-bounded after 2002.
c. Southern recirculation gyre
From the basic dynamics of a western boundary cur-rent extension (e.g., Pedlosky 1996), one expects someof the low-frequency changes of the KE jet describedabove to be connected to the variability of the southernrecirculation gyre. To quantify this connection, we fo-cus in this subsection on the SSH signals in the regionbounded to the east by the Shatsky Rise (158°E; seeFig. 1), west by the Izu Ridge (141°E), north by the KEjet, and south by the 30°N parallel. As depicted in Fig.1, this is the region nominally occupied by the southernrecirculation gyre of the KE.
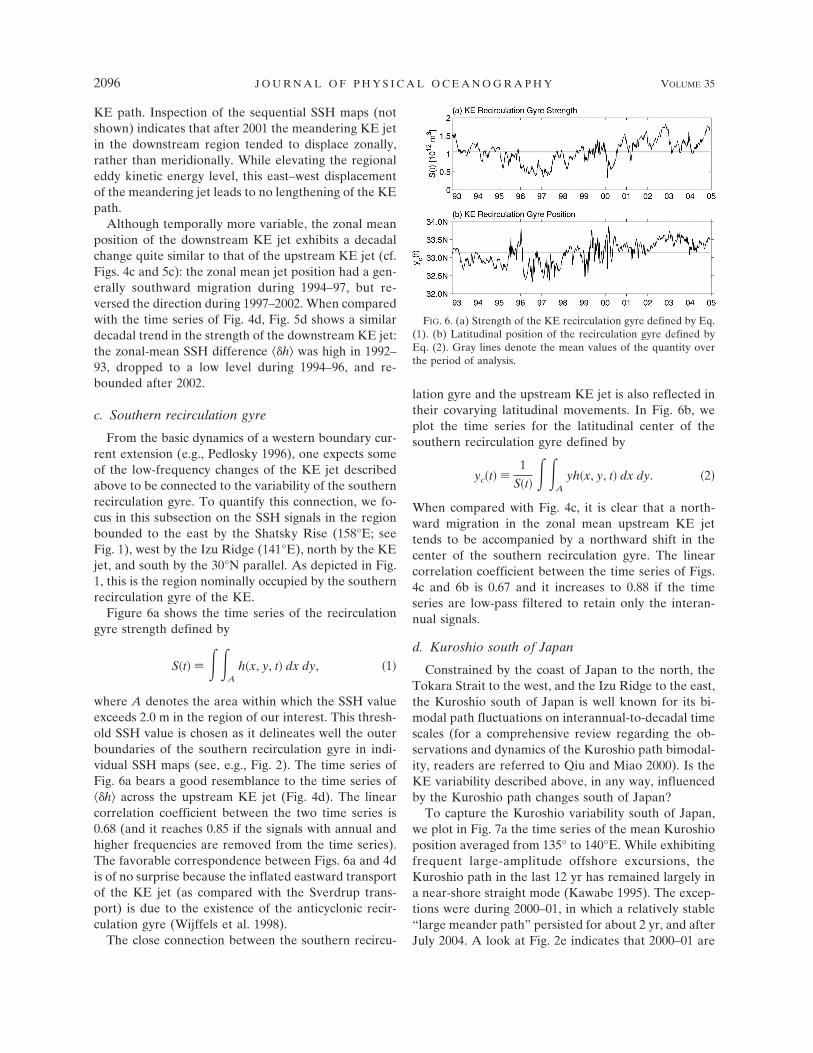
Figure 6a shows the time series of the recirculationgyre strength defined by
S�t � ��A
h�x, y, t dx dy, �1
where A denotes the area within which the SSH valueexceeds 2.0 m in the region of our interest. This thresh-old SSH value is chosen as it delineates well the outerboundaries of the southern recirculation gyre in indi-vidual SSH maps (see, e.g., Fig. 2). The time series ofFig. 6a bears a good resemblance to the time series ofh� across the upstream KE jet (Fig. 4d). The linearcorrelation coefficient between the two time series is0.68 (and it reaches 0.85 if the signals with annual andhigher frequencies are removed from the time series).The favorable correspondence between Figs. 6a and 4dis of no surprise because the inflated eastward transportof the KE jet (as compared with the Sverdrup trans-port) is due to the existence of the anticyclonic recir-culation gyre (Wijffels et al. 1998).
The close connection between the southern recircu-
lation gyre and the upstream KE jet is also reflected intheir covarying latitudinal movements. In Fig. 6b, weplot the time series for the latitudinal center of thesouthern recirculation gyre defined by
yc�t �1
S�t ��A
yh�x, y, t dx dy. �2
When compared with Fig. 4c, it is clear that a north-ward migration in the zonal mean upstream KE jettends to be accompanied by a northward shift in thecenter of the southern recirculation gyre. The linearcorrelation coefficient between the time series of Figs.4c and 6b is 0.67 and it increases to 0.88 if the timeseries are low-pass filtered to retain only the interan-nual signals.
d. Kuroshio south of Japan
Constrained by the coast of Japan to the north, theTokara Strait to the west, and the Izu Ridge to the east,the Kuroshio south of Japan is well known for its bi-modal path fluctuations on interannual-to-decadal timescales (for a comprehensive review regarding the ob-servations and dynamics of the Kuroshio path bimodal-ity, readers are referred to Qiu and Miao 2000). Is theKE variability described above, in any way, influencedby the Kuroshio path changes south of Japan?
To capture the Kuroshio variability south of Japan,we plot in Fig. 7a the time series of the mean Kuroshioposition averaged from 135° to 140°E. While exhibitingfrequent large-amplitude offshore excursions, theKuroshio path in the last 12 yr has remained largely ina near-shore straight mode (Kawabe 1995). The excep-tions were during 2000–01, in which a relatively stable“large meander path” persisted for about 2 yr, and afterJuly 2004. A look at Fig. 2e indicates that 2000–01 are
FIG. 6. (a) Strength of the KE recirculation gyre defined by Eq.(1). (b) Latitudinal position of the recirculation gyre defined byEq. (2). Gray lines denote the mean values of the quantity overthe period of analysis.
2096 J O U R N A L O F P H Y S I C A L O C E A N O G R A P H Y VOLUME 35

the years when the upstream KE jet has a more-than-normal northerly path. However, as shown in Fig. 7b(same as Fig. 4c), the northward shift of the upstreamKE jet started in late 1998, a year before the Kuroshiosouth of Japan transitioned from a straight path to ameandering path. Given the results presented in Fig. 7,it is more natural to conclude that the gradual north-ward shift of the upstream KE jet after late 1998 is dueto the strengthening of the south recirculation gyreand its northward migration than that it is associatedwith the meandering of the Kuroshio south of Japan in2000–01.
4. Mechanism for the decadal recirculation gyremodulation
Results of the preceding section point clearly to theimportance of the southern recirculation gyre in under-standing the low-frequency changes of the KE jet. Dy-namically, fluctuations in the recirculation gyre can re-sult from eddy–mean flow interaction, eddy–eddy in-teraction, and forced thermocline variability due tosurface wind forcing. In this section, we will explore theroles played by the latter process. Located near thewestern boundary of the North Pacific basin, the KEand its recirculation regions are where wind-forcedthermocline responses ultimately accumulate (Miller etal. 1998; Deser et al. 1999; Seager et al. 2001; Schneideret al. 2002; Qiu 2003). To what extent can the decadalvariability observed in the recirculation gyre be ex-plained by the forcing of the large-scale wind stressfield?
To address this question, it is useful to adopt a 11⁄2-layer reduced-gravity model that governs the baroclinicocean response to surface wind forcing. Under thelong-wave approximation, the linear vorticity equationof the model is
�h
�t� cR
�h
�x� �
g� curl��ogf
, �3
where h is the SSH of interest, cR is the speed of thelong baroclinic Rossby waves, g� is the reduced gravity,�o is the reference density, f is the Coriolis parameter,and � is the wind stress vector. Integrating Eq. (3) fromthe eastern boundary (xe) along the baroclinic Rossbywave characteristic leads to
h�x, y, t � h�xe, y, t �x � xe
cR�
�g�
�0gfcR�
xe
x
curl��x�, y, t �x � x�
cR� dx�.
�4
Using Eq. (4) and the monthly wind stress data fromthe NCEP reanalysis (Kalnay et al. 1996), Qiu (2003)hindcast the SSH anomaly field for the midlatitudeNorth Pacific. For the region surrounding the KE, hefound that the linear vorticity model was able to repro-duce the large-scale, low-frequency SSH changes favor-ably (for details, see Figs. 8 and 9 in Qiu 2003). In thisstudy we extend the hindcast for the SSH anomaly field,using the same wind dataset and physical parameters.Figure 8a shows the modeled SSH anomalies averagedover the latitudinal band of the KE recirculation gyre,32°–34°N, as a function of time and longitude. For com-parison, the same x–t plot for the SSH anomalies fromthe altimetric measurements is shown in Fig. 8b. In bothplots, the SSH values in the KE recirculation gyre re-gion of 140°–160°E are dominated by positive anoma-lies in 1993–94. From 1995 to 2000, negative SSHanomalies can be seen to expand from the east, replac-ing the earlier positive SSH anomalies in the recircula-tion gyre region. This arrival of negative SSH anoma-lies corresponds to the weakening of the recirculationgyre from 1996 to 2000. After 2001, the same process,but with the oppositely signed SSH anomalies, tookplace. The strengthening of the recirculation gyre seenin recent years is related to these positive SSH anoma-lies propagated from the east. It is interesting to notethat in 2004 negative SSH anomalies start to emerge inthe downstream recirculation gyre region. This signalsthe possibility of a weakening of the recirculation gyrein the coming years.
FIG. 7. (a) Latitudinal position of the Kuroshio path averagedfrom 135° to 140°E south of Japan. (b) Latitudinal position of theKE averaged from 141° to 153°E, as in Fig. 4c. In both panels, thinlines denote the time series based on the weekly SSH data andthick lines denote the low-pass-filtered time series after removingsignals with time scales shorter than 300 days.
NOVEMBER 2005 Q I U A N D C H E N 2097
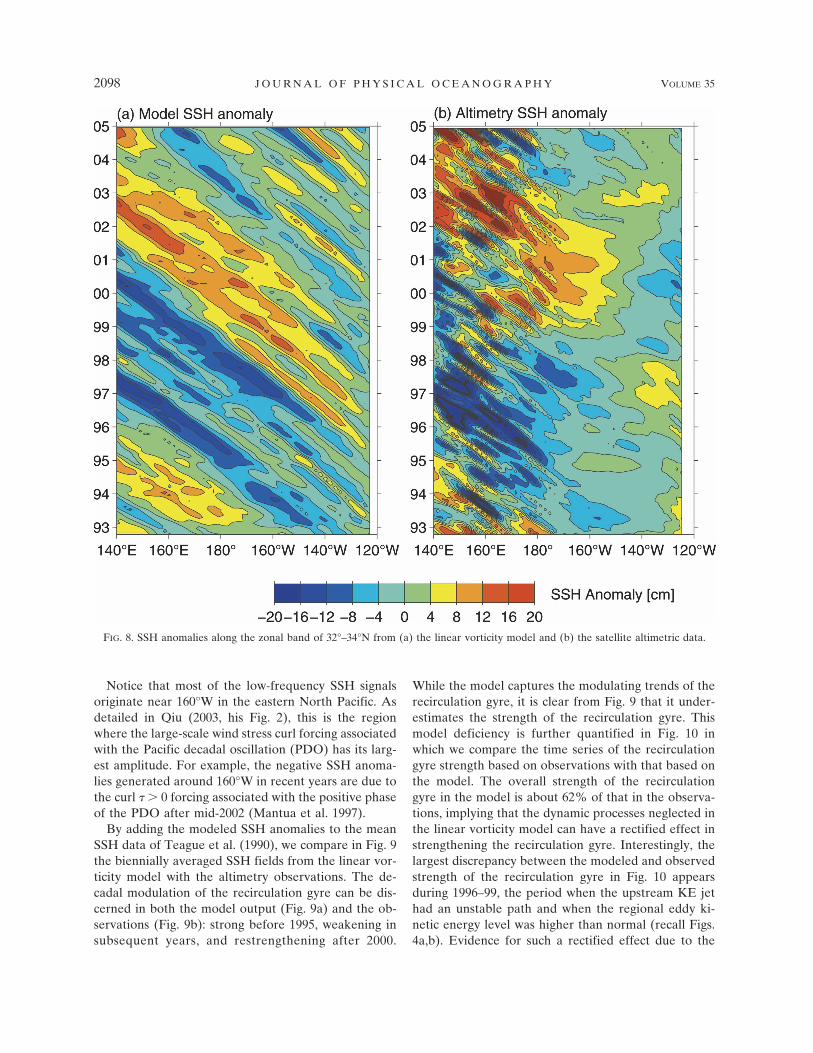
Notice that most of the low-frequency SSH signalsoriginate near 160°W in the eastern North Pacific. Asdetailed in Qiu (2003, his Fig. 2), this is the regionwhere the large-scale wind stress curl forcing associatedwith the Pacific decadal oscillation (PDO) has its larg-est amplitude. For example, the negative SSH anoma-lies generated around 160°W in recent years are due tothe curl � � 0 forcing associated with the positive phaseof the PDO after mid-2002 (Mantua et al. 1997).
By adding the modeled SSH anomalies to the meanSSH data of Teague et al. (1990), we compare in Fig. 9the biennially averaged SSH fields from the linear vor-ticity model with the altimetry observations. The de-cadal modulation of the recirculation gyre can be dis-cerned in both the model output (Fig. 9a) and the ob-servations (Fig. 9b): strong before 1995, weakening insubsequent years, and restrengthening after 2000.
While the model captures the modulating trends of therecirculation gyre, it is clear from Fig. 9 that it under-estimates the strength of the recirculation gyre. Thismodel deficiency is further quantified in Fig. 10 inwhich we compare the time series of the recirculationgyre strength based on observations with that based onthe model. The overall strength of the recirculationgyre in the model is about 62% of that in the observa-tions, implying that the dynamic processes neglected inthe linear vorticity model can have a rectified effect instrengthening the recirculation gyre. Interestingly, thelargest discrepancy between the modeled and observedstrength of the recirculation gyre in Fig. 10 appearsduring 1996–99, the period when the upstream KE jethad an unstable path and when the regional eddy ki-netic energy level was higher than normal (recall Figs.4a,b). Evidence for such a rectified effect due to the
FIG. 8. SSH anomalies along the zonal band of 32°–34°N from (a) the linear vorticity model and (b) the satellite altimetric data.
2098 J O U R N A L O F P H Y S I C A L O C E A N O G R A P H Y VOLUME 35
Fig 8 live 4/C

FIG. 9. Biennially averaged SSH fields with the SSH anomalies (a) hindcast by the linear vorticity model and(b) observed by the satellite altimeters. As in Fig. 2, the mean SSH field is based on Teague et al. (1990) andthick lines denote the 170-cm contours.
NOVEMBER 2005 Q I U A N D C H E N 2099
Fig 9 live 4/C

eddy–mean flow interaction can be found in a recenthigh-resolution general circulation model study byTaguchi et al. (2005).
5. Bimodal state and the Izu–Ogasawara Ridge
One interesting result obtained from the data analy-ses in section 3 is that when the KE jet and recirculationgyre were in a weaker (stronger) state, the upstreamKE path tended to become more (less) variable and theregional eddy kinetic energy level tended to be higher(lower). This relationship between the strength of theKE jet/recirculation gyre and the regional eddy kineticenergy level is rather counterintuitive, because stabilityanalysis commonly suggests that a stronger mean flowwould favor baroclinic instability and lead to more vig-orous eddy generation. Clearly, baroclinic instability isnot the dominant mechanism controlling the modulat-ing mesoscale eddy field of the observed KE system.
A careful look at the time-varying SSH maps revealsthat the state of the upstream KE jet/recirculation gyreis closely connected to the latitudinal position of theKE jet inflow as it crossed the Izu–Ogasawara Ridge(see Fig. 11 for the regional detailed bathymetry).When the inflow jet was observed to be located close tothe Japan coast before 1995 and after 2002, the up-stream KE path tended to be in a stable mode (see Figs.12a versus 12b). On the other hand, from 1996 to 2001when the upstream KE path was observed to be un-stable, the inflow KE jet had wandered southward overthe shallower segment of the Izu–Ogasawara Ridge be-tween 32°–34°N (depth �1 km). The fact that the KEjet east of the Izu–Ogasawara Ridge should developlarge amplitude meanders when it overrides the shallowridge can be expected from the conservation of poten-tial vorticity (e.g., Toba and Murakami 1998).
What, then, caused the KE jet inflow along the Izu–Ogasawara Ridge to deflect southward during 1996–2001? To answer this question, we plot in Fig. 12c theKE jet position along the eastern flank of the Izu–
Ogasawara Ridge hindcast by the linear vorticitymodel. The good correspondence between this time se-ries and Fig. 12a indicates that the observed southwarddeflection of the KE jet during 1996–2000 is likelycaused by the arrival of the negative SSH anomaliesfrom the east and the resultant weakening of the recir-culation gyre (see Fig. 9a for the modeled paths of theKE jet inflow around the Izu–Ogasawara Ridge). Incontrast, arrival of the positive SSH anomalies at theIzu–Ogasawara Ridge in recent years forced the inflowKE path to flow against the Japan coast. By passingthrough the deep channel of the Izu–Ogasawara Ridge
FIG. 10. Strength of the recirculation gyre derived from thelinear vorticity model (dashed line) and from the altimetry obser-vations (solid line; same as in Fig. 6a). Definition for the recircu-lation gyre strength is given by Eq. (1).
FIG. 11. Bathymetry around Izu–Ogasawara Ridge based onSmith and Sandwell (1994). Thick contours denote the 1000-misobaths.
2100 J O U R N A L O F P H Y S I C A L O C E A N O G R A P H Y VOLUME 35
Fig 11 live 4/C
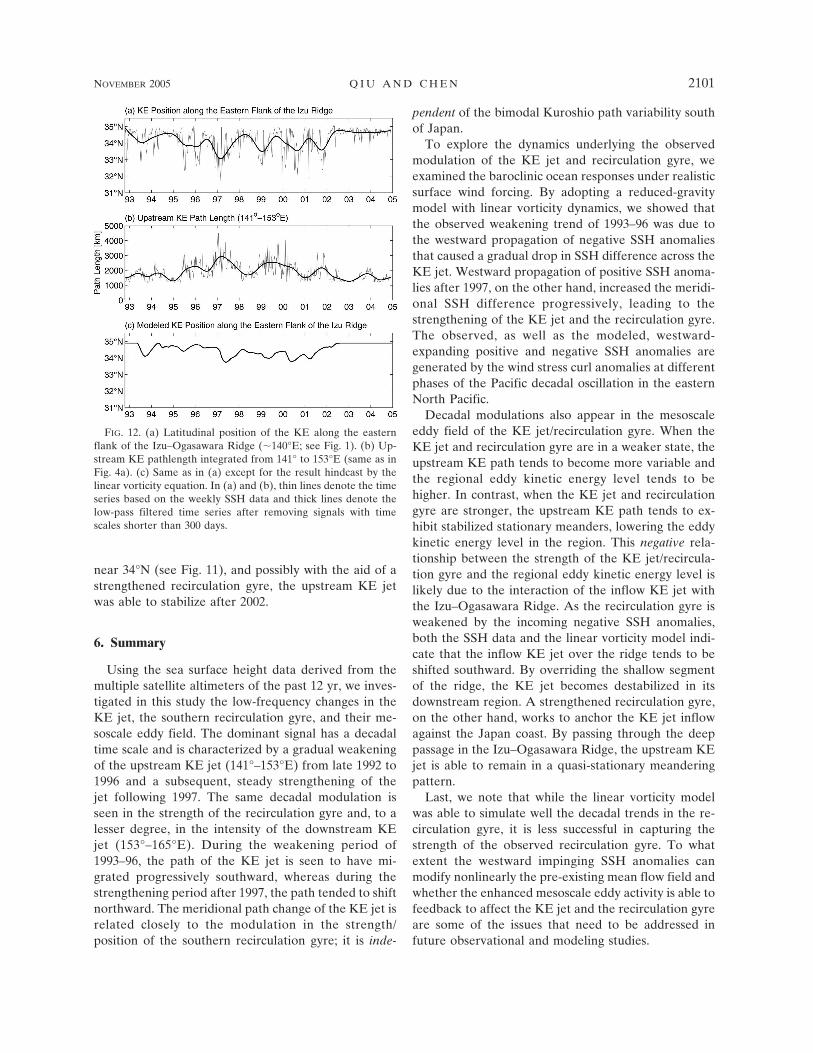
near 34°N (see Fig. 11), and possibly with the aid of astrengthened recirculation gyre, the upstream KE jetwas able to stabilize after 2002.
6. Summary
Using the sea surface height data derived from themultiple satellite altimeters of the past 12 yr, we inves-tigated in this study the low-frequency changes in theKE jet, the southern recirculation gyre, and their me-soscale eddy field. The dominant signal has a decadaltime scale and is characterized by a gradual weakeningof the upstream KE jet (141°–153°E) from late 1992 to1996 and a subsequent, steady strengthening of thejet following 1997. The same decadal modulation isseen in the strength of the recirculation gyre and, to alesser degree, in the intensity of the downstream KEjet (153°–165°E). During the weakening period of1993–96, the path of the KE jet is seen to have mi-grated progressively southward, whereas during thestrengthening period after 1997, the path tended to shiftnorthward. The meridional path change of the KE jet isrelated closely to the modulation in the strength/position of the southern recirculation gyre; it is inde-
pendent of the bimodal Kuroshio path variability southof Japan.
To explore the dynamics underlying the observedmodulation of the KE jet and recirculation gyre, weexamined the baroclinic ocean responses under realisticsurface wind forcing. By adopting a reduced-gravitymodel with linear vorticity dynamics, we showed thatthe observed weakening trend of 1993–96 was due tothe westward propagation of negative SSH anomaliesthat caused a gradual drop in SSH difference across theKE jet. Westward propagation of positive SSH anoma-lies after 1997, on the other hand, increased the meridi-onal SSH difference progressively, leading to thestrengthening of the KE jet and the recirculation gyre.The observed, as well as the modeled, westward-expanding positive and negative SSH anomalies aregenerated by the wind stress curl anomalies at differentphases of the Pacific decadal oscillation in the easternNorth Pacific.
Decadal modulations also appear in the mesoscaleeddy field of the KE jet/recirculation gyre. When theKE jet and recirculation gyre are in a weaker state, theupstream KE path tends to become more variable andthe regional eddy kinetic energy level tends to behigher. In contrast, when the KE jet and recirculationgyre are stronger, the upstream KE path tends to ex-hibit stabilized stationary meanders, lowering the eddykinetic energy level in the region. This negative rela-tionship between the strength of the KE jet/recircula-tion gyre and the regional eddy kinetic energy level islikely due to the interaction of the inflow KE jet withthe Izu–Ogasawara Ridge. As the recirculation gyre isweakened by the incoming negative SSH anomalies,both the SSH data and the linear vorticity model indi-cate that the inflow KE jet over the ridge tends to beshifted southward. By overriding the shallow segmentof the ridge, the KE jet becomes destabilized in itsdownstream region. A strengthened recirculation gyre,on the other hand, works to anchor the KE jet inflowagainst the Japan coast. By passing through the deeppassage in the Izu–Ogasawara Ridge, the upstream KEjet is able to remain in a quasi-stationary meanderingpattern.
Last, we note that while the linear vorticity modelwas able to simulate well the decadal trends in the re-circulation gyre, it is less successful in capturing thestrength of the observed recirculation gyre. To whatextent the westward impinging SSH anomalies canmodify nonlinearly the pre-existing mean flow field andwhether the enhanced mesoscale eddy activity is able tofeedback to affect the KE jet and the recirculation gyreare some of the issues that need to be addressed infuture observational and modeling studies.
FIG. 12. (a) Latitudinal position of the KE along the easternflank of the Izu–Ogasawara Ridge (�140°E; see Fig. 1). (b) Up-stream KE pathlength integrated from 141° to 153°E (same as inFig. 4a). (c) Same as in (a) except for the result hindcast by thelinear vorticity equation. In (a) and (b), thin lines denote the timeseries based on the weekly SSH data and thick lines denote thelow-pass filtered time series after removing signals with timescales shorter than 300 days.
NOVEMBER 2005 Q I U A N D C H E N 2101
Acknowledgments. This study benefited from fruitfuldiscussions with Ted Durland, Peter Hacker, NikolaiMaximenko, and Niklas Schneider. Detailed commentsmade by the anonymous reviewers and Lynne Talleyhelped improve an early version of the manuscript. Thesurface wind stress and heat flux data were generouslyprovided by the National Centers for EnvironmentalPrediction and the merged TOPEX/Poseidon, Jason-1,and ERS-1/2 altimeter data by the CLS Space Ocean-ography Division as part of the Environment and Cli-mate EU ENACT project. This study was supported byNASA through Contracts 1207881 and 1228847.
REFERENCES
Adamec, D., 2000: Eddy flow characteristics and mean flow in-teractions in the North Pacific. J. Geophys. Res., 105, 11 373–11 383.
Aoki, S., S. Imawaki, and K. Ichikawa, 1995: Baroclinic distur-bances propagating westward in the Kuroshio Extension re-gion as seen by a satellite altimeter and radiometers. J. Geo-phys. Res., 100, 839–855.
Deser, C., M. A. Alexander, and M. S. Timlin, 1999: Evidence fora wind-driven intensification of the Kuroshio Current Exten-sion from the 1970s to the 1980s. J. Climate, 12, 1697–1706.
Ducet, N., and P.-Y. Le Traon, 2001: A comparison of surfaceeddy kinetic energy and Reynolds stresses in the Gulf Streamand the Kuroshio Current system from merged TOPEX/Poseidon and ERS-1/2 altimetric data. J. Geophys. Res., 106,16 603–16 662.
——, ——, and G. Reverdin, 2000: Global high-resolution map-ping of ocean circulation from TOPEX/Poseidon and ERS-1and -2. J. Geophys. Res., 105, 19 477–19 498.
Ebuchi, N., and K. Hanawa, 2001: Trajectory of mesoscale eddiesin the Kuroshio recirculation region. J. Oceanogr., 57, 471–480.
Gilson, J., D. Roemmich, B. Cornuelle, and L.-L. Fu, 1998: Re-lationship of TOPEX/Poseidon altimetric height to stericheight and circulation in the North Pacific. J. Geophys. Res.,103, 27 947–27 965.
Hurlburt, H. E., A. J. Wallcraft, W. J. Schmitz, P. J. Hogan, andE. J. Metzger, 1996: Dynamics of the Kuroshio/Oyashio cur-rent system using eddy-resolving models of the North PacificOcean. J. Geophys. Res., 101, 941–976.
Joyce, T. M., 1987: Hydrograhic sections across the Kuroshio ex-tension at 165°E and 175°E. Deep-Sea Res., 34, 1331–1352.
——, I. Yasuda, Y. Hiroe, K. Komatsu, K. Kawasaki, and F. Bahr,2001: Mixing in the meandering Kuroshio Extension and theformation of North Pacific Intermediate Water. J. Geophys.Res., 106, 4397–4404.
Kalnay, E., and Coauthors, 1996: The NCEP/NCAR 40-Year Re-analysis Project. Bull. Amer. Meteor. Soc., 77, 437–471.
Kawabe, M., 1995: Variations of current path, velocity, and vol-ume transport of the Kuroshio in relation with the large me-ander. J. Phys. Oceanogr., 25, 3103–3117.
Kawamura, H., K. Mizuno, and Y. Toba, 1986: Formation processof a warm-core ring in the Kuroshio-Oyashio frontal zone-December 1981–October 1982. Deep-Sea Res., 33, 1617–1640.
Le Traon, P.-Y., and G. Dibarboure, 1999: Mesoscale mappingcapabilities of multiple-satellite altimeter missions. J. Atmos.Oceanic Technol., 16, 1208–1223.
Mantua, N. J., S. R. Hare, Y. Zhang, J. M. Wallace, and R. C.
Francis, 1997: A Pacific interdecadal climate oscillation withimpacts on salmon production. Bull. Amer. Meteor. Soc., 78,1069–1079.
Miller, A. J., D. R. Cayan, and W. B. White, 1998: A westward-intensified decadal change in the North Pacific thermoclineand gyre-scale circulation. J. Climate, 11, 3112–3127.
Mitchell, J. L., W. J. Teague, G. A. Jacobs, H. E. Hurlburt, andP. J. Hogan, 1996: Kuroshio Extension dynamics from satel-lite altimetry and a model simulation. J. Geophys. Res., 101,1045–1058.
Mitsudera, H., T. Waseda, Y. Yoshikawa, and B. Taguchi, 2001:Anticyclonic eddies and Kuroshio meander formation. Geo-phys. Res. Lett., 28, 2025–2028.
Mizuno, K., and W. B. White, 1983: Annual and interannual vari-ability in the Kuroshio Current system. J. Phys. Oceanogr.,13, 1847–1867.
Niiler, P. P., N. A. Maximenko, G. G. Panteleev, T. Yamagat, andD. B. Olson, 2003: Near-surface dynamical structure of theKuroshio Extension. J. Geophys. Res., 108, 3193, doi:10.1029/2002JC001461.
Nonaka, M., and S.-P. Xie, 2003: Covariations of sea surface tem-perature and wind over the Kuroshio and its extension: Evi-dence for ocean-to-atmosphere feedback. J. Climate, 16,1404–1413.
Pedlosky, J., 1996: Ocean Circulation Theory. Springer, 453 pp.Qiu, B., 1995: Variability and energetics of the Kuroshio Exten-
sion and its recirculation gyre from the first two-year TOPEXdata. J. Phys. Oceanogr., 25, 1827–1842.
——, 2003: Kuroshio Extension variability and forcing of the Pa-cific decadal oscillations: Responses and potential feedback.J. Phys. Oceanogr., 33, 2465–2482.
——, and K. A. Kelly, 1993: Upper-ocean heat balance in theKuroshio Extension region. J. Phys. Oceanogr., 23, 2027–2041.
——, and W. Miao, 2000: Kuroshio path variations south of Japan:Bimodality as a self-sustained internal oscillation. J. Phys.Oceanogr., 30, 2124–2137.
——, S. Chen, and P. Hacker, 2004: Synoptic-scale air–sea fluxforcing in the western North Pacific: Observations and itsimpact on SST and the mixed layer. J. Phys. Oceanogr., 34,2148–2159.
Schneider, N., A. J. Miller, and D. W. Pierce, 2002: Anatomy ofNorth Pacific decadal variability. J. Climate, 15, 586–605.
Seager, R., Y. Kushnir, N. H. Naik, M. A. Cane, and J. Miller,2001: Wind-driven shifts in the latitude of the Kuroshio–Oyashio extension and generation of SST anomalies on dec-adal timescales. J. Climate, 14, 4249–4265.
Smith, W. H. F., and D. T. Sandwell, 1994: Bathymetric predictionfrom dense altimetry and sparse shipboard bathymetry. J.Geophys. Res., 99, 21 803–21 824.
Stammer, D., 1997: Steric and wind-induced changes in TOPEX/POSEIDON large-scale sea surface topography observa-tions. J. Geophys. Res., 102, 20 987–21 009.
Taguchi, B., S.-P. Xie, H. Mitsudera, and A. Kubokawa, 2005:Response of the Kuroshio Extension to Rossby waves asso-ciated with the 1970s climate regime shift in a high-resolutionocean model. J. Climate, 18, 2979–2995.
Tai, C.-T., and W. B. White, 1990: Eddy variability in the Kuro-shio Extension as revealed by Geosat altimetry: Energypropagation away from the jet, Reynolds stress, and seasonalcycle. J. Phys. Oceanogr., 20, 1761–1777.
Talley, L., 1997: North Pacific Intermediate Water transports inthe mixed water region. J. Phys. Oceanogr., 27, 1795–1803.
Teague, W. J., M. J. Carron, and P. J. Hogan, 1990: A comparison
2102 J O U R N A L O F P H Y S I C A L O C E A N O G R A P H Y VOLUME 35
between the Generalized Digital Environmental Model andLevitus climatologies. J. Geophys. Res., 95, 7167–7183.
Toba, Y., and H. Murakami, 1998: Unusual behavior of the Kuro-shio current system from winter 1996 to summer 1997 re-vealed by ADEOS-OCTS and other data—Suggestion of to-pographically forced alternating-jet instability. J. Oceanogr.,54, 465–478.
Vivier, F., K. A. Kelly, and L. Thompson, 2002: Heat budget inthe Kuroshio Extension region: 1993–99. J. Phys. Oceanogr.,32, 3436–3454.
Wang, L., C. J. Koblinsky, and S. Howden, 1998: Annual andintra-annual sea level variability in the region of the Kuroshio
Extension from TOPEX/Poseidon and Geosat altimetry. J.Phys. Oceanogr., 28, 692–711.
Wijffels, S. E., M. M. Hall, T. M. Joyce, D. J. Torres, P. Hacker,and E. Firing, 1998: Multiple deep gyres of the western NorthPacific: A WOCE section along 149°E. J. Geophys. Res., 103,12 985–13 009.
Yasuda, I., K. Okuda, and M. Hirai, 1992: Evolution of a Kuroshiowarm-core ring—Variability of the hydrographic structure.Deep-Sea Res., 39, 131–161.
——, ——, and Y. Shimizu, 1996: Distribution and modification ofNorth Pacific Intermediate Water in the Kuroshio–Oyashiointerfrontal zone. J. Phys. Oceanogr., 26, 448–465.
NOVEMBER 2005 Q I U A N D C H E N 2103