variations in community structure and plant species
TRANSCRIPT

Amro et al., The J. Anim. Plant Sci., 31 (6) 2021
1686
VARIATIONS IN COMMUNITY STRUCTURE AND PLANT SPECIES DIVERSITY WITHSOIL PROPERTIES IN A HYPER-ARID COASTAL DESERT OF EGYPT
A. Amro1, F. M. Salama1,*, M. M. Abd El-Ghani2, A. M. El-Zohary3 and R. M. El-Shazoly3
1Department of Botany and Microbiology, Faculty of Science, Assiut University, 2Department of Botany andMicrobiology, Faculty of Science, Cairo University, 3Department of Botany, Faculty of Science, New Valley University,
Egypt*Corresponding author’s email: [email protected]
ABSTRACT
Vegetation composition and soil attributes in the lower tributaries were studied from 33 georefereced stands (20 × 20m)in the deltaic part and along the main trunks of studied wadis from north to south of Eastern Desert along the Red Seacoast. The aim of the present study was to investigate the present status of the floristic composition of wadis distributedin the study area, the plant communities inhabiting different habitats and the environmental factors affecting speciesdiversity in the study area. The studied stands were randomly chosen at locations where considerable vegetation coverand/or sensible changes in floristic composition were encountered. In each stand, presence percentage (P%), life formsand chorological affinities for each species were calculated. Soil physico-chemical analyses were carried out, and 16parameters were used in the multivariate analyses where TWINSPAN (classification) and CCA (ordination) wereapplied. Significant differences between TWINSPAN vegetation groups were tested by ANOVA. Sixty-three species (40perennials and 23 annuals) were recorded in this area, belonging to 58 genera from 28 different families. 42% of therecorded flora was belonging to five families arranged descending as: Fabaceae > Brassicaceae > Asteraceae >Chenopodiaceae > Zygophyllaceae. Therophytes and Chamaeophytes constituted 66 % of the main bulk of life form thespectrum of the recorded flora. Also, Saharo-Arabian species consisted 65% followed by the Mediterranean (̴29%).TWINSPAN yielded 5 vegetation groups; group E were located in the proximity of Wadi El-Mallaha and Wadi Beli.Groups A, C and D appeared to be closer to Wadi Dib and W. Abu Had, while stands of group (B) were in Wadi Beli.These groups were clearly separated along the first two axes of DCA. Both diversity indices showed positive significantcorrelations with phosphates and chlorides, and negative significant correlations with sodium, magnesium, total solublesalts and fine sand. Canonical Correspondence Analysis (CCA) revealed the importance of Na, K, Ca, PO4, gravels,coarse sand, silt and clay in species distribution patterns.
Keywords: desert vegetation, arid environments, soil variables, multivariate numerical analysis, diversity, plantcommunities
Published first online March 31, 2021 Published final Nov. 20, 2021.
INTRODUCTION
Located in the northeastern part of the SaharaDesert and in the transition between Africa and Asia, theEgyptian deserts linked with those of the Middle East. Asin other arid lands, the desert vegetation, which is mainlyprecipitation-dependent, is the characteristic naturalecosystems in Egypt (Abd El-Ghani et al., 2017), wherexerophytic shrubs and sub-shrubs are the dominant lifeforms.
Flores and Briones (2001) described the mainenvironmental factors that affect the structure anddevelopment of plant communities in the aridenvironments. Arid climate prevails, and together withthe long history of human exploitation may haveimpoverished biotic diversity. Although rain is fall rarely,a rise in ground water table may magnify the chance forserving perennials. On the other hand, unless rainfalloccurs, the underground water is considered the main
resource for surviving plants in the main channels of thewadis (Zahran and Willis, 2009). Similar investigationswere conducted in the other arid regions around the worldas in southern Chihuahuan Desert of Mexico (Huerta-Martínez, 2004), in northern foot of Tianshan Mountainsof China (Xu et al., 2006), and in the Atacama Desert ofChile (Ruhm et al., 2020).
The vegetation structure of natural ecosystems isdetermined by biotic factors (e.g. competition,facilitation, and predation), as well as abiotic (Hahs et al.,1999), although the effects of these factors depend on thehabitats where the plants grow. The relationship betweensoil and vegetation is one of the main priorities forrestoration projects and vegetation management inecological studies. Among the different environmentalfactors, soil is effective for plant growth and is a functionof many abiotic factors. The vegetation–environmentrelationships have always been proved useful inecological studies (Lundholm and Larson, 2003). Soil,topography and climate showed different influences on
Journal of Animal & Plant Sciences, 31(6): 2021, Page: 1686-1698ISSN (print): 1018-7081; ISSN (online): 2309-8694https://doi.org/10.36899/JAPS.2021.6.0372

Amro et al., The J. Anim. Plant Sci., 31 (6) 2021
1687
the plant distribution at regional (Huerta-Martínez et al.,2004; Abd El-Ghani and El-Sawaf, 2005), landscape (Panet al., 1998), and smaller scale (Maestre et al., 2003). Inthe southern part of the Eastern Desert of Egypt,variations in vegetation structure, species dominance andplant communities were investigated (Salama et al.,2014). The soil physical and chemical properties thatcontrolled species and plant communities were electricalconductivity, moisture content, and contents of sodium,potassium, calcium, magnesium, chlorides, sulfates, pH,organic matter and gravel. Tizro and Voudouris (2007)stated that total soluble salts in the soil were affected bythe evaporation and precipitation rate and consequently,electric conductivity of the soil solutions was alsorelatively high. Salama et al. (2012) stated that the highrate of evaporation concentrated the soil solution andaffect the plant species composition in the desertlandscape.
Generally, the desert ecosystem of Egypt has inrecent times been subjected increasingly to untestedcontacts with humans and their characteristic activities.Within the past 60 years there has been heavy use ofdesert scrub communities for land reclamation,recreational purposes, military testing, and differentconstruction projects, all of which have modified physicalcharacteristics of soil and altered the composition ofdesert vegetation and changing floristic composition(Salama et al., 2015).The population in Egypt is remarkably increased duringthe last three decades, which entails the establishment ofnew settlements to overcome this problem.Unfortunately, the establishment of these new cities wason the expense of the natural vegetation which has beenremoved from these areas. Consequently, vast areas havebeen modified into massive populated areas, andconstructing roads crossing the desert to be easilyaccessible. The area under investigation is planned to betransformed into a new settlement. Therefore, it isurgently recommended to document the flora andvegetation of such areas before complete vanishing.
The present study was designed to investigatethe following: (1) the present status of the floristiccomposition of wadis distributed in the study area,namely: Wadi Dib, W. Abu Had, W. Mellaha W. AbuMarwa and W. Beli, (2) the plant communities inhabitingdifferent habitats of these wadis and the environmentalgradients associated with the species distribution, (3) theenvironmental factors affecting species diversity in thestudy area, and (4) comparing the present status florawith earlier records and relevant studies.
MATERIALS AND METHODS
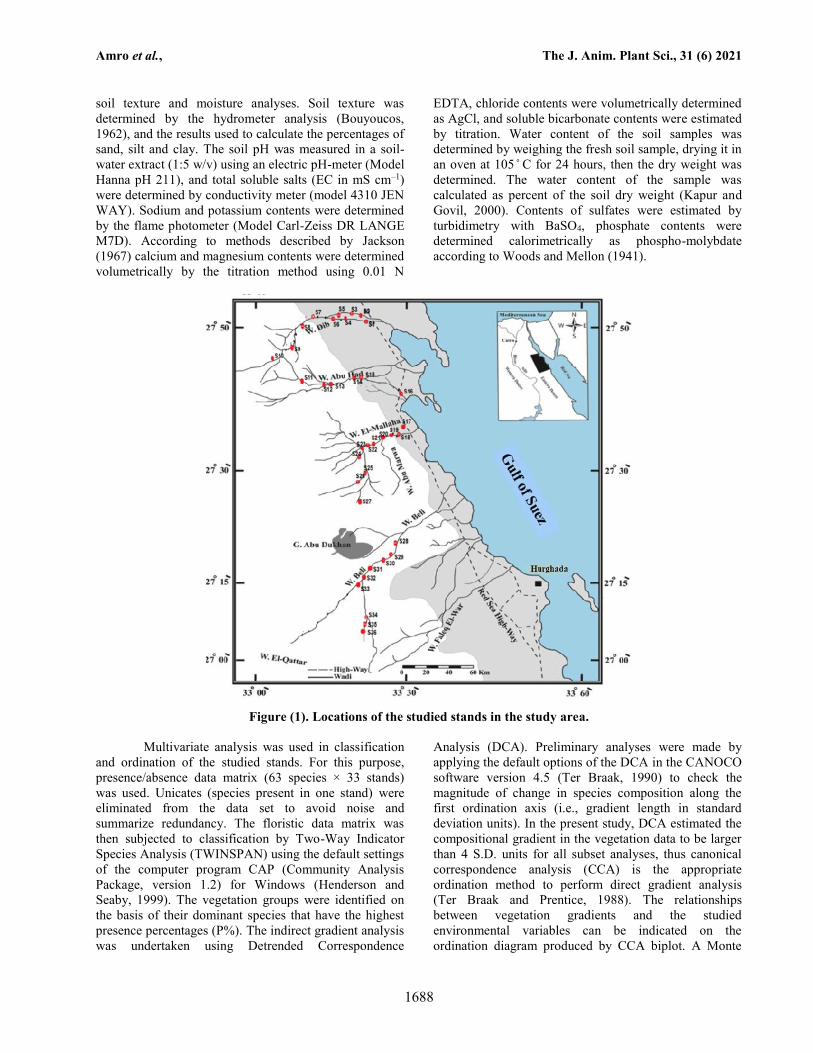
The Study area is a part of the hyper arid EasternDesert of Egypt. It covers a number of wadis distributedin the area limited by Latitudes 27° to 28 N and
Longitudes 33°-34' E, namely: Wadi Dib, W. Abu Had,W. Mellaha and W. Beli (Fig. 1). The soils in these wadisvary according to location in the wadi course and to agreat extent to elevation. At up streams, usually coarsesand mixed with gravel, the mid-stream and down-streamlocations are of deeper loamy soils, richer in moister, andthe down-stream of Wadi Mellaha is a saline depressionhaving a shallow water table and brownish saline soil richin organic matter (Zahran and Willis, 2009).
Available data revealed that the average lowestminimum temperature through the last five years (2013-2017) was 14 °C recorded in December and the averagehighest maximum temperature was 33 °C recorded inJune. The highest mean relative humidity was 51%(November and December), and the lowest mean was39% (May, June, July and Augusts). Usually, rainfalloccurs in the cold season from October to May butsummer is practically rainless. The maximum monthlyaverage of rainfall occurred in October (0.59 mm), whilethe lowest was in February (0.004 mm).
Thirty-three stands (20m × 20m) were studied inthe deltaic part and along the main trunks of the studied 4wadis from north to south between latitudes 27° to 28°Nand longitude 33° – 34°E: Wadi Dib, W. Abu Had, W.Mellaha, and W. Beli, and geo-referenced using GPStechniques.
Taking into account the highly variableabundance of plants (in time and space) in this extremearid desert environment, the size of stands (20m_× 20m)was designed where the vegetation comprised only ofwidely spaced shrubs or trees (Abd El-Ghani and Amer,2003). The sampling of the vegetation was designed,where the stands were randomly distributed within arelatively homogeneous area in terms of topography,landform and physiognomy of present vegetation (Fig. 1).Soil samples were collected from each stand for thephysical and chemical analyses.
The plant species were recorded from eachstand, and their presence percentage (P%) was calculated.The life forms were classified according to the system ofRaunkiaer (1937), and the number of species within eachlife form was expressed as a percentage of the totalnumber of species. Analysis of phytogeographical rangeswas carried out according to Zohary (1966 & 1972) andAbd El-Ghani et al. (2017). Voucher specimens of eachspecies were collected, and identified at the Herbaria ofCairo University (CAI) and Assiut University (ASTU),where they were deposited. Taxonomic nomenclaturewas according to Täckholm (1974) and Boulos (1995,1999 & 2000).
Three soil samples (0-50 cm) were collectedfrom different locations from each stand and carried tothe laboratory in plastic bags. After mixing thesesamples, one composite sample was formed, air-dried,thoroughly mixed and passed through a 2 mm sieve toremove gravel and debris. Finer samples were used for
Amro et al., The J. Anim. Plant Sci., 31 (6) 2021
1688
soil texture and moisture analyses. Soil texture wasdetermined by the hydrometer analysis (Bouyoucos,1962), and the results used to calculate the percentages ofsand, silt and clay. The soil pH was measured in a soil-water extract (1:5 w/v) using an electric pH-meter (ModelHanna pH 211), and total soluble salts (EC in mS cm–1)were determined by conductivity meter (model 4310 JENWAY). Sodium and potassium contents were determinedby the flame photometer (Model Carl-Zeiss DR LANGEM7D). According to methods described by Jackson(1967) calcium and magnesium contents were determinedvolumetrically by the titration method using 0.01 N
EDTA, chloride contents were volumetrically determinedas AgCl, and soluble bicarbonate contents were estimatedby titration. Water content of the soil samples wasdetermined by weighing the fresh soil sample, drying it inan oven at 105 ̊ C for 24 hours, then the dry weight wasdetermined. The water content of the sample wascalculated as percent of the soil dry weight (Kapur andGovil, 2000). Contents of sulfates were estimated byturbidimetry with BaSO4, phosphate contents weredetermined calorimetrically as phospho-molybdateaccording to Woods and Mellon (1941).
Figure (1). Locations of the studied stands in the study area.
Multivariate analysis was used in classificationand ordination of the studied stands. For this purpose,presence/absence data matrix (63 species × 33 stands)was used. Unicates (species present in one stand) wereeliminated from the data set to avoid noise andsummarize redundancy. The floristic data matrix wasthen subjected to classification by Two-Way IndicatorSpecies Analysis (TWINSPAN) using the default settingsof the computer program CAP (Community AnalysisPackage, version 1.2) for Windows (Henderson andSeaby, 1999). The vegetation groups were identified onthe basis of their dominant species that have the highestpresence percentages (P%). The indirect gradient analysiswas undertaken using Detrended Correspondence
Analysis (DCA). Preliminary analyses were made byapplying the default options of the DCA in the CANOCOsoftware version 4.5 (Ter Braak, 1990) to check themagnitude of change in species composition along thefirst ordination axis (i.e., gradient length in standarddeviation units). In the present study, DCA estimated thecompositional gradient in the vegetation data to be largerthan 4 S.D. units for all subset analyses, thus canonicalcorrespondence analysis (CCA) is the appropriateordination method to perform direct gradient analysis(Ter Braak and Prentice, 1988). The relationshipsbetween vegetation gradients and the studiedenvironmental variables can be indicated on theordination diagram produced by CCA biplot. A Monte

Amro et al., The J. Anim. Plant Sci., 31 (6) 2021
1689
Carlo permutation test (499 permutations; Ter Braak,1990) was used to test for significance of the eigenvaluesof the first canonical axis. All data variables wereassessed for normality (SPSS for windows version 16.0)prior to the CCA analysis, and appropriatetransformations were performed when necessary. Due tohigh inflation value of organic matter and chlorides, theywere eliminated from CCA analysis. Therefore, 16 soilvariables were included in this analysis: soil moisturecontent (WC), soil reaction (pH), total soluble salts(TSS), gravel, coarse sand (CS), fine sand (FS), silt, clay,sulfates (SO4), Mg, Ca, Na, HCO3, Cl, K, and PO4. Intra-set correlations were therefore used to assess theimportance of the environmental variables. TheTWINSPAN vegetation groups were subjected toANOVA (One-Way Analysis of variance) based on soilvariables to find out whether there were significantvariations among groups. All the statistical techniqueswere made using SPSS version 16.0 for windows (SPSSInc., Chicago, IL, USA).
Species diversity within each separatedvegetation group was assessed using two different indicesexpressing species richness and diversity. Speciesrichness (alpha-diversity; referred to as SR in the text)was calculated as the average number of species perstand, and the species diversity was calculated as theShannon-Wiener index (Pielou, 1975) according to thefollowing equation:
where H′ is the Shannon–Wiener diversityindex, S is the total number of species, and P is thepresence percentage of the ith species. The relationshipbetween the diversity indices and the different soil
variables was estimated using Spearman rank correlationcoefficient.
RESULTS
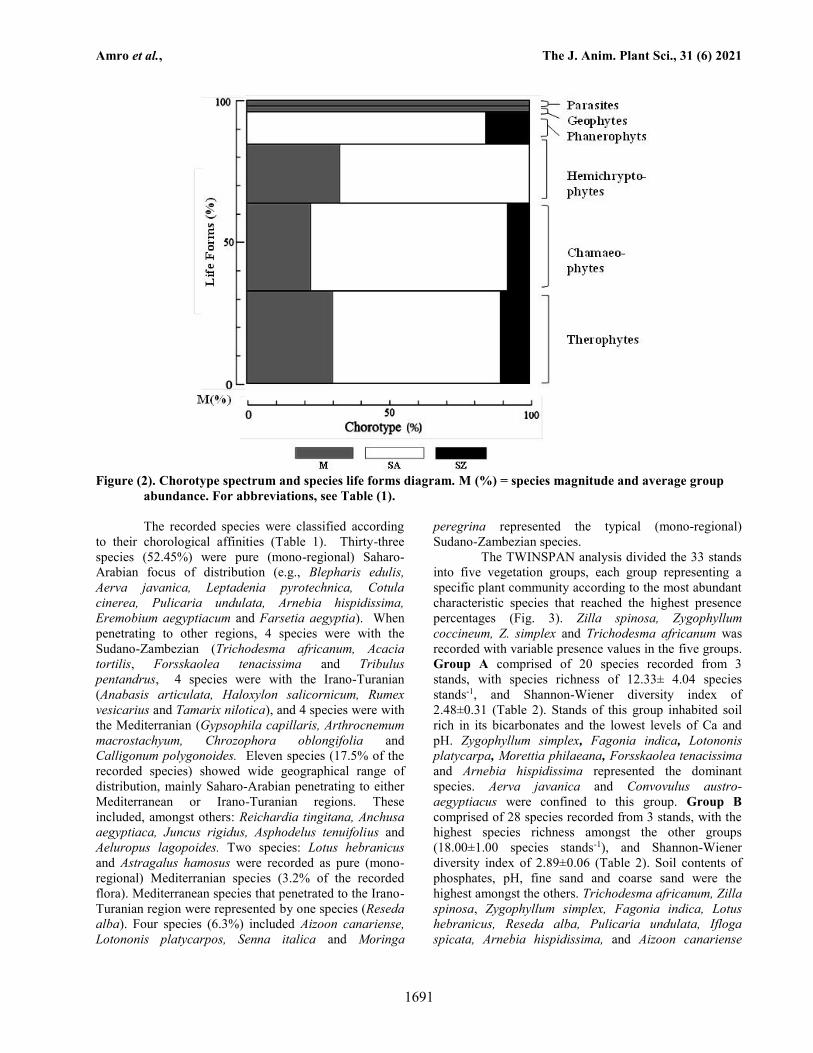
Sixty-three plant species (40 perennials and 23annuals) were recorded in study area, belonging to 58genera from 28 different families. Five major familiesconstituted the main bulk of the flora. The largest familywas Fabaceae (7 genera and 9 species), followed byBrassicaceae (6 genera, 6 species), Asteraceae andChenopodiaceae (5 genera, 5 species for each), andZygophyllaceae (3 genera, 4 species). The recordedspecies were classified into seven different life formsaccording to Raunkiaer's classification. The total numberof species in the different life form categories wasindicated in Table (1) and displayed in Fig. (2).Therophytes (Th) were the mostly presented (22 species)life form that represents 35% of the total number ofspecies. Most common species were Cotula cinerea,Anchusa aegyptiaca, Arnebia hispidissima, Trichodesmaafricanum, Polycarpaea repens and Astragalus vogelii.Chamaephytes (Ch) were represented by 20 species (32%of the recorded flora), and included Aerva javanica,Pergularia tomentosa, Pulicaria undulata, Farsetiaaegyptia, Capparis spinosa and Haloxylon salicornicum.Hemicryptophytes (He) were represented by 11 species,of which Cleome arabica, Citrullus colocynthis, Lotushebranicus, Erodium glaucophyllum, Aeluropuslagopoides, Monosonia nivea and Stipagrostis plumosawere highly represented. Eight species (12.5% of therecorded flora) represented the phanerophytes (Ph).Geophytes (G) and parasites (Par) were represented byone species for each (Juncus rigidus and Orobanchecrenata, respectively).
Table 1: Floristic composition of the studied wadis showing their life span, life forms, chorotypes and presencevalues (P%). Abbreviations: SA = Saharo-Arabian, SU = Sudanian, SZ = Sudano-Zambezian, M =Mediterranean, IT = Irano-Turanian, Cosm = Cosmopolitan, Pan = Pantropical, Th = Therophytes, He =Hemicryptophytes, Ch = Chamaephytes, G = Geophytes, Ph = Phanerophytes, Ann = Annual, Per =Perennial. Species abbreviations (Abb) in parentheses are those displayed in Figure (3).
Families and species Abb Lifespan
Lifeforms
Choro-types
P %
Acanthaceae Blepharis edulis (Forssk.) Pers. Per He SA 22.2Aizoaceae Aizoon canariense L. Ann Th SZ 11.1Amaranthaceae Aerva javanica (Burm.f.) Juss. Ex Schult. Per Ch SA 2.80Apocynaceae Leptadenia pyrotechnica (Forssk.) Decne. Per Ph SA 2.80
Pergularia tomentosa L. Per Ch SA 11.1Asteraceae Cotula cinerea Kotschy ex Benth. & Hook. Ann Th SA 11.1
Ifloga spicata (Forssk.) Sch. Bip. Ann Th M+SA+IT 13.9Pulicaria undulata (L.) C.A. Mey. Per Ch SA 44.5Reichardia tingitana (L.) Roth Ann Th M+SA+IT 5.60Senecio flavus (Decne.) Sch. Bip. Ann Th SA 8.30
Boraginaceae Anchusa aegyptiaca (L.) A. DC. Ann Th M+SA+IT 16.7

Amro et al., The J. Anim. Plant Sci., 31 (6) 2021
1690
Arnebia hispidissima (Lehm.) A. DC. A. his Ann Th SA 16.7Trichodesma africanum (L.) Sm. Ann Th SA+SZ 61.1
Brassicaceae Eremobium aegyptiacum (Spreng.)Asch. & Schweinf. ex Boiss. Ann Th SA 8.30
Farsetia aegyptia Turra F. aeg Per Ch SA 13.9Zilla spinosa (L.) Prantl Per Ch SA 61.1Lobularia arabica (Boiss.) Muschl. Ann Th SA 19.4Morettia philaeana (Delile) DC. M. ph Per Ch SA 50.0Moricandia sinaica (Boiss.) Boiss. Per Ch SA 8.30
Capparaceae Capparis spinosa L. Per Ch M+SA+IT 2.80Caryophyllaceae Gypsophila capillaries (Forssk.) C.Chr. Per Ch M+SA 5.60
Polycarpaea repens (Forssk.) Asch. & Schweinf. Ann Th SA 24.0Pteranthus dichotomus Forssk. P. dic Ann Th SA 18.0
Chenopodiaceae Anabasis articulata (Forssk.) Moq. Per Ch SA+IT 13.9Arthrocnemum macrostachyum (Moric.) K. Koch Per Ch M+SA 2.80Cornulaca monacantha Delile Per Ch SA 27.8Haloxylon salicornicum (Moq.) Bunge ex Boiss. H. sal Per Ch SA+IT 8.30Salsola imbricata Forssk. Per Ch SA 2.80
Cleomaceae Cleome arabica L. Per He SA 8.30Cleome droserifolia (Forssk.) Delile Per He SA 2.80
Cucurbitaceae Citrullus colocynthis (L.) Schrad. Per He M+SA+IT 8.30Euphorbiaceae Chrozophora oblongifolia (Delile) Spreng. Per Ch M+SA 11.1Fabaceae Acacia tortilis (Forssk.) Hayne subsp. raddiana
(Savi) BrenanA. rad Per Ph SA+SZ 30.6
Astragalus hamosus L. Ann Th M 41.7Astragalus sieberi DC. Per Ch SA 5.60Astragalus vogelii (Webb) Bornm. A. vog Ann Th SA 33.3Crotalaria aegyptiaca Benth. Per He SA 2.80Lotononis platycarpos (Viv.) Pichi-Serm. Ann Th SZ 13.9Lotus hebranicus Hochst. ex Brand L. heb Per He M 44.4Retama raetam (Forssk.) Webb & Berthel. R. rae Per Ph SA 5.60Senna italica Mill. Per Ch SZ 30.3
Geraniaceae Erodium glaucophyllum (L.) L'Hér. Per He SA 33.3Monosonia nivea (Decne.) Webb M. niv Per He SA 52.8
Juncaceae Juncus rigidus Desf. Per G M+SA+IT 5.60Liliaceae Asphodelus tenuifolius Cav. Ann Th M+SA+IT 25.0Moringaceae Moringa peregrina (Forssk.) Fiori Per Ph SZ 5.60Nitrariaceae Nitraria retusa (Forssk.) Asch. N. ret Per Ph SA 4.00Orobanchaceae Orobanche crenata Forssk. Ann Parasite M+SA+IT 2.80Plantaginaceae Plantago ovata Forssk. Ann Th M+SA+IT 5.60
Plantago phaeostoma Boiss. & Heldr. Ann Th SA 19.4Poaceae Aeluropus lagopoides (L.) Trin. ex Thwaites Per He M+SA+IT 8.30
Stipagrostis plumosa (L.) Munro ex T. Anderson Per He M+SA+IT 18.0Polygonaceae Calligonum polygonoides L. Per Ch M+SA 2.80
Rumex vesicarius L. Ann Th SA+IT 13.9Resedaceae Ochradenus baccatus Delile Per Ph SA 19.4
Reseda alba L. Ann Th M+IT 27.8Salvadoraceae Salvadora persica L. Per Ph SA 2.80Tamaricaceae Tamarix nilotica (Ehrenb.) Bunge T. nil Per Ph SA+IT 11.1Urticaceae Forsskaolea tenacissima L. F. ten Per He SA+SZ 22.8Zygophyllaceae Fagonia indica L. F. ind Per Ch SA 33.3
Tribulus pentandrus Forssk. Ann Th SA+SZ 27.8Zygophyllum coccineum L. Per Ch SA 75.0Zygophyllum simplex L. Z. sim Ann Th SA 41.7
Amro et al., The J. Anim. Plant Sci., 31 (6) 2021
1691
Figure (2). Chorotype spectrum and species life forms diagram. M (%) = species magnitude and average groupabundance. For abbreviations, see Table (1).
The recorded species were classified accordingto their chorological affinities (Table 1). Thirty-threespecies (52.45%) were pure (mono-regional) Saharo-Arabian focus of distribution (e.g., Blepharis edulis,Aerva javanica, Leptadenia pyrotechnica, Cotulacinerea, Pulicaria undulata, Arnebia hispidissima,Eremobium aegyptiacum and Farsetia aegyptia). Whenpenetrating to other regions, 4 species were with theSudano-Zambezian (Trichodesma africanum, Acaciatortilis, Forsskaolea tenacissima and Tribuluspentandrus, 4 species were with the Irano-Turanian(Anabasis articulata, Haloxylon salicornicum, Rumexvesicarius and Tamarix nilotica), and 4 species were withthe Mediterranian (Gypsophila capillaris, Arthrocnemummacrostachyum, Chrozophora oblongifolia andCalligonum polygonoides. Eleven species (17.5% of therecorded species) showed wide geographical range ofdistribution, mainly Saharo-Arabian penetrating to eitherMediterranean or Irano-Turanian regions. Theseincluded, amongst others: Reichardia tingitana, Anchusaaegyptiaca, Juncus rigidus, Asphodelus tenuifolius andAeluropus lagopoides. Two species: Lotus hebranicusand Astragalus hamosus were recorded as pure (mono-regional) Mediterranian species (3.2% of the recordedflora). Mediterranean species that penetrated to the Irano-Turanian region were represented by one species (Resedaalba). Four species (6.3%) included Aizoon canariense,Lotononis platycarpos, Senna italica and Moringa
peregrina represented the typical (mono-regional)Sudano-Zambezian species.
The TWINSPAN analysis divided the 33 standsinto five vegetation groups, each group representing aspecific plant community according to the most abundantcharacteristic species that reached the highest presencepercentages (Fig. 3). Zilla spinosa, Zygophyllumcoccineum, Z. simplex and Trichodesma africanum wasrecorded with variable presence values in the five groups.Group A comprised of 20 species recorded from 3stands, with species richness of 12.33± 4.04 speciesstands-1, and Shannon-Wiener diversity index of2.48±0.31 (Table 2). Stands of this group inhabited soilrich in its bicarbonates and the lowest levels of Ca andpH. Zygophyllum simplex, Fagonia indica, Lotononisplatycarpa, Morettia philaeana, Forsskaolea tenacissimaand Arnebia hispidissima represented the dominantspecies. Aerva javanica and Convovulus austro-aegyptiacus were confined to this group. Group Bcomprised of 28 species recorded from 3 stands, with thehighest species richness amongst the other groups(18.00±1.00 species stands-1), and Shannon-Wienerdiversity index of 2.89±0.06 (Table 2). Soil contents ofphosphates, pH, fine sand and coarse sand were thehighest amongst the others. Trichodesma africanum, Zillaspinosa, Zygophyllum simplex, Fagonia indica, Lotushebranicus, Reseda alba, Pulicaria undulata, Iflogaspicata, Arnebia hispidissima, and Aizoon canariense

Amro et al., The J. Anim. Plant Sci., 31 (6) 2021
1692
were the dominant species (P=100%). Five speciesshowed consistency to this group: Aizoon canariense,Gypsophila capillaris, Moringa peregrina, Capparisaegyptia and Leptadenia pyrotechnica. Group Ccomprised of 28 species from 7 stands, with the lowestspecies richness of 10.43±4.58 species stands-1, andShannon-Wiener diversity index of 2.25±0.49 (Table 2).Soil contents of magnesium and gravels had the highestvalues amongst the others. The lowest soil contents ofphosphates and bicarbonates characterized this group.This community had three characteristic species(P=86%): Zygophyllum coccineum, Acacia tortilis subsp.raddiana and Morettia philaeana. Four consistent speciesto this group were Pergularia tomentosa, Calligonumpolygonoides, Cleome droserifolia and Salvadorapersica. Group D (27 species from 7 stands) resembledgroup C in its soil composition with the lowest speciesrichness (10.43±3.74 species stands-1 and Shannon-Wiener diversity index (2.29±0.35). The soil of thisgroup of stands characterized by the highest Na, TSS andwater contents. The dominant species P=100%) wereZygophyllum coccineum and Morettia philaeana.
Consistent species to this group were Arthrocenemummacrostachyum, Orobanche crenata and Salsolaimbricata subsp. imbricata. Group E (13 stands and 40species) with an average species richness of 13.69±4.75species stands-1, and Shannon-Wiener diversity index of2.54±0.47. The two dominant species Monsonia niveaand Astragalus hamosus were represented by presencevalue (92%). Fifteen species of the recorded flora in thestudy area were confined to this vegetation group andincluded Haloxylon salicornicum, Pteranthusdichotomus, Nitraria retusa, Farsetia aegyptia, Tamarixnilotica, Retama raetam and Plantago ovata.
Application of Detrended CorrespondenceAnalysis (DCA) to the vegetation data of the studiedwadis (Fig. 4) revealed the segregation of the 5vegetation groups along DCA axis 1 (Eigenvalue 0.646)and DCA axis 2 (Eigenvalue 0.338). The cumulativepercentage variance of species data of the first two DCAaxes was 32.8%. Stands of vegetation groups B and Ewere clearly separated in the ordination plane, whilethose of groups A, C and D showed some interference.
Figure (3). TWINSPAN vegetation groups (A-E), with their indicator species. For species abbreviations, see Table(1).

Amro et al., The J. Anim. Plant Sci., 31 (6) 2021
1693
Table 2: Mean values, standard deviations (STD) and ANOVA values of the soil variables in the vegetation groups (A-E). N= number of stands, * = p<0.05, ** = p < 0.01.
Soil Variables Vegetation groups p-valueA (N = 3) B (N = 3) C (N = 7) D (N = 7) E (N = 13)Chemical propertiespH 7.48 ± 0.08 7.70 ± 0.00 7.56 ± 0.09 7.55 ± 0.06 7.57 ± 0.14 0.144Na 77.95 ± 16.98 28.89 ± 8.39 92.57 ± 24.19 100.07 ± 69.65 54.36 ± 16.60 0.02*
K 30.05 ± 6.67 27.61 ± 5.48 33.38 ± 13.97 31.34 ± 20.65 16.12 ± 8.41 0.045*
Ca (mg.g-1 d.wt. soil) 0.14 ± 0.01 0.21 ± 0.02 0.17 ± 0.01 0.19 ± 0.06 0.24 ± 0.08 0.042*
Mg 0.30 ± 0.01 0.28 ± 0.02 0.32 ± 0.08 0.31 ± 0.06 0.29 ± 0.09 0.814Cl 0.55 ± 0.02 1.61 ± 2.12 0.50 ± 0.12 0.53 ± 0.17 0.46 ± 0.09 0.049*
HCO3 2.23 ± 0.06 2.20 ± 0.10 2.08 ± 0.47 2.11 ± 0.35 2.19 ± 0.29 0.925PO4 2.09 ± 0.26 2.32 ± 0.15 1.78 ± 0.33 1.89 ± 0.36 2.13 ± 0.16 0.018*
Water content (WC) (%) 0.48 ± 0.12 0.59 ± 0.25 0.43 ± 0.26 0.89 ± 0.76 0.36 ± 0.15 0.088Total soluble salts (TSS) (mS cm–1) 0.73 ± 0.19 0.57 ± 0.05 0.82 ± 0.19 0.96 ± 0.63 0.84 ± 0.63 0.86SO4 (µg.g-1 d.wt. soil) 0.31 ± 0.10 0.08 ± 0.05 0.28 ± 0.16 0.19 ± 0.07 0.49 ± 0.66 0.501Physical propertiesGravel 28.53 ± 2.40 25.87 ± 2.90 29.70 ± 5.02 27.16 ± 8.28 21.70 ± 7.67 0.132Coarse sand (CS) 33.27 ± 18.87 46.83 ± 6.43 25.64 ± 7.04 24.63 ± 7.59 23.25 ± 9.44 0.008**
Fine sand (FS) (%) 11.07 ± 4.98 9.80 ± 2.95 12.47 ± 2.70 12.96 ± 4.61 10.95 ± 4.22 0.715Silt 18.77 ± 9.58 11.07 ± 3.56 23.66 ± 7.70 26.09 ± 6.78 32.87 ± 10.95 0.006**
Clay 8.37 ± 4.56 6.43 ± 4.91 8.53 ± 2.23 9.17 ± 2.61 11.22 ± 6.26 0.49Diversity indicesSpecies richness (SR) 12.33 ± 4.04 18.00 ± 1.00 10.43 ± 4.58 10.43 ± 3.74 13.69 ± 4.75 0.08Shannon-Wiener index (H') 2.48 ± 0.31 2.89 ± 0.06 2.25 ± 0.49 2.29 ± 0.35 2.54 ± 0.47 0.22
Amro et al., The J. Anim. Plant Sci., 31 (6) 2021

Amro et al., The J. Anim. Plant Sci., 31 (6) 2021
1694
Figure (4). Detrended Correspondence Analysis (DCA) ordination of the 33 stands on DCA axes 1 and 2 asclassified by TWINSPAN, showing the 5 vegetation groups (Gr A-E).
Significant differences in the examined soilvariables within the separated vegetation groups weredemonstrated in Table (2). Soil contents of Na, K, Ca,PO4, coarse sand and silt showed clear significantdifferences between groups.
The relationship between the vegetation and soilvariables was studied using Canonical CorrespondenceAnalysis (CCA). Figure (5) showed the CCA ordination
biplot with vegetation groups (A-E), and the examinedsoil variables. It can be noted that, stands of group A andC were highly correlated with Na, K, fine sand andgravel, while those of group B showed a correlation withpH and clay. Meanwhile, stands of group D showed acorrelation to WC and soil fractions (except silt). Standsof group E correlated to the soil SO4, Ca andbicarbonates.
Figure (5). Canonical correspondence analysis (CCA) biplot of axes 1 and 2 showing the distribution of the 33stands, together with their vegetation groups (Gr A-E) and soil variables.
The intra-set correlations resulted fromCanonical Correspondence Analysis (CCA) of the
examined soil variables were displayed in Table 3). Ofthe 16 examined soil factors, Na, K, Ca, PO4, gravels,

Amro et al., The J. Anim. Plant Sci., 31 (6) 2021
1695
coarse sand, silt and clay showed significance differencesalong the first two CCA axes. CCA axis 1 was highlypositively correlated with silt and highly negativelycorrelated with K. This axis can be interpreted as Silt-Kgradient. CCA axis 2 was highly positively correlatedwith Na and highly negatively with coarse sand (CS).Thus, this axis can be interpreted as Na-CS gradient. Atest for significance with an unrestricted Monte Carlopermutation test (499 permutation) for the eigenvalue ofaxis 1 found to be significant (P = 0.002), indicating thatthe observed patterns did not arise by chance.
Table 3: Inter–set correlation of CCA analysis for thesoil variables, together with eigenvalues andspecies–environment correlations. For soilunits, see Table (3). * = significant at p = 0.05,** = significant at p = 0.01.
Soil variables CCA Axis 1 CCA Axis 2Eigenvalues 0.466 0.273Species–environmentcorrelations 0.917 0.928
Na -0.378 0.520**
K -0.561** 0.416*
Ca 0.501** -0.176Mg -0.105 -0.002PO4 0.170 -0.482*
SO4 0.299 0.003HCO3 0.169 -0.116Cl -0.223 -0.270pH 0.036 -0.240Total soluble salts (TSS) 0.064 0.064Water content (WC) -0.292 -0.153Gravels -0.505** 0.140Coarse sand (CS) -0.446* -0.499*
Fine sand (FS) -0.198 0.180Silt 0.668** 0.320Clay 0.403* 0.085
DISCUSSION
As in other hyper-arid regions of the world, thevegetation in the study area is restricted to wadis, runnelsand depressions with deep fine sediments that receiveadequate water supply. Minimal precipitation andfrequent droughts characterized the vegetation in the aridregions; therefore, availability of water is one of theprimary factors controlling the distribution of species(Marcelo et al., 2015). The plant life in the study area isrestricted to microenvironments (as in wadis, runnels anddepressions), where runoff water collects and providessufficient moisture for plant growth which is mainlyformed of xerophytic shrubs and sub-shrubs to withstandthe harsh environmental conditions (Salama et al., 2016).
The vegetation structure is relatively simple, inwhich the species have to withstand the harshenvironmental conditions which can be reflected by thepresence of several highly adapted, drought-resistant andsalt-tolerant species such as Acacia tortilis subsp.raddiana, Capparis spinosa, Zygophyllum coccineum,Zilla spinosa, Salvadora persica, Aeluropus lagopoidesand Tamarix nilotica.
In the present study, Asteraceae,Zygophyllaceae, Fabaceae, Chenopodiaceae andBrassicaceae were the species-rich families, and representthe most common in the Mediterranean North Africanflora. On the other hand, Poaceae, Fabaceae, Asteraceaeand Brassicaceae constituted the main bulk of floristiccomposition of different habitats in Egypt (Salama et al.,2018), and in adjacent countries such as Libya (Feng etal., 2013), and were found to be the most frequentfamilies in the tropics (Tamado and Milberg, 2000).
The chorological analysis of the surveyed florarevealed that 39 species (61.6% of the total flora) weremonoregional, of which 33 species (52.4%) are native tothe Saharo-Arabian chorotype. The Sudano-Zambezianchorotype ranked second, of which 38.1% of the recordedspecies are biregional and pluri-regional, extending theirdistribution all over the Saharo-Arabian, Sudano-Zambezian, Irano-Turanian and Mediterranean regions.The increase in the numbers of the Saharo-Arabianspecies in the studied area can be attributed to their hightolerability to desert environmental conditions, and in themean time, good indicators for hot and dry climate.
The highest among other perennial species wereZilla spinosa and Zygophyllum coccineum (P=61.1% and75%, respectively) in the studied stands, and spread theirdominancy all over the Eastern Desert of Egypt (Abd El-Ghani et al., 2014). Their dominance over thecommunities of the Eastern Desert was documented bymany scholars (Galal and Fahmy, 2012). This studyrevealed the presence of some species that characterizedthe salinized lands, and are considered among thehalophytic vegetation along the Red Sea coast: Nirariaretusa, Tamarix nilotica, Arthrocnemum macrostachyum,Juncus rigidus, Aeluropus lagopoides. Such hillock-forming salt-tolerant species were recorded in relevantstudies on the flora and vegetation along the Red Seacoasts either in Egypt (Shaltout et al., 2009) or in SaudiArabia (Al-Gifri et al., 2019). Tamarix nilotica isvigorously growing southwards, and represents thenatural climax community type of the Red Sea coastalplain with deep deposits and an underground waterreserve. The growth of the desert scrub Nitraria retusarepresents the highest tolerance to soil salinity conditionsand a penultimate stage in the successional development.Such an effect of salinity stress on floristic diversity inthe study area and related areas was reported by Moustafaand Klopatek (1995) in Sinai desert, and Moreno et al.(2017) in the Iberian Peninsula.

Amro et al., The J. Anim. Plant Sci., 31 (6) 2021
1696
Dataset classification of the recorded speciesusing the TWINSPAN analysis yielded 5 separatedvegetation groups. As usual in the Eastern desert, Zillaspinosa, Zygophyllum coccineum, Z. simplex andTrichodesma africanum were covered all-over the studyarea. These species are widely distributed in Egypt(Zahran and Willis, 2009) and neighboring. In thisinvestigation, most stands of groups E and B were locatedin the Southern part of the study area (Wadi El-Mallahaand Wadi Beli), while the site conditions of the Northernpart (Wadi Dib and Wadi Abu Had) were more suitablefor the species of the remaining groups (A, C and D). Arecent comparable study (El-Khouly and Shawky, 2017)on the species diversity and vegetation analysis of WadiEl-Mallah and W. Esli, recognized 6 vegetation groups.Apart from Capparis decidua, which was not recorded inthis investigation, both studies revealed almost similargroups.
Salinity seems to be the key factor in this studyarea; stands of group A; that characterized by high soilcontents of sodium ions; were dominated by manyannuals (i.e. Zygophyllum simplex, Forsskaoleatenacissima and Arnebia hispidissima). Meanwhile, thedecrease of species diversity and dominance of manyperennials (i.e. Zygophyllum coccineum, Acacia tortilissubsp. raddiana and Ochradenus baccatus) and somexerophytic annuals (i.e. Polycarpaea repens Trichodesmaafricanum) in group C may due to the decrease of soilphosphates. This significant positive correlation betweensoil phosphorus and species diversity was noted byHenkin et al. (2006) on annual legumes of Israel. Thesame trend was observed in stands of group D thatcharacterized by the highest Na, TSS and water contents.Also, dominance of some salt-tolerant species such asArthrocenemum macrostachyum, and Salsola imbricatasubsp. imbricata revealed the salinity of these soils.
Special microhabitat was observed in Wadi El-Mallaha (group E). It is an inland depression (20 km longand 5 km wide) separated from the shore-line by anelevated raised beach and is fed with seawater throughunderground seepage. The bottom of the depressionincludes several small salt-water lagoons, fringed byextensive saline ground covered by surface crusts. Thisis, in turn, fringed by salt marsh vegetation. Thisdescribes the restriction of some halophytes as Haloxylonsalicornicum, Nitraria retusa, Tamarix nilotica, Retamaraetam, Juncus rigidus and Aeluropus lagopoides. Long-term aridity may also cause the accumulation of the saltcontent of such depressions, and cyclic drought periodsaccelerate the salinization process (Akhani, 2006).
The relationships between plant communitiesand environmental factors have become increasinglyimportant to understanding the ecology of arid areas(Zhang et al., 2005). In the extreme arid conditions of theAtacama Desert (Chile); one of the driest world's deserts;Ruhm et al. (2020) investigated the spatial patterns of
floristic diversity and composition around the hyperaridcore of this desert in 21 localities from the coastal andAndean deserts in northern Chile, and indicated a drasticeast-west divergence in floristic similarity which hasbeen explained on the basis of biotic barriers preventedplant exchange from east to west. Meanwhile, Li et al.(2004) portrayed the association between vegetationpatterns and soil properties in the southeastern TenggerDesert of China, and concluded that soil moisture,texture, and nutrient were highly correlated with thestructure and pattern of vegetation. In this study,Canonical Correspondence Analysis (CCA) revealed theimportance of Na, K, Ca, PO4, gravels, coarse sand, siltand clay in species distribution patterns. El-Khouly andShawky (2017) reached to the same result in their studyon W. El-Mallaha and W. Esli. Both ordinationtechniques clearly indicated that salinity, fine sedimentsand moisture content were the important factorscontrolling the distribution of the vegetation in the studyarea. This has been reported by other researchers in SaudiArabia (Shaltout et al., 1997), and in the GurbantunggutDesert of China (Qian et al., 2008).
REFERENCES
Abd El-Ghani, M.M. and N. El-Sawaf (2005). Thecoastal roadside vegetation and environmentalgradients in the arid lands of Egypt. CommunityEcol. 6(2): 143-154.
Abd El-Ghani, M.M. and W. Amer (2003). Soil-vegetation relationships in a coastal desert plainof southern Sinai, Egypt. J. Arid Environ. 55:607-628.
Abd El-Ghani, M.M., F.M. Huerta-Martínez, L. Hongyanand R. Qureshi (2017). Plant Responses toHyperarid Desert Environments. Springer.
Abd El-Ghani, M.M., F.M. Salama, B. Salem, A. El-Hadidy and M. Abdel-Aleem (2014).Biogeographical relations of a hyperarid desertflora in eastern Egypt. Afr. J. Ecol. 52 (2): 173-191.
Akhani, H. (2006). Biodiversity of halophytic and sabkhaecosystems in Iran. In: Ajmal Khan M, BennoB, Kust GS Barth H: (eds.), Sabkha Ecosystems.Volume II: West and Central Asia, pp. 71-88.Springer.
Al-Gifri, A.N., W.T. Kasem, R.S. Shehata and M.M.Eldemerdash (2019). The African PaleotropicalInfluence on the Biogeography of the Flora ofJazan, KSA. Asian J. Soil Sci. Plant Nutr. 4(1):1-10.
Boulos, L. (1995). Flora of Egypt, Checklist. Al HadaraPublishing, Cairo, Egypt, 283 pp.
Boulos, L. (1999). Flora of Egypt, 1: Azollaceae –Oxalidaceae: Al Hadara Publisher, Cairo, 419pp.

Amro et al., The J. Anim. Plant Sci., 31 (6) 2021
1697
Boulos, L. (2000). Flora of Egypt, 2: Geraniaceae –Boraginaceae: Al Hadara Publisher, Cairo, 352pp.
Bouyoucos, G.J. 1962. Hydrometer method im-provedfor making particle size analysis of soils. Agr. J.54: 464-465.
El-Khouly, A. and R. Shawky (2017). Plant speciesdiversity of some wadis at Red Sea Coast,Egypt. Research & Reviews: J. Bot. Sci. 6 (2):25-35.
Feng, Y., J. Qiang, X. Xing-Wen and P. Bo-Rong (2013).Composition and characteristics of Libyan flora.Arch. Biol. Sci. (Belgrade) 65 (2): 651-657.
Flores, J. and O. Briones (2001). Plant life-form andgermination in a Mexican inter-tropical desert:effects of soil water potential and temperature. J.Arid Env. 47(4): 485-497.
Galal, T.M. and A.G. Fahmy (2012). Plant diversity andcommunity structure of Wadi Gimal protectedarea, Red Sea Coast of Egypt. Afr. J. Ecol. 50:266–276.
Hahs, A., N.J. Enright and I. Thomas (1999). Plantcommunities, species richness and theirenvironmental correlates in the sandy heaths ofLittle Desert National Park, Victoria. Austral.Ecol. 24(3): 249-257.
Henderson, P.A. and R.M.H. Seaby (1999). CommunityAnalysis Package (CAP) version 1.2. PiscesConservation Ltd. IRC House, UK.
Henkin, Z., M. Sternberg, N.G. Seligman, I. Noy-Meir(2006). Species richness in relation tophosphorus and competition in a Mediterraneandwarf-shrub community. Agric. Ecosyst.Environ. 113: 277–283.
Huerta-Martínez, F.M., J.A. Vázquez-García, E. García-Moya, L. López-Mata and H. Vaquera-Huerta(2004). Vegetation ordination at the southernChihuahuan Desert (San Luis Potosi, Mexico).Plant Ecol. 174: 79–87.
Jackson, M.L. (1967). Soil Chemical Analysis. Prentice-Hall of India, Private limited New Delhi.,498pp.
Kapur, P. and S.R. Govil (2000). Experimental plantecology. CBS, Publisher and Distributors, Daryaganj, New Delhi (India).
Li, X.R., Z.S. Zhang, J.G. Zhang, X.P. Wang and X.H.Jia (2004). Association between VegetationPatterns and Soil Properties in the SoutheasternTengger Desert, China. Arid Land Res. Manag.18: 369–383.
Lundholm, J.T. and D.W. Larson (2003). Relationshipsbetween spatial environmental heterogeneity andplant species diversity on a limestone pavement.Ecography 26 (6): 715–722.
Maestre, F.T., S. Bautista and J. Cortina (2003). Positive,negative, and net effects in grass‐shrub
interactions in Mediterranean semiaridgrasslands. Ecology 84: 3186–3197.
Marcelo, F.M., A.S. Igor, S.A. Francisca, N.L.Eimear, R.M. Thomas and R.M. Fernando(2015). The Role of Edaphic Environment andClimate in Structuring Phylogenetic Pattern inSeasonally Dry Tropical Plant Communities.PLoS One 10(3): e0119166.
Moreno, A. C. Pérez-Mejías, M. Bartolomé et al. (2017).New speleothem data from Molinos and Ejulvecaves reveal Holocene hydrological variabilityin northeast Iberia. Quat. Res. 88: 223-233.
Moustafa, A.A. and J.M. Klopatek (1995). Vegetationand landforms of the Saint Catherine area,southern Sinai, Egypt. J. Arid Environ. 30: 385-395.
Pan, D., A. Bouchard, P. Legendre and G. Domon(1998). Influence of edaphic factors on thespatial structure of inland halophyticcommunities: a case study in China. J. Veg. Sci.9: 797-804.
Pielou, E.C. (1975). Ecological Diversity. New York:Wiley, 165 pp.
Qian, Y., Z. Wu, R. Zhao and L. Zhang (2008).Vegetation patterns and species-environmentrelationships in the Gurbantunggut Desert ofChina. J. Geog. Sci. 18(4): 400–414.
Raunkiaer, C. (1937). The Life Forms of Plants andStatistical Plant Geography. Clarendon Press,Oxford, 104 pp.
Ruhm, J., T. Böhnert, M. Weigend, F. F. Merklinger, A.Stoll, D. Quandt and F. Luebert (2020). Plantlife at the dry limit—Spatial patterns of floristicdiversity and composition around the hyperaridcore of the Atacama Desert. PLoS ONE 15(5):e0233729. https://doi.org/10.1371/journal.pone.0233729
Salama, F., M. Ahmed, N. El-Tayeh and S. Hammad(2012). Vegetation analysis, phenologicalpatterns and chorological affinities in WadiQena, Eastern Desert, Egypt. Afr. J. Ecol. 50(2):193-204.
Salama, F.M., M.M. Abd El-Ghani, M. Gadallah, S. El-Naggar and A. Amro (2014). Variations invegetation structure, species dominance andplant communities in south of the EasternDesert-Egypt. Not. Sci. Biol., 6(1): 41-58.
Salama, F.M., M.M. Abd El-Ghani, M.A. Gadallah, S.M.El-Naggar and A. Amro (2015). Diversity andresponses of plant functional groups to soilvariables in the arid desert landscape of southernEgypt. JBES 5 (1): 24-39.
Salama, F.M., M.M. Abd El-Ghani, M.A. Gadallah, S.M.El-Naggar and A. Amro (2016). Characteristicsof desert vegetation along four transects in the

Amro et al., The J. Anim. Plant Sci., 31 (6) 2021
1698
arid environment of southern Egypt. Turk. J.Bot. 40: 59-73.
Salama, F.M., M.M. Abd El-Ghani, M. Gadallah, T.Ramadan, H.K. Galal and A. Gaafar (2018).Vegetation patterns and floristic compositionalong elevation gradient on Jabal Musa, SouthSinai, Egypt. Catrina 17 (1): 41-57.
Shaltout, K.H., M.G. Sheded and A.H. Salem (2009).Population structure of common shrubs and treesin Wadi Allaqi Biosphere Reserve, South-EastEgypt. Feddes Repert.120 (5–6): 343–354.
Shaltout, K.H., E.F. El-Halawany and M.M. El-Garawany (1997). Coastal lowland vegetation ofeastern Saudi Arabia. Biodivers. Conserv. 6:1027-1070.
Täckholm, V. (1974). Students' Flora of Egypt, 2nd Ed.Cairo University Press, Cairo, Egypt, 888 pp.
Tamado, T. and P. Milberg (2000). Weed flora in arablefields of eastern Ethiopia, with emphasis on theoccurrence of Parthenium hysterophorus. WeedResearch 40: 507-521.
Ter Braak, C.J.F. (1990). Update notes: CANOCOversion 3.1. Wageningen, AgriculturalMathematics Group.
Ter Braak, C.J.F. and I.C. Prentice (1988). A theory ofgradient analysis. Adv. Ecol. Res. 18: 271-317.
Tizro A.T. and K.S. Voudouris (2007). Groundwaterquality in the semi-arid region of theChahardouly basin, West Iran. Hydrol. Process.DOI: 10.1002/hyp.6893.
Woods J.T. and M.A. Mellon (1941). Chlorostannous-Molybdophosphoric blue colour method insulfuric acid system. In soil chemical analysis byJackson ML (1958). Prentice Hall International.Inc. London.
Xu, L.-H., H.-Y. Liu, X.-Z. Chu and K. Su (2006).Desert vegetation patterns at the northern foot ofTianshan Mountains: The role of soil conditions.Flora 206 (1): 44-50.
Zahran, M.A. and A.J. Willis (2009). The Vegetation ofEgypt. London. Volume 2: Plant andVegetation. Springer Science and BusinessMedia B.V.
Zhang, Y.M., Y.N. Chen and B.R. Pan (2005).Distribution and floristics of desert plantcommunities in the lower reaches of TarimRiver, southern Xinjiang, People’s Republic ofChina. J. Arid Environ. 63: 772–784.
Zohary, M. (1966). Flora Palaestina. Part I. The IsraelAcademy of Sciences of Humanities.
Zohary, M. (1972). Flora Palaestina. Part II. The IsraelAcademy of Science and Humanities.