variations in natural electric field or induced ...variations in natural electric field or induced...
TRANSCRIPT
Electrical and Electromagnetic Methods
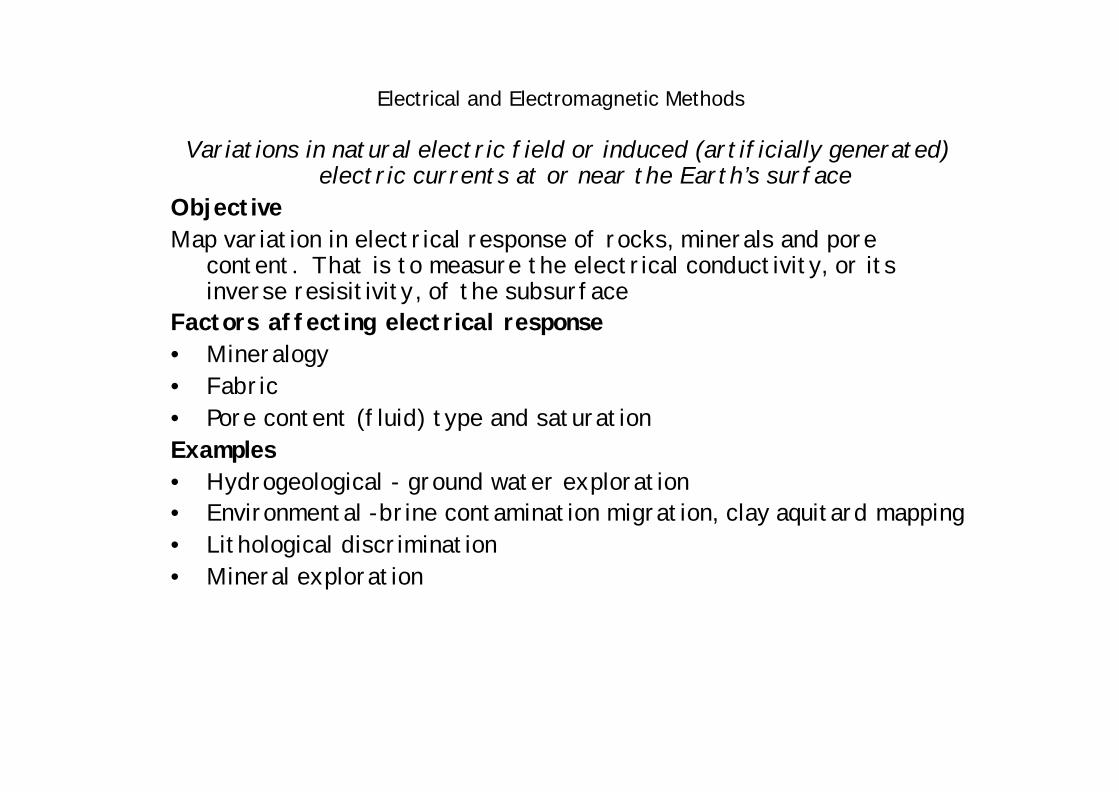
Variations in natural electric field or induced (artificially generated) electric currents at or near the Earth’s surface
ObjectiveMap variation in electrical response of rocks, minerals and pore
content. That is to measure the electrical conductivity, or itsinverse resisitivity, of the subsurface
Factors affecting electrical response• Mineralogy• Fabric• Pore content (fluid) type and saturation Examples• Hydrogeological - ground water exploration • Environmental -brine contamination migration, clay aquitard mapping• Lithological discrimination• Mineral exploration
Electrical and Electro-magnetic Methods
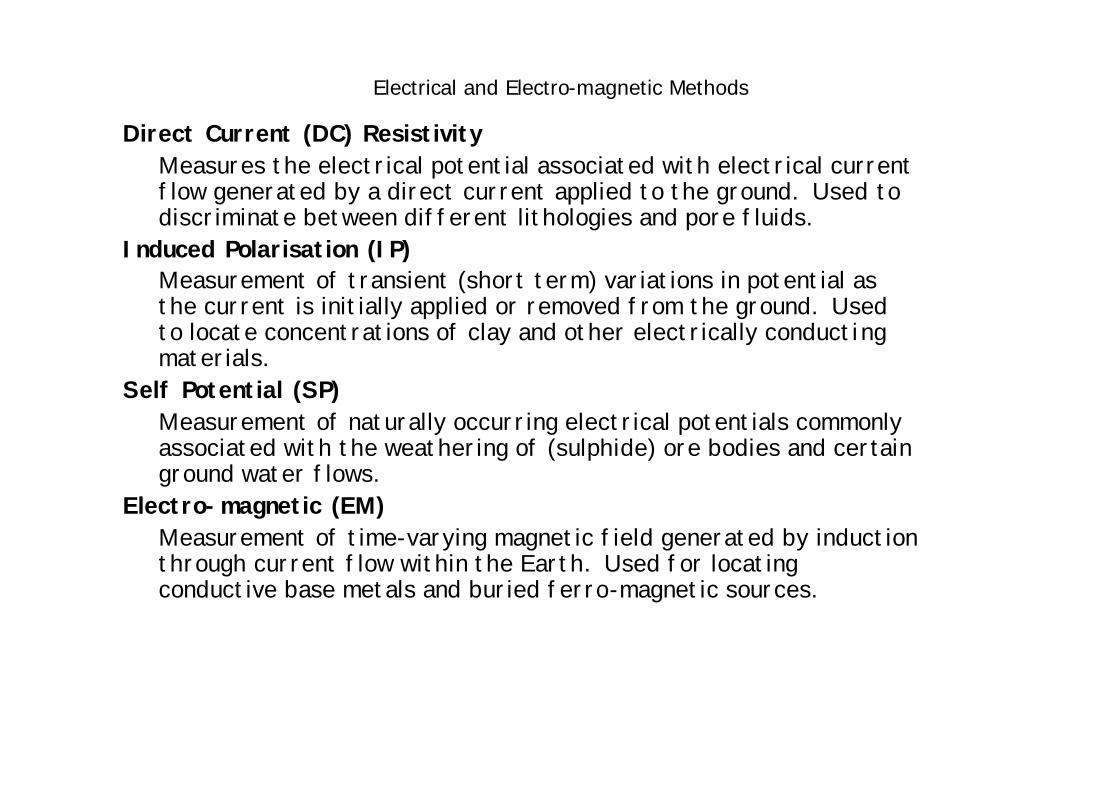
Direct Current (DC) ResistivityMeasures the electrical potential associated with electrical current flow generated by a direct current applied to the ground. Used to discriminate between different lithologies and pore fluids.
Induced Polarisation (IP)Measurement of transient (short term) variations in potential asthe current is initially applied or removed from the ground. Used to locate concentrations of clay and other electrically conducting materials.
Self Potential (SP)Measurement of naturally occurring electrical potentials commonly associated with the weathering of (sulphide) ore bodies and certain ground water flows.
Electro-magnetic (EM)Measurement of time-varying magnetic field generated by induction through current flow within the Earth. Used for locating conductive base metals and buried ferro-magnetic sources.

Fundamental Principles
Ohm’s LawEmpirical relationship between the current (I) flowing through a wire,
of resistance R and the voltage potential (V) required to propagate the current.
Further
where L is the length and A the cross sectional area of wire.However, as we are not concerned with wires in the Earth, and
electrical current is not constrained, the resistivity, ? of a material is a more useful concept where.
V IR?
? ? RAL IL
VA??
AL
R ?
or
Geoelectric Soundings, Geology and Hydrogeology
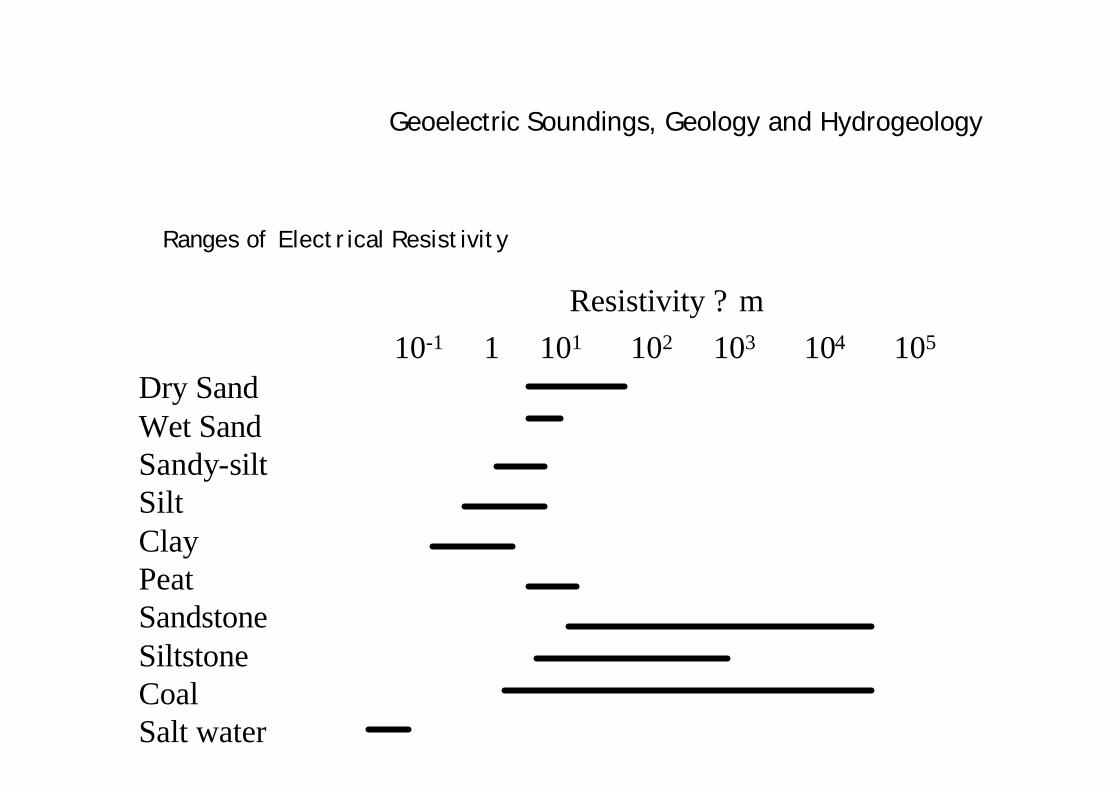
Ranges of Electrical Resistivity
Dry SandWet SandSandy-siltSiltClayPeatSandstoneSiltstoneCoalSalt water
Resistivity ? m10-1 1 101 102 103 104 105

Current Flow in the Ground
I
EquipotentialSurface (surface ofconstant voltage)
Current flow lines
It is the potential difference between the equipotential surfaces that causes the current to flow
+I -I

Measurement of Current Flow in the Ground
• However, it is difficult to measure the current flow directly because of contact resistance between the electrodes and the ground.
• Therefore, the potential difference between a second set of electrodes not connected to the primary circuit is measured
IV
Potential electrodes
Current electrodes

DC Resistivity
The most common electrical method usedResistivity Profiling - used to determine lateral changes in resistivity
due to changes in geologic structure.Resistivity Soundings - used to determine vertical changes in
resistivity due to geologic structure assuming horizontal layering.• Wenner Array• Schlumberger Array
– Both techniques measure apparent resistivity (?) computed from measurements of voltage, change in voltage and current, iin the form shown below.
– where a is the electrode separation.
– A plot of apparent resistivity (? )versus electrode spacing is made by moving the electrodes to new (expanded) positions. From this an interpretation of resistivity (conductivity) variation with depth is made.
? ?? ? 2 aVi
?

Common Electrode Spacing
Pole-Dipole
Wenner
Schlumberger
a aa
Current electrodesPotential electrodes
a ab
Pole-Pole
a a or na
V, >10a a
I >10a
I, >10a
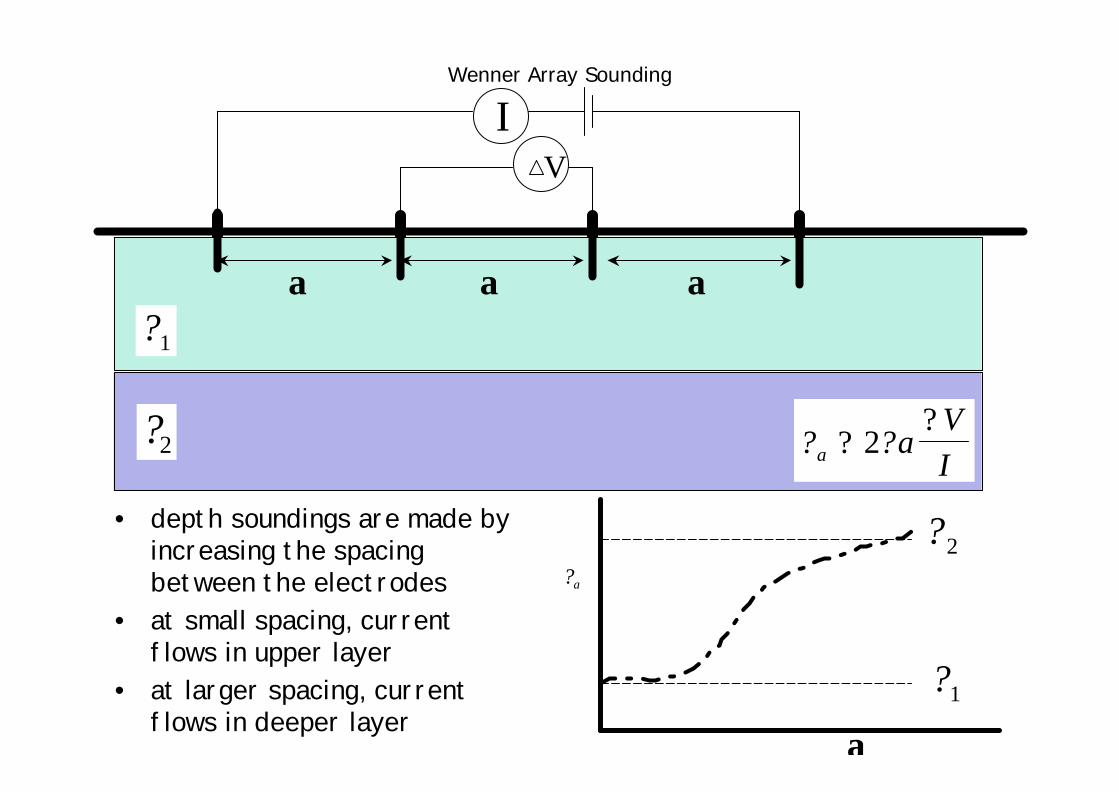
Wenner Array Sounding
• depth soundings are made by increasing the spacing between the electrodes
• at small spacing, current flows in upper layer
• at larger spacing, current flows in deeper layer
IV
a
aa a?1
?1
?2
? 2?a
? ?a aVI
? 2?

Typical DC Resistivity Survey
• Define Objectives• Review Regional Geology and Hydrogeology• Assess Noise• Forward Model - geo-electric section for sounding, design survey
sample interval, station spacing, desired resolution at specifictarget depth
• Test/calibrate sounding at or near ground truth (outcrop or borehole) with soundings at more than one orientation
• Execute design survey or adjust survey to meet objectives
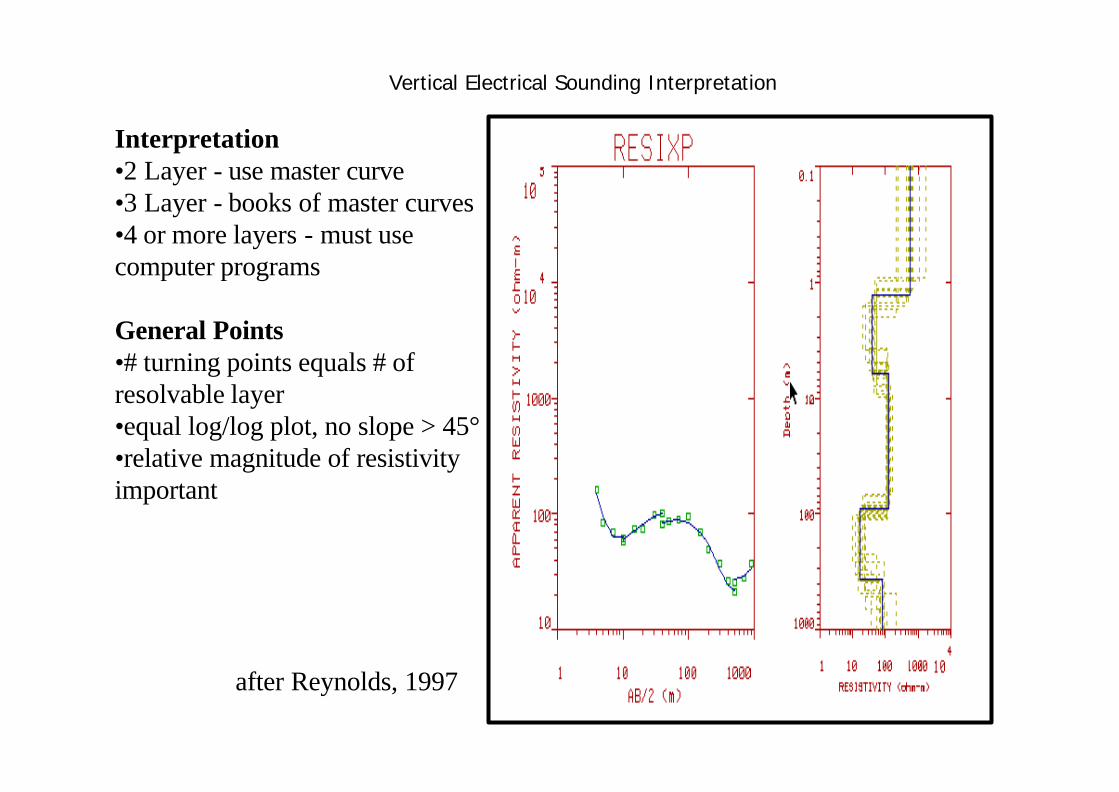
Vertical Electrical Sounding Interpretation
Interpretation•2 Layer - use master curve•3 Layer - books of master curves•4 or more layers - must use computer programs
General Points•# turning points equals # of resolvable layer•equal log/log plot, no slope > 45°•relative magnitude of resistivity important
after Reynolds, 1997

Geoelectric Section
Borehole

Geoelectric Section
south-north from grid ref. (-120,20) to (150,20)
west-east from grid ref. (-70,30) to (-70,10)

2 Layer Vertical Electrical Sounding Interpretation Using Master Curves
From Milsom, 1989
?1/ ?2= 20
5
1/5
1/20
?1
?2
? a/ ? 1
L/h1
h1
A m n B
L=AB/2
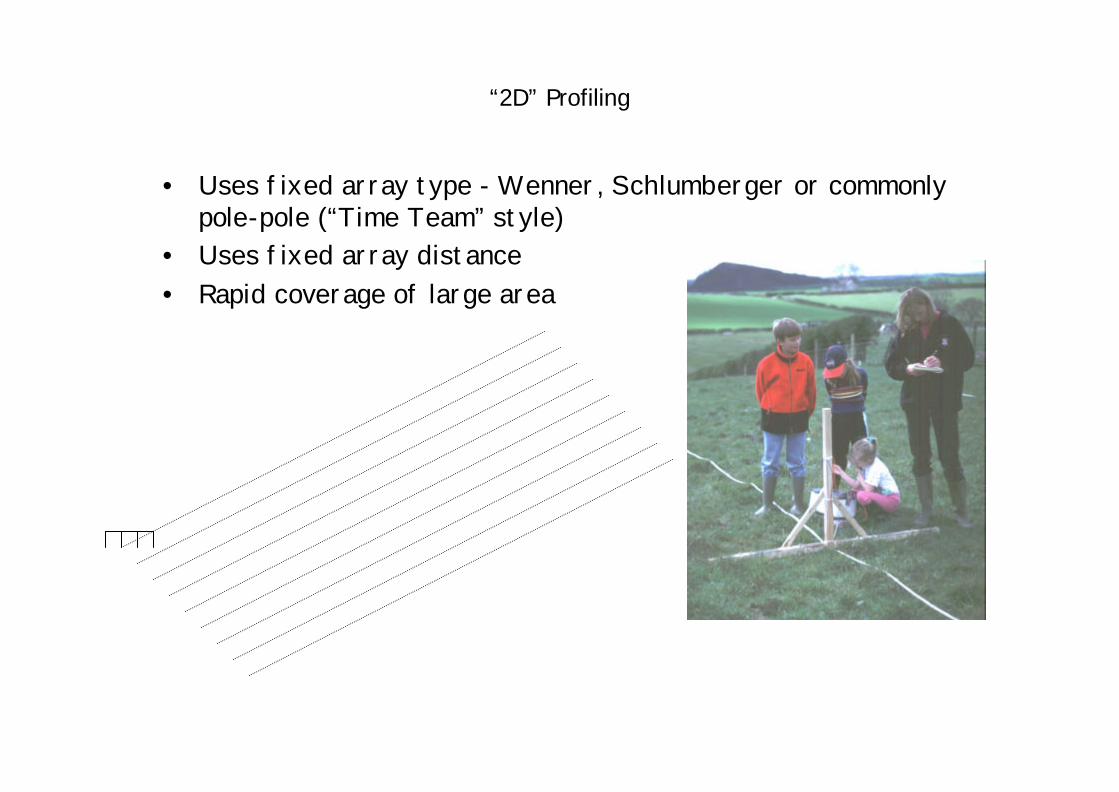
“2D” Profiling
• Uses fixed array type - Wenner, Schlumberger or commonly pole-pole (“Time Team” style)
• Uses fixed array distance• Rapid coverage of large area

Electrical Surveying Equipment
1D• Syscal - Junior, R1 Plus, R2• ABEM - Terrameter 300b and300c• OYO- Mcohm2D• AMEM - Lund• OYO - Mcohm 21 (DAP21)• Advanced Geosciences Inc., - Sting/Swift
Initial Equipment Cost £4K to£6K; £10K to £15KProductivity Low for 1D; medium for 2D
(5 sections per day)Maintenance LowOperation budget LowExperience Low for 1D; medium for 2D
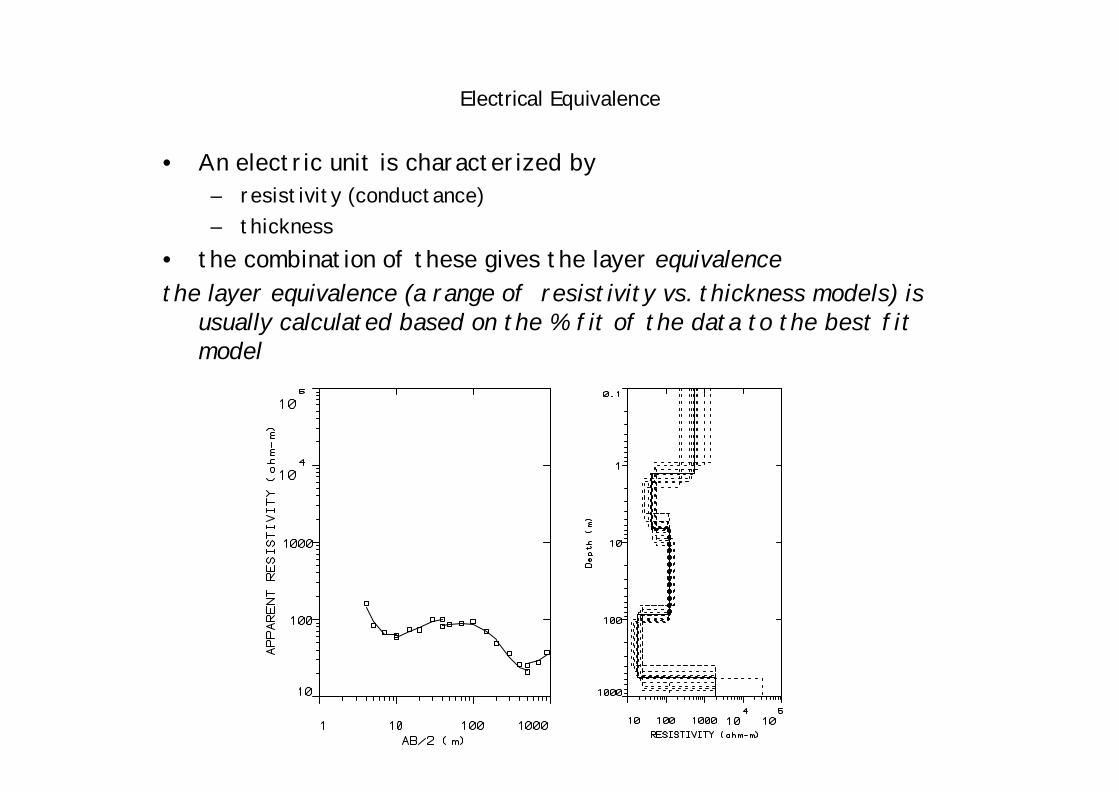
Electrical Equivalence
• An electric unit is characterized by – resistivity (conductance)– thickness
• the combination of these gives the layer equivalencethe layer equivalence (a range of resistivity vs. thickness models) is
usually calculated based on the % fit of the data to the best fit model

Norton Farm Raised Beaches
S N
Limestone Bedrock Channel

Landfill Site
Pit Head

EM, Resistivity and Microgravity

3D Resistivity

Very Low Frequency(VLF) EM
• Hybrid of Electrical and EM• Earth acts like a resistor but current induced by varying
magnetic field• Field supplied by transmitter stations of different
frequencies• Strength diminishes rapidly with depth
World Transmitter Locations
21
503 ???
????
??
fd
?

Uses and Limitations of VLF Surveying
Advantages• Rapid - modern instruments can record 3 signals
simultaneously• Cheap - equipment, data acquisition and data processing
Disadvantages• Sometimes Non-repeatable dependent on signal strength• Reliant on the transmitter being on which is out of the
operators control• Effected by topography - if results are a mirror of
topography then beware

Response to a Vertical Sheet Conductor(water filled fractures)
Tilt angle profile Schematic of amplitude variation with depth
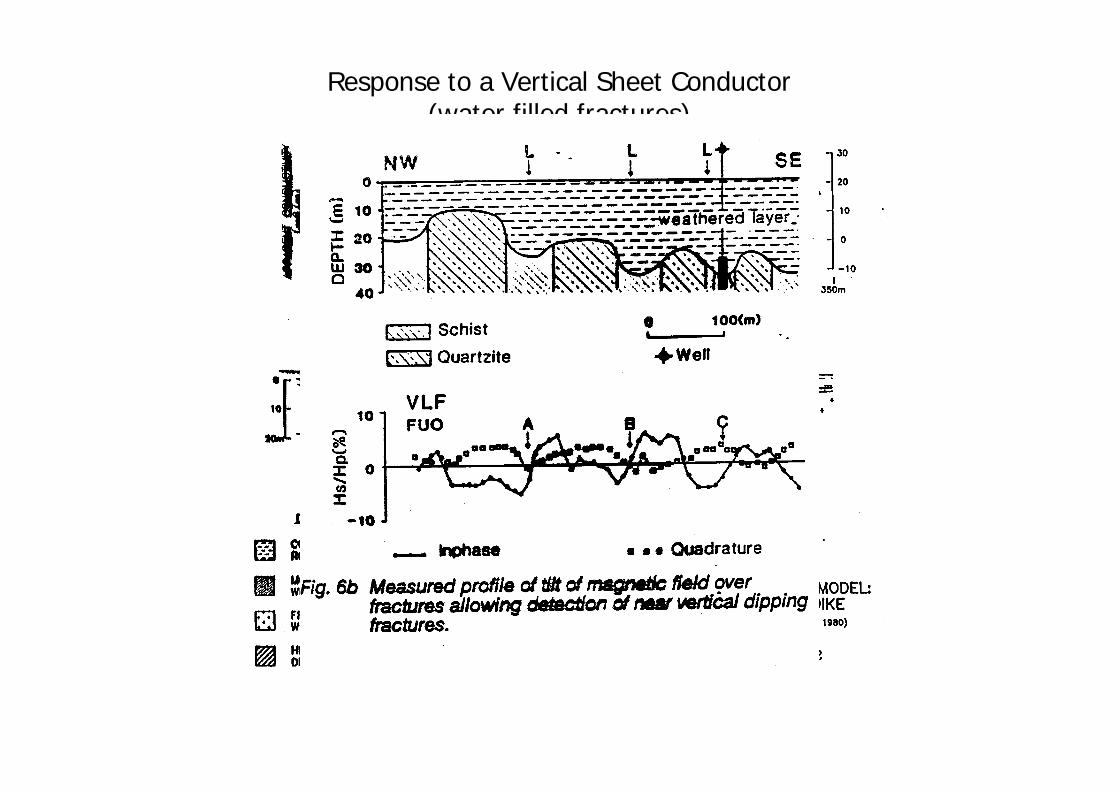
Response to a Vertical Sheet Conductor(water filled fractures)

Response to a Vertical Conductors

VLF Equipment
• Geonics - Em16, EM16R• ABEM - WADI• EDA - Omi IV• Scintrex - VLF3, VLF4• Phoenix - VLF2
Cost £3K to £15KProductivity High along regional
transectsMaintainance LowOperation budget LowExperience Low for acquisition,
processing andinterpretation

Differences and Similarities between Electrical and Electromagnetic Methods
Electrical• Time invariant (or slow)
electrical currents• Electrical currents directly
applied to earth (galvanic-electrode contact)
• inexpensive equipment• ease (low cost) of data
processing• poor lateral resolution• high sensitivity to geologic
noise• transmitter array
approximately 7-10 times greater than depth of penetration
Electromagnetic• Time variant
(quickly)electrical and magnetic fields
• Electrical currents induced by remote electrical and magnetic fields
• expensive equipment• complex processing
• high lateral resolution• low sensitivity to geologic
noise
• transmitter array approximately equal to depth of penetration

Generalized Schematic of Electromagnetic Surveying Method(Grant and West, 1965)
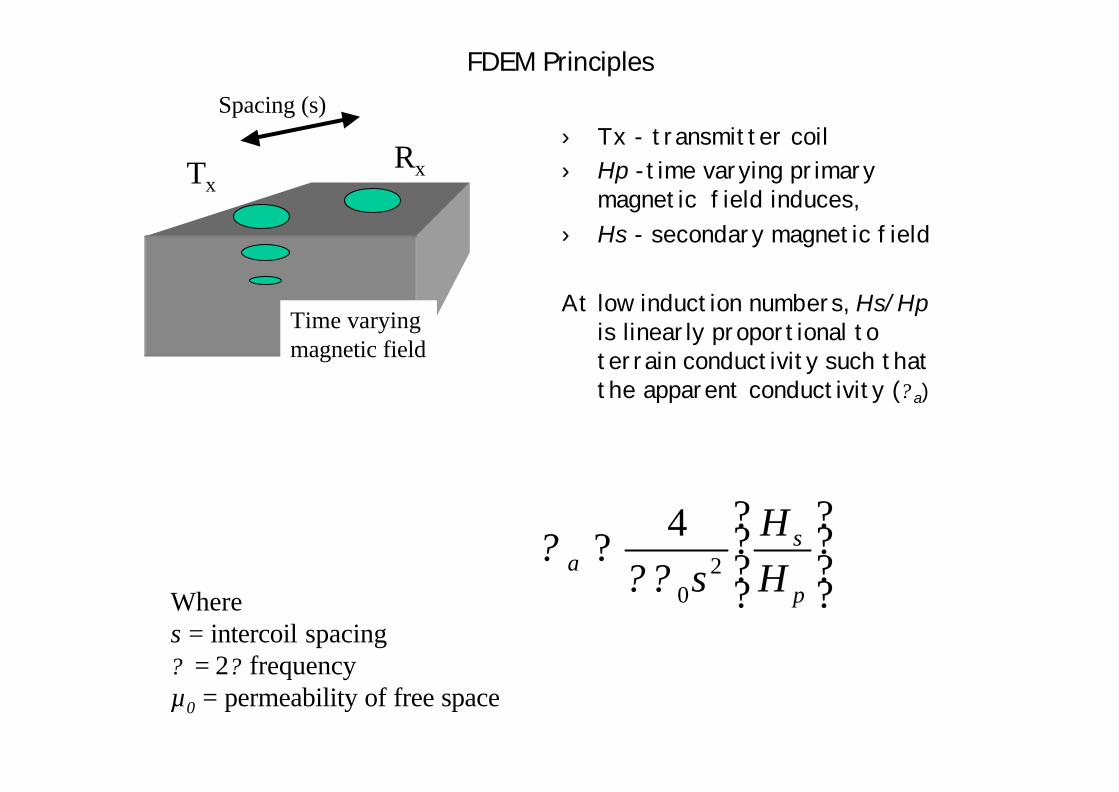
FDEM Principles
› Tx - transmitter coil› Hp -time varying primary
magnetic field induces,› Hs - secondary magnetic field
At low induction numbers, Hs/Hpis linearly proportional to terrain conductivity such that the apparent conductivity (? a)
Wheres = intercoil spacing? = 2? frequencyµ0 = permeability of free space
Spacing (s)
TxRx
Time varyingmagnetic field
???
????
??
p
sa H
Hs2
0
4? ?
?

Factors Affecting Conductivity
• Lithology - type (electrical properties of particles or crystals)• Porosity - shape, size, number of pores • Permeability - shape, size and extent of interconnecting passages• Pore fill type and amount - fluid or solid in pores? Conductivity of
pore fill• Concentration of dissolved electrolytes in the contained (bound)
moisture• Temperature and phase state of the pore fill content• Colloids/organic component? This is only partially understood and
beyond the scope of this course
Refer to Geonics Technical note TN-5 for a more complete discussion of these issues

Typical FDEM Survey
• Define Objectives• Review Regional Geology and Hydrogeology• Assess Noise• Forward Model - geo-electric section for sounding, design survey
sample interval, station spacing, line spacing, desired resolution at specific target depth, cost
• Test sounding at or near ground truth (outcrop or borehole) withsoundings at more than one orientation
• Layout survey grid or line (survey locations)• Execute design survey - acquire data (e.g. EM31 walk and measure
in horizontal or vertical dipole orientation)• Download data from data logger or transfer from field note book• Preliminary process and plot (line, or contour) before leaving field
at the end of each day and/or at regular intervals throughout the day

FDEM Equipment
• Geonics – EM38– EM31– EM34– EM39 (borehole)
• Geofyzika a.s.– CM-031
Cost £8K to £15KProductivity High along lines and for
gridsMaintenance LowOperation budget LowExperience Low level necessary

FDEM Limitations and AdvantagesLimitations• Measure of (very small) secondary field in presence of primary
field• Limited exploration depth• Very sensitive to cultural (electrical) noise• Limited vertical resolution
Advantages• No ground contact• High survey productivity• Direct measure of ground conductivity• High lateral resolutionTypical FDEM Measurement Ranges for Geonics Equipment
Instrument EM38 EM31 EM34 EM34 EM34Coil Spacing 1m 3.7m 10m 20m 40mHorizontal Dipole 0.75m 3m 7.7m 15m 30mVertical Dipole 1.5m 6m 15m 30m 60m
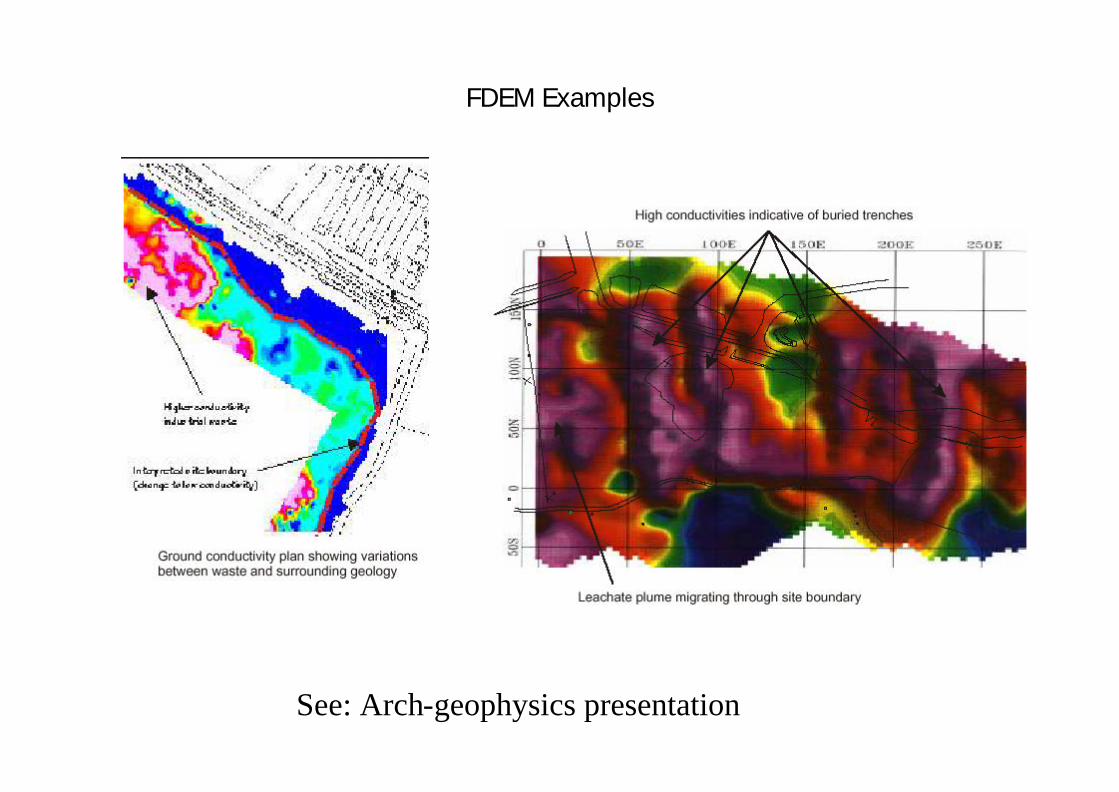
FDEM Examples
See: Arch-geophysics presentation

FDEM Examples

Electromagnetic Methods - Comparison of FDEM and TDEM System Waveforms
Frequency DomainTime Domain
After Hoekstra and Blohm (1989)
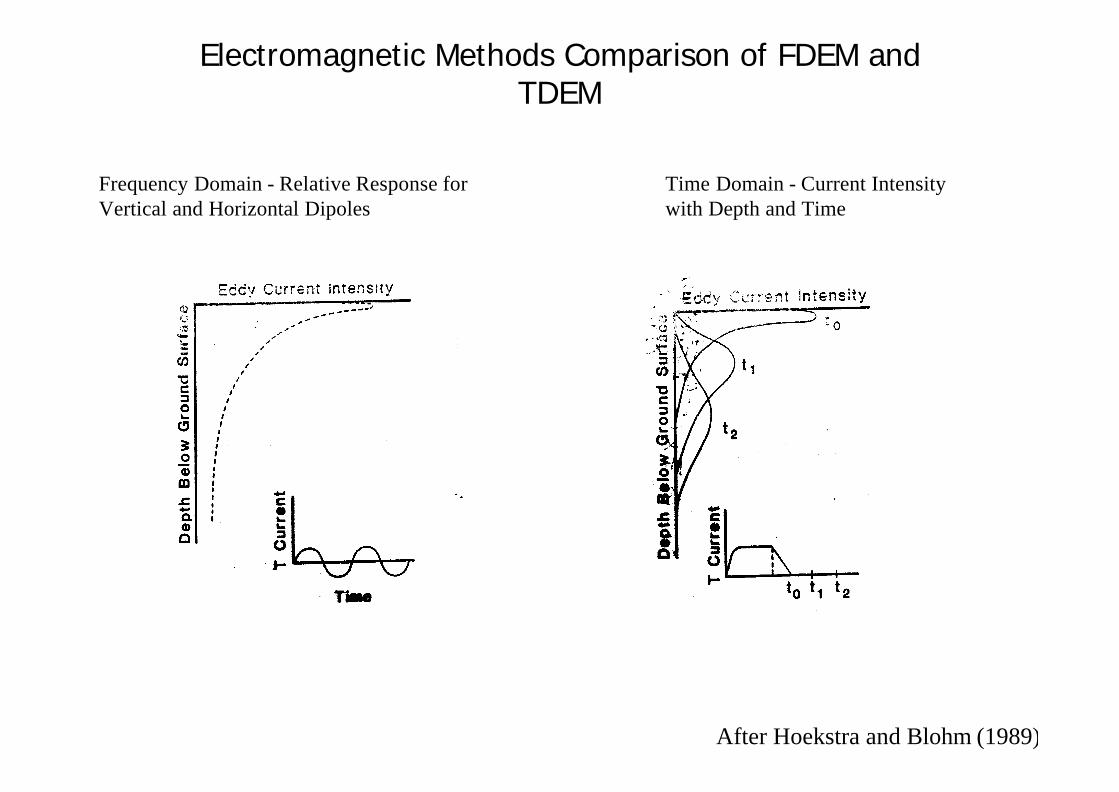
Electromagnetic Methods Comparison of FDEM and TDEM
Frequency Domain - Relative Response for Vertical and Horizontal Dipoles
Time Domain - Current Intensity with Depth and Time
After Hoekstra and Blohm (1989)

TDEM - behavior of emf
Behavior of emf due to vertical magnetic field in centre of 100m2
loop
Measured emf due to vertical and horizontal magnetic fieldon a profile through centre of 400m2 transmitter loop
After Mills et al. (1988)
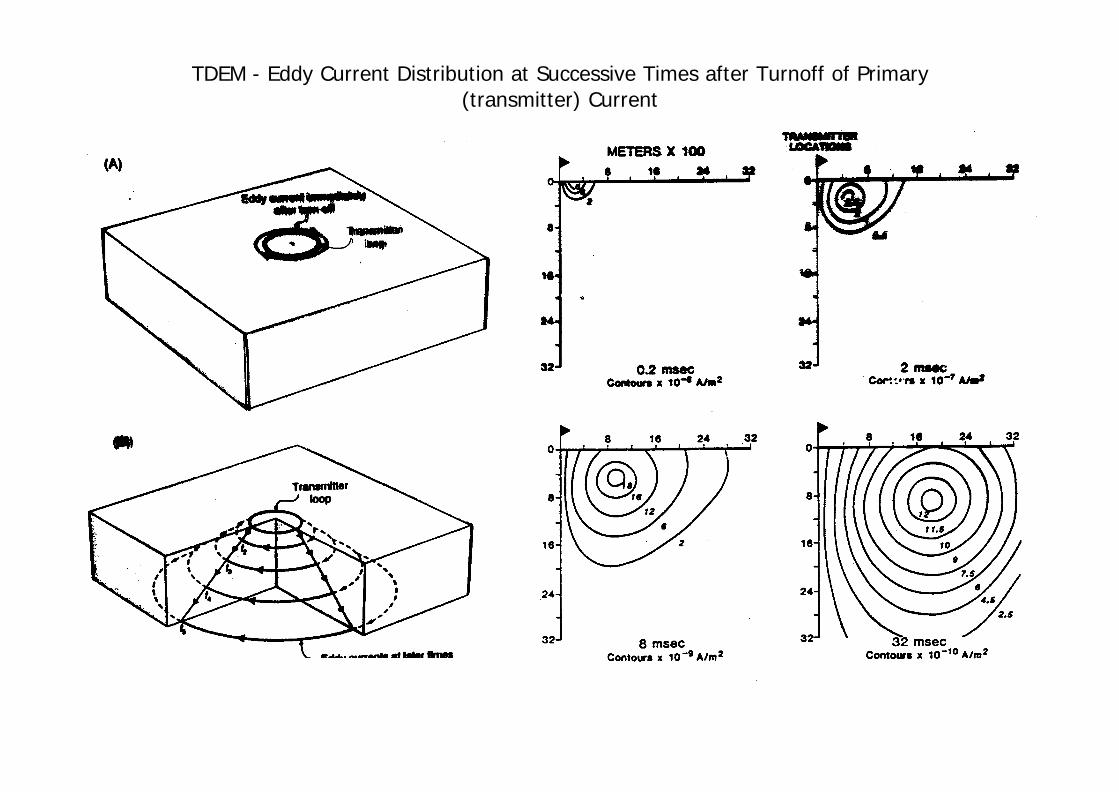
TDEM - Eddy Current Distribution at Successive Times after Turnoff of Primary (transmitter) Current

Configuration for Central Loop TDEM sounding
Transmitter loopCentral horizontal receiver loop

Typical Central Loop TDEM Survey
• Define Objectives• Review Regional Geology and Hydrogeology• Assess Noise• Forward Model - geo-electric section for sounding, design survey
sample interval, station spacing, line spacing, desired resolution at specific target depth, cost
• Test sounding at or near ground truth (outcrop or borehole) withsoundings at more than one orientation
• Layout survey grid or line (survey locations for centre of loop)• Execute design survey - lay out square transmitter loop, stack data
at centre of loop. • Noise Check by acquiring data with receiver at 1/2 distance
between centre of loop and transmitter wire • Preliminary process and review data before leaving field at the end
of each day and/or at regular intervals throughout the day

TDEM Limitations and Advantages
Limitations• Sensitive to conductivity inhomogeneities around receiver coil• Sensitive to below and above ground EM noise (electrical/magnetic
storms)Advantages• High lateral resolution - small transmitter loop (0.75x depth of
penetration)• high vertical resolution• Low sensitivity to geologic noise• Ambient noise can be removed by stacking
TDEM Output• 1D geoelectic sections• 2D geoelectric sections

TDEM Equipment
• Geonics – EM47– EM37– EM42– EM61 (shallow metal detector)
• Geometrics– Stratagem
Cost £30K to £40KProductivity Medium to lowMaintenance HighOperation budget MediumExperience Medium to high level
necessary

Comparison of DC Resistivity Sounding and TDEM Sounding
Schlumberger Array Central Loop TDEM
After Hoekstra et al. (1992)

Bedrock geology around St Andrews
St Andrews Bay
Ordnance Survey Map (Brown, 1980)
Sedimentary Rocks
Carboniferous
Upper Devonian
Explanation
Igneous Rocks
Lower Devonian
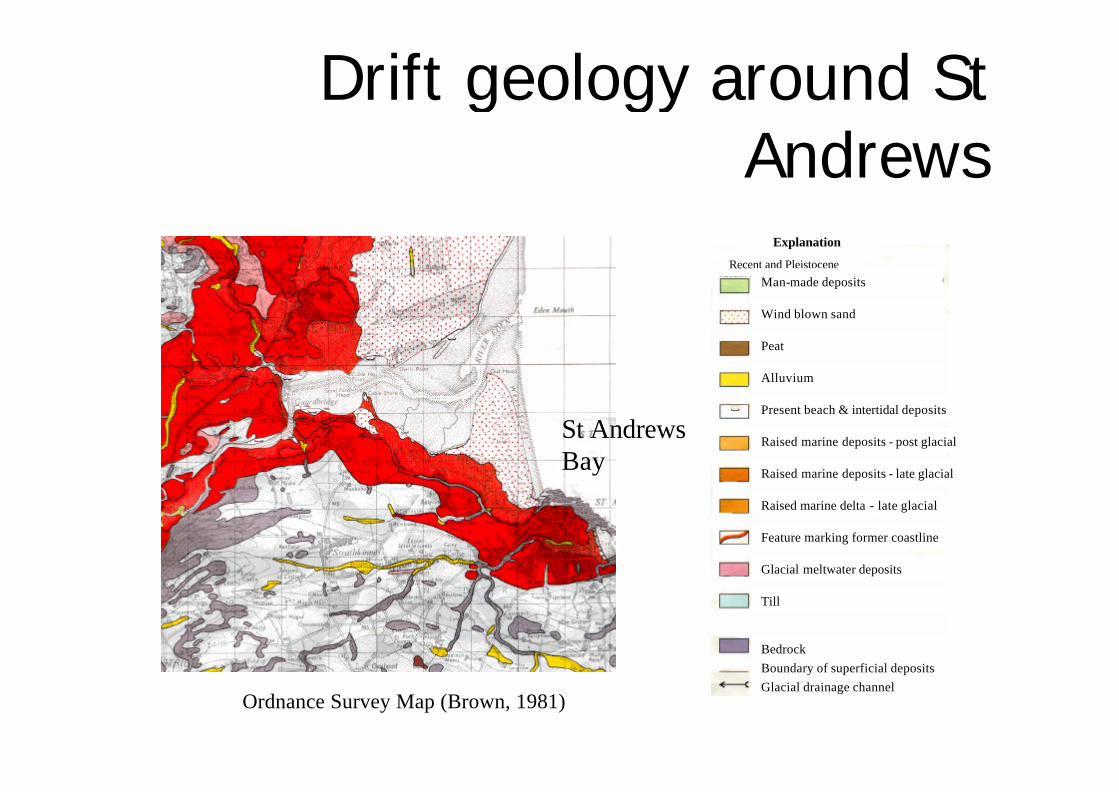
Drift geology around St Andrews
Ordnance Survey Map (Brown, 1981)
St Andrews Bay
Recent and Pleistocene
Explanation
Man-made deposits
Wind blown sand
Peat
Alluvium
Present beach & intertidal deposits
Raised marine deposits - post glacial
Raised marine deposits - late glacial
Raised marine delta - late glacial
Feature marking former coastline
Glacial meltwater deposits
Till
BedrockBoundary of superficial depositsGlacial drainage channel
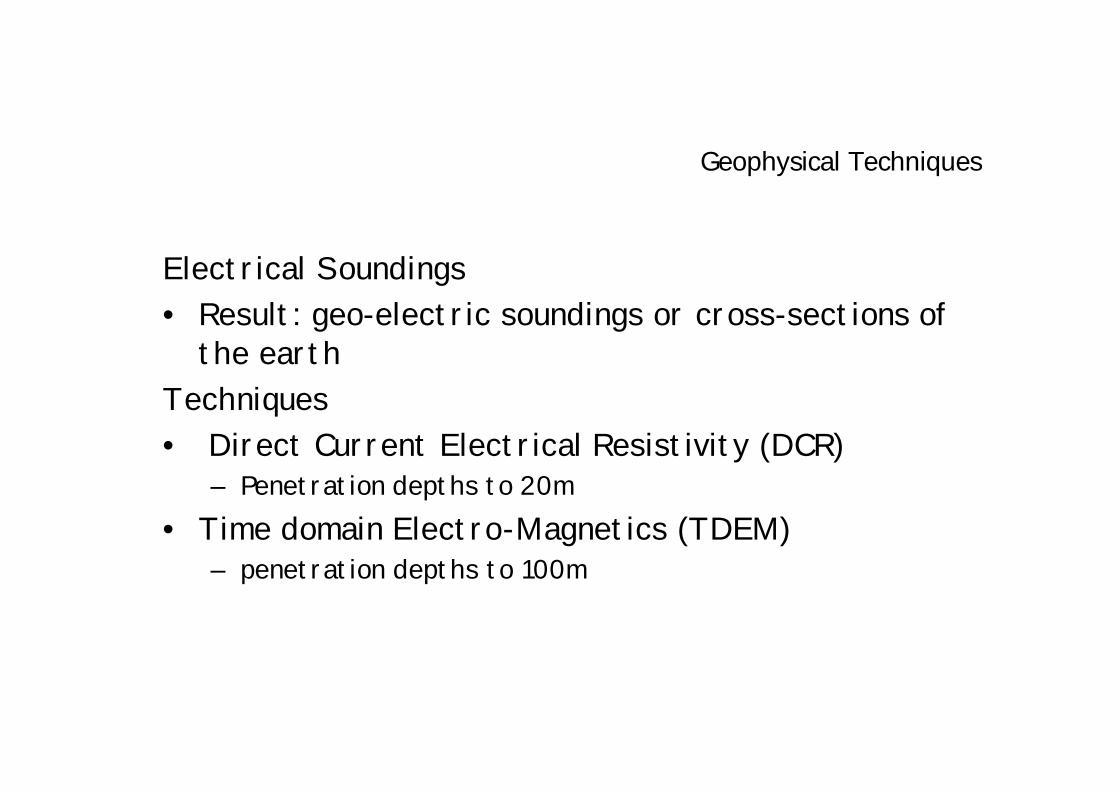
Geophysical Techniques
Electrical Soundings• Result: geo-electric soundings or cross-sections of
the earthTechniques• Direct Current Electrical Resistivity (DCR)
– Penetration depths to 20m• Time domain Electro-Magnetics (TDEM)
– penetration depths to 100m

Geoelectric Soundings, Geology and Hydrogeology
Ranges of Electrical Resistivity
Dry SandWet SandSandy-siltSiltClayPeatSandstoneSiltstoneCoalSalt water
Resistivity ? m10-1 1 101 102 103 104 105

TDEM - Geoelectric Section
Borehole

Line 1 and Line 2
Line 1
Line 2
BH2
BH3

Line 1
200 m

Line 2
200 m

Correlation of Geophysics and Geology
Borehole logging• Gamma ray• Resistivity
Potential of Future Geophysical Studies
• Monitoring Salt water Intrusion• Monitoring surface water/green quality

Saltwater Intrusion
from Blackhawk

Saltwater Intrusion
from Blackhawk

Green Quality- Watering Strategy
dry saturatedafter Tapias and Casas
Traverse across links using EM31