vashon- maury island water resources201 south jackson street, suite 600 seattle, wa 98104 ......
TRANSCRIPT

Vashon- Maury Island Water Resources
- A Retrospective of Contributions &
Highlights
December 2013
Department of Natural Resources and Parks Water and Land Resources Division
Science and Technical Support Section
King Street Center, KSC-NR-0600 201 South Jackson Street, Suite 600
Seattle, WA 98104 http://www.kingcounty.gov/environment/wlr/science-section.aspx
Alternate Formats Available
206-477-4807 TTY Relay: 711
Vashon-Maury Island Water
Resources - A Retrospective of
Contributions & Highlights
Submitted by:
King County Department of Natural Resources and Parks Water and Land Resources Division Scientific and Technical Support Section Water Quality and Quantity Data Group - Hydrologic Services http://www.kingcounty.gov/environment/waterandland.aspx
Prepared by: S. Bilir
With contributions from: E. Ferguson (Vashon-Maury Island Groundwater Protection Program information) and C. DeGasperi (Quartermaster Harbor Nitrogen Management Study information).
Citation:
King County. 2013. Vashon-Maury Island Water Resources – A Retrospective of Contributions & Highlights. Prepared by King County Department of Natural Resources and Parks, Water and Land Resources Division, Science and Technical Support Section. Seattle, Washington. December.
Front page photo credit: L. Larkin


Vashon-Maury Island Water Resources – A Retrospective of Contributions & Highlights
King County Science and Technical Support Section i December 2013
Table of Contents
List of Figures ...................................................................................................................................................................... iii
List of Tables ........................................................................................................................................................................ v
List of Appendices .............................................................................................................................................................. v
Index of Abbreviations & Acronyms ............................................................................................................................. vi
Executive Summary ..................................................................................................................................................... ES-1
1.0. Introduction ......................................................................................................................................................... 1
1.1 Overview and Purpose of this Report ............................................................................................ 1
1.2 General Setting ..................................................................................................................................... 2
1.2.1 Geography ................................................................................................................................ 2
1.2.2 Topography .............................................................................................................................. 3
1.2.3 Geology ..................................................................................................................................... 3
1.2.4 Land Use and Cover .............................................................................................................. 3
1.3 Legal Setting .......................................................................................................................................... 3
1.3.1 State Regulatory Framework ............................................................................................... 3
1.3.2 Local Regulatory Framework ............................................................................................... 4
2.0. Technical Activities and Reports ..................................................................................................................... 5
2.1 Carr Report: Water Resources Study ............................................................................................ 5
2.2 Ground Water Management Plan : Area Characterization ....................................................... 7
2.3 King County Groundwater Protection Program ......................................................................... 9
2.3.1 Ambient Groundwater Monitoring Study ........................................................................ 9
2.3.2 Watershed Plan ..................................................................................................................... 10
2.3.3 Water Resources Evaluation ............................................................................................. 10
2.4 Quartermaster Harbor Nitrogen Management Study .............................................................. 21
2.4.1 Sustainability Indicator Development and Monitoring ................................................. 25
3.0. Island-Wide Climate Conditions ................................................................................................................... 26
3.1 Air Temperature ................................................................................................................................ 27
3.2 Precipitation ........................................................................................................................................ 29
3.3 Stream Flows ...................................................................................................................................... 36

Vashon-Maury Island Water Resources – A Retrospective of Contributions & Highlights
King County Science and Technical Support Section ii December 2013
Table of Contents (CONTINUED)
4.0. Island-Wide Water Resources ...................................................................................................................... 41
4.1 Water Resources Usage .................................................................................................................. 41
4.2 Groundwater Quantity Monitoring ............................................................................................... 45
4.2.1 Aquifer Zones ........................................................................................................................ 45
4.2.2 Groundwater Level Responses and Trends ................................................................... 47
4.2.3 Groundwater Contour Maps ............................................................................................. 49
4.3 Island – Wide Hydrologic Water Budget .................................................................................... 54
4.4 Water Quality on Vashon-Maury Island ....................................................................................... 57
4.4.1 Marine Water Quality in Quartermaster Harbor ........................................................ 58
4.4.2 Freshwater Surface Water Quality .................................................................................. 60
4.4.3 Vashon-Maury Island‘s Groundwater Quality................................................................ 73
5.0. Summary of Scientific Findings ....................................................................................................................... 84
5.1 Findings for Climatic Conditions .................................................................................................... 84
5.2 Findings of the Island-wide Hydrologic Budget .......................................................................... 85
5.3 Findings for Island-Wide Water Resources ................................................................................ 85
5.3.1 Water Usage .......................................................................................................................... 85
5.3.2 Groundwater Quantity ....................................................................................................... 86
5.3.3 Marine Water Quality ......................................................................................................... 87
5.3.4 Freshwater Surface Water Quality .................................................................................. 87
5.3.5 Groundwater Quality .......................................................................................................... 88
6.0. Moving Forward ................................................................................................................................................ 89
6.1 Future Sustainability Monitoring .................................................................................................... 89
6.2 Key Challenges ................................................................................................................................... 89
6.2.1 Continuing to Engage and Educate Islanders ................................................................. 89
6.2.2 Implications of the Earth Justice Challenge .................................................................... 90
6.2.3 Adapting to a Changing Climate ....................................................................................... 90
6.2.4 Uncertainties Affecting Water Resources ...................................................................... 91
7.0. References .......................................................................................................................................................... 93

Vashon-Maury Island Water Resources – A Retrospective of Contributions & Highlights
King County Science and Technical Support Section iii December 2013
Figures
Figure 1. Map of Vashon-Maury Island. ................................................................................................................... 2
Figure 2. Precipitation and Surface Water Locations. ....................................................................................... 13
Figure 3. Groundwater Related Activities – Water Quality & Quantity Monitoring Locations. ............ 15
Figure 4. Drainage Area to Quartermaster Harbor. ......................................................................................... 22
Figure 5. Daily Air Temperature Averages and Extremes on Vashon Island. .............................................. 27
Figure 6. Daily Mean Air Temperatures at West Judd Creek Rain Gage 28Y located at the Vashon
Island Closed Landfill (June 2007 through August 2013). ................................................................ 27
Figure 7. Linear Trends in Temperature in the Pacific Northwest. ............................................................... 28
Figure 8. Temperatures at Seattle-Tacoma International Airport Weather Station.................................. 29
Figure 9. Upper Ocean Heat Content Anomaly. ................................................................................................ 29
Figure 10. Location and Duration of Precipitation Data Collection. ............................................................... 30
Figure 11. Annual Rainfall Contours for Water Year 1982. ............................................................................... 31
Figure 12. Precipitation Zones for 1961-1990 by USDA. ................................................................................... 32
Figure 13. Puget Sound Precipitation Zones for 2000‘s by NOAA. ................................................................. 32
Figure 14. Cumulative Daily Precipitation at Vashon-Maury Island Stations per Water Year. .................. 34
Figure 15. Precipitation Totals Map of Vashon-Maury Island for Water Year 2007. ................................... 35
Figure 16. Precipitation Averages Map of Vashon-Maury Island for Water Years 2005-2011. ................. 35
Figure 17. Location of Stream Gage Data Collection Locations on Vashon-Maury Island. ........................ 36
Figure 18. Locations of Exempt Wells and Public Water Systems (2012). ..................................................... 42
Figure 19. Average Daily Usage Per Month of Permit Exempt Wells on Vashon-Maury Island. ............... 43
Figure 20. Example of Summer Water Use Peaking Factors by User Type. .................................................. 44
Figure 21. Estimated Total Island-wide Water Consumption for Group A & B Public Water Systems,
Individuals and Irrigators. ........................................................................................................................ 44
Figure 22. WRE Aquifer Zones in Geologic Cross Section A2-A2‘ on Southern End of Vashon Island. 46
Figure 23. Groundwater Levels on Vashon-Maury Island from 2000 through 2012. ................................... 48
Figure 24. Depth to Water at Self Monitored Well GWL_w-09 in WRE Zone 2. ...................................... 48
Figure 25. Depth to Water at Self Monitored Well GWL_w-06/GrpA_55376_01in WRE Zone 1. ...... 49
Figure 26. Groundwater Level Changes during 2001 through 2010. ............................................................... 50

Vashon-Maury Island Water Resources – A Retrospective of Contributions & Highlights
King County Science and Technical Support Section iv December 2013
Figures (continued)
Figure 27. Water Table Elevation Map of the Carr Report‘s Principal Aquifer for 1982. .......................... 51
Figure 28. Water Table Elevation Map of GWMP Zone 1 for 1991. ............................................................... 51
Figure 29. WRE Phase 1 Model Water Level Contour Input for Qva. ........................................................... 52
Figure 30. WRE Phase 1 Model Water Level Contour Output for Qva. ....................................................... 52
Figure 31. Water Table Elevation Map of Qva aquifer for 2006. ...................................................................... 53
Figure 32. Water Balance Flow Details of WRE-Phase 1 Modeling Results. .................................................. 56
Figure 33. Percent of Variables for Water Budgets of Vashon-Maury Island. ................................................ 57
Figure 34. Sampling locations within Quartermaster Harbor for Fecal Coliform Bacteria (A) and
Dissolved Oxygen (B) for 2010. ............................................................................................................ 58
Figure 35. Fecal Coliform Bacteria Shown as Geometric Mean for Stations within Quartermaster
Harbor. ........................................................................................................................................................ 59
Figure 36. Dissolved Oxygen in Quartermaster Harbor. ................................................................................... 60
Figure 37. Fisher Creek Water Quality Graphs for 2006 through 2012. ....................................................... 62
Figure 38. Judd Creek Water Quality Graphs for 2006 through 2012. .......................................................... 63
Figure 39. Mileta Creek Water Quality Graphs for 2006 through 2012. ....................................................... 64
Figure 40. Water Quality Index Scores for the Island Creeks by Water Year. ............................................ 65
Figure 41. Nitrate + Nitrite Flux entering Puget Sound from Thirteen Largest Rivers. ............................. 67
Figure 42. Nitrate + Nitrite Concentrations for Selected Vashon-Maury Island Creeks. .......................... 68
Figure 43. Range of Nitrate + Nitrite Nitrogen at Sampling Locations for the Nearshore Freshwater
Inputs Assessment Study in 2010. ......................................................................................................... 68
Figure 44. Monthly Nitrate + Nitrite Nitrogen from Routine Monthly Samples from Fisher, Judd and
Mileta Creeks. ............................................................................................................................................ 69
Figure 45. Locations of Nitrate + Nitrite Nitrogen Concentrations Measured during the Mileta Creek
Nitrogen Source Tracking Study in 2010. ........................................................................................... 70
Figure 46. Seven-Day Average of the Daily Maximum Stream Temperatures for Judd and Fisher
Creeks. ......................................................................................................................................................... 71
Figure 47. Benthic Index of Biologic Integrity Sampling Locations on Vashon-Maury Island in 2010. ...... 72
Figure 48. Maximum Arsenic Concentrations (µg/L) in Groundwater Samples (1990 to 2010). ............. 75
Figure 49. Maximum Arsenic Levels in Groundwater at Sampling Wells between 1990 and 2010. ........ 75
Figure 50. Maximum Chloride Levels in Groundwater Wells (1990 to 2010). ............................................. 77

Vashon-Maury Island Water Resources – A Retrospective of Contributions & Highlights
King County Science and Technical Support Section v December 2013
Figures (continued)
Figure 51. Maximum Chloride Levels in Groundwater at Sampling Wells between 1990 and 2010. ...... 78
Figure 52. Maximum Nitrate Levels in Groundwater Wells (1990 - 2010). .................................................. 79
Figure 53. Nitrate from Shallow and Deep Aquifer Public Water System Groundwater Samples (1990 –
2013). ........................................................................................................................................................... 80
Figure 54. Response of Nitrate in Groundwater in a Shallow Well (W-16A) to Excessive Manure
Application. ................................................................................................................................................. 81
Figure 55. Response of Nitrate in Groundwater in Shallow Wells to Septic System Failure. ................... 81
Figure 56. Response of Nitrate in Groundwater in Shallow Wells to Upland Land Clearing and
Agricultural Activities. .............................................................................................................................. 82
Tables
Table 1. Water Resources Evaluation Activities Summary. ............................................................................ 12
Table 2. Groundwater Well Details for WRE and Ongoing Work .............................................................. 16
Table 3. Sustainability Indicators for Vashon-Maury Island. ............................................................................ 25
Table 4. Total Rainfall. .............................................................................................................................................. 33
Table 5. Annual Mean Flows for Selected Vashon-Maury Island Creeks. .................................................... 37
Table 6. Definitions of Hydrologic Indicator Components and Metrics. ..................................................... 38
Table 7. Hydrologic Flow Indicators for Selected Vashon-Maury Island Creeks....................................... 39
Table 8. Total Annual and Summer Month Baseflows for Selected Vashon-Maury Island Creeks. ...... 40
Table 9. Water Budget Estimates for Vashon-Maury Island. .......................................................................... 55
Table 10. Dissolved Oxygen in Quartermaster Harbor. ................................................................................... 59
Table 11. Water Quality Index Scores for Selected Vashon-Maury Island Streams. .................................. 65
Table 12. Geometric mean Fecal Coliform concentrations (cfu/100 mL) for Selected Vashon-Maury Island Creeks. ............................................................................................................................................. 66
Table 13. Benthic Index of Biologic Integrity Ranking and Scores for Selected the Island Creeks. ........ 73
Table 14. Arsenic Speciation Details at Groundwater Sampling Wells. ......................................................... 76
Appendices
Appendix A -VMI Sustainability Indicators ............................................................................................................ A-1

Vashon-Maury Island Water Resources – A Retrospective of Contributions & Highlights
King County Science and Technical Support Section vi December 2013
Index of AbBREVIATIONS &
ACRONYMS
~ Approximate
% percent
° degrees
7DADMax Seven-day Average of the Daily Maximum
µg/L micrograms per liter
µmhos/cm micromhos per centimeters per centimeter
Ambient Study Ambient Groundwater Monitoring Report
AFY acre feet per year
bgs below ground surface
BIBI or B-IBI Benthic Index of Biological Integrity
C Centigrade
Carr Report Vashon-Maury Island Water Resources Study
cfu/100ml colony forming units per 100 milliliters of sample
DOH Washington State Department of Health
DNRP Department of Natural Resources and Parks
Ecology Washington State Department of Ecology
EPA Environmental Protection Agency
F Fahrenheit
gpd gallons per day
gpm gallons per minute
GeoMapNW University of Washington Pacific Northwest Center for Geologic Mapping
Studies (formerly known as University of Washington Seattle-Area Mapping
Project)
GMA Growth Management Act
GWMA Groundwater Management Area
GWMC Vashon-Maury Island Groundwater Management Committee
GWMP Vashon-Maury Island Ground Water Management Plan
―the GWP Committee‖ Vashon-Maury Island Groundwater Protection Committee
―the Island‖ Vashon-Maury Island
kg/d kilograms per day
KC King County

Vashon-Maury Island Water Resources – A Retrospective of Contributions & Highlights
King County Science and Technical Support Section vii December 2013
Index of ABbREVIATIONS &
ACRONYMS (continued) LiDAR Light Detecting and Ranging
mg/L milligrams per liter
ml milliliters
mid middle
MCL maximum contaminant level
MSL mean sea level
MGY million gallons per year
NCDC COOP National Climate Data Center Cooperative Observer Program
NOAA National Oceanic & Atmospheric Administration
NS not sampled
OSS onsite septic system
Planning Department Department of Planning and Community Development
Public Health Seattle-KC Department of Public Health, Environmental Health Division
PWS public water system
R-B Index Richards - Baker Index
RCW Revised Code of Washington
QAc Pre-Vashon deposits upper coarse grained
QBc Pre-Vashon deposits lower coarse grained
Qdbt Double Bluff till
Qpdc Possession Drift, coarse grained deposits
Qpf Pre-Fraser deposits, undifferentiated
Qpfc coarse grained deposits
Qpff Pre-Fraser glaciation age, fine grained deposits
Qpoc Pre-Olympia deposits, coarse-grained deposits
Qpof Pre-Olympia deposits, fine-grained deposits
Qos Owen silt
Qva Vashon advance outwash deposits
Qvr Vashon recessional outwash deposits
Qvrl Vashon recessional lacustrine deposits
Qvt Vashon till
Sea-Tac Seattle-Tacoma International Airport
Sp. Conductivity specific conductivity
TSS total suspended solids

Vashon-Maury Island Water Resources – A Retrospective of Contributions & Highlights
King County Science and Technical Support Section viii December 2013
Index of ABbREVIATIONS &
ACRONYMS (continued) µg/L micrograms per liter
µmhos/cm micromhos per centimeters per centimeter
UNK unknown
U.S. United States
USDA United States Department of Agriculture
USEPA United States Environmental Protection Agency
UW University of Washington
UWT University of Washington-Tacoma
vs. versus
VMI Vashon-Maury Island
Watershed Plan Vashon-Maury Island Watershed Plan
Work Plan WRE Work Plan
WA Washington State
WAC Washington Administrative Code
WLRD Water & Land Resources Division
WQI water quality index
WRE Vashon-Maury Island Water Resource Evaluation
WRIA Water Resource Inventory Area
WY water year

Vashon-Maury Island Water Resources – A Retrospective of Contributions & Highlights
King County Science and Technical Support Section ES-1 December 2013
EXECUTIVE
SUMMARY
The King County Water and Land Resource
Division has been monitoring precipitation,
stream flow and groundwater on Vashon-Maury
Island (the ―Island‖) for a number of years in an
effort to better understand the water balance and
resources on the Island. This report summarizes
monitoring results and activities since the 1980‘s.
In addition, a section is dedicated to summarizing
key challenges in moving forward with maintaining
the water resources on the Island.
Contributions to
Climate Science
All drinking water sources on Vashon-Maury
Island (springs, surface water and groundwater)
are supplied by precipitation on the Island.
Geographical variability of climate conditions have
been recorded since the 1980‘s and mapped
across the Island. A difference of about 15 inches
was measured in total precipitation from east to
the west across the Island. In addition, the Island
receives about 4 percent less than to 15 percent
more than the precipitation observed at the
Seattle-Tacoma International Airport. This
difference occurs only about 4.5 miles southwest
of the airport.
Recent analysis of historical data across the Pacific
Northwest region indicates that local persistent
changes in the climate are likely to have been and
continue to be impacted by global warming. A
warming trend has been reported in both local
and regional data. The likely impacts of this trend
on future water resources may include increased
stream and water body temperatures, lower
summer flows, and increased water resource
consumption rates.
Expanding Knowledge
of Island-Wide Surface
WATER RESOURCES
The impacts of development, landowner practices
in areas close to water resources and pollutants
are the dominant drivers determining the health
and quantity of water resources on Vashon-Maury
Island. Less forest cover and increases in
impervious surfaces result in higher stream
temperatures and more urban runoff. Failing
septic systems, pet wastes and bird droppings can
be washed into streams resulting in decreased
water quality that affects human and aquatic life
uses of the stream.
Much work has been completed to characterize
and evaluate the quantity and quality of surface
water resources on Vashon-Maury Island, such as,
measuring stream bug populations, stream
discharge rates, temperature, pH, fecal coliform
bacteria, dissolved oxygen, turbidity, total
suspended solids, and nutrients in streams and
marine waters.
Overall conditions appear to be improving as
measured by the stream water quality index. This
index compares monthly temperature, pH, fecal
coliform bacteria, dissolved oxygen, turbidity,
total suspended solids, and nutrients (phosphorus

Vashon-Maury Island Water Resources – A Retrospective of Contributions & Highlights
King County Science and Technical Support Section ES-2 December 2013
and nitrogen) relative to state standards and
guidelines. Stream temperatures on various Island
creeks typically meet the Washington State
criteria for good water quality status.
The health of the benthic bug population in
streams on Vashon-Maury Island has been
reported as having some slight variability with
some sampling locations improving and some
sampling locations worsening.
Stream nitrate concentrations seem to be fairly
typical of rural lowland streams in the Puget
Sound area; highest concentrations during winter
when plant uptake is lowest and rain flushes
nitrate from surface soils and lowest during
summer when plant uptake is greatest and soils
are generally dry and accumulating nitrate.
Monitoring of annual surface water quantity
metrics, such as frequency and duration of high
flow pulses, stream flashiness, and magnitude of
low flows during a water year, indicate responses
are as expected with increases during wet years
and decreases during dry years.
Dissolved oxygen levels below the Washington
State water quality standard (extraordinary
criteria of 7 milligrams per liter (mg/L)) have been
observed in Quartermaster Harbor over the last
seven years. Ongoing sampling continues to
record extremely low values of dissolved oxygen
in the Quartermaster Harbor. For fecal coliform
bacteria data collected since 2006, all marine
water sampled met state water quality criteria. In
addition, there also were no exceedances of the
criteria by marine water quality samples collected
by Washington Department of Health along
Quartermaster Harbor. However, fecal coliform
bacteria levels in Judd, Fisher, Mileta and
Christensen Creeks had exceedances of the state
extraordinary criteria for at least one year.
GROUNDWATER - The
Hidden resource
Groundwater is the portion of precipitation that
soaks into the ground and gets stored in below
ground surface geologic water systems called
aquifers. Every groundwater system is unique and
dependent upon the types of geologic materials,
rate of precipitation, interactions of groundwater
with the streams and other water bodies, the rate
of evapotranspiration and in the case of the Island,
interactions with the surrounding open waters of
Puget Sound. Groundwater characterizations
conducted by various technical studies on
Vashon-Maury Island identified water bearing
zones using differing definitions. The most
commonly studied geologic water bearing zones
were the Vashon recessional and advance
outwash deposits and deeper coarse grained
units.
Vashon-Maury Island Water Resources – A Retrospective of Contributions & Highlights
King County Science and Technical Support Section ES-3 December 2013
Several reports indicated that water table contour
maps of water bearing zones showed similar
groundwater flow patterns and directions and
that the patterns are consistent with our basic
understanding of unconfined groundwater
hydrology, where water level contours reflect
overlying topography. Groundwater levels in
wells show responses to seasonal and long-term
recharge variations, tidal and barometric
influences and pumping. Water level fluctuations
tended to correlate with rainfall (with lags of time
up to four months), with seasonal highs in during
summer months and lows during fall months.
Overall, data from 2001 through 2012 indicated
that levels were generally stable with no
significant declines.
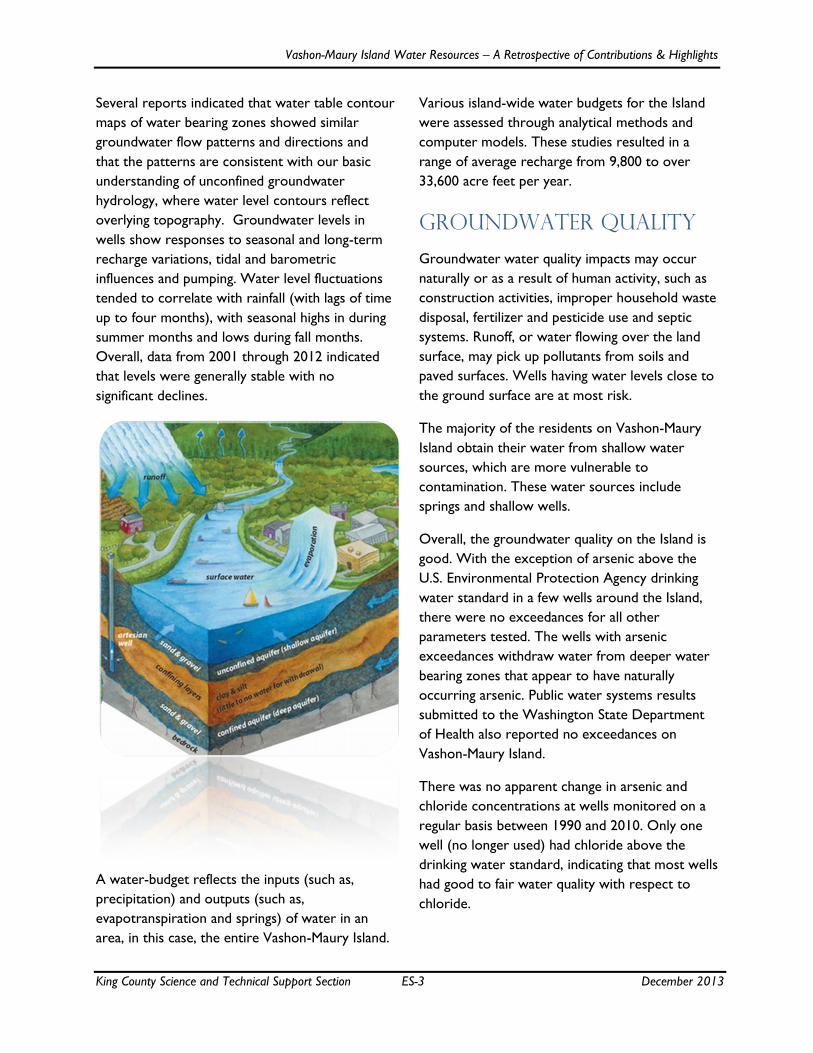
A water-budget reflects the inputs (such as,
precipitation) and outputs (such as,
evapotranspiration and springs) of water in an
area, in this case, the entire Vashon-Maury Island.
Various island-wide water budgets for the Island
were assessed through analytical methods and
computer models. These studies resulted in a
range of average recharge from 9,800 to over
33,600 acre feet per year.
GROUNDWATER QUALITY
Groundwater water quality impacts may occur
naturally or as a result of human activity, such as
construction activities, improper household waste
disposal, fertilizer and pesticide use and septic
systems. Runoff, or water flowing over the land
surface, may pick up pollutants from soils and
paved surfaces. Wells having water levels close to
the ground surface are at most risk.
The majority of the residents on Vashon-Maury
Island obtain their water from shallow water
sources, which are more vulnerable to
contamination. These water sources include
springs and shallow wells.
Overall, the groundwater quality on the Island is
good. With the exception of arsenic above the
U.S. Environmental Protection Agency drinking
water standard in a few wells around the Island,
there were no exceedances for all other
parameters tested. The wells with arsenic
exceedances withdraw water from deeper water
bearing zones that appear to have naturally
occurring arsenic. Public water systems results
submitted to the Washington State Department
of Health also reported no exceedances on
Vashon-Maury Island.
There was no apparent change in arsenic and
chloride concentrations at wells monitored on a
regular basis between 1990 and 2010. Only one
well (no longer used) had chloride above the
drinking water standard, indicating that most wells
had good to fair water quality with respect to
chloride.

Vashon-Maury Island Water Resources – A Retrospective of Contributions & Highlights
King County Science and Technical Support Section ES-4 December 2013
Recent monitoring shows maximum nitrate as
nitrogen levels in most wells below 5 mg/L
(USEPA drinking water standard for nitrate is
10mg/L)). Median nitrate levels in shallow public
water system wells were typically higher than
those in deep public water system wells. These
results support the general principle that
susceptibility to impacts is greater in shallow
groundwater systems than in the deeper
groundwater systems.
Water Resources
CONSUMPTION
The major use of water on
Vashon-Maury Island is for
municipal and domestic
purposes; lesser uses are for
agricultural and commercial
purposes. Based on a set group
of volunteer permit exempt well owners, the
measured average consumption of water was
between about 100 and 120 gallons per user per
day. Public water systems were reported as
having an average daily use of about 100 to 200
gallons per day. Although Islanders have varying
patterns of usage, it is common for increases in
usage to occur during June through October.
The ten year average (2001 through 2010) of total
island-wide water consumption is 515 million
gallons per year with consumption increasing
during periods of lower rainfall totals and
decreasing during periods of higher rainfall totals.
With projections of population growth on
Vashon-Maury Island at about 100 people per
year (1 percent of the population) and a modeled
potential future water demand of about 10
percent of all population-related water use,
lowering of water levels near larger public water
system wells may occur in the future.
Education, Outreach
and engaging
Stakeholders
A variety of activities involving the public and
stakeholders, have occurred on Vashon-Maury
Island in the past, such as the Salmon Watchers
and the Groundwater Well Self-Monitoring
Programs. In addition, the Vashon-Maury Island
Groundwater Protection Committee and King
County hold public and policy meetings on a
regular basis. The residents and stakeholders have
become knowledgeable about their water
resources and the impacts that may reduce the
availability for future use on the Island.
Most recently, informational newsletters were
prepared under contract by the Vashon-Maury
Island Groundwater Protection Committee and
shared with the public to encourage Islanders to
learn more about many related issues to water
resources on the Island. While the response from
these efforts was welcoming, the amount of
participation in the Salmon Watchers and the
Groundwater Well Self-Monitoring Programs has
declined.
Vashon-Maury Island Water Resources – A Retrospective of Contributions & Highlights
King County Science and Technical Support Section ES-5 December 2013
Key challenges
The ending of capital funding in recent years for
the County‘s Groundwater Protection Program
reduced the budget by about $200,000 per year
for water resources related monitoring and
outreach activities on the Island. While a variety
of activities such as engaging stakeholders,
publishing educational newsletters, managing
volunteer well owners and salmon watchers, and
holding public meetings have occurred on the
Island, volunteerism for the Salmon Watcher
program and Groundwater Well Self-Monitoring
Program has declined. Reduced financial
resources may have had a negative impact on
volunteerism. Water resources data that may
help with understanding the impacts on where
water is available and where water is impacted
are not being collected.
As a result of Earth Justice‘s recent legal challenge
concerning permit exempt well management in
closed stream basins there may be implications
for quantifying water availability and for tracking
water rights more closely.
The King County Vashon-Maury Island
Watershed Plan posed that climate change could
impact the Island in several ways, such as
seawater intrusion, increased water usage, and/or
reduced recharge. Recharge to the groundwater
system of the Island will be affected by changes to
precipitation patterns. Less total annual rainfall
would lead to less groundwater recharge while
increased rainfall may lead to more surface water
discharge than groundwater recharge Any
assessment of future water demands for the
Island should include some consideration of
potential climate change impacts and leave a
margin of safety to help address the uncertainty
that remains. Continuing to collect or analyze
available scientific indicator data related to these
impacts will assist in planning for adaptations to
these changing environmental conditions and to
reduce the impact of worsening conditions.
Although in the 1990s, several public water
systems were experiencing shortages, since then,
these water purveyors have been able to meet
demand through increased conservation methods
and improving infrastructure issues causing
leakage. Changing climate conditions and aging
infrastructure may have an impact on the water
availability in the future. In 2007, Water District
19 reported that although the water rights are
sufficient to meet the current and anticipated
needs of the users, Water District 19 did not
have enough source capacity to meet WA DOH
recommendations during summertime peak usage.
In part due to conservation by customers and a
new well, the 15 year moratorium on new water
shares for Water District 19 was lifted.
There is no current requirement for recording
the volume of water pumped at exempt wells, nor
for enforcing allowable amounts. As a result, it is
unknown exactly how much water is consumed
and used on the Island from these types of wells.
In summary, the key challenges for water
resources on Vashon-Maury Island are in part a
lack of volunteerism, funding source constraints,
potential changes in the regulatory requirements
for quantifying water availability and for tracking
Vashon-Maury Island Water Resources – A Retrospective of Contributions & Highlights
King County Science and Technical Support Section ES-6 December 2013
water rights, addressing impacts of climate change
and increasing demand as a result of population
growth. These are all challenges to managing
water resources to ensure that water resources
on the Island are sustainable for future demands.
Moving Forward
As part of the Sustainability Monitoring program,
groundwater water quality sampling is ongoing,
including sampling of arsenic, chloride, and
nitrate+nitrite nitrogen at long-term monitoring
locations. Coordination of water quality sampling
activities and policy related work by the Vashon-
Maury Island Groundwater Protection Committee
with King County, state agencies and stakeholders
will ensure that water resources on the Island are
sustained long-term.

Vashon-Maury Island Water Resources – A Retrospective of Contributions & Highlights
King County Science and Technical Support Section 1 December 2013
1.0. INTRODUCTION
1.1 Overview and Purpose of this Report
All drinking water sources (springs, surface water, and groundwater) on Vashon-Maury Island (hereafter
referred to as the ―Island‖ or ―VMI‖), King County are recharged by precipitation. Precipitation
infiltrates through the soil and underlying sediment and is stored in water bearing zones of sediment or
rock layers called aquifers. Every groundwater system is unique and dependent upon factors such as the
rate of precipitation or evapotranspiration and the interaction of groundwater with the streams and
other surface water bodies. These factors all contribute to the overall water budget. Understanding the
water balance on the Island and the changes that occur in response to human activities and climate
changes is important in evaluating the amount of water that can be pumped from the Island‘s aquifers on
a sustained basis.
In addition to the importance of managing and quantifying water quantity on the Island, monitoring and
protecting the water quality of the surface water and groundwater is key for maintaining healthy
ecosystems and sustainable water sources. Adequate protection of groundwater includes protecting
surface water supplies and protecting both from potential sources for water quality impairment, such as
household and land management practices, urban runoff, landfill and wastewater treatment facilities,
failing and functional septic systems and in some areas, seawater intrusion.
Several distinct data collection efforts were completed or are currently ongoing to monitor the Island‘s
water resources. These efforts include:
Carr Report: Water Resources Study - 1983
Ground Water Management Plan - 1998
KC DNRP Groundwater Protection Program - 2001 to present
Ambient Groundwater Monitoring Study – 2001 to 2004
Watershed Plan - 2005
Water Resources Evaluation – 2004 to 2010
Sustainability Indicator Development and Monitoring – 2011 to present
Quartermaster Harbor Nitrogen Management Study – 2009 to 2012
A long-term plan to monitor and evaluate the different components of water resources was
implemented to address needs and concerns identified by the residents of the Island and the staff of King
County Department of Natural Resources & Parks and the Water & Land Resources Division (KC
DNRP and KC WLRD). Much interest has been expressed over the years in the sustainability of the
water supply on the Island.
Since about 2000, groundwater, surface water, and precipitation data have been collected more
regularly and across a larger area on the Island than has before. Recent monitoring efforts were
designed to serve three purposes; (1) to identify spatial and temporal changes and any trends in
groundwater and surface water quantity and quality, (2) to provide necessary data for model
development and calibration, and (3) to serve as an early warning system of the impacts of pollution
sources and groundwater extraction. Recent and ongoing monitoring has and is being conducted by a
combination of KC WLRD staff and Island resident volunteers.

Vashon-Maury Island Water Resources – A Retrospective of Contributions & Highlights
King County Science and Technical Support Section 2 December 2013
This document provides a compendium of water resources information in one place. In addition, it
serves as a retrospective of contributions and highlights of the water resources studies and documents
related to the Island. Included is an overview of the data collected from these reports as related to
water resources and the various programs ongoing on the Island. Significant findings of spatial and
temporal trends are highlighted. In conclusion, this report posits issues to consider when moving
forward with future water resources management on the Island.
1.2 General Setting
1.2.1 Geography
The areal extent of the Island is about 36 square miles. The Island lies in Central Puget Sound within the
boundaries of King County. According to delineations developed by Washington State Department of
Ecology (Ecology), the Island lies within the boundary of Water Resource Inventory Area (WRIA) 15,
known as the Kitsap Peninsula and Islands Watershed (Figure 1). The Island is included in WRIA 15 for
the purposes of water quantity planning and is included in WRIA 9 for nearshore habitat planning.
Figure 1. Map of Vashon-Maury Island.
Figure modified
from KC, 2005c.
Legend
Geologic cross
section transect AA’
A2’
A2
Colvos
Passage
Quartermaster
Harbor
Judd
Creek
East
Vashon
West
Vashon
Maury
Island
Needle
Creek
WRIA Boundary
Basin Boundary
Roads
Lake/Puget Sound
Wetland
Park
East
Passage

Vashon-Maury Island Water Resources – A Retrospective of Contributions & Highlights
King County Science and Technical Support Section 3 December 2013
Vashon and Maury Islands are linked by a narrow isthmus and are not, therefore, truly independent
islands (Figure 1). The Island is bordered on the west by Colvos Passage from the Kitsap Peninsula, on
the south by Dalco Passage from Tacoma, on the east by Puget Sound and King County, and on the
north by Puget Sound. Vashon Island is about 13 miles long (south to north) and four miles across (west
to east) in the widest areas. Maury Island is about five miles long (southwest to northeast) and about
one mile across (northwest to southeast).
1.2.2 Topography
The topography of the Island varies from sea level to elevations in excess of 460 feet above mean sea
level (MSL) based on U.S. Geological Survey topographic maps (KC, 2005c). New LiDAR (Light
Detecting and Ranging) data has improved the accuracy of the surface topography data. The maximum
elevation was shown at over 500 feet above MSL at Maury Island Marine Park. The shoreline extent of
the Island is just over 58 miles, most of which lies beneath steep, slide-prone slopes (KC, 2005c).
Numerous stream basins drain into Puget Sound.
1.2.3 Geology
Geologic field mapping studies began as early as 1898 on the Island. A publication by the U.S. Geological
Survey in1991 showed a wide variety of deposits reflecting the glacial and non-glacial history (Booth,
1991). The understanding of the geology has since been updated with a new geologic map in 2004.
GeoMap NW, formerly known as University of Washington Seattle-Area Mapping Project, completed a
detailed analysis of field data and data compiled from well logs for King County (KC, 2005c). The Island
is composed of glacially derived sediments deposited during several glacial episodes. The predominant
geological unit is glacial till. The glacial till and other till-like units on the Island cover approximately 68
percent of the land and is a significant contributor to the Island‘s topography. The remaining 32 percent
of the Island cover is made of glacial outwash and alluvial deposits (KC, 2005c).
1.2.4 Land Use and Cover
As per the Vashon-Maury Island Watershed Plan (KC, 2005c), all of the Island is designated as rural and
as such is outside the urban growth boundary. Low-density residential development covers much of the
Island with zoning of one home per five and ten acres. Higher density residential areas are concentrated
in the Vashon Town Center, Vashon Heights, Burton, Dockton, and along parts of the shoreline.
Multifamily, commercial and industrial uses are presently concentrated in the unincorporated town of
Vashon and adjacent areas where wastewater conveyance to a centralized treatment plan (with
discharge to East Passage in Puget Sound) and other urban services are available (KC, 2005c).
The predominant land cover for the Island is forested land. Forested land covers about 73 percent.
Non-forest and developed land have percentages of 16 and 11 percent, respectively (KC, 2005c).
1.3 Legal Setting
1.3.1 State Regulatory Framework
The Washington State (WA) Growth Management Act (GMA) Revised Code of Washington (RCW)
36.70A states the legislature found ―that uncoordinated and unplanned growth, together with a lack of

Vashon-Maury Island Water Resources – A Retrospective of Contributions & Highlights
King County Science and Technical Support Section 4 December 2013
common goals expressing the public's interest in the conservation and the wise use of our lands, pose a
threat to the environment, sustainable economic development, and the health, safety, and high quality of
life enjoyed by residents of this state.‖ In RCW Section 36.70A.070 (1) it states that comprehensive
plans ―shall provide for protection of the quality and quantity of groundwater used for public water
supplies.‖ The GMA also provides direction to counties regarding the rural element, lands that are not
designated for urban growth, agriculture, forest, or mineral resources. In RCW Section 36.70A.070 (5)
the GMA states that the ―rural element of shall include measures that apply to rural development and
protect the rural character of the area, as established by King County,‖ by ―Protecting critical areas, as
provided in RCW 36.70A.060, and surface water and groundwater resources.‖
The purpose of WA Chapter 90.44 RCW is to regulate and control groundwaters of the state of
Washington and is ―supplemental to chapter 90.03 RCW, which regulates the surface waters of the
state, and is enacted for the purpose of extending the application of such surface water statutes to the
appropriation and beneficial use of groundwaters within the state.‖ In addition, RCW Section 90.44.430
provides that local government shall be guided by adopted groundwater management plans. From RCW
90.44.430 and Washington Administrative Code (WAC) 173-100 the Vashon-Maury Island Ground
Water Management Plan (GWMP) (VMI GWMCa & VMI GWMCb, 1998) was designed as a monitoring
program for collection of precipitation, surface water, sediment, shellfish, springs and groundwater data
to further the understanding of the Island‘s water resources.
1.3.2 Local Regulatory Framework
The local Seattle-KC Department of Public Health, Environmental Health Division (Public Health)
provided oversight for the development of the GWMP. The King County Groundwater Protection
Program projects on the Island were developed by King County in association with the VMI
Groundwater Protection Committee. King County works in conjunction with this committee to
implement the recommendations of the GWMP and address current local groundwater issues. This
committee was formed in late 2001 and has continued to meet since that time. Membership represents
diverse stakeholders, water purveyors, sewer and water utilities and associations, residential well users,
chamber of commerce, environmental organizations, tribal nation, commercial agriculturists, business
owners, and unincorporated areas.
The VMI Watershed Plan (KC, 2005c) defined preferred water resource management strategies for the
Island, identified septic systems as a potential source of contamination to water quality and provided
multiple recommendations to reduce the risks of nitrate contamination from septic systems.
In accordance with RCW 70.118A, Seattle & King County - Public Health (Public Health) has evaluated
existing information concerning areas where shellfish harvest is threatened or restricted because of
contamination originating from septic systems. Based on the information, Public Health designated a
Marine Recovery Area on the Island in 2008. A Marine Recovery Area is a specific designation under
state law that establishes the goal of protecting, preserving and restoring shellfish harvest opportunities
by assuring that property owners within the Marine Recovery Area inspect, and repair or replace as
necessary, their septic system. In 2008, the ―King County On-Site Septic System Management Plan‖
(Public Health, 2007) called for enhanced Onsite Septic System (OSS) Operation and Maintenance for
the Island sensitive areas for the protection of groundwater quality. Integration with Public Health is
ongoing to manage these exempt well and OSS issues and to ensure that the on-site septic systems are
not impacting the water resources.

Vashon-Maury Island Water Resources – A Retrospective of Contributions & Highlights
King County Science and Technical Support Section 5 December 2013
2.0. TECHNICAL ACTIVITIES AND
REPORTS
The following is a list of the technical and management documents summarized in this section:
Carr Report: Water Resources Study - 1983
Ground Water Management Plan - 1998
KC DNRP Groundwater Protection Program – 2001 to present
Ambient Groundwater Monitoring Study – 2001 to 2004
Watershed Plan – 2005
Water Resources Evaluation – 2004 to 2010
Annual Data Reports – 2005 through 2010
Phase I Groundwater Model – 2005
Phase II Hydrologic Modeling: Technical Report – 2009
Sustainability Indicator Development and Monitoring – 2011 to present
Quartermaster Harbor Nitrogen Management Study – 2009 through 2012
Initial Assessment of Nutrient Loading to Quartermaster Harbor – 2010
Mileta Creek Nitrogen Source Tracking Study – 2012
Quartermaster Harbor Nearshore Freshwater Inflows Assessment – 2012
Quartermaster Harbor Benthic Flux Study – 2012
Results and trends described in these documents are incorporated in Sections 3.0 (Island-wide Climate
Conditions) and 4.0 (Island-wide Water Resources) and summarized in Section 5.0 (Summary of
Scientific Findings).
2.1 Carr Report: Water Resources Study
In the first island-wide assessment, the Vashon-Maury Island Water Resources Study (Carr Report)
(Carr/Assoc., 1983) monitored characteristics of the water resources such as precipitation, surface and
groundwater. This report was prepared for the KC Department of Planning and Community
Development (KC Planning Department) to generate information about the water resources of the
Island as a limit on population and land use.
Although there were limited available data and several assumptions made in the course of this study, a
major effort was put forward to address the following four topics:
Where does the Island‘s water supply originate? Where is it located and what is the water
quality?
How much water is available for human use on the Island?
What constraints does the water resource place on population density and land use?
What must be done to protect and enhance the water resource for future generations?
The Island‘s water supply source was reported as primarily from wells and springs. Two aquifers were
identified; (1) a ―Principal‖ aquifer generally located above sea level yielding moderate amounts of water
to wells and (2) a ―Deep‖ aquifer at depths of about 100-300 feet below sea level capable of yielding
larger quantities of water.

Vashon-Maury Island Water Resources – A Retrospective of Contributions & Highlights
King County Science and Technical Support Section 6 December 2013
The hydrologic system can be quantified using a water budget. This budget is a balance between the
inflow of water into the system, such as, precipitation, and the outflow of water from the system, such
as, evapotranspiration, runoff, baseflow (amount of groundwater seeping into a stream) and subsurface
outflow (to the Puget Sound). The Carr Report suggests this simplified equation:
Precipitation = Evapotranspiration + Runoff + Infiltration
where: Precipitation = rainfall or snow
Evapotranspiration = water evaporated by surface water, soils, and plants
Runoff = water in streams and overland flow
Infiltration = water infiltrating into soil and deeper aquifers
Recharge is defined as water infiltrating soil and replenishing the groundwater. Runoff was divided into
both direct runoff and infiltrated runoff (that which is captured by the aquifer through the stream).
Infiltration can be further applied to calculate the recharge to the steams and aquifers (and eventually
the Puget Sound). Runoff and infiltration together equal the water surplus in the budget, the amount
available as groundwater resources. Further discussion and details of the Carr Report budget are
presented in Section 4.3.
Recharge for the Principal aquifer was reported to be local precipitation with no off-island recharge. The
main area of recharge to the Principal aquifer was reported as along a north-south corridor of west-
central Vashon Island, whereas the major recharge area for the Deep aquifer as west-central Vashon
Island. Total rainfall in1982 varied across the Island from 53.5 inches on the west side of Vashon Island
to 35.5 inches on the east side of Maury Island. The Carr Report indicates that half the annual
precipitation evaporates and the other half either runs off or infiltrates through the soil.
Water level contour maps of the major aquifers, using data from 54 sites, show flow directions in the
Principal aquifer as generally to the east and west from the topographic high that extends along a north-
south axis on Vashon Island and from a high near each end of Maury Island towards Quartermaster
Harbor. Groundwater levels measured from 61 wells show responses to seasonal and long-term
recharge variations, tidal and barometric influences and pumping.
Selected water quality analysis was conducted at locations on six creeks and at 71 groundwater well
locations. The report presented several island-wide isochemical maps of groundwater water quality
parameters specific conductance, chloride, iron, and nitrate.
The Carr Report indicates that of the total groundwater recharge, about 578 million gallons per year
(MGY) could theoretically be recovered from the Principal aquifer when the factors of drought
conditions and recharge rate were taken into account. When taking into consideration water quality
conditions, stream flow requirements, and water use (at that time), the amount of groundwater available
from the Principal aquifer for future population growth was reported at about 98.5 MGY, allowing for
the addition of about 2,300 new residents to the existing population.
The Carr Report presents basic options for water resources management. In addition, the primary
recommendations to King County were to create or designate a specific agency with the responsibility
for managing the Islands' water resources, to integrate the findings into the Vashon Community Plan,
and produce a comprehensive water management plan, and to implement the water management plan as
soon as possible.
Vashon-Maury Island Water Resources – A Retrospective of Contributions & Highlights
King County Science and Technical Support Section 7 December 2013
Interim measures to protect the resources were:
Limit the Island‘s total population; adopt zoning to limit density; preserve high recharge potential
areas; refine codes to maintain and enhance recharge capability and water quality; and enact
building moratoria to reduce or stabilize groundwater degradation by septic systems in areas far
above recommended housing densities.
Monitor solid waste disposal; provide sewage collection, treatment and disposal off-island for all
high population density areas; exclude infiltration of treated sewage water to stormwater and
shallow groundwater; remove or regulate intense agricultural activities from recharge areas; and
review local codes and regulations on transportation, storage and disposal of potentially
hazardous wastes.
Continue collecting water resources data for verification and refinement of the findings.
Implement an outreach program for conservation and protection of the water resource.
2.2 Ground Water Management Plan : Area
Characterization
From Revised Code of Washington (RCW) 90.44.430 and Washington Administrative Code (WAC)
173-100 the Vashon-Maury Island Ground Water Management Plan (GWMP) (VMI GWMCa & VMI
GWMCb, 1998) was designed as a monitoring program for collection of precipitation, surface water,
sediment, shellfish, springs and groundwater data to further the understanding of the Island‘s water
resources. Although the data collection effort occurred between 1989 and1992, the report was not
published and submitted to Ecology until December 1998. Seattle-KC Department of Public Health,
Environmental Health Division (Public Health) was a participant in the VMI Groundwater Management
Committee (GWMC) and provided oversight for this study. The GWMP was presented in two topics;
(1) Area Characterization and (2) Management Strategies. The GWMP Area Characterization report
presents a compilation of historical data, new data, results and recommendations. The GWMP
Management Strategies report presents recommended management strategies and implementation
processes for programs related to groundwater quantity and quality.
Precipitation was measured at nine locations between December 1988 and January 1992. Only three
locations were measured continuously through this time period. The GWMP generated total rainfall
maps for those years as well as a combined total rainfall map of 1989-1991.
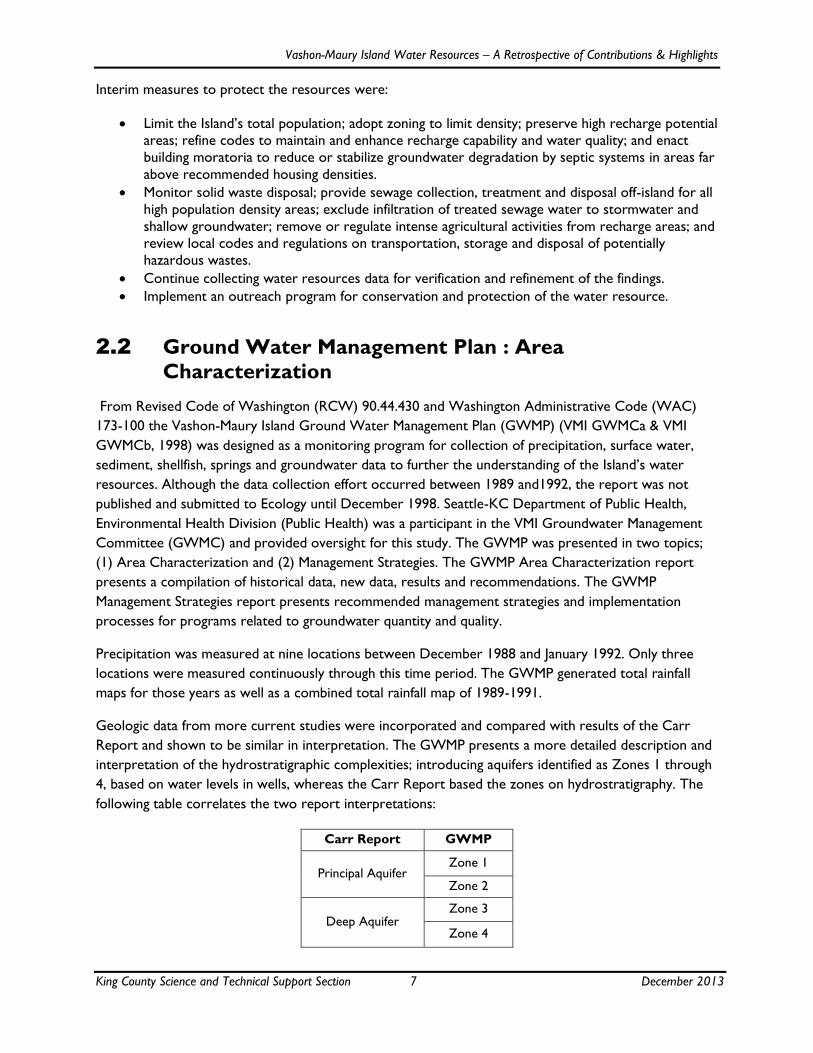
Geologic data from more current studies were incorporated and compared with results of the Carr
Report and shown to be similar in interpretation. The GWMP presents a more detailed description and
interpretation of the hydrostratigraphic complexities; introducing aquifers identified as Zones 1 through
4, based on water levels in wells, whereas the Carr Report based the zones on hydrostratigraphy. The
following table correlates the two report interpretations:
Carr Report GWMP
Principal Aquifer Zone 1
Zone 2
Deep Aquifer Zone 3
Zone 4

Vashon-Maury Island Water Resources – A Retrospective of Contributions & Highlights
King County Science and Technical Support Section 8 December 2013
Groundwater levels and water quality data were collected from 24 wells at 21 locations between 1989
and 1992. Generated groundwater contour maps showed similar flow direction and gradients as in the
Carr Report. In addition, seasonal fluctuations and long-term trends were similar to that reported in the
Carr Report. Selected groundwater water quality parameters included chloride, nitrate, inorganics and
total dissolved solids.
Surface water flow data at nine locations on eight creeks were recorded between July 1989 and April
1992. All locations have gaps in data collected and only two were monitored the full time period.
Monthly high and low stream gauge readings are summarized in the GWMP. Surface water quality data
were collected at eight locations on these same creeks in 1991 and 1992. Stream sediment data were
collected at three of these creek locations. This study collected marine water quality, marine sediments,
and marine shellfish data from surface water in the marine environment near the mouth of the same
eight creeks. In addition, spring water quality data were collected from six creeks between 1989-1990
for fecal coliforms, metals, sulfate, fluoride, and total dissolved solids.
The GWMP describes current land use activities on the Island that may have impacts on groundwater. In
1992, the GWMP study created a susceptibility island-wide map by compiling slope, depth to water, and
surface geology into one map. Areas of susceptibility were designated ‗high‘, ‗medium‘ or ‗low‘
susceptibility potential based on this map, similarly to the 1983 recharge potential map generated in the
Carr Report. This map was later updated in 1995 & 2004 and is available in digital format on the King
County Geographic Information System (GIS) Center‘s metadata webpage (KC, 2008a).
The GWMP discusses Island water resource issues, such as demand, services, rights and uses. New
projections for water demand were reported as 408 MGY for 1990 with an increase of up to 486 MGY
by 2000. There were seven major water systems on the Island, along with more than 100 Group A and
Group B public water systems (PWS). The exact number of private wells and the amount of withdrawal
from those wells on the Island was unknown.
The GWMP also presents an updated island-wide water budget/balance for the Island in the following
simplified equation:
Precipitation = Evapotranspiration + Surface Runoff + Base flow + Subsurface flow
where: Precipitation = rainfall or snow
Evapotranspiration = water evaporated by soils and transpired by plants
Surface Runoff = amount of water that does not infiltrate (directly to Puget Sound)
Base flow = amount of groundwater discharging into streams and rivers
Subsurface flow = discharge of groundwater to Puget Sound
Further discussion and details of the GWMP budget are presented in Section 4.3. In summary, the
budget assumed an island-wide average of 29,696 MGY of potential recharge (precipitation) and 4,263
MGY of potential groundwater available for consumption, indicating a significant amount of runoff from
the Island.

Vashon-Maury Island Water Resources – A Retrospective of Contributions & Highlights
King County Science and Technical Support Section 9 December 2013
2.3 King County Groundwater Protection Program
The King County Groundwater Protection Program projects on the Island were developed by King
County in association with the VMI Groundwater Protection Committee (hereafter referred to as ―the
GWP Committee‖). King County works in conjunction with the GWP Committee to implement the
recommendations of the GWMP and address current local groundwater issues. The GWP Committee
serves the Island‘s community and advises King County and others on groundwater related actions and
activities.
The GWP Committee was formed in late 2001 and has continued to meet since that time. The GWP
Committee membership represents diverse stakeholders with interests from the groundwater advisory
committee (which originally developed the GWMP), water purveyors, sewer and water utilities and
associations, residential well users, chamber of commerce, environmental organizations, tribal nation,
commercial agriculturists, business owners, and unincorporated areas.
The following are studies associated with recent (2001 to present) monitoring by the King County
Groundwater Protection Program:
Ambient Groundwater Monitoring Study – 2001 to 2004
Watershed Plan – 2005
Water Resources Evaluation – 2004 to 2010
Annual Data Reports – 2005 through 2010
Phase I Groundwater Model – 2005
Phase II Hydrologic Modeling: Technical Report – 2009
Sustainability Indicator Development and Monitoring – 2011 to present
2.3.1 Ambient Groundwater Monitoring Study
The Ambient Groundwater Monitoring Report (Ambient Study) (KC, 2005a) presented water quality
and water quantity data from 68 wells and spring locations monitored by King County from 2001 to
2004. This work covered King County‘s four groundwater management areas (GWMA) of East King
County, Issaquah Creek Valley, Redmond- Bear Creek Valley and Vashon-Maury Island.
The Ambient Study was comprised of 19 well and two springs data collection locations on Vashon-
Maury Island. These locations are a subset of the locations monitored as part of the GWMP
groundwater monitoring locations. Landowners of these locations also participated in the work done to
support the GWMP (VMI GWMC, 1998b). Because of changes to the wellhead at ten of the 19 wells,
water level data collection was no longer an option at those locations. All locations were monitored for
water quality twice a year for three years (2001-2003) and once in 2004. When possible, water level
data were also collected at the time of water quality sampling.
In 2001, a volunteer water level data collection effort began with 27 landowners participating in the 12
month study. Five volunteers have continued participating for more than 10 years. Selected water quality
locations that allowed additional visits for water level data were included in this effort as well. After the
initial 12 month period, volunteers were allowed to continue self-monitoring. After 18 months, the
number of volunteers dropped dramatically. In 2004, only five volunteers continued to collect regular
monthly water level data.

Vashon-Maury Island Water Resources – A Retrospective of Contributions & Highlights
King County Science and Technical Support Section 10 December 2013
2.3.2 Watershed Plan
The Vashon-Maury Island Watershed Plan (Watershed Plan) (KC, 2005c) was developed under RCW
90.82 Watershed Planning Chapter to address water supply issues on the Island. The Watershed Plan
was initially part of an effort to prepare an overall WRIA 15 report with the GWP Committee being the
lead writer of the VMI chapter. After a draft was completed and adopted in June 2005 the process
ended as the WRIA members were unable to reach consensus. At the request of the GWP Committee,
King County wrote and published the VMI Watershed Plan as a separate report.
The Watershed Plan provides a description of water quantity and quality issues for which
recommendations have been made. It was intended that recommendations provide broad guidance and
be implemented in close coordination with ongoing programs and mandates of state and local
jurisdictions. Included in a full summary of recommendations, the Watershed Plan recommended that a
representative sample of the Island exempt wells be monitored for water use. Volunteers were to be
solicited to participate in this study. In addition, strategies to implement protection and enhancement of
stream ecology were recommended (such as increasing the stream flow data collection network) and
prioritizing monitoring of streams and groundwater for traces of pesticides, herbicides, and fertilizers.
The Watershed Plan provided the following paraphrased key findings:
A management program is needed to preserve and protect limited groundwater resources.
King County needs to develop a comprehensive strategy to coordinate to the extent of its
powers the present and future use of King County‘s limited groundwater resources.
King County should encourage Group A water systems to make service available to small water
systems within their Comprehensive Plan area.
The King County code should be amended to require that plats with more than four lots
connect to existing public water supply systems if the plat is located in their logical service areas.
New developments should be required to become part of an existing purveyor‘s system when
they are within the purveyor‘s logical service area.
The Island is facing an immediate water supply problem and three purveyors (Burton, Dockton,
Heights) at that time did not have adequate water supply to meet estimated peak demand.
The Island‘s peak day demand will soon exceed supply.
Many Island purveyors have experienced summer water shortages.
The Island needs to develop new water sources, or import water, and conserve water or
reduce future demand.
King County needs to further regulate future land development to make it compatible with
water supply limitations.
There is no off-island water source based on the work reported in the Carr Report,
groundwater recharge areas should be protected, and population growth and water use should
be carefully managed.
The Island‘s population should be limited to prevent depletion of the groundwater and prevent water quality problems.
2.3.3 Water Resources Evaluation
In response to the GWMP, the Vashon-Maury Island Water Resource Evaluation (WRE) Work Plan
(KC, 2004a) was prepared and designed to provide a scientific evaluation of the water supply issues
(both water quantity and quality related) on the Island between 2004 and 2010. The EPA Quartermaster

Vashon-Maury Island Water Resources – A Retrospective of Contributions & Highlights
King County Science and Technical Support Section 11 December 2013
Harbor Nitrogen Management Study grant (Section 2.4) supplemented WRE funding for monitoring
related to identifying nitrogen sources to Quartermaster Harbor.
The WRE plan laid out the objectives, the overall scope of work, the estimated schedule, and expected
deliverables. The main objectives were to:
Coordinate activities with the GWP Committee and the Land Use Committee, the WRIA 15
watershed planning unit, and the residents of the Island;
Satisfy the goals of the countywide data management work plan for the Island region;
Monitor the Island‘s groundwater and surface water quantity and quality in order to evaluate
possible temporal trends; and
Build a comprehensive groundwater flow model that evaluates groundwater and surface water
quantity and quality under various climate change and land-use scenarios.
The WRE Work Plan included activities to characterize the hydrogeology of the study area, such as
quantifying the recharge and discharge on the Island, mapping the distribution of aquifer parameters, and
constructing hydrogeologic cross-sections and maps. Groundwater, surface water, and precipitation data
were collected to better describe the Island‘s water budget and overall water quality. Monitoring efforts
on the Island were to (1) identify changes and trends in groundwater and surface water quantity and
quality, (2) provide necessary data for model development and calibration, and (3) have an early warning
system on the impacts of pollution sources and groundwater extraction. On an annual basis, a data
report was prepared (KC, 2006, 2007, 2008b, 2009a, 2010b) and the King County groundwater
database updated with the latest collected data, available online through a web-based interface (KC,
2013c). Table 1 summarizes the data collection activities for the WRE years (2005-2010).
Three main areas of communication included project management, project coordination and education
and outreach. The coordination occurred through the development of a technical subcommittee of
Island residents that met regularly with King County to discuss issues related to the scope, schedule and
budget. At these regularly scheduled meetings, there were opportunities for input from the public and
stakeholders. Project updates were prepared on an annual basis. Education and outreach efforts were
used to promote stewardship.
2.3.3.1 Precipitation and Surface Water
The WRE added three precipitation gauging locations for a total of five, to improve understanding of the
diverse rainfall (Figure 2). In addition, the WRE expanded stream gauging activity from two continuous
stream gauging locations to five and added an annual assessment of another 13 creeks around the Island.
Instantaneous and continuous data were collected at various locations. Annual mean, maximum and
minimum flows and various other annual hydrologic indicators were calculated and presented in annual
data reports.
Stream water quality sampling, last conducted in 1992, was conducted at seven creeks during a 14
month (Nov 2006 – Dec 2007) period. These creeks were Shinglemill, Christensen, Tahlequah, Fisher,
Judd, Mileta, and Gorsuch Creeks. Based on results observed, stream water quality sampling continued
for another year in 2008 at five locations - Shinglemill; Fisher; Judd; Mileta; and Gorsuch Creeks (Figure
2).

Vashon-Maury Island Water Resources – A Retrospective of Contributions & Highlights
King County Science and Technical Support Section 12 December 2013
Table 1. Water Resources Evaluation Activities Summary.
Continuous/
Instantaneous
Gauging Sites
Water
Level
Sites
Exempt
Well
Meter
Sites
Newly
Drilled
Well
Sites
2005 5 sites 5/27 -- -- 27Environmental Indicators
1;
organics sampling2
20 -- 6
2006 5 sites 5/0Conventionals, nutrtients,
and microbiology 3
-- 23
Environmental Indicators1;
arsenic speciation
sampling As, As(III) &
As(V)
19 -- --
2007 5 sites 5/27Conventionals, nutrtients,
and microbiology 3
7 16
Environmental Indicators1;
arsenic speciation
sampling As, As(III) &
As(V); plus other4
33 8 4
2008 5 sites 5/27Conventionals, nutrtients,
and microbiology 3
5 20 Environmental Indicators1 17 7 --
2009 5 sites 5/27Conventionals, nutrtients,
and microbiology 3
5 22 Environmental Indicators1 21 7 --
2010 5 sites 5/27Conventionals, nutrtients,
and microbiology 3
4 21 Environmental Indicators1 23 7 --
Notes:
1 = Environmental indicators = Arsenic, Chloride, Nitrate+Nitrate
As = Arsenic
3 = Surface Water Parameters (Conventionals, nutrtients, and microbiology ) 4 = Groundwater Parameters
Ammonia Nitrogen Cadmium pH, Field
Conductivity, Field Calcium Potassium
Dissolved Oxygen, Field Chromium Sample Temperature, Field
Escherichia coli Conductivity, Field Silver
Fecal Coliform Copper Sodium
Nitrite + Nitrate Nitrogen Dissolved Oxygen, Field Sulfate
Orthophosphate Phosphorus Fluoride Total Alkalinity
pH, Field Hardness Total Dissolved Solids
Sample Temperature, Field Iron Total Phosphorus
Total Alkalinity Lead Total Suspended Solids
Total Nitrogen Magnesium Turbidity, Field
Total Phosphorus Manganese Zinc
Total Suspended Solids Mercury
Turbidity Nickel
2 = Organics sampling included chlorinated pesticides & herbicides, organophosphorus
pesticides, and endocrine disrupting compounds.
Data collection during 2010 was not incorporated
in an annual report.
PrecipitationWater
Year
Surface Water Quality
Water Quality SitesWater Quality Sites
Groundwater

Vashon-Maury Island Water Resources – A Retrospective of Contributions & Highlights
King County Science and Technical Support Section 13 December 2013
Figure 2. Precipitation and Surface Water Locations.
Note: These locations represent activities related to the WRE; Quartermaster Harbor
Nitrogen Management Study and VMI Sustainability Monitoring.
Colvos
Passage
Puget
Sound
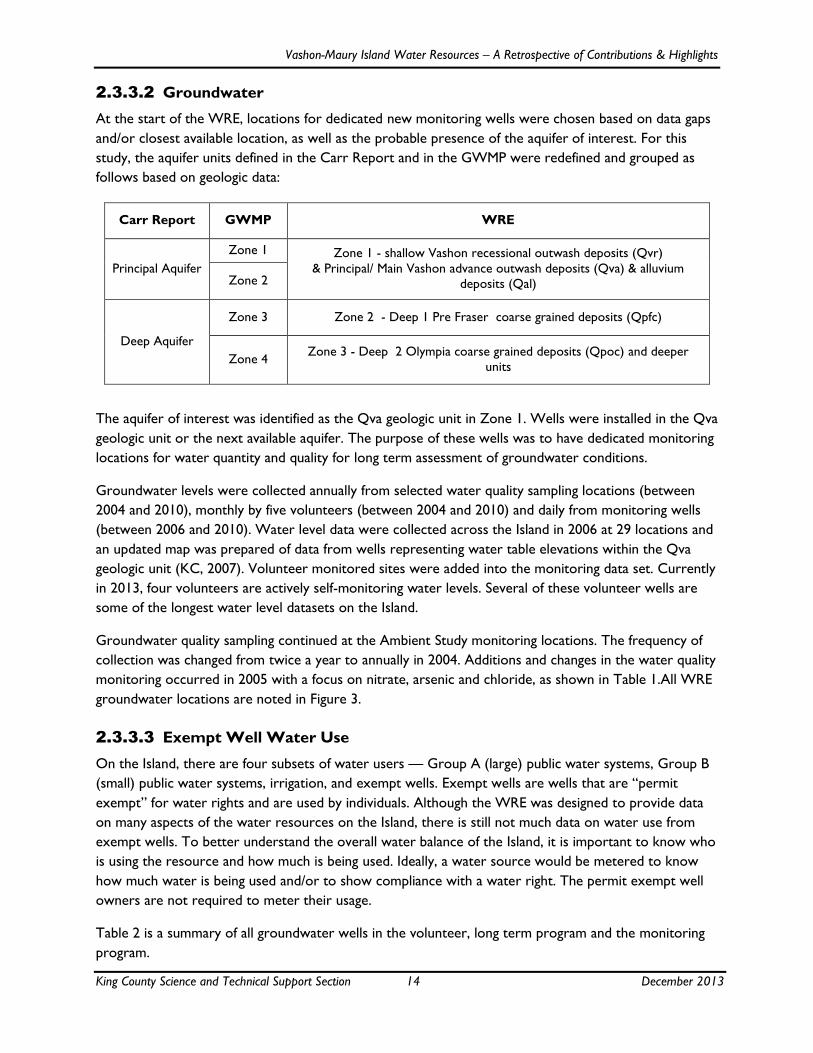
Vashon-Maury Island Water Resources – A Retrospective of Contributions & Highlights
King County Science and Technical Support Section 14 December 2013
2.3.3.2 Groundwater
At the start of the WRE, locations for dedicated new monitoring wells were chosen based on data gaps
and/or closest available location, as well as the probable presence of the aquifer of interest. For this
study, the aquifer units defined in the Carr Report and in the GWMP were redefined and grouped as
follows based on geologic data:
Carr Report GWMP WRE
Principal Aquifer
Zone 1 Zone 1 - shallow Vashon recessional outwash deposits (Qvr)
& Principal/ Main Vashon advance outwash deposits (Qva) & alluvium
deposits (Qal) Zone 2
Deep Aquifer
Zone 3 Zone 2 - Deep 1 Pre Fraser coarse grained deposits (Qpfc)
Zone 4 Zone 3 - Deep 2 Olympia coarse grained deposits (Qpoc) and deeper
units
The aquifer of interest was identified as the Qva geologic unit in Zone 1. Wells were installed in the Qva
geologic unit or the next available aquifer. The purpose of these wells was to have dedicated monitoring
locations for water quantity and quality for long term assessment of groundwater conditions.
Groundwater levels were collected annually from selected water quality sampling locations (between
2004 and 2010), monthly by five volunteers (between 2004 and 2010) and daily from monitoring wells
(between 2006 and 2010). Water level data were collected across the Island in 2006 at 29 locations and
an updated map was prepared of data from wells representing water table elevations within the Qva
geologic unit (KC, 2007). Volunteer monitored sites were added into the monitoring data set. Currently
in 2013, four volunteers are actively self-monitoring water levels. Several of these volunteer wells are
some of the longest water level datasets on the Island.
Groundwater quality sampling continued at the Ambient Study monitoring locations. The frequency of
collection was changed from twice a year to annually in 2004. Additions and changes in the water quality
monitoring occurred in 2005 with a focus on nitrate, arsenic and chloride, as shown in Table 1.All WRE
groundwater locations are noted in Figure 3.
2.3.3.3 Exempt Well Water Use
On the Island, there are four subsets of water users — Group A (large) public water systems, Group B
(small) public water systems, irrigation, and exempt wells. Exempt wells are wells that are ―permit
exempt‖ for water rights and are used by individuals. Although the WRE was designed to provide data
on many aspects of the water resources on the Island, there is still not much data on water use from
exempt wells. To better understand the overall water balance of the Island, it is important to know who
is using the resource and how much is being used. Ideally, a water source would be metered to know
how much water is being used and/or to show compliance with a water right. The permit exempt well
owners are not required to meter their usage.
Table 2 is a summary of all groundwater wells in the volunteer, long term program and the monitoring
program.

Vashon-Maury Island Water Resources – A Retrospective of Contributions & Highlights
King County Science and Technical Support Section 15 December 2013
Figure 3. Groundwater Related Activities – Water Quality & Quantity Monitoring Locations.
Note: These locations represent activities related to the KC DNRP WLRD projects – Ambient Study;
WRE; Quartermaster Harbor Nitrogen Management Study; and Sustainability Monitoring.
Colvos
Passage
Puget
Sound

Vashon-Maury Island Water Resources – A Retrospective of Contributions & Highlights
King County Science and Technical Support Section 16 December 2013
Table 2. Groundwater Well Details for WRE and Ongoing Work
(continued on next page)
Use of Well Well Name Location Active Easting Northing
Ground Surface
Elevation
(feet above MSL)
Average Water
Level Elevation
(feet above MSL)
Well
Depth
(feet bgs)
Qvr Volunteer vol-07 Nyberg No 1241557.80 171548.62 200.20 193.48 20
Qal Monitoring VAS_w-73 111th Ave SW Yes 1233520.75 156745.44 145.0 134.9 57
LongTerm s-03 Atlas Water Corp #1 (Klahanie) Yes 1243557.81 161598.77 -2.642 0.0 0
LongTerm W-10a Gold Beach Water Company Yes 1246332.48 140215.28 106.597 19.7 114
Volunteer vol-03 Taylor No 1231302.33 157725.08 355.98 171.68 304
Monitoring VAS_W-60 Vashon Hwy SW, near 145th Pl Yes 1238126.78 177709.28 400.0 179.4 240.0
Volunteer w-21 Kuperberg Yes 1232395.71 176904.52 298.82 184.02 133
LongTerm W-21 Kuperberg Yes 1232395.71 176904.52 298.823 185.2 133
Volunteer vol-06 Needle Creek Water System Yes 1235138.74 177269.28 360.00 198.43 240
LongTerm W-15 Anderson No 1226036.47 135232.21 369.824 210.0 188
LongTerm W-13 Misty Isle Farms Yes 1232322.97 149267.62 223.301 211.3 80
Volunteer vol-19 Sunnyslopes Yes 1226661.27 127520.10 291.74 227.43 102
LongTerm W-16a Baker/Klemka Yes 1223926.61 147292.52 282.628 229.1 67
Monitoring VAS_W-65 Valley Center Park-n-Ride 6" well Yes 1237393.75 158570.14 325.0 240.2 159.5
Monitoring VAS_W-61 Valley Center Park-n-Ride 2" well Yes 1237415.33 158544.96 325.0 240.6 155.0
Volunteer vol-11 Ammon No 1227036.23 152357.60 384.80 246.77 150
Volunteer vol-21 Wolff No 1225674.19 133298.03 338.05 250.13 150
LongTerm W-06 Packard/Healy Yes 1233777.06 167375.23 405.662 259.2 169
Monitoring VAS_w-72 Paradise Ridge Park Yes 1231599.89 153882.27 382.0 261.2 135
Volunteer vol-23 Harper No 1226063.91 149225.63 321.56 264.27 UNK
LongTerm W-19 Thorsen Rd Water Association No 1228382.08 166391.41 412.611 268.8 173
LongTerm W-20 Johnson Yes 1230103.08 172135.11 362.961 275.8 122
Monitoring VAS_w-71 Island Center Forest Yes 1235024.82 163939.60 367.0 283.1 104
Volunteer vol-04 Coulson No 1230107.74 167393.89 406.98 301.04 140
Volunteer vol-12 Davison_Clegg No 1229768.23 154215.58 390.93 310.27 UNK
Qva ? Monitoring VAS_W-64 Wax Orchard Rd @ Vashon Hwy Yes 1226485.09 135533.47 380.0 198.5 244.0
Qva/Qac LongTerm W-14 Krishnan Yes 1223562.98 134210.22 376.455 211.5 183
ZO
NE
1
WRE Aquifer
Zone -
Geologic Unit
(as per WRE)
Qva

Vashon-Maury Island Water Resources – A Retrospective of Contributions & Highlights
King County Science and Technical Support Section 17 December 2013
Table 2. Groundwater Well Details for WRE and Ongoing Work. (continued)
(continued on next page)
Use of Well Well Name Location Active Easting Northing
Ground Surface
Elevation
(feet above MSL)
Average Water
Level Elevation
(feet above MSL)
Well
Depth
(feet bgs)
LongTerm W-03 Glen Acres Yes 1241007.87 177076.64 145.601 17.3 142
LongTerm W-17 Perla Yes 1224748.77 154907.21 223.123 52.9 220
LongTerm W-02a Heights Water District Yes 1237066.70 182426.33 260.316 115.2 177
LongTerm W-18 Whelan-Miller No 1225821.93 166542.07 207.347 131.9 116
Monitoring VAS_W-70 Valley Center Prk-n-Ride Deep Yes 1237379.22 158547.99 325.0 188.5 335
Monitoring VAS_W-62 Maury Island - 63rd Ave SW Yes 1249531.29 147138.50 330.0 dry 243.0
Volunteer vol-05 Palmer No 1240788.94 171668.80 190.83 51.60 197
Volunteer vol-16 Svinth No 1246789.32 146211.61 150.62 59.41 249
Volunteer vol-22 Jansen No 1245797.62 150042.30 65.50 62.09 UNK
Volunteer vol-27 Heights Water Yes 1237044.10 182535.11 192.20 68.7 155
Volunteer vol-14 Abel No 1235950.63 153352.41 134.01 87.33 UNK
Volunteer w-02b Heights Water Dept. Well #2 Yes 1237075.90 182457.93 199.55 87.82 148
Volunteer w-02a Heights Yes 1237066.70 182426.33 260.32 114.48 177
Volunteer vol-15 Luana Water Association No 1253664.98 148427.47 166.00 119.61 79
Volunteer vol-20 Crockett No 1222849.84 128787.21 316.46 147.45 189
Volunteer vol-13 Meeker Yes 1232707.61 152657.99 299.86 160.78 210
Volunteer vol-09 Graham No 1231813.03 155178.09 368.26 163.01 350
Qva/Qpfc Monitoring VAS_W-63 SW Redding Beach Rd Yes 1226357.60 148438.41 290.0 180.9 145.0
ZO
NE
2
WRE Aquifer
Zone -
Geologic Unit
(as per WRE)
QAc
Qpf

Vashon-Maury Island Water Resources – A Retrospective of Contributions & Highlights
King County Science and Technical Support Section 18 December 2013
Table 2. Groundwater Well Details for WRE and Ongoing Work. (continued)
Use of Well Well Name Location Active Easting Northing
Ground Surface
Elevation
(feet above MSL)
Average Water
Level Elevation
(feet above MSL)
Well
Depth
(feet bgs)
Volunteer vol-08 Sage No 1240783.47 178488.83 93.53 24.36 94
Volunteer vol-17 Putnam No 1231599.26 143680.71 41.72 31.69 120
Volunteer vol-18 Oellien No 1230670.95 140647.11 118.20 33.12 150
Volunteer vol-24 Bogaard No 1240837.79 170889.12 207.55 34.88 UNK
LongTerm W-04 Rodriques Yes 1240833.87 172083.67 198.261 0.0 305
LongTerm W-12 Hollymere Water System No 1243087.96 144080.74 110.421 15.4 473
Volunteer vol-02 Beardsley Yes 1227498.68 172787.90 134.53 26.71 165
LongTerm W-08 Kiro/Entercomm, Inc. No 1244002.63 149889.53 95.478 51.3 462
LongTerm W-09a White #1 Yes 1253624.00 145340.00 411.055 20.2 450
LongTerm W-07 Toomey/Sorge Yes 1235401.16 158016.56 259.819 26.6 297
LongTerm W-11 Docton Water Association Yes 1238780.43 135435.73 320.512 81.6 423
Note:
bgs = below ground surface Main Geologic Units for King County
MSL = mean sea level Qal alluvium
UNK = unknown Vashon Stade
WRE = KC Water Resources Evaluation Qva Vashon advance outwash deposits
Qvr Vashon recessional outwash deposits
Older Glacial and Nonglacial Deposits
Qpf Pre-Fraser deposits, undifferentiated
Qpfc Pre-Fraser coarse grained deposits
QAc pre-Vashon deposits upper coarse grained unit
QBc pre-Vashon deposits lower coarse grained unit
ZO
NE
3
WRE Aquifer
Zone -
Geologic Unit
(as per WRE)
Qpf
QBc
QAc

Vashon-Maury Island Water Resources – A Retrospective of Contributions & Highlights
King County Science and Technical Support Section 19 December 2013
2.3.3.4 Modeling and Water Budget Efforts
Understanding the water budget for the Island and how sensitive the system is to changes in human
activities and climate is important in evaluating the amount of water that can be safely pumped from the
aquifers on a sustained basis. As part of this work, a groundwater modeling effort addressed the water
balance concerns on the Island. Results of the groundwater modeling and water budget efforts were
reported in the following documents and are discussed in more detail in Section 4.3:
Vashon-Maury Island Phase I Groundwater Model – A Part of the Vashon-Maury Island Water
Resources Evaluation (KC, 2005b), and
Vashon-Maury Island Hydrologic Modeling: Technical Report (KC, 2009b).
These models relied heavily on the monitoring and data management components of the WRE Work
Plan. In Phase 1, a large-scale steady-state model was developed for the Island groundwater budget,
using the MODFLOW-2000 model developed by the U.S. Geological Survey (KC, 2005b). MODFLOW
is a finite-difference groundwater flow model capable of modeling in one-, two- or, three-dimensions.
The Phase 1 model was a three-dimensional (3-D) model made of ten layers based on a database of
borings and well logs compiled by GeoMapNW. Boundary conditions included wells, recharge (natural
and septic drainfields), streams, springs, and deep discharge to Puget Sound. Calibration was
accomplished by successively modifying aquifer/aquitard properties (hydraulic conductivity) and some
lesser-defined boundary conditions (streams and springs) to successively improve the fit. For simplicity,
the properties for any given unit (aquifer and aquitard) were considered to be uniform across the entire
Island, as were the boundary condition parameters for all streams and springs.
There were some uncertainties about the quantity of well production – agricultural irrigation in
particular. The model was most sensitive to hydraulic conductivity in medium deep units, although this
sensitivity may be associated with the chosen Puget Sound boundary condition. Less sensitive were the
conductivities in shallower and deeper units and the stream and springs boundary condition parameters
(KC, 2005b).
The WRE Phase I model presents an updated island-wide water budget/balance as the following:
Precipitation + Septic Systems + Rivers & Lakes =
Evapotranspiration + Runoff + Subsurface flow + Base flow + Wells + Springs
where: Precipitation = rainfall or snow
Septic Systems= recharge from septic systems
Rivers & Lakes = recharge from rivers and lakes
Evapotranspiration = water evaporated by soils and transpired by plants
Runoff = amount of water that does not infiltrate (goes directly to Puget Sound)
Subsurface flow = discharge of groundwater to Puget Sound
Base flow = amount of groundwater discharging into streams and rivers
Wells = discharge to wells
Springs = discharge to springs
The Phase 1 model also provided some guidance for future phases of groundwater modeling of the
Island‘s aquifer system and provided suggestions for investigation to address data gaps that were found
to be limiting to the modeling effort. The following actions were among several suggested:
Vashon-Maury Island Water Resources – A Retrospective of Contributions & Highlights
King County Science and Technical Support Section 20 December 2013
Correcting well locations;
Incorporate more recent reinterpretations of hydrostratigraphy and boundary conditions;
Add monitoring wells to inform models during later phases;
Refine understanding of geographic variations in aquifer properties;
Improve detailed grid and subdomain modeling to model localized issues of lateral flow or
contaminant transport;
Conduct surface water modeling to better define recharge issues and surface water /
groundwater interaction;
Consider instrumenting wells to improve estimations of pumpage rates;
Improve mapping of springs; and
Adjust boundary conditions offshore to improve accuracy in modeling saltwater interface.
Phase II modeling work involved refining the Phase I groundwater model and linking it to a surface water
model. More specifically, it included the development of a time-varying, integrated groundwater-surface
water model and an assessment of the impacts of possible future build-out along with climate change
scenarios on the water resources. In order to refine the ability to simulate historical groundwater
conditions on the Island and improve the ability to model future conditions scenarios, a transient
integrated hydrologic model was developed using DHI‘s MIKE SHE code and the existing MODFLOW
model (Phase I) as a starting point (KC, 2009b). Location-specific parameters used to construct the
Phase II model included land use, precipitation, evapotranspiration, geologic and hydrogeologic
parameters, well locations, and pumping and withdrawal rates. Several parameters were assumed to vary
based on season, including precipitation, evapotranspiration, pumping, and withdrawal rates.
The WRE Phase II model presents an updated island-wide water budget/balance that is most similar to
the WRE Phase I model budget. As seen in the following equation, recharge by irrigation activities were
included:
Precipitation + Septic Systems + Irrigation =
Evapotranspiration + Runoff + Subsurface flow + Base flow + Wells + Springs
where: Precipitation = rainfall or snow
Septic Systems= recharge from septic systems
Irrigation = recharge from irrigation
Evapotranspiration = water evaporated by soils and transpired by plants
Runoff = amount of water that does not infiltrate (goes directly to Puget Sound)
Subsurface flow = discharge of groundwater to Puget Sound
Base flow = amount of groundwater discharging into streams and rivers
Wells = discharge to wells
Springs = discharge to springs
The output generally agreed with previous evaluations of water resources, and the model calibration
was acceptable for understanding the general flow direction, magnitude, and location of the water
resources and assessing potential areas of concern. The Phase II model evaluated two possible future
pumping scenarios representing additional development on the Island associated with population
growth, four possible future climate change scenarios representing possible changes in temperatures and
precipitation, and four possible future scenarios that combined the development and climate conditions.

Vashon-Maury Island Water Resources – A Retrospective of Contributions & Highlights
King County Science and Technical Support Section 21 December 2013
The future climate change scenarios suggest that both mean annual precipitation and evapotranspiration
will increase over the next century, and that runoff and baseflow will decrease slightly. Results showed
that relatively small declines in mean annual groundwater recharge will occur. In addition, projected
decreases of groundwater levels in the upper aquifers and stream summer baseflows were present
under all of the future scenarios evaluated. Mean annual groundwater levels were projected to decline
from between 0.3 and 5.2 feet depending on the scenario, the area of the island, and the aquifer in
question.
Under a pumping scenario, where additional wells are completed within the Qva, mean water levels in
the Qva may decrease by up to 0.9-ft. Stream baseflow may also decrease slightly under this pumping
scenario by up to 0.3%.
The model did a reasonably good job of estimating the observed streamflows in Shingle Mill Creek. The
model represents summertime baseflow conditions quite well in this creek, but under-predicts flows
during runoff events. The model does not predict streamflows nearly as well in Judd Creek, where
runoff events are significantly under-predicted and baseflows are significantly over-predicted.
The Phase II report posited the following paraphrased recommendations:
Refine the MIKE SHE model and/or develop a finite-element groundwater model using a more
advanced model such as DHI‘s FEFLOW program.
Evaluate additional climate change scenarios to investigate the range of possible climate change
impacts on water resources of the Island, especially to include regional climate model data
specific to the Island.
2.4 Quartermaster Harbor Nitrogen Management Study
The Quartermaster Harbor Nitrogen Management Study is a four year (2009 - 2012) project with a goal
to support the protection and restoration of Quartermaster Harbor – a high value, coastal aquatic
resource on the Island (Figure 4). Partners working with King County on this U.S. Environmental
Protection Agency (EPA) grant-funded study include the Groundwater Protection Committee, the
University of Washington-Tacoma (UWT) and Ecology. The EPA Quartermaster Harbor Nitrogen
Management Study grant (―see below for details regarding that study‖) supplemented WRE funding for
monitoring related to identifying nitrogen sources to Quartermaster Harbor.
Quartermaster Harbor is a shallow bay that has approximately 3,000 acres of water surface area in an
inner and outer harbor (KC, 2012c). The largest freshwater source to the sheltered inner harbor is Judd
Creek. Transition zones exist between freshwater sources and marine water along estuaries at the
mouth of Judd Creek, Fisher Creek and Raab‘s Lagoon and at various small streams (KC, 2012c).
Dissolved oxygen levels below the state marine water quality standard have been observed in the
harbor over the last seven years (monthly harbor monitoring began in 2006) and the harbor typically
experiences low dissolved oxygen concentrations during late summer/fall that fall below the applicable
state marine water quality standard. The likely cause of these low oxygen levels is the growth and
subsequent die-off of microscopic organisms that live in watery environments (otherwise known as
phytoplankton) that consume dissolved oxygen in the water column and sediments as they decompose
and settle to the bottom of the water column(KC, 2012c).

Vashon-Maury Island Water Resources – A Retrospective of Contributions & Highlights
King County Science and Technical Support Section 22 December 2013
Figure 4. Drainage Area to Quartermaster Harbor.
The Quartermaster Harbor Nitrogen Management Study monitored many aspects of surface, ground
and marine waters of the Island. Stream water quality monitoring was conducted on Fisher, Judd and
Mileta Creeks. The stream water quality work continued through 2012.
Puget
Sound
Stream
Lake/Puget Sound
Park
Quartermaster Harbor
Drainage
LEGEND

Vashon-Maury Island Water Resources – A Retrospective of Contributions & Highlights
King County Science and Technical Support Section 23 December 2013
Marine monitoring was conducted by King County and UWT staff within and just outside
Quartermaster Harbor for this study. King County conducted monitoring at three intertidal locations
(Dockton marina, Inner Harbor marina and Burton Beach) along with two subtidal sampling locations
(Dockton and Inner Harbor docks). UWT sampling occurs at seven vessel-based sampling locations
from outside of the entrance of Quartermaster Harbor into the inner harbor area.
This study has so far produced the following reports:
Initial Assessment of Nutrient Loading to Quartermaster Harbor – February 2010
Mileta Creek Nitrogen Source Tracking Study – February 2012
Quartermaster Harbor Nearshore Freshwater Inflows Assessment – March 2012
Quartermaster Harbor Benthic Flux Study – March 2012
The Initial Assessment of Nutrient Loading to Quartermaster Harbor report (KC, 2010a) documents available
data sources and methods used to develop initial estimates of nutrient loading to the harbor from the
atmosphere, tributary streams, nearshore septic systems, groundwater, and harbor sediments. The
nutrients considered were forms of nitrogen, phosphorus, and silica, which are the common essential
nutrients for phytoplankton growth in estuaries and freshwater systems. Of the external sources of
nutrients evaluated, tributary streams were the most significant source of the forms of nitrogen most
readily available to estuarine phytoplankton on an annual basis. A tributary is a freshwater stream that
flows into a larger stream, river or other body of water. Assessment of seasonal loadings indicated that
nearshore septic systems may be the largest external source of nitrogen on the Island during the critical
late summer/fall period when harbor dissolved oxygen concentrations are lowest. Estimates of internal
benthic nutrient flux from harbor sediments indicated that this may be a far more significant source of
nutrients during the same late summer/fall period. Nutrient influx from the Puget Sound through the
entrance to the harbor has not yet been quantified.
This initial report recommended:
Estimate the nutrient contribution from Puget Sound to the harbor as a result of estuarine
circulation using available data and the hydrodynamic model under development for this project;
Develop plan and budget for conducting benthic nutrient flux measurements in the harbor
during late summer/fall of 2010;
Evaluate the possibility of sampling currently unmonitored freshwater inflow sources to the
harbor during late summer/fall of 2010;
Develop plan and budget to track source of high winter nitrate levels in Mileta Creek; and
Attempt to balance groundwater and stream nutrient inputs with specific upland sources.
The Mileta Creek Nitrogen Source Tracking Study (KC, 2012a) was conducted to identify locations on
Mileta Creek where nitrate concentrations are elevated in winter and to evaluate if the source could be
identified. Mileta Creek is a relatively small tributary to Quartermaster Harbor and it is the only
tributary routinely monitored on Maury Island. Elevated nitrate concentrations of over 4 milligrams per
liter (mg/L) have been observed during winter months in Mileta Creek since routine monthly water
quality monitoring began in late 2006. The peak nitrate concentrations in Mileta Creek (and the smaller
peaks in the other monitored creeks) typically occur after the minimum oxygen concentrations are
observed in Quartermaster Harbor. Data for this study was collected at 16 locations in the drainage
area, representing Mileta Creek and associated smaller tributaries. The timing and shape of the nitrate

Vashon-Maury Island Water Resources – A Retrospective of Contributions & Highlights
King County Science and Technical Support Section 24 December 2013
peak in Mileta Creek was reported as similar to that in Shingle Mill, Judd, and Fisher creeks – particularly
Fisher Creek, but the peak concentration is of significantly greater magnitude. In summary, the study was
not able to identify the actual source. However, the report indicated that the source location was
isolated to the reaches upstream of the mainstem of Mileta Creek. The study was able to eliminate the
golf course and the abandoned chicken barns as the cause of the elevated nitrate concentrations
observed in Mileta Creek. Potential sources of nitrate to Mileta Creek were posited as:
Human activities (historic or current) in the upland reaches of the watershed;
Release of summer accumulation of dissolved nitrate from nitrogen fixing plants, such as red
alder, in surface soils during initial winter storms;
Excreta from a possible nearby historic heron rookery; and
Forest clearing, especially clearing of red alder stands.
The following paraphrased recommendations were suggested:
Further attempts to isolate the source(s) of elevated winter nitrate concentrations should
include a more rapid way to identify the timing of peak nitrate concentrations;
Focus should be on the longitudinal variation of nitrate in the two forks of Mileta Creek
upstream from the mainstem;
Identifying other small creeks with similarly elevated nitrate concentrations might help to
determine if elevated nitrate concentrations are isolated to Mileta Creek or associated with a
particular combination of land cover and surface soil or subsurface geologic characteristics; and
Include red alder density in a more detailed forest classification to more directly relate the amount of red alder to observed nitrate concentrations and loads in streams.
The Quartermaster Harbor Nearshore Freshwater Inflows Assessment (KC, 2012d) was completed to identify
small previously unmonitored small tributaries, pipes, culverts and seeps discharging to Quartermaster
Harbor that might have relatively high nitrate concentrations. Data were collected in October 2010
along the perimeter of the harbor. Many of the freshwater source locations (inflows) had been
inventoried in previous studies, but they had not been sampled for water quality. Results from this study
reported the median nitrate concentration range measured in small freshwater inflows to the harbor
was similar to the median nitrate concentration measured in October in the three largest tributary
streams to the harbor from 2007 to 2010. The data suggested spatial variability in nitrate from these
previously unmonitored sources.
The initial estimate of total nitrate loading from freshwater inflows to the harbor used an average areal
loading from routinely monitored tributaries to estimate loading from the unmonitored portion of the
harbor drainage basin (KC, 2010a). The total estimated October 2010 nitrate loading from Judd, Fisher
and Mileta Creeks was 6.3 kilograms per day (kg/d) and the total estimated loading from the previously
unmonitored freshwater inflows was 3.1 kg/d. Judd, Fisher and Mileta Creeks were reported to
represent drainage from approximately half of the total drainage to the harbor. Based on an areal
extrapolation approach, the total load from the remainder of the basin would be approximately 6 kg/d in
October 2010.
The Quartermaster Harbor Benthic Flux Study (KC, 2012c) documents the results of an in situ study of
benthic oxygen demand and nutrient fluxes from sediments in the harbor during critical dissolved
oxygen conditions in the harbor for use in water quality model calibration and testing. The results from

Vashon-Maury Island Water Resources – A Retrospective of Contributions & Highlights
King County Science and Technical Support Section 25 December 2013
data collected from locations in the harbor were reported as similar to the range of results reported by
a recent study conducted in four South Puget Sound bays that used the same equipment and methods.
There was a distinct gradient in the results with the greatest sediment oxygen demand and nutrient flux
observed at the shallowest location in the inner harbor. Lowest nutrient release was estimated for the
two deepest stations in the outer harbor. The flux estimates provided by this study will provide
location-specific data for the development and testing of a water quality model of the harbor and also
provide data to refine the initial estimate of sediment nutrient loading to the harbor. Because sediments
may provide a long-term reservoir of nitrogen for phytoplankton growth that could delay the response
of the harbor to management activities designed to reduce nitrogen loading from terrestrial sources,
additional studies of sediment nutrient flux may be warranted.
2.4.1 Sustainability Indicator Development and Monitoring
In 2011, the King County Groundwater Protection Program transitioned from the WRE to on-going
monitoring requested by the GWP Committee. This work continues water resources (precipitation,
surface water and groundwater) monitoring initiated or expanded during the WRE. Precipitation, stream
gauging, and groundwater monitoring has continued with five precipitation locations, five continuous
stream gauge locations, and over 20 groundwater wells.
Data from this monitoring work is being incorporated into the VMI Sustainability Indicators, a set of
measures to evaluate the overall hydrologic conditions on the Island. The Sustainability Indicators are
listed in Table 3 and described in more detail in Appendix A
As noted in the prior section, stream water quality work is conducted as part of the Quartermaster
Harbor Nitrogen Management Study along with shared groundwater water quality work through 2012.
Table 3. Sustainability Indicators for Vashon-Maury Island.
Topic Subtopic Indicators
Nitrate
Arsenic
Chloride
Surface Water Stream Water Quality Index
Quartermaster Harbor Dissolved Oxygen
Quartermaster Harbor Fecl Coliform
Groundwater Water Levels
Summer Low Flows
Stream Flashiness
Stream Benthic Macroinvertibrate population (B-IBI)
Salmon Population
Annual Total Usage
Per Capita Usage
Peaking Factor
Water Quality
Water Quantity
Ecosystem Health
Water Use /
Management
Surface Water
Stream Life
Groundwater
Island-Wide Water
Usage
Marine Water
Vashon-Maury Island Water Resources – A Retrospective of Contributions & Highlights
King County Science and Technical Support Section 26 December 2013
3.0. ISLAND-WIDE CLIMATE
CONDITIONS Although it‘s been over 50 years since this narrative summary of Vashon-Maury Island‘s climate, as
prepared by the U.S. Weather Bureau State Climatologist in 1962 (Carr/Assocs., 1983), the
observations are still applicable to current conditions on the Island. Local differences and climatic trends
are discussed in further detail in the following sections.
―In a northwesterly direction and within a distance of 40 miles, the Olympic Mountains rise
to elevations of 4,000 to 7,000 feet. This range is very effective in protecting the Island from
the more intense winter storms moving inland from over the Ocean. In an easterly direction
and within 50 miles, the Cascade Mountains reach elevations of 5,000 to 7,000 feet with
snowcapped peaks in excess of 10,000 feet. The Cascades shield the Puget Sound area from
the higher summer and lower winter temperatures observed in eastern Washington.
The climate is predominantly a mid-latitude, west coast marine type with cool dry summers,
mild but rather rainy winters and a small range in temperature. During the spring and
summer, a clockwise circulation of air around the large high pressure area over the north
Pacific brings a flow of comparatively dry and cool air from a northwesterly direction into
western Washington. As the air moves inland, it becomes warmer and drier, resulting in a
dry season beginning in the late spring and reaching a peak in mid-summer. During July and
August, it is not unusual for 2 to 4 weeks to pass with only a trace of precipitation.
Afternoon temperatures in the warmest months are in the 70's and nighttime readings are in
the 50's. Maximum temperatures reach 80° or 85° on a few afternoons; however, 90° is
unusual. The hottest days occur when hot dry air from east of the Cascades reaches this
area. The humidity is low under these conditions and the warmest afternoons are not
especially uncomfortable. Following one or two hot days, cooler air from over the Ocean
moves inland and temperatures return to the 70's. Fog or low clouds sometimes form during
the early morning hours and disappear' before noon.
During the fall and winter seasons, the low pressure area near the Aleutian Islands intensifies
and the high pressure area over the north Pacific becomes smaller and moves southward. A
circulation of air around these two pressure centers brings a prevailing flow of warm moist
air from a south-westerly direction into the State. This results in mild winter temperatures
and a rainy season beginning in October, reaching a peak in mid-winter and gradually
decreasing in the spring. Snowfall is light and seldom remains on the ground longer than a few
days.‖
Statewide trends of worsening conditions are evident and projections follow a similar trend. In addition,
Washington State reports that ―climate-influenced conditions and events such as temperatures, sea
levels, and storms can no longer be expected to remain within their historical ranges, and these trends
are likely to continue well beyond the end of the 21st century.‖ (WA Ecology, 2012). To address this
issue and to compare results of local versus regional data, this section of the report presents trends
and/or spatial variability, if present, of air temperature, precipitation, and stream flow data. In general,
there is some evidence of local air temperature data showing similar warming rates as that seen in global
data. Due to the lack of long term data for precipitation and stream flow data on Vashon-Maury Island, it
is not known if trends exist.

Vashon-Maury Island Water Resources – A Retrospective of Contributions & Highlights
King County Science and Technical Support Section 27 December 2013
3.1 Air Temperature
On Vashon Island, the mean monthly average air temperature for the period from 1891 to 1955 ranged
between 38.7 to 62.9 degrees Fahrenheit (F) (WRCC, 2013). This location was a former weather
station, located near the Agren Memorial Park on the northwest side of Vashon Island. The daily air
temperature averages and extremes for this station identified as National Climate Data Center (NCDC)
Cooperative Observer Program (COOP) station number 458802 (Figure 5; WRCC, 2013).
Figure 5. Daily Air Temperature Averages and Extremes on Vashon Island.
Note: Location is Station 458802. Figure modified from WRCC, 2013.
Although the Carr Report did not present data or discuss air temperature and movement, the report
did comment that although there was probably considerable variation within the study area, the
differences were not significant in evaluation of evaporation. When needed for the report, data from the
Seattle-Tacoma International airport (Sea-Tac) weather station was considered representative of the
entire Island‘s conditions (Carr/Assoc., 1983).
King County installed and has maintained an air temperature gauge (West Judd Creek Rain Gage 28Y)
on the Vashon Island Closed Landfill property since June of 2007. The daily mean air temperature for
the period June 2007 through August 2013 ranged mostly between 30 and 70 degrees F (Figure 6).
Figure 6. Daily Mean Air Temperatures at West Judd Creek Rain Gage 28Y located at the
Vashon Island Closed Landfill (June 2007 through August 2013).
Tem
pe
ratu
re (F
)
100
75
50
25
0
Jan Mar May Jul Sep Nov
8/1/1891 to 2/28/1955
Tem
pera
ture
(°F
)
100
75
50
25
0
10
20
30
40
50
60
70
80
90
Oct-06 Oct-07 Oct-08 Oct-09 Oct-10 Oct-11 Oct-12 Oct-13
Tem
pera
ture
(degr
ees
F)

Vashon-Maury Island Water Resources – A Retrospective of Contributions & Highlights
King County Science and Technical Support Section 28 December 2013
More recent regional data indicates that the average annual temperatures in the Pacific Northwest rose
on average about 1.5 degrees F in the last century (Mote, 2003 and WA DOE, 2012). Figure 7 shows
the linear trends of temperature for this region per 100 years (Mote, 2003).
Figure 7. Linear Trends in Temperature in the Pacific Northwest.
Note: Trends are calculated for period 1930 to end of record (at least 1995) and scaled to give
temperature change per 100 year. Positive trends are shown as filled in circles and negative trends are
shown as empty circles. The area of the circle is proportional to the magnitude of the trend (Mote, 2003).
In addition, more recently reported local data from the Sea-Tac airport weather station shows an
increase in temperature since 1949 (Figure 8). The ten-year running average for 2003 through 2012 was
0.42 degrees F above the ten-year running average for 1958 through 2002 (KC, 2013d). A more recent
change in warming rates over the last 10-15 years is present in the data for Sea-Tac (Figure 8) and is also
evident in upper ocean heat content anomalies (Figure 9). This pause in the global warming rates have
been observed in local and global data over the last few decades and continues to be widely discussed
among scientists and various explanations are being considered (The Economist, 2013 and 2013b;
Guemas et al, 2013; PMEL 2013; Tung and Zhou, 2013). An article by the United Kingdom‘s National
Weather Service (UK NWS, 2013) states:
―It is not possible to explain the recent lack of surface warming solely by reductions in
the total energy received by the planet, i.e. the balance between the total solar energy
entering the system and the thermal energy leaving it. Observations of ocean heat
content and of sea-level rise suggest that the additional heat from the continued rise in
atmospheric carbon dioxide concentrations has been absorbed in the ocean and has not
been manifest as a rise in surface temperature. Changes in the exchange of heat
between the upper and deep ocean appear to have caused at least part of the pause in
surface warming, and observations suggest that the Pacific Ocean may play a key role.‖
Trends are calculated for period 1930 to end of record (at least 1995) and scaled to give temperature
change per 100 year. Positive trends are shown as filled in circles and negative trends are shown as
empty circles. The area of the circle is proportional to the magnitude of the trend (Mote, 2003).

Vashon-Maury Island Water Resources – A Retrospective of Contributions & Highlights
King County Science and Technical Support Section 29 December 2013
Figure 8. Temperatures at Seattle-Tacoma International Airport Weather Station.
Figure 8. Upper Ocean Heat Content Anomaly.
Note: Modified from Lyman et al (2010) and updated by PMEL (2013). A zeta-joule is
equal to 1021 joules.
3.2 Precipitation
Precipitation data collection has been sporadic and sparsely located across both islands. The location
and time period of data collection is represented in an updated figure from the Carr Report (Figure 10).
Historical data (1945-1954) indicated average annual precipitation was about 40 inches per year on the
Island (Carr/Assoc., 1983). The Carr Report indicated that weather patterns from the nearby Sea-Tac
airport weather station paralleled that of the station on the Island. Limited data during that time period
indicated decreasing annual total precipitation from west to east across the Island (Figure 11). Total
precipitation measured from seven locations during Water Year 1982 (October through September)
46
48
50
52
54
56
1943 1953 1963 1973 1983 1993 2003 2013
Tem
pera
ture
(degr
ees F)
Temperatures at
SEATAC Airport 1949 - 2012
Mean Annual Temperature
10 Year Running Average
Temperature
Heat
Co
nte
nt
Ano
mal
y (z
eta
-jo
ule
s), 0
-700 m

Vashon-Maury Island Water Resources – A Retrospective of Contributions & Highlights
King County Science and Technical Support Section 30 December 2013
showed an 18 inch difference across the Island; 53.5 inches on the west side of the Island to 35.5 inches
at Point Robinson(Carr/Assoc., 1983). The Carr Report also presented that the Island was receiving
about 18 to 26 percent more precipitation than the Sea-Tac airport weather station.
Figure 10. Location and Duration of Precipitation Data Collection.
Total precipitation measured from seven locations during Water Year 1982 (October through
September) showed an 18 inch difference across the Island; 53.5 inches on the west side of the Island to
35.5 inches at Point Robinson(Carr/Assoc., 1983). The Carr Report also presented that the Island was
receiving about 18 to 26 percent more precipitation than the Sea-Tac airport weather station.

Vashon-Maury Island Water Resources – A Retrospective of Contributions & Highlights
King County Science and Technical Support Section 31 December 2013
Figure 11. Annual Rainfall Contours for Water Year 1982.
Similar to the Carr Report, the GWMP reported annual rainfall on the Island ranging from 40 to 62
inches per year. Monthly rainfall ranged from 0 to 15 inches with driest months in August and
September. This data is consistent with information from the Sea-Tac airport weather station. The
GWMP data for rainfall was reported as calendar years. When recalculated for water years (WY), two
years of data (WY1990 and WY1991) showed about 10 inches of difference across the Island (VMI
GWMC, 1998b). For locations that had a full 12 months of data, a difference of 9, 14 and 12 inches was
observed around the Island for calendar years 1989, 1990 and 1991, respectively.
Average precipitation zones for the Puget Sound area produced by the U.S. Department of Agriculture
(USDA) (Figure 12) and the National Oceanic and Atmospheric Administration (NOAA) (Figure 13),
show a range of 45 to 37 inches per year and 45 to 35 inches per year across the Island, west to east,
respectively (KC, 2005b and 2005c). The USDA used data from 1961-1990; NOAA used data from the
2000s.
Figure source: modified from
Carr/Assoc., 1983.
LEGEND
Total Precipitation WY 1981-1982
Precipitation Station
LEGEND
Precipitation
Stations prior to King
County Involvement
(before 2000)
King County Study
(2000-present)
Note: Locations approximate
Figure source: modified from
Carr Report (1983)

Vashon-Maury Island Water Resources – A Retrospective of Contributions & Highlights
King County Science and Technical Support Section 32 December 2013
Figure 12. Precipitation Zones for 1961-1990 by USDA. Figure 13. Puget Sound Precipitation Zones for 2000’s by
NOAA.
Average Precipitation
1961-1990
(Data from USDA)Figure source: modified from
KC, 2005b Scale approximate
Figure source: NOAA (KC, 2005c)
45”40”
35”
Colvos
Passage
Puget
Sound
Colvos
Passage
Puget
Sound

Vashon-Maury Island Water Resources – A Retrospective of Contributions & Highlights
King County Science and Technical Support Section 33 December 2013
A more comprehensive rainfall data collection network was implemented for the WRE (Figure 2). Daily,
monthly and annual totals were reported in annual reports to the GWP Committee. Results from the
WRE related locations are shown in Table 4. WRE results indicated that since 2005 the Island receives
between about -4 and 15 percent of the precipitation observed at the Sea-Tac airport and that this
difference occurs about 4.5 miles southwest from Sea-Tac airport. In addition, this range occurs over a
small geographic area of the Island.. Figure 4 shows the cumulative daily precipitation totals for each
precipitation station over water years 2005 through 2012.
Table 4. Total Rainfall.
North
Vashon
Mid
Vashon
NW
Judd
Creek
South
Vashon
Maury
Island
East
Maury
43U 28U 28Y 65U 36U 36V
1999 57.3 -- 49.27
2000 45.1 46.1 36.8
2001 32.9 34.7 28.06
2002 43.9 49.8 39.48
2003 36.2 37.7 32.33
2004 44.1 52.1 40.38
2005 36.6 39.2 31.2* 31.9 12.5* 30.38
2006 44.1 46.8 45.9 43.7 35.8 39.33**
2007 61.6 54 54.2 50.6 25.0* 47.32
2008 43.8 38.7 36.3 28.5* 27.4* 34.05
2009 39 37 40.1 35.1 19.1* 33.98
2010 59.7 51.3 51 47.3 27.3* 45.26
2011 57.2 51.7 52.9 45.6 44.9 44.52
2012 47.18 41.19 42.24 36.49 36.17 37.27
Average (all years) 46.3 44.1 38.4
Average (2005-2012) 48.6 -- 39.0
Water YearSea-
Tac
Sites started in 2005
45.0 46.1 43.1 --
Moved
site to
NW Judd
Creek
(28Y)
North
Vashon
Mid Vashon
Northwest
Judd
Creek
South
Vashon
Maury
Island
East
Maury
43U 28U 28Y 65U 36U 36V
1999 57.3 -- 49.27
2000 45.1 46.1 36.8
2001 32.9 34.7 28.06
2002 43.9 49.8 39.48
2003 36.2 37.7 32.33
2004 44.1 52.1 40.38
2005 36.6 39.2 31.2* 31.9 12.5* 30.38
2006 44.1 46.8 45.9 43.7 35.8 39.33**
2007 61.6 54 54.2 50.6 25.0* 47.32
2008 43.8 38.7 36.3 28.5* 27.4* 34.05
2009 39 37 40.1 35.1 19.1* 33.98
2010 59.7 51.3 51 47.3 27.3* 45.26
2011 57.2 51.7 52.9 45.6 44.9 44.52
2012 47.18 41.19 42.24 36.49 36.17 37.27
Average (all years) 46.3 44.1 38.4
Average (2005-2012) 48.6 -- 39.0
Notes:
39.2 Color denotes maximum value for water year; calculated using full dataset (2005-2012 years only).
35.1 Color denotes minimum value for water year; calculated using full dataset (2005-2012 years only).
*= refers to sites with missing data – incomplete water year dataset.
^ = refers to sites with incomplete water years – average calculated on 7 vs. 8 years.
**= refers to one day missing in data
Data collected at King County gauge sites and local weather reference site, Sea-Tac.
Water Year is a 12 month period starting Oct-1 through Sept-30; Water Year 2012 is from Oct-2011 through Sept-2012
Water Year Sea-Tac
Sites started in 2005
45.0 46.1 43.1 --
Moved site to
Northwest Judd Creek
(28Y)

Vashon-Maury Island Water Resources – A Retrospective of Contributions & Highlights
King County Science and Technical Support Section 34 December 2013
Figure 14. Cumulative Daily Precipitation at Vashon-Maury Island Stations per Water
Year.
The updated WRE 2007 rainfall map (Figure 15) shows a 13-inch variation across the Island with
typically more rainfall on the west and less on the east side, specifically on eastern tip of Maury Island.
This is similar to the Carr Report 1983 map (Figure 11). It is likely that due the placement of off-island
data points and the method used to create the map created the different pattern. Figure 16 is the most
recent map of annual precipitation totals generated by King County and includes all data from 2005
through 2011. The pattern of decreasing annual rainfall totals across the Island from west to east with
the East Maury Island station consistently drier than the rest of the Island is similar to that of all earlier
mapping exercises (KC, 2010b).
0
10
20
30
40
50
60
70
10/30/2004 10/30/2005 10/30/2006 10/30/2007 10/29/2008 10/29/2009 10/29/2010 10/29/2011 10/28/2012
Cum
ula
tive
Pre
cipitat
ion (
inch
es)
North Vashon - 43UWest Judd - 28YMaury Island - 36UEast Maury Island - 36VSouth Vashon-Tahlequah - 65U
2004 2005 2006 2007 2008 2009 2010 2011 2012

Vashon-Maury Island Water Resources – A Retrospective of Contributions & Highlights
King County Science and Technical Support Section 35 December 2013
Figure 15. Precipitation Totals Map of Vashon-Maury
Island for Water Year 2007.
Figure 16. Precipitation Averages Map of Vashon-Maury
Island for Water Years 2005-2011.
Note: Locations approximate
LEGEND
Averaged Precipitation
(inches per water year)
2005-2011
Stations
Inches/yearColvos
PassagePuget
Sound
Colvos
Passage
Puget
Sound

Vashon-Maury Island Water Resources – A Retrospective of Contributions & Highlights
King County Science and Technical Support Section 36 December 2013
3.3 Stream Flows
Judd Creek is the largest stream basin on the Island with 3,292 acres and flows into Puget Sound
through the Quartermaster Harbor (Figure 1; Carr/Assoc., 1983). Mileta Creek is the principal surface
water drainage on Maury Island at 1,546 acres (Carr/Assoc., 1983), although it only represents about 33
percent of the total drainage area on Maury Island. Stream flow data collection on the Island has been
conducted in various creeks and basins across Vashon-Maury Island. The location of data collection is
represented in an updated figure from the Carr Report (Figure 17) and in a compilation map of locations
in Figure 2.
Figure 17. Location of Stream Gage Data Collection Locations on Vashon-Maury Island.
Note: Locations approximate
Figure source: modified from Carr Report (1983)
LEGEND
Stream Gage
Carr Report
GWMP
Colvos
Passage
Puget
Sound
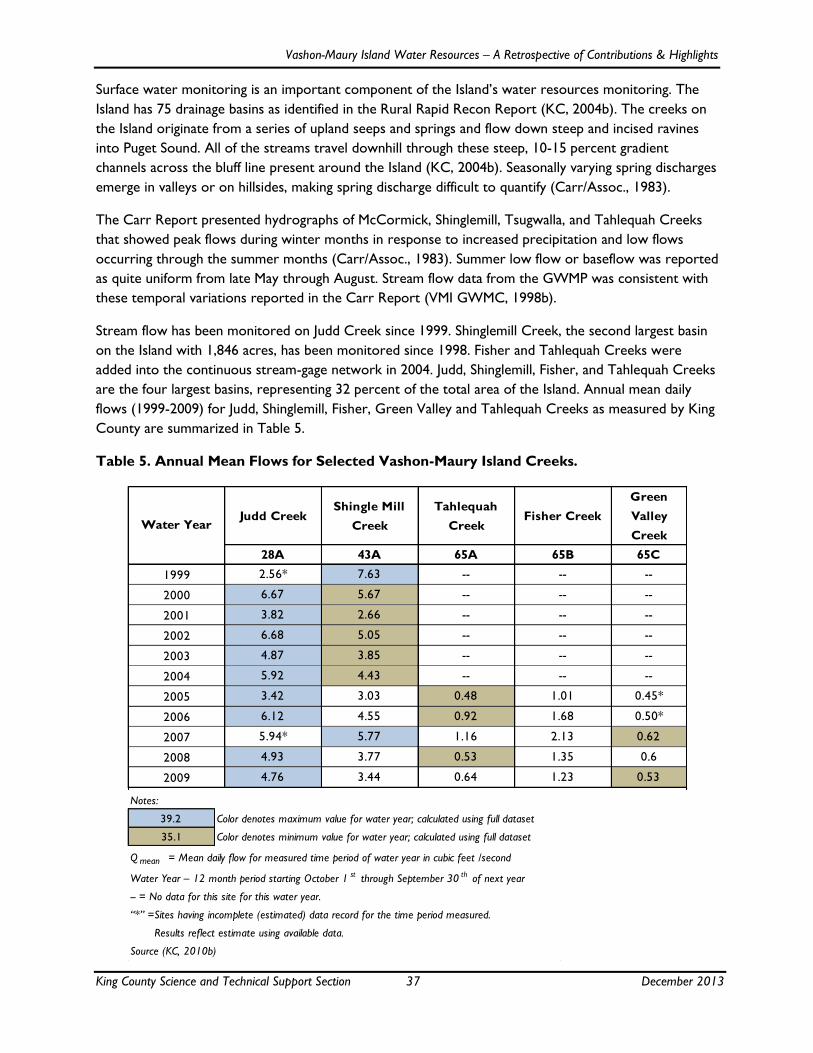
Vashon-Maury Island Water Resources – A Retrospective of Contributions & Highlights
King County Science and Technical Support Section 37 December 2013
Surface water monitoring is an important component of the Island‘s water resources monitoring. The
Island has 75 drainage basins as identified in the Rural Rapid Recon Report (KC, 2004b). The creeks on
the Island originate from a series of upland seeps and springs and flow down steep and incised ravines
into Puget Sound. All of the streams travel downhill through these steep, 10-15 percent gradient
channels across the bluff line present around the Island (KC, 2004b). Seasonally varying spring discharges
emerge in valleys or on hillsides, making spring discharge difficult to quantify (Carr/Assoc., 1983).
The Carr Report presented hydrographs of McCormick, Shinglemill, Tsugwalla, and Tahlequah Creeks
that showed peak flows during winter months in response to increased precipitation and low flows
occurring through the summer months (Carr/Assoc., 1983). Summer low flow or baseflow was reported
as quite uniform from late May through August. Stream flow data from the GWMP was consistent with
these temporal variations reported in the Carr Report (VMI GWMC, 1998b).
Stream flow has been monitored on Judd Creek since 1999. Shinglemill Creek, the second largest basin
on the Island with 1,846 acres, has been monitored since 1998. Fisher and Tahlequah Creeks were
added into the continuous stream-gage network in 2004. Judd, Shinglemill, Fisher, and Tahlequah Creeks
are the four largest basins, representing 32 percent of the total area of the Island. Annual mean daily
flows (1999-2009) for Judd, Shinglemill, Fisher, Green Valley and Tahlequah Creeks as measured by King
County are summarized in Table 5.
Table 5. Annual Mean Flows for Selected Vashon-Maury Island Creeks.
Judd Creek Shingle Mill
Creek
Tahlequah
CreekFisher Creek
Green
Valley
Creek
28A 43A 65A 65B 65C
1999 2.56* 7.63 -- -- --
2000 6.67 5.67 -- -- --
2001 3.82 2.66 -- -- --
2002 6.68 5.05 -- -- --
2003 4.87 3.85 -- -- --
2004 5.92 4.43 -- -- --
2005 3.42 3.03 0.48 1.01 0.45*
2006 6.12 4.55 0.92 1.68 0.50*
2007 5.94* 5.77 1.16 2.13 0.62
2008 4.93 3.77 0.53 1.35 0.6
2009 4.76 3.44 0.64 1.23 0.53
Water Year
Notes:
39.2 Color denotes maximum value for water year; calculated using full dataset
35.1 Color denotes minimum value for water year; calculated using full dataset
Q mean = Mean daily flow for measured time period of water year in cubic feet /second
Water Year – 12 month period starting October 1st
through September 30th
of next year
-- = No data for this site for this water year.
“*” =Sites having incomplete (estimated) data record for the time period measured.
Results reflect estimate using available data.
Source (KC, 2010b)
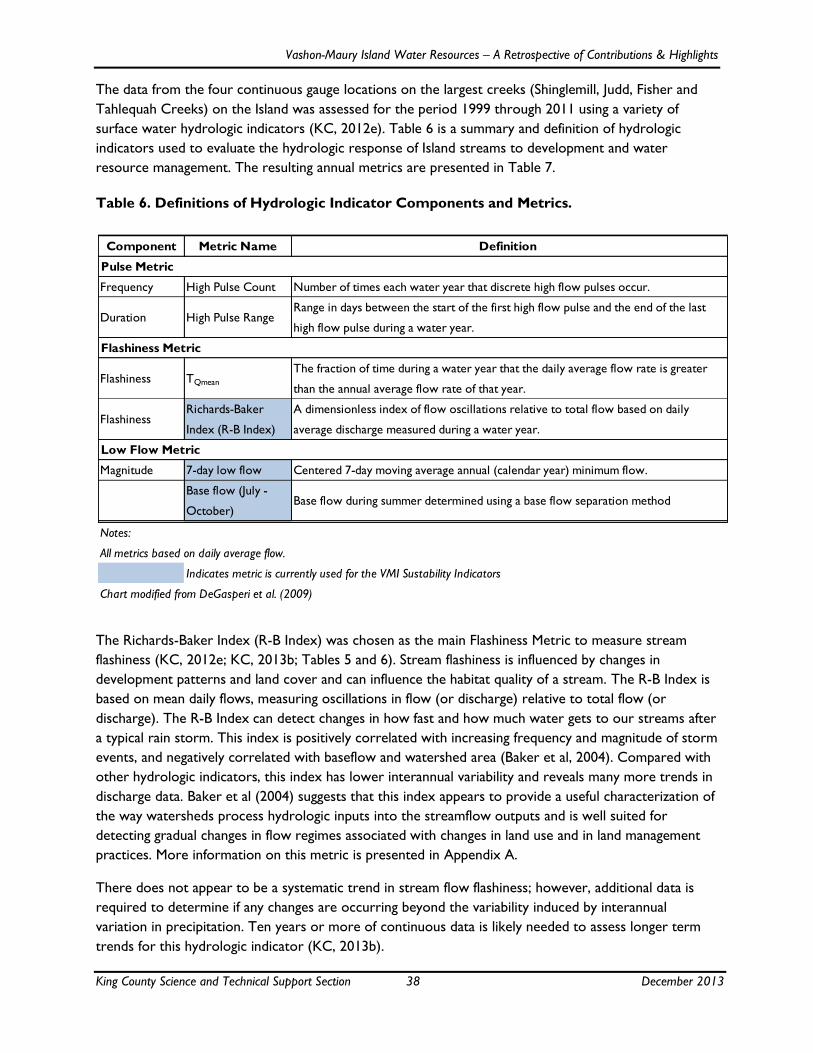
Vashon-Maury Island Water Resources – A Retrospective of Contributions & Highlights
King County Science and Technical Support Section 38 December 2013
The data from the four continuous gauge locations on the largest creeks (Shinglemill, Judd, Fisher and
Tahlequah Creeks) on the Island was assessed for the period 1999 through 2011 using a variety of
surface water hydrologic indicators (KC, 2012e). Table 6 is a summary and definition of hydrologic
indicators used to evaluate the hydrologic response of Island streams to development and water
resource management. The resulting annual metrics are presented in Table 7.
Table 6. Definitions of Hydrologic Indicator Components and Metrics.
The Richards-Baker Index (R-B Index) was chosen as the main Flashiness Metric to measure stream
flashiness (KC, 2012e; KC, 2013b; Tables 5 and 6). Stream flashiness is influenced by changes in
development patterns and land cover and can influence the habitat quality of a stream. The R-B Index is
based on mean daily flows, measuring oscillations in flow (or discharge) relative to total flow (or
discharge). The R-B Index can detect changes in how fast and how much water gets to our streams after
a typical rain storm. This index is positively correlated with increasing frequency and magnitude of storm
events, and negatively correlated with baseflow and watershed area (Baker et al, 2004). Compared with
other hydrologic indicators, this index has lower interannual variability and reveals many more trends in
discharge data. Baker et al (2004) suggests that this index appears to provide a useful characterization of
the way watersheds process hydrologic inputs into the streamflow outputs and is well suited for
detecting gradual changes in flow regimes associated with changes in land use and in land management
practices. More information on this metric is presented in Appendix A.
There does not appear to be a systematic trend in stream flow flashiness; however, additional data is
required to determine if any changes are occurring beyond the variability induced by interannual
variation in precipitation. Ten years or more of continuous data is likely needed to assess longer term
trends for this hydrologic indicator (KC, 2013b).
Component Metric Name Definition
Pulse Metric
Frequency High Pulse Count Number of times each water year that discrete high flow pulses occur.
Duration High Pulse RangeRange in days between the start of the first high flow pulse and the end of the last
high flow pulse during a water year.
Flashiness Metric
Flashiness TQmean
The fraction of time during a water year that the daily average flow rate is greater
than the annual average flow rate of that year.
FlashinessRichards-Baker
Index (R-B Index)
A dimensionless index of flow oscillations relative to total flow based on daily
average discharge measured during a water year.
Low Flow Metric
Magnitude 7-day low flow Centered 7-day moving average annual (calendar year) minimum flow.
Base flow (July -
October)Base flow during summer determined using a base flow separation method
Notes:
All metrics based on daily average flow.
Indicates metric is currently used for the VMI Sustability Indicators
Chart modified from DeGasperi et al. (2009)

Vashon-Maury Island Water Resources – A Retrospective of Contributions & Highlights
King County Science and Technical Support Section 39 December 2013
Table 7. Hydrologic Flow Indicators for Selected Vashon-Maury Island Creeks.
Site
NameYear
High Pulse
Count
High Pulse
RangeTQmean R-B Index
7-day Low
Flow (July-
October)
Base Flow (July -
October)
1999 9 129 0.25 0.3 2.5 2.7
2000 14 114 0.31 0.24 2 2.2
2001 1 0 0.35 0.16 1.4 1.6
2002 11 153 0.24 0.37 1.4 1.6
2003 6 101 0.22 0.28 1.5 1.8
2004 8 104 0.25 0.35 1.5 1.6
2005 4 127 0.24 0.27 1.4 1.5
2006 5 44 0.17 0.34 1.6 1.8
2007 9 126 0.23 0.35 1.8 2
2008 5 69 0.22 0.28 1.4 1.7
2009 8 181 0.21 0.26 1.4 1.6
2010 14 147 0.24 0.35 1.4 1.9
2011 14 197 0.22 0.45 2 2.2
2000 18 215 0.34 0.32 1.9 2.2
2001 8 150 0.38 0.23 1.4 1.8
2002 14 183 0.25 0.39 1.5 1.7
2003 8 120 0.28 0.29 1.3 1.6
2004 12 121 0.3 0.32 1.2 1.6
2005 7 130 0.23 0.31 1.2 1.5
2006 5 107 0.2 0.32 1.2 1.5
2007 15 139 0.32 0.33 1.5 2
2008 10 134 0.28 0.3 1.3 1.5
2009 10 189 0.22 0.35 1.1 1.5
2010 16 315 0.29 0.33 1.4 2
2011 14 218 0.26 0.39 1.8 2.2
2005 3 107 0.33 0.2 0.4 0.5
2006 4 66 0.27 0.23 0.4 0.6
2007 14 147 0.32 0.25 0.6 0.8
2008 6 57 0.37 0.21 0.3 0.5
2009 6 181 0.32 0.24 0.4 0.5
2010 13 315 0.38 0.22 0.4 0.7
2011 17 218 0.34 0.24 0.6 0.7
2005 4 127 0.24 0.24 0.2 0.2
2006 4 66 0.22 0.29 0.2 0.2
2007 11 139 0.25 0.33 0.3 0.3
2008 4 41 0.29 0.26 0.2 0.2
2009 6 181 0.23 0.32 0.2 0.3
2010 13 315 0.33 0.26 0.2 0.3
2011 13 218 0.28 0.32 0.3 0.4
Indicates metric is currently used for the VMI Sustability Indicators
Chart modified from KC (2012e)
Shinglemill
Creek
Judd Creek
Fisher
Creek
Tahlequah
Creek
Note: Four sites have continuous gauging data that can be assessed using different flow metrics for the period of record.

Vashon-Maury Island Water Resources – A Retrospective of Contributions & Highlights
King County Science and Technical Support Section 40 December 2013
Under the Water Resources Act of 1971, Ecology is authorized to ―establish minimum water flows or
levels for streams, lakes, or other public waters for the purposes of protecting fish, game, birds, or
other wildlife resources, or recreational or aesthetical values of public waters. Judd, Shinglemill, Fisher
and Christensen Creeks have been designated as closed basins by Ecology to preserve flows. Judd Creek
was closed in 1951 on the basis that there were no waters available for further appropriation for
consumptive use. Christensen, Fisher and Shinglemill Creeks were closed in 1981 on the basis of the
need to maintain instream flow for anadromous fish.
The 7-day moving average low-flow rate is a low flow metric used to measure the changes in summer
flows (KC, 2012e; Tables 6 and 7). This metric is important as it is a measure of the amount of the
minimum amount of water in the stream during summer, a time critical for aquatic biota, such as salmon.
Data analysis indicated that 2001 – 2010 summer low flows were maintained or improved (KC, 2013b).
Baseflow Index is a metric used to measure the magnitude of stream flow sourced from groundwater
inflow (i.e., baseflow) relative to the total stream flow (KC, 2012e; Tables 5 and 6). The Baseflow Index
can indicate the importance of groundwater inflows during summer months that typically have lower
flows. Ecology estimated the proportion of baseflow relative to total stream flow (i.e., Baseflow Index) in
selected Washington rivers and streams (Sinclair and Pitz, 1999). Over 500 active and inactive gauging
stations with at least three years of data were included in the study. On average, baseflow represented
approximately 68 percent of total annual stream flow for the stations evaluated. Estimated baseflow
contributions to stream flow for the typical low flow months of July, August, September, and October
averaged 86, 86, 77, and 69 percent, respectively (Sinclair and Pitz, 1999).
On the Island, the Baseflow Index has been estimated for Shinglemill, Judd, Fisher and Tahlequah Creeks
(KC, 2012e; Table 8). For the period of record, the ratio of baseflow to total annual stream flow was 70,
69, 79 and 74 percent, respectively. Shinglemill Creek had the highest percentage of baseflow during the
summer period with an average of 95 percent. Judd and Fisher Creeks had a slightly lower value of 89
percent. Tahlequah Creek had a value of 91 percent, (KC, 2012e; Table 8). Groundwater contribution
to the total annual stream flow is between 69 to 79 percent. Relative baseflow contributions during
summer were higher by about 17 to 25 percent. Results suggest that reductions in groundwater
discharge to streams during this period, as a result of increased groundwater withdrawals for example,
could impact the instream flows needed to sustain fish and maintain water quality.
Table 8. Total Annual and Summer Month Baseflows for Selected Vashon-Maury Island
Creeks.
Creeks
Number
of years
of data
Annual July August September October Jul-Oct
average
Shinglemill 13 70% 98% 97% 97% 89% 95%
Judd 12 69% 96% 91% 89% 78% 89%
Fisher 7 79% 95% 93% 87% 83% 89%
Tahlequah 7 74% 96% 97% 89% 83% 91%
Note: Values are shown as percentages of baseflow to total stream flow.
Chart modified from KC (2012e)

Vashon-Maury Island Water Resources – A Retrospective of Contributions & Highlights
King County Science and Technical Support Section 41 December 2013
4.0. ISLAND-WIDE WATER RESOURCES
This section presents and summarizes the water resources conditions on Vashon-Maury Island. The
following subjects are discussed in more detail and summarized in Section 5.0 (Summary of Scientific
Findings).
Water Resources Usage
Groundwater Quantity
Hydrologic Water Budget
Marine Water Quality
Freshwater Surface Water Quality
Groundwater Quality
4.1 Water Resources Usage
Water use is described in terms of both the purpose of use and the amount of water used for each
purpose. The major use of water on Vashon-Maury Island is for municipal and domestic purposes.
Lesser uses include agriculture and commercial purposes (KC, 2005c). Water use for municipal and
domestic purposes depends upon the number of residences and population size. Figure 18 shows the
locations of known permit exempt wells and public water systems on the Island (KC, 2005c).
The population of the Island is growing steadily, approximately two percent per year, from 6,516 in
1970; to 7,377 in 1980; to 9,309 in 1990; to 10,100 in 2000 (KC, 2009b); and 10,624 in 2010 (U. S.
Census, 2013b). According to the Puget Sound Regional Council, the population of the Island will
continue to grow at a rate of about 10 percent, or 100 people per year (KC, 2009b). The U.S. Census
Bureau reported in 2013 that the annual population growth in King County and Washington State has
been about 1.97 and 1.3 percent, respectively, since 2010 (U. S. Census Bureau, 2013a).
The Carr Report presented that the estimated average daily individual water use was 120 gallons per
day (gpd) (Carr/Assocs., 1983). The GWMP revised that number to be 103 gpd (VMI GWMC, 1998b).
In 2005, the municipal and domestic water demand on the Island was estimated to be approximately 375
MGY. The breakdown of municipal versus domestic was estimated to be 282 MGY for residences
served by public water systems and 73 MGY for residences served by exempt wells. About 20 MGY is
used by commercial connections (KC, 2005c).
The WRE started a unique project by metering self-supplied wells. On the Island, there are at least
1,000 wells that are self-supplied; also known as permit-exempt wells. It is unknown how much water is
withdrawn at these types of wells. The Groundwater Permit to Withdraw RCW 90.44.050 is a
Washington State (WA) water use law that allows permit-exempt wells to use up to 5,000 gpd for
domestic purposes. Eight people volunteered to be part of a study assessing the usage of self-supplied
wells (Figure 3).
The water usage data has yielded a range of usage patterns for a small subset of exempt well users. One
volunteer consistently uses a low volume of water daily of about 30 gpd compared to a summertime
usage of >800 gpd for another. On average, usage is approximately 100 gpd per well. Monthly totals

Vashon-Maury Island Water Resources – A Retrospective of Contributions & Highlights
King County Science and Technical Support Section 42 December 2013
from a few of the volunteers show increases in usage during June through October (Figure 19). Other
volunteers show a more consistent usage pattern throughout the year.
Figure 18. Locations of Exempt Wells and Public Water Systems (2012).
Group A public water providers have a range of average daily usage of 100 to 200 gpd per connection.
Data from several of these public water systems show increased usage during May through October
with 60 to 75 percent of the total annual use during this period, similar to some exempt well users
(Figure 19).
LEGEND
Figure modified from KC, 2013b.
Colvos
Passage
Puget
Sound
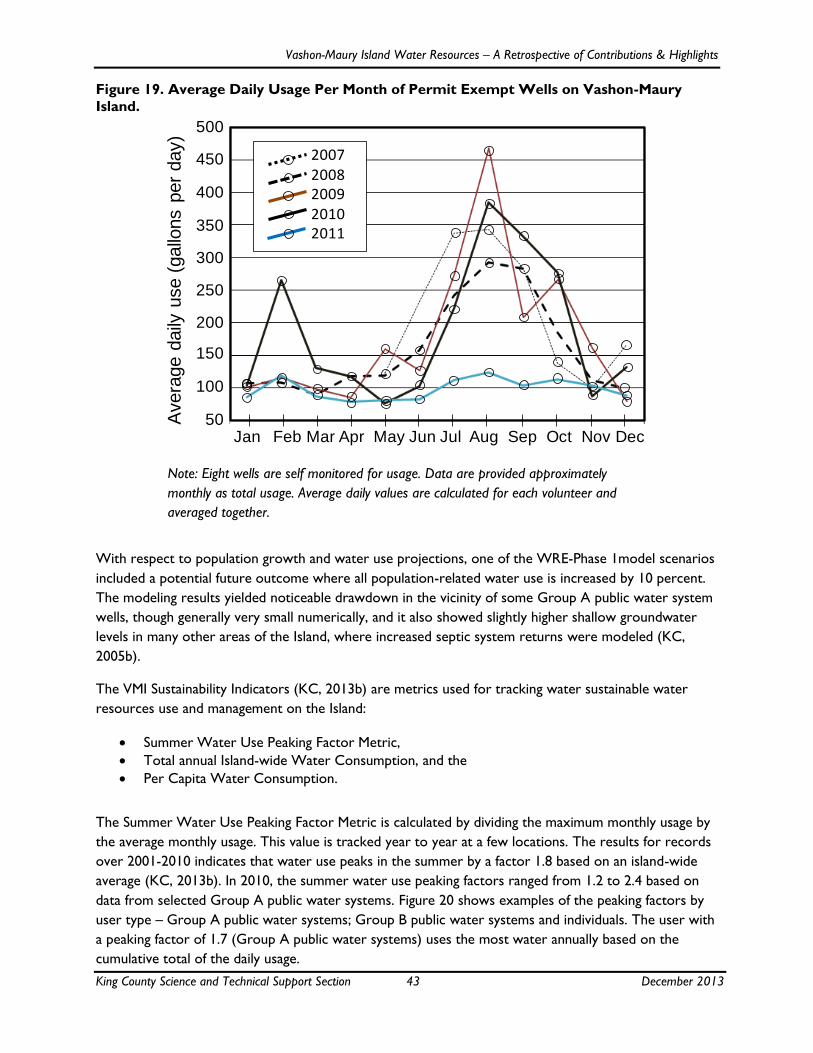
Vashon-Maury Island Water Resources – A Retrospective of Contributions & Highlights
King County Science and Technical Support Section 43 December 2013
Figure 19. Average Daily Usage Per Month of Permit Exempt Wells on Vashon-Maury
Island.
Note: Eight wells are self monitored for usage. Data are provided approximately
monthly as total usage. Average daily values are calculated for each volunteer and
averaged together.
With respect to population growth and water use projections, one of the WRE-Phase 1model scenarios
included a potential future outcome where all population-related water use is increased by 10 percent.
The modeling results yielded noticeable drawdown in the vicinity of some Group A public water system
wells, though generally very small numerically, and it also showed slightly higher shallow groundwater
levels in many other areas of the Island, where increased septic system returns were modeled (KC,
2005b).
The VMI Sustainability Indicators (KC, 2013b) are metrics used for tracking water sustainable water
resources use and management on the Island:
Summer Water Use Peaking Factor Metric,
Total annual Island-wide Water Consumption, and the
Per Capita Water Consumption.
The Summer Water Use Peaking Factor Metric is calculated by dividing the maximum monthly usage by
the average monthly usage. This value is tracked year to year at a few locations. The results for records
over 2001-2010 indicates that water use peaks in the summer by a factor 1.8 based on an island-wide
average (KC, 2013b). In 2010, the summer water use peaking factors ranged from 1.2 to 2.4 based on
data from selected Group A public water systems. Figure 20 shows examples of the peaking factors by
user type – Group A public water systems; Group B public water systems and individuals. The user with
a peaking factor of 1.7 (Group A public water systems) uses the most water annually based on the
cumulative total of the daily usage.
Jan Feb Mar Apr May Jun Jul Aug Sep Oct Nov Dec
Avera
ge d
aily
use (
gallo
ns p
er
day)
500
450
400
350
300
250
200
150
100
50
200
20072008200920102011

Vashon-Maury Island Water Resources – A Retrospective of Contributions & Highlights
King County Science and Technical Support Section 44 December 2013
Figure 20. Example of Summer Water Use Peaking Factors by User Type.
The 10 year (2001-2010) average of total island-wide water consumption is 515 MGY (Figure 21). The
annual total consumption ranged from 496 to 535 MGY during this period. Typically, consumption
increased during periods with lower rainfall totals and decreased during periods with higher rainfall
totals.
Figure 21. Estimated Total Island-wide Water Consumption for Group A & B Public Water
Systems, Individuals and Irrigators.
Note: Individuals and Group B public water system well data represents ~10 percent of
population served each; Group A public water system well data represents ~80 percent
of population served.
Jan Feb Mar Apr May Jun Jul Aug Sep Oct Nov Dec
Mo
nth
ly U
sa
ge
(g
allo
ns p
er
da
y)
900
800
700
600
500
400
300
200
100
0
Group A PWS
1.7
3.7
Group B PWS
Individual
Group A PWS
2.3
1.1
8.1
Peaking Factors
0
100
200
300
400
500
600
2001 2002 2003 2004 2005 2006 2007 2008 2009 2010
Mill
ion
s o
f gal
lon
s p
er y
ear
Year
PWS A PWS B Exempt Irrigation
PWS Group A: 260 MGY
PWS Group B: 10 MGY
Individuals: 97 MGY
Irrigation: 122 MGY
2001 2002 2003 2004 2005 2006 2007 2008 2009
600
500
400
300
200
100
0To
tal I
sla
nd
-wid
e W
ate
r U
sa
ge
(M
GY
)

Vashon-Maury Island Water Resources – A Retrospective of Contributions & Highlights
King County Science and Technical Support Section 45 December 2013
Per capita consumption is calculated by dividing total annual usage by total population and is tracked
from year-to-year. The overall per capita water consumption during the time period 2001 through 2010
was 83 gpd (KC, 2013b).
4.2 Groundwater Quantity Monitoring
The VMI Ground Water Management Area (VMI GWMA) was designated a Sole Source Aquifer by the
U.S. Environmental Protection Agency (USEPA) in June 1994. While the singular term ―aquifer‖ is used,
groundwater resources actually occur in many discrete and discontinuous locations. Data indicates that
aquifers underlying the Island are not connected to off-Island sources (Carr/Assoc., 1983); all water
sources (groundwater, rainwater and surface drainages, springs, and seeps) on the Island are recharged
by precipitation falling on the island.
4.2.1 Aquifer Zones
Various studies have divided the Island groundwater resources into two major water bearing zones. In
addition to the reports presented in this document, the following are other hydrogeologic
characterizations completed for both local and regional scale studies:
Maury Island Gravel Mine Hydrogeologic Impact Assessment (PGG, 2000)
Vashon Island Landfill Hydrogeologic Report Update (B&H/UES, 2004)
Water Resources and Geology of the Kitsap Peninsula and Certain Adjacent Islands (Garling et al, 1965)
Although discussed earlier in Section 2.0 (Technical Activities & Reports), the various aquifer
terminology are briefly explained again here. The Carr Report in 1983 identified two island wide aquifers
– a Principal and a Deep aquifer. This assessment was based on the elevations of the screen zones,
usually constructed to be centered at the water level elevation in a well. Wells with a screened elevation
above mean sea level (MSL) were typically defined as being screened in the Principal aquifer while those
locations with a screened elevation below MSL are defined as screened in the Deep aquifer. The GWMP
in 1998 provided more detailed analyses of the hydrostratigraphy on the Island. Four hydrostratigraphic
zones were described as generally laterally continuous across the Island with local areas of discontinuity
(VMI GWMC, 1998b). These zones were defined as:
Name Average Water Level Elevation Screen Elevation
(feet above Mean Sea Level (MSL)) (feet above MSL)
Zone 1 255 varies
Zone 2 97 varies
Zone 3 18 at or below MSL
Zone 4 11 >200
After the surficial geology maps of the Island were updated by University of Washington staff in 2003,
King County merged this new information of geologic units and the hydrostratigraphic zones. The
resulting correlation of the aquifer names are:

Vashon-Maury Island Water Resources – A Retrospective of Contributions & Highlights
King County Science and Technical Support Section 46 December 2013
Carr Report GWMP WRE
Principal Aquifer Zone 1 Zone 1 - shallow Vashon recessional outwash deposits (Qvr) and
Principal/ Main Vashon advance outwash deposits (Qva) Zone 2
Deep Aquifer
Zone 3 Zone 2 – Deep 1 Pre Fraser coarse grained deposits (Qpfc )
Zone 4 Zone 3 - Deep 2 Olympia coarse grained deposits (Qpoc) and
deeper units
Figure 22 is a geologic cross section that is aligned along a north-south transect labeled A2-A2‘ (location
displayed in Figure 1on the southern end of Vashon Island. The layer cake like image of the geologic
units is common across the Island. The WRE aquifer zones are described in the legend and emphasized
with a pattern, showing Zone 1 - Principal/ Main aquifer being the Vashon advance outwash deposits
(Qva); Zone 2 – Deep 1 Pre Fraser coarse grained deposits (Qpfc) and Zone 3 – Deep 2 Olympia
coarse grained deposits (Qpoc) and deeper units. Zone 2 is present in this area of the Island as the
Possession Drift – coarse grained deposits (Qpdc).
Figure 22. WRE Aquifer Zones in Geologic Cross Section A2-A2’ on Southern End of
Vashon Island.
0 ft 2500 ft 5000 ft 7500 ft
Island Geologic Units
Qvrl Vashon recessional lacustrine deposits
Qvt Vashon till
Qva Vashon advance outwash deposits
Qpff Pre-Fraser glaciation age, fine-grained deposits
Qpdc Possession Drift, coarse-grained deposits
Qos Owen silt
Qdbt Double Bluff till
Qpof Pre-Olympia deposits, fine-grained deposits
Qpoc Pre-Olympia deposits, coarse-grained deposits
Figure modified from GeoMapNW, 2004.
400
300
200
100
0
-100
Qva
Qpoc
Qpdc
Qpff
QosQpof
Qdbt
Qvt
Ele
vati
on (ft
MSL)
Zone 1 – Principal/Main aquifer
(Qva)
Zone 2 – Deep 1 Pre Fraser
coarse grained deposits (Qpfc)
(and in this cross section (Qpdc)
Zone 3 – Deep 2 Olympia
coarse grained deposits (Qpoc)
and deeper units
WRE Aquifer Zones
? ?
?
??
? ?
??
?
?
A2’A2

Vashon-Maury Island Water Resources – A Retrospective of Contributions & Highlights
King County Science and Technical Support Section 47 December 2013
4.2.2 Groundwater Level Responses and Trends
Groundwater level data collection on the Island has been sporadic and sparsely located across the Island
for many years. The Carr Report indicated that water level fluctuations showed different patterns in the
Principal aquifer from those in the Deep aquifer (Carr/Assoc., 1983). Groundwater levels measured
from 61 wells showed responses to seasonal and long-term recharge variations, tidal and barometric
influences and pumping. The largest responses were observed in the recharge areas of the Principal
aquifer.
In the GWMP, seasonal fluctuations of the water levels were reported in Zone 1 wells up to 17.61 feet;
Zone 2 up to three feet; Zone 3 up to nine feet, and in Zone 4, up to 2.79 feet change (VMI GWMC,
1998b). These fluctuations tended to correlate with rainfall (with lags of time up to four months), with
seasonal highs in during summer months and lows during fall months (VMI GWMC, 1998b). Some wells
showed little to no seasonal influence, indicating the wells were not screened in units directly recharged
by rainfall.
Long-term trends of increasing water level elevations up to two feet per year in some Zone 1wells
correlated to increasing rainfall trends during 1989-1992 (VMI GWMC, 1998b). In general, the GWMP
reported that long-term trends indicated that the hydrostratigraphic zones were generally stable and
had not been affected by ground water withdrawals (VMI GWMC, 1998b).
Water levels are currently being measured in multiple water bearing zones on the Island with the help of
volunteers and monitoring wells (Figure 3), Water purveyors monitor their sources on a regular basis
and have reported their data to King County upon request. Since 2006, the King County‘s Groundwater
Program has been collecting water level data at 10 monitoring well locations. These wells typically have
continuous data loggers recording daily water level information. Additional water level data is collected
during annual water quality sampling if possible.
The frequency of this dataset varies from monthly to annual to longer periods of time between
measurements. Sixty of the locations measured have water level data during 2001-2010. The majority of
these locations are not being actively monitored or monitored on an infrequent (once a year) basis. The
volunteer program was started in 2001 for well owners to self monitor their water levels for 12
months. Many of the owners in volunteer program continued to monitor after the initial period;
however, by 2012, only four people are still actively self-monitoring water levels. Several of the
volunteer locations are some of the longest water level datasets on the Island. No location appears to
have a continuous record of water level data since the Carr Report in the1980‘s.
Overall, plotted well data from 2001 through 2012 indicated that levels were generally stable with no
significant declines (Figure 23) (KC, 2013d). Water level records from different wells can be quite
variable, as shown in Figures 23, 24, and 25. Figure 24 shows that at self-monitored well GWL_w-09
there was about ten feet of variability in measurements within the year as well as year to year changes.
Figure 25 shows that at self-monitored well GWL_w-06/GrpA_55376_01 there have been small changes
in measurements within the year and gradual changes year to year.

Vashon-Maury Island Water Resources – A Retrospective of Contributions & Highlights
King County Science and Technical Support Section 48 December 2013
Figure 23. Groundwater Levels on Vashon-Maury Island from 2000 through 2012.
Figure 24. Depth to Water at Self Monitored Well GWL_w-09 in WRE Zone 2.
Note: Data collected shows about 10 feet variability in measurements within the year as well as year to
year changes.
10
30
50
70
90
110
130
150
170
190
210W
ater
Leve
l Ele
vation (
ft a
bove
MSL
)
GWL_w-01
GWL_w-02
GWL_w-06
GWL_w-09
GWL_w-13
2001 2002 2003 2004 2005 2006 2007 2008 2009 2010 2011 2012
Zone 1
Zone 2
Zone 3
200
205
210
215
220
Depth
to W
ater
Level (
feet bgs
)
2001 2002 2003 2004 2005 2006 2007 2008 2009 2010 2011 2012
Well GWL_w-09

Vashon-Maury Island Water Resources – A Retrospective of Contributions & Highlights
King County Science and Technical Support Section 49 December 2013
Figure 25. Depth to Water at Self Monitored Well GWL_w-06/GrpA_55376_01in WRE
Zone 1.
Note: Data collected shows small changes within the year and gradual changes year to year.
An overall assessment for the VMI Sustainability Indicator of water level changes for 2001 through 2010
show that there was mostly no change in water levels when comparing a baseline average (based on
2001to 2008 data) to recently reported data (KC, 2013d). Figure 26 provides a snapshot of recent
status conditions for monitored well water levels with one site having had lower recent water level
elevation data compared to that site‘s baseline while one site had an increase in that site‘s recent water
level data. Eleven sites had no change in the water levels when comparing the baseline average to recent
data (2009-2010). The remaining 45 sites had too few data points to assess a baseline average. Appendix
A describes the methods for analysis for the VMI Sustainability Indicators in more detail.
4.2.3 Groundwater Contour Maps
Water table elevation contour maps within the following water bearing zones have been published:
Principal Aquifer Carr Report — 1982
Zone I Aquifer Groundwater Management Plan — 1991
Principal/Main Qva Aquifer Water Resource Evaluation — 2005
The Carr Report presented groundwater elevation contour maps showing generally higher levels on the
west side of Vashon Island and numerous local water level highs or mounds (Figure 27). On Maury
Island, water level mounds appeared at each end of the Island (Carr/Assoc., 1983). Maps show flow
directions in the Principal aquifer as generally to the east and west from the topographic high that
extends along a north-south axis on Vashon Island toward Colvos Passage and Quartermaster Harbor
160
161
162
163
164
Depth
to W
ater
Leve
l (fe
et belo
w g
round s
urf
ace)
2001 2002 2003 2004 2005 2006 2007 2008 2009 2010 2011 2012
Well GWL_w-06 /
GrpA_55376_01

Vashon-Maury Island Water Resources – A Retrospective of Contributions & Highlights
King County Science and Technical Support Section 50 December 2013
and from a high near each end of Maury Island radiating towards Quartermaster Harbor and East
Passage in Puget Sound.
Figure 26. Groundwater Level Changes during 2001 through 2010.
The GWMP incorporated newer Zone 1water level data and modified the Carr Report contour map for
Zone 1 wells (the near surface aquifer) (Figure 28). Groundwater gradient were generally steeper on the
west than on the east and steeper in the spring than in fall. Flow directions and gradients were reported
as similar to that of the Carr Report (VMI GWMC, 1998b).
LEGEND
Groundwater Level
Changes
2001-2010 Assessment
Increase
No Change
Decrease
Too Few Data
Stream
Figure source (KC, 2013b).
Colvos
Passage
Puget
Sound
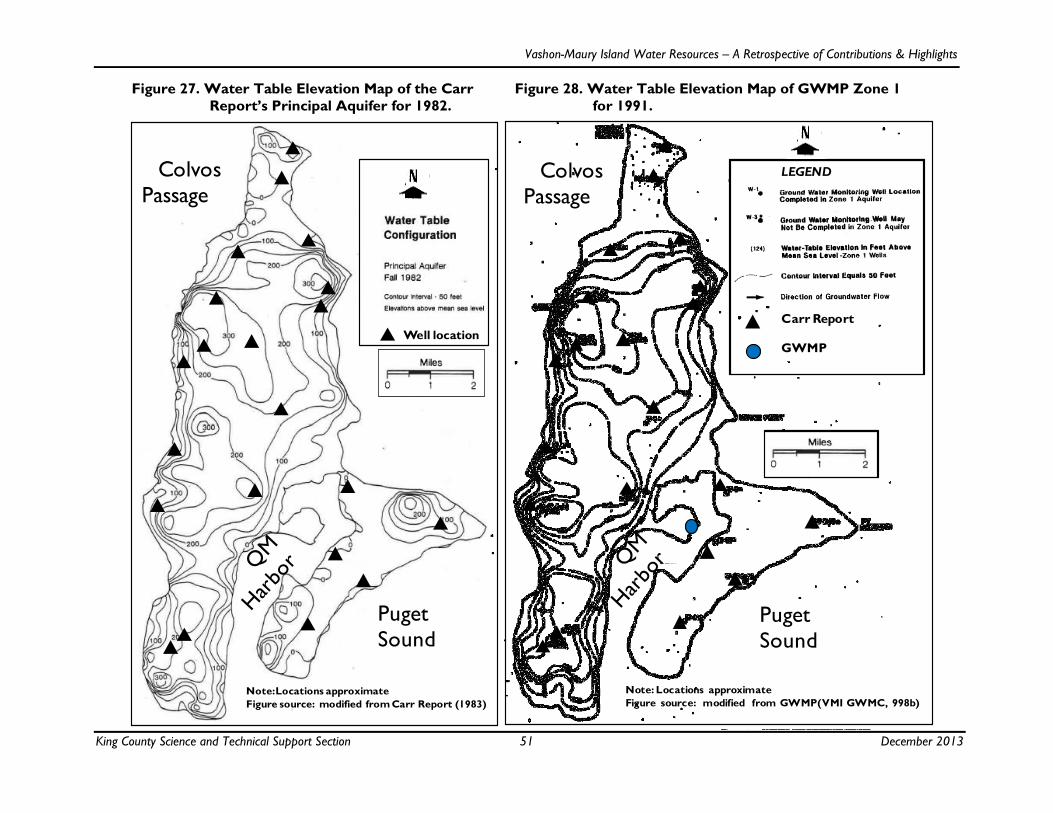
Vashon-Maury Island Water Resources – A Retrospective of Contributions & Highlights
King County Science and Technical Support Section 51 December 2013
Figure 27. Water Table Elevation Map of the Carr
Report’s Principal Aquifer for 1982.
Figure 28. Water Table Elevation Map of GWMP Zone 1
for 1991.
Puget Sound
Colvos
Passage Colvos
Passage
Puget Sound
LEGEND
Carr Report
GWMP
Note: Locations approximate
Figure source: modified from GWMP(VMI GWMC, 998b)
Well location
Note: Locations approximate
Figure source: modified from Carr Report (1983)
Colvos
Passage
Puget
Sound
Colvos
Passage
Puget
Sound

Vashon-Maury Island Water Resources – A Retrospective of Contributions & Highlights
King County Science and Technical Support Section 52 December 2013
Figure 29. WRE Phase 1 Model Water Level Contour Input
for Qva.
Figure 30. WRE Phase 1 Model Water Level Contour Output for
Qva.
Note: Contours adapted from Carr/Assoc. (1983), VMI GWMC (1998b). Highest Note: Produced using Visual MODFLOW (WHI, 2004). Qva
newer data (KC, 2003). Contour intervals = 50 feet, except on Maury Island. water levels in red, lowest in blue. Contour intervals = 50 feet.
Colvos
Passage
Puget
Sound
Colvos
Passage
Puget
Sound

Vashon-Maury Island Water Resources – A Retrospective of Contributions & Highlights
King County Science and Technical Support Section 53 December 2013
The WRE-Phase 1 modeling results also confirmed many previously documented aspects of
groundwater flow on the Island (Figures 29 and 30). Many features included in previous interpretation
showed up in the model output, such as steep groundwater gradients, particularly on the western edge
of the Island. Groundwater gradients (and thus flows) were downward throughout the Island, although
somewhat less along the coastline, where deep groundwater must flow up towards Puget Sound
discharge locations (KC, 2005b).
Figure 31. Water Table Elevation Map of Qva aquifer for 2006.
Water level contours mapped during the WRE indicated peak elevations trending north-south along the
center of the Island, and dropped off steeply at its edge (Figure 31). The water table elevation maps in
Figure source: modified from KC, 2007.
LEGEND
Qvr – recessional
outwash
Qva – advance outwash
Qpf – coarse grained
deposits
Creeks
Roads
Water Table contours
(varied intervals)
Colvos
Passage
Puget
Sound

Vashon-Maury Island Water Resources – A Retrospective of Contributions & Highlights
King County Science and Technical Support Section 54 December 2013
Figures 27 through 31 show similar contour patterns and flow directions, illustrating that the Qva unit
responds consistently over time and the patterns are consistent with our basic understanding of
unconfined groundwater hydrology, where water level contours reflect overlying topography.
4.3 Island – Wide Hydrologic Water Budget
A water budget is a method to estimate water movement in the hydrologic system. In the simplest form,
the water budget equation is inflow of water into the hydrologic system equaling the outflow of water
from the hydrologic system. Inflow into this hydrologic system is local precipitation, as noted in the Carr
Report (Carr/Assoc., 1983). As per the same report, the Vashon-Maury Island was reported to have no
off island sources of recharge. Outflows of this hydrologic system included evapotranspiration, stream
flow, and discharge to Puget Sound through the groundwater.
The Carr Report conducted additional analyses of recharge and water availability based on the water
resource monitoring. The recharge potential of the Island was assessed by compiling slope, soil type,
vegetation, and permeability datasets into a derivative map. Areas of recharge potential were designated
‗high‘, ‗medium‘ or ‗low‘ recharge potential based on this map. Using the water resource data, an island-
wide water budget/balance was generated. The importance of this water balance was further supported
by the understanding that the Island has no off island sources of recharge. Analytical model results of
island-wide averages in the Carr Report were as follows:
40 inches of average annual precipitation;
Roughly 20 inches (50 percent) of precipitation evaporates; and
Roughly 20 inches (50 percent) of precipitation either runs off or infiltrates through the soil.
In areas of high recharge potential, about seven inches infiltrates to the Principal aquifer; 11 inches are
runoff. The remaining two inches may be available to recharge the deep aquifer system. Island-wide,
about 15 inches of runoff; four inches of the surplus infiltrates to the Principal aquifer and one inch
recharges the deep aquifer (Carr/Assoc., 1983). The Carr Report concluded that precipitation is the
only source of recharge to the Island aquifers. In addition, the report summarized a water budget for the
Island based on measured precipitation and stream flows.
The GWMP built upon the Carr Report and generated a new water budget that concluded there were
12,895 acre feet per year (AFY) available to recharge the aquifers, more water than previously
understood. This estimate was significantly higher than that reported in the Carr Report (1,976 AFY) in
part with more rainfall, less evapotranspiration and less runoff assumed (Table 9). The potential amount
of annual groundwater recharge assessed on the Island was reported as significantly different values of
about 9,800 to 33,700 AFY by the Carr Report and the GWMP, respectively. These earlier monitoring
efforts (Carr Report and GWMP) used an analytical method to estimate the island-wide water budget,
while the more recent WRE determined the water budget using computer models (Table 9).
The WRE attempted to resolve the differing estimates of groundwater availability calculated from the
analytical water budgets prepared in the Carr Report and the GWMP. The WRE established a more
accurate water budget for the Island with the development of two modeling efforts (WRE-Phase I and
II). These models utilized the new monitoring along with all other necessary data to better assess the
Island‘s overall water balance (KC, 2009b).

Vashon-Maury Island Water Resources – A Retrospective of Contributions & Highlights
King County Science and Technical Support Section 55 December 2013
Table 9. Water Budget Estimates for Vashon-Maury Island.
The WRE-Phase 1 groundwater model (KC, 2005a) showed that many features that had been observed
previously about the Island‘s groundwater could be replicated. The overall water budget in this model
was similar to previous estimates of total flows in the various components. Figure 32 shows the
hydrologic interconnections between the hydrostratigraphic units and the inflows and outflows of the
WRE-Phase 1 model. The estimated percent of discharge to Puget Sound is larger in the WRE-Phase I
model than in previous studies: 21,737 AFY compared to 12,895 AFY estimated in the GWMP and 1,976
AFY in the Carr Report (Table 9; VMI GWMC, 1998b; Carr/Assoc., 1983). The WRE-Phase I and II
models yielded similar groundwater inflow (recharge) estimates that were less than that of the GWMP
while being twice the amount calculated by the initial work in the Carr Report (Table 9).
Another difference between the results of the WRE Phase I and II modeling and GWMP budgets is the
amount of water creating a freshwater lens beneath the Island. Resulting budgets of the GWMP and the
Carr Report estimated the majority of the groundwater inflow going to the streams and not infiltrating
into deeper zones before discharging to Puget Sound. The WRE-Phase I and II models reported greater
volumes of water infiltrating (Puget Sound outflow) into these deeper zones (Table 9; Figure 32).
gpm AFY in/yr % gpm AFY in/yr % gpm AFY in/yr % gpm AFY in/yr %
+ Precipitation 48,851 78,856 40 100% 56,500 91,130 44.1 100% 49,584 79,830 38.7 100% 52,007 83,950 43.8 100%
- Evapotranspiration 24,425 39,427 20 50% 22,370 36,170 17.5 40% 21,410 34,470 16.7 43% 23,628 38,141 19.9 45%
- Runoff 18,319 29,571 15 37.5% 13,170 21,285 10.3 23% 11,719 18,868 9.2 24% 13,180 21,275 11.1 25%
Irrigation NI NI NI NI NI NI NI NI NI NI NI NI 520 840 0.3 1%
Septic Return Flow NI NI NI NI NI NI NI NI NI NI 0.3 NI 520 840 0.4 1%
TOTAL
Groundwater
recharge
6,107 9,858 5 13% 20,960 33,675 16.4 37% 16,455 26,493 12.8 33% 14,159 22,855 13.5 31%
Puget sound 1,224 1,976 1 2.5% 8,110 12,895 6.3 14% 13,501 21737 10.5 27% 9,855 15,908 7.6 17%
Streams 4,882 7,881 4 10% 12,850 20,780 10 23% 1,841 2964 1.4 4% 5,105 8,241 4.3 10%
Wells NI NI NI NI NI NI NI NI 753 1212 0.6 2% 712 1,150 0.6 1%
Springs NI NI NI NI NI NI NI NI 360 580 0.3 1% 356 575 0.3 1%
TOTAL Discharge 6,106 9,856 5 13% 20,960 33,675 16.3 37% 16,455 26,493 12.8 34% 16,029 28,876 13 29%
Data Sources:
Carr Report x x
GWMP x x
WRE PHASE I report x x x x x x
WRE PHASE II report xx xx x x x xx x x
Conversions x x xx x x x x x x x xx
Notes:
* = Difference in total groundwater recharge and total outflow is due to change in storage of 2 percent. AFY = acre feet per year
x = Indicates values reported in document listed in left column. in/yr = inches per years
xx = Indicates values reported in documents were different than in original report. % = percent
NI = not included in budget gpm = gallons per minute
WRE-Phase II *
2009
Inflows
Outflows
Carr / Assoc GWMP WRE-Phase I
1983 1998 2005

Vashon-Maury Island Water Resources – A Retrospective of Contributions & Highlights
King County Science and Technical Support Section 56 December 2013
Figure 32. Water Balance Flow Details of WRE-Phase 1 Modeling Results.
Note: Flow is presented in gallons per minute (gpm). Greater flows are shown with thicker arrows. Units without boxes at
right of figure indicate flows out (negative) and into (positive) aquifer unit, to and from streams (adjacent arrows).
Not all of the recharge water is available for pumping as a result of aquifer retention and recovery
factors. Recent work of the VMI Sustainability Monitoring project has been collecting water usage data
from a variety of water users. Water consumption is calculated from four water users – Group A public
water systems, Group B public water systems, individuals and agricultural water users. In 2010, the total
island-wide water use was estimated to be 489 MGY. In converting the data presented in Table 9 to
similar units the range of recharge is from 3,200 to over 10,900 MGY. The 2010 water use estimate of
489 MGY is 4 to 15 percent of this recharge range.
In summary, Vashon-Maury Island is reported to have no off island sources of recharge. Outflows of this
hydrologic system included evapotranspiration, stream flow, and discharge to Puget Sound through the
groundwater. Four water budgets were proposed since the 1980s, each using more data, detailed
analysis and complex modeling techniques. Estimates varied based on differing assumptions of inflows
and outflows, as per mode available data and improved modeling techniques. The more recent and more
Aquifer unit
Aquitard unit
Figure source: modified from KC, 2005b
Qvr
Qvt
Qva
Qpf
QAc
QBf
QBc
QC
Recharge16455
Springs-360
Streams-1841
Puget Sound-13501
780 24
16364 9
15647
9434 9019
2887 2592
2383 2197
243 242
Wells-753
LEGEND
Flow is presented in gallons per minute
(GPM)
Greater flows are shown with thicker
arrows.
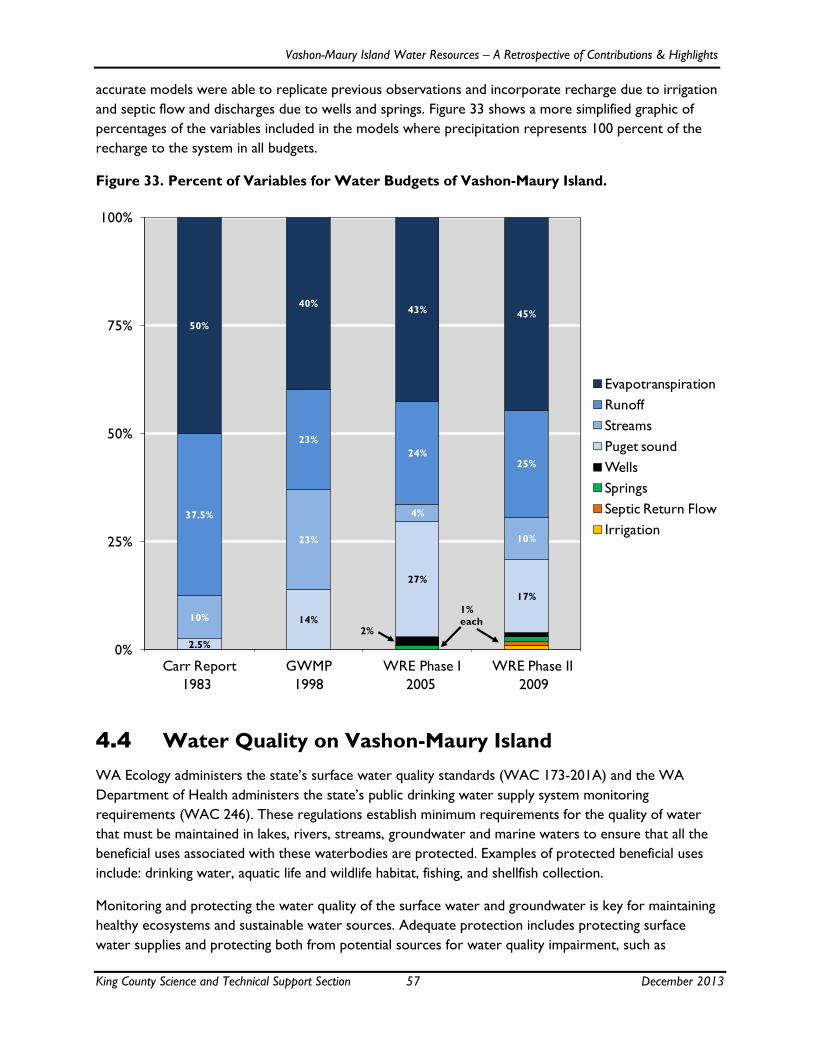
Vashon-Maury Island Water Resources – A Retrospective of Contributions & Highlights
King County Science and Technical Support Section 57 December 2013
accurate models were able to replicate previous observations and incorporate recharge due to irrigation
and septic flow and discharges due to wells and springs. Figure 33 shows a more simplified graphic of
percentages of the variables included in the models where precipitation represents 100 percent of the
recharge to the system in all budgets.
Figure 33. Percent of Variables for Water Budgets of Vashon-Maury Island.
4.4 Water Quality on Vashon-Maury Island
WA Ecology administers the state‘s surface water quality standards (WAC 173-201A) and the WA
Department of Health administers the state‘s public drinking water supply system monitoring
requirements (WAC 246). These regulations establish minimum requirements for the quality of water
that must be maintained in lakes, rivers, streams, groundwater and marine waters to ensure that all the
beneficial uses associated with these waterbodies are protected. Examples of protected beneficial uses
include: drinking water, aquatic life and wildlife habitat, fishing, and shellfish collection.
Monitoring and protecting the water quality of the surface water and groundwater is key for maintaining
healthy ecosystems and sustainable water sources. Adequate protection includes protecting surface
water supplies and protecting both from potential sources for water quality impairment, such as
2.5%
14%
27%
17%
10%
23%
4%
10%
37.5%
23%
24%25%
50%
40%43% 45%
0%
25%
50%
75%
100%
1 2 3 4
Evapotranspiration
Runoff
Streams
Puget sound
Wells
Springs
Septic Return Flow
Irrigation
2%
1%
each
Carr Report GWMP WRE Phase I WRE Phase II
1983 1998 2005 2009

Vashon-Maury Island Water Resources – A Retrospective of Contributions & Highlights
King County Science and Technical Support Section 58 December 2013
household and land management practices, urban runoff, landfill and wastewater treatment facilities,
failing and functional septic systems and in some areas seawater intrusion. For example, marine water
quality is degraded from water carrying nutrients from septic systems or fertilizers, and contaminants
from motor vehicle oil and exhaust.
Within this section, the following are discussed in more detail:
Marine water quality
Freshwater surface water quality
Groundwater water quality
4.4.1 Marine Water Quality in Quartermaster Harbor
King County has been conducting monthly sampling for fecal coliform at the inner and outer harbor
since 2006 for both fecal coliform bacteria and dissolved oxygen. Sampling at a third station in
Quartermaster Harbor (Burton Acres County Park) began in 2007 and the data is used for the
assessment of fecal coliform bacteria only (Figure 34a; KC, 2013b).
Figure 34. Sampling locations within Quartermaster Harbor for Fecal Coliform Bacteria
(A) and Dissolved Oxygen (B) for 2010.
For data collected since 2006, all three locations sampled met state water quality criteria for fecal
coliform bacteria (geomean value of 14 colony forming units per 100 milliliters of sample (cfu/100ml) for
marine water) and the 2006-2010 average is 100 percent for locations meeting the state water quality
criteria. All samples were well below 14 cfu/100ml, the WA standard for fecal coliform bacteria in
marine waters (Figure 34; KC, 2013b). In addition, WA DOH collected marine water quality samples
Fecal Coliform
Sampling Site -
Met Criteria
Creek
Road
LEGEND
LEGEND
Moderate DO
Low DO
Creek
Road
Dissolved Oxygen=DO
(A) Fecal
Coliform
(B) Dissolved
Oxygen

Vashon-Maury Island Water Resources – A Retrospective of Contributions & Highlights
King County Science and Technical Support Section 59 December 2013
along Quartermaster Harbor for fecal coliform analysis. There also were no exceedances of the criteria
based on this dataset.
Figure 35. Fecal Coliform Bacteria Shown as Geometric Mean for Stations within
Quartermaster Harbor.
Dissolved oxygen levels below the WA water quality standard (extraordinary criteria of 7 mg/L) have
been observed in Quartermaster Harbor over the last seven years by both King County and UWT (KC,
2010c and 2013f). Table 10 shows the percentages of samples taken from the bottom of the water
column that were below the WA water quality standard (extraordinary criteria of 7 mg/L) for each year
sampled since 2006 (Figure 36). The inner harbor sampling location was assigned a low dissolved oxygen
rating since 55 percent of the samples tested were below the extraordinary criteria of 7 mg/L (Figure
34b). In contrast, the outer harbor sample was assigned a moderate dissolved oxygen rating since 45
percent of the samples tested were below the extraordinary criteria of 7 mg/L (Figure 34b). More detail
on these results is in Appendix A.
Table 10. Dissolved Oxygen in Quartermaster Harbor.
Notes: WA state water quality standard (extraordinary criteria of 7 mg/L) (KC, 2013b).
Samples taken from bottom of water column.
0
2
4
6
8
10
12
14
16
2006 2007 2008 2009 2010
Fecal co
lifo
rm (
cfu
/100 m
l)
Inner
Outer
Burton
WA state standard
2006 2007 2008 2009 2010
Total Number 9 12 12 12 11
Percentage of samples
below criteria22% 25% 17% 25% 55%
2006 2007 2008 2009 2010
Total Number 12 12 12 12 11
Percentage of samples
below criteria25% 50% 42% 17% 45%
Inner Quartermaster Harbor Station
Outer Quartermaster Harbor Station

Vashon-Maury Island Water Resources – A Retrospective of Contributions & Highlights
King County Science and Technical Support Section 60 December 2013
Figure 36. Dissolved Oxygen in Quartermaster Harbor.
Note: WA state water quality standard (extraordinary criteria of 7 mg/L) (KC, 2013b). Samples
taken from bottom of water column.
More information related to marine water quality in Quartermaster Harbor is presented in the
documents related to the Quartermaster Harbor Nitrogen Management Study on the King County
website (KC, 2013e) and more is to be presented in a forthcoming report on this study. The following
are other ongoing projects studying influences on Quartermaster Harbor marine water quality:
Public Health - Seattle & King County‘s Vashon-Maury Island Marine Recovery Area to correct
failing on-site sewage systems in outer Quartermaster Harbor (Public Health, 2013).
Puget Sound Restoration Fund‘s Quartermaster Harbor Nutrient Mitigation Project to test
effects of growing mussels on water quality in Quartermaster Harbor (PSRF, 2013).
WA Department of Health‘s Shellfish Program to monitor, classify water quality and manage
shellfish harvest in Quartermaster Harbor (WA DOH, 2013b).
WA Department of Natural Resources‘ Maury Island Aquatic Reserve management plan for
Quartermaster Harbor (WA DNR, 2013).
4.4.2 Freshwater Surface Water Quality
The Carr Report presented selected water quality analysis of locations on McCormick, Shinglemill, Judd,
Ellis, Beal, and Tahlequah Creeks (Carr/Assoc., 1983). Chlorides were reported as somewhat higher in
springs and streams than in the wells, ranging between 3 and 18 mg/L.
QUARTERMASTER HARBOR
Jan-2006 Jan-2007 Jan-2008 Jan-2009 Jan-2010 Jan-2011 Jan-2012 Jan-2013
DIS
SO
LV
ED
OX
YG
EN
(M
G L
-1)
0
2
4
6
8
10
12
14
16
18
20
MSWH01
NSAJ02
Extraordinary Quality Standard 7 mg L-1
Inner Harbor
Outer Harbor
Extraordinary Quality Standard
Dis
solv
ed O
xyg
en (m
g/L)
7 mg/L
1/2006 1/2007 1/2008 1/2009 1/2010 1/2011 1/2012 1/2013

Vashon-Maury Island Water Resources – A Retrospective of Contributions & Highlights
King County Science and Technical Support Section 61 December 2013
The GWMP presents surface water quality data from eight creeks (Beal, Fisher, Green Valley, Judd,
Shinglemill, Mileta, Paradise Cove, and Tahlequah Creeks) in 1991 and 1992 (VMI GWMC, 1998b). In
addition, spring water quality data were collected from six locations between 1989-1990 for fecal
coliforms, metals, sulfate, fluoride, and total dissolved solids. With the exception of elevated fecal
coliform levels, high levels of contaminants were not observed at these locations (VMI GWMC, 1998b).
As part of the WRE, in late 2006, stream water quality sampling began as an island-wide assessment of
the surface water quality since the last study completed in 1992. This effort included surface water
sampling at seven locations across the Island. These locations were chosen to represent a wide range of
conditions.
Within this section, the following are discussed in more detail:
Stream water quality index
Fecal coliform bacteria in streams
Nitrogen in streams
Stream temperatures
Stream benthic invertebrate index
4.4.2.1 Stream Water Quality Index
The Water Quality Index (WQI) integrates key factors into a single number that can be compared over
time and across locations. This index compares monthly data of temperature, pH, fecal coliform
bacteria, dissolved oxygen, turbidity, total suspended solids, and nutrients (phosphorus and nitrogen)
relative to state standards and guidelines. The WQI is a measure created by Ecology that generates a
number ranging from 1 to 100 for a stream location. Higher numbers reflect better water quality. The
multiple water quality parameters are combined and results aggregated over the water year to produce
a single score for each sample station. In general, stations scoring 80 and above meet expectations and
are of "low concern‖ with good water quality, scores 40 to 80 indicate "moderate concern and water
quality", and stations with scores below 40 do not meet expectations and are of "high concern‖ with
poor water quality.
Samples were collected at various locations on the Island (Figure 3). Time series plots of the key
components of the WQI for Fisher, Judd and Mileta Creeks are depicted in Figures 37, 38 and 39.
After the 14 month assessment period of the WRE, surface water monitoring continued due in part to
reported lower WQI values for Fisher, Tahlequah and Judd Creeks (Table 11). The WQI values for
Fisher, Judd, Mileta and Shinglemill Creeks were mostly moderate concern with Fisher Creek being of
high concern for WY 2007 as compared to WY 2011 moderate to low concern scores over 70 for all
creeks sampled.
The water quality index for each location varied year to year (Table 11 and Figure 40). Overall for 2007
through 2011, scores have varied up and down, with an insufficient number of years of data to assess
upward to downward trends. However, conditions appear to be improving.

Vashon-Maury Island Water Resources – A Retrospective of Contributions & Highlights
King County Science and Technical Support Section 62 December 2013
Figure 37. Fisher Creek Water Quality Graphs for 2006 through 2012.
2006 2007 2008 2009 2010 2011 2012
Sp.
Cond.
(µS
/cm
)
0
50
100
150
200
250
Tota
l A
lkalin
ity (
mg/L
)
0
20
40
60
80
100
Specific Conductance
Total Alkalinity
2006 2007 2008 2009 2010 2011 2012
Tem
pera
ture
(oC
)
0
5
10
15
20
25
FISHER CREEK
2006 2007 2008 2009 2010 2011 2012
Dis
solv
ed O
xygen (
mg/L
)
0
2
4
6
8
10
12
14
pH
6.0
6.5
7.0
7.5
8.0
8.5
9.0
Dissolved Oxygen
pH
2006 2007 2008 2009 2010 2011 2012
Dis
cha
rge (
cfs
)
0.1
1
10
100T
SS
(m
g/L
)
0.1
1
10
100
1000Discharge
Total Suspended Solids
2006 2007 2008 2009 2010 2011 2012
Nitro
gen
(m
g/L
)
0
1
2
3
4
Total Nitrogen
Nitrate + Nitrite - N
Ammonium Nitrogen
2006 2007 2008 2009 2010 2011 2012
Pho
sph
oru
s (
mg/L
)
0.0
0.1
0.2
0.3
0.4
Sili
ca (
mg/L
)
0
5
10
15
20
Total Phosphorus
Soluble Reactive Phosphorus
Dissolved Silica
2006 2007 2008 2009 2010 2011 2012
Bacte
ria (
CF
U/1
00
mL)
1
10
100
1000
10000Fecal Coliform
E. coli
FISHER CREEK
Dis
ch
arg
e (c
fs)
Silic
a (m
g/L
)
Fisher
Creek
To
tal a
lka
linity
(mg
/L)
pH
Dis
so
lve
d O
xy
ge
n (
mg
/L)
Sp
. Co
nd
uc
tiv
ity
(µ
S/cm
)T
em
pe
ratu
re ( C
)
Ph
os
ph
oru
s (m
g/L
)T
SS
(m
gL
)B
ac
teri
a (C
FU
/10
0 m
l)N
itro
ge
n (m
g/L
)

Vashon-Maury Island Water Resources – A Retrospective of Contributions & Highlights
King County Science and Technical Support Section 63 December 2013
Figure 38. Judd Creek Water Quality Graphs for 2006 through 2012.
2006 2007 2008 2009 2010 2011 2012
Dis
charg
e (
cfs
)
0.1
1
10
100
1000
TS
S (
mg/L
)
0.1
1
10
100
1000 Discharge
Total Suspended Solids
2006 2007 2008 2009 2010 2011 2012
Nitro
gen (
mg/L
)
0
1
2
3
4
Total Nitrogen
Nitrate + Nitrite - N
Ammonium Nitrogen
2006 2007 2008 2009 2010 2011 2012
Phosphoru
s (
mg/L
)
0.0
0.1
0.2
0.3
0.4
Sili
ca (
mg/L
)
0
5
10
15
20
Total Phosphorus
Soluble Reactive Phosphorus
Dissolved Silica
2006 2007 2008 2009 2010 2011 2012
Bacte
ria (
CF
U/1
00 m
L)
1
10
100
1000
10000
Fecal Coliform
E. coli
JUDD CREEK
Judd
Creek
Dis
ch
arg
e (c
fs)
Silic
a (m
g/L
)
Ph
os
ph
oru
s (m
g/L
)N
itro
ge
n (m
g/L
)T
SS
(m
gL
)B
ac
teri
a (C
FU
/10
0 m
l)
2006 2007 2008 2009 2010 2011 2012
Sp.
Cond.
(µS
/cm
)
0
50
100
150
200
250
Tota
l A
lkalin
ity (
mg/L
)
0
20
40
60
80
100Specific Conductance
Total Alkalinity
2006 2007 2008 2009 2010 2011 2012
Tem
pera
ture
(oC
)
0
5
10
15
20
25
JUDD CREEK
2006 2007 2008 2009 2010 2011 2012
Dis
solv
ed O
xygen (
mg/L
)
0
2
4
6
8
10
12
14
pH
6.0
6.5
7.0
7.5
8.0
8.5
9.0
Dissolved Oxygen
pH
To
tal a
lka
linity
(mg
/L)
pH
Dis
so
lve
d O
xy
ge
n (
mg
/L)
Sp
. Co
nd
uc
tiv
ity
(µ
S/cm
)T
em
pe
ratu
re ( C
)

Vashon-Maury Island Water Resources – A Retrospective of Contributions & Highlights
King County Science and Technical Support Section 64 December 2013
Figure 39. Mileta Creek Water Quality Graphs for 2006 through 2012.
2006 2007 2008 2009 2010 2011 2012
Sp.
Cond.
(µS
/cm
)
0
50
100
150
200
250
Tota
l A
lkalin
ity (
mg/L
)
0
20
40
60
80
100Specific Conductance
Total Alkalinity
2006 2007 2008 2009 2010 2011 2012
Tem
pera
ture
(oC
)
0
5
10
15
20
25
MILETA CREEK
2006 2007 2008 2009 2010 2011 2012
Dis
solv
ed O
xygen (
mg/L
)
0
2
4
6
8
10
12
14
pH
6.0
6.5
7.0
7.5
8.0
8.5
9.0Dissolved Oxygen
pH
2006 2007 2008 2009 2010 2011 2012
Dis
charg
e (
cfs
)
0.001
0.01
0.1
1
10
TS
S (
mg/L
)
0.1
1
10
100
1000Discharge
Total Suspended Solids
2006 2007 2008 2009 2010 2011 2012
Nitro
gen (
mg/L
)
0
1
2
3
4
5
6
7
8
9
10 Total Nitrogen
Nitrate + Nitrite - N
Ammonium Nitrogen
2006 2007 2008 2009 2010 2011 2012
Phosphoru
s (
mg/L
)
0.0
0.1
0.2
0.3
0.4
Sili
ca (
mg/L
)
0
5
10
15
20
Total Phosphorus
Soluble Reactive Phosphorus
Dissolved Silica
2006 2007 2008 2009 2010 2011 2012
Bacte
ria (
CF
U/1
00 m
L)
0.1
1
10
100
1000
10000
Fecal Coliform
E. coli
MILETA CREEK
Dis
ch
arg
e (c
fs)
Silic
a (m
g/L
)
Ph
os
ph
oru
s (m
g/L
)N
itro
ge
n (m
g/L
)T
SS
(m
gL
)B
ac
teri
a (C
FU
/10
0 m
l)
2006 2007 2008 2009 2010 2011 2012
Dis
cha
rge (
cfs
)
0.1
1
10
100
TS
S (
mg/L
)
0.1
1
10
100
1000Discharge
Total Suspended Solids
2006 2007 2008 2009 2010 2011 2012
Nitro
ge
n (
mg/L
)
0
1
2
3
4
Total Nitrogen
Nitrate + Nitrite - N
Ammonium Nitrogen
2006 2007 2008 2009 2010 2011 2012
Ph
osp
ho
rus (
mg/L
)
0.0
0.1
0.2
0.3
0.4
Sili
ca
(m
g/L
)
0
5
10
15
20
Total Phosphorus
Soluble Reactive Phosphorus
Dissolved Silica
2006 2007 2008 2009 2010 2011 2012
Ba
cte
ria
(C
FU
/10
0 m
L)
1
10
100
1000
10000Fecal Coliform
E. coli
FISHER CREEK
Mileta
Creek
To
tal a
lka
linity
(mg
/L)
pH
Dis
so
lve
d O
xy
ge
n (
mg
/L)
Sp
. Co
nd
uc
tiv
ity
(µ
S/cm
)T
em
pe
ratu
re ( C
)

Vashon-Maury Island Water Resources – A Retrospective of Contributions & Highlights
King County Science and Technical Support Section 65 December 2013
Table 11. Water Quality Index Scores for Selected Vashon-Maury Island Streams.
Figure 40. Water Quality Index Scores for the Island Creeks by Water Year.
Note: Side bar blocks (low, moderate and high) are ratings for the VMI Sustainability
Indicator program ratings and are not „typical‟ for reporting WQI scores.
Creek Name Site Name 2007 2008 2009 2010 2011
Christensen VA23A 71
Fisher VA41A 31 68 24 50 70
Gorsuch VA65A 74 75 44 83*
Judd VA42A 58 67 26 61 78
Mileta VA45A 72 61 47 68 70
Shinglemill VA12A 71 78 61 83 81
Tahlequah VA37A 55
0 0 0 1 1
6 5 3 3 3
1 0 2 0 0
7 5 5 4 4
Note: Colors are for VMI indicators and are not „typical‟ for reporting WQI scores.
“*” = Gorsuch Creek only has 6 samples (Oct-Mar) in Water Year 2010
Score Explanation
>80 Low concern - good water quality
80-40 Moderate concern with a mix of good and poor water quality
<40 High concern – poor water quality
Water Years
Total Low Concern
Total Moderate Concern
Total High Concern
Total Streams
0
20
40
60
80
100
2006.5 2007.5 2008.5 2009.5 2010.5 2011.5
Shinglemill-VA12A
Fisher-VA41A
Judd-VA42A
Mileta-VA45A
Christensen-VA23A
Tahlequah-VA37A
Gorsuch-VA65A
2007 2008 2009 2010 2011
Mo
dera
te
Hig
hL
ow
Wat
er
Qual
ity
Index (
WQ
I; u
nitle
ss)

Vashon-Maury Island Water Resources – A Retrospective of Contributions & Highlights
King County Science and Technical Support Section 66 December 2013
4.4.2.2 Fecal Coliform Bacteria in Streams
Water carrying nutrients from septic systems and overland flow of surface water capturing bacteria
from animal wastes from pets and wildlife can degrade drinking water quality and can reduce oxygen
levels for the animals that live and depend on Puget Sound habitats. Fecal coliform bacteria data were
collected as part of the monthly stream water quality and is one of the ten parameters used to calculate
WQI scores. This parameter also has a ―state extraordinary criteria‖ where fecal coliform bacteria
levels must not be higher than the geometric mean of 50 colony forming units (cfu)/100 mL.
Judd, Fisher, Mileta and Christensen Creeks had exceedances of the state extraordinary criteria for at
least one year (Table 12). Exceedances of the criteria occurred repeatedly for the time period 2007
2010 on Fisher and Judd Creeks. Cattle and horse manure, septic systems, and farming practices are all
potential sources of fecal coliform bacteria in the shallow aquifer (CDM, 2007).
Table 12. Geometric mean Fecal Coliform concentrations (cfu/100 mL) for Selected
Vashon-Maury Island Creeks.
4.4.2.3 Nitrogen in Streams
Water carrying nutrients from septic systems, cattle and horse manure, fertilizer applications, leaching of
nitrate from nitrate-fixing alder trees, and leaching of decomposing organic matter are all potential
sources of nitrate in the sensitive Principal aquifer (CDM, 2007).
Nitrogen is an important plant nutrient. Vegetation along streams can be effective at taking up nutrients
for storage and plant growth from the soil adjacent to a stream and directly from a stream. Natural
sources of nitrogen include plant decomposition. Forest ecosystems adjacent to streams provide organic
matter that contains nitrogen. Leaves and other organic matter fall directly into the stream channel.
These plants determine the quantity, quality, and timing of nitrogen delivered to the soil and stream
channel (Naiman et al, 1997). A majority of the plant material input from deciduous riparian forests
typically are leaves high in nutrients are delivered to the stream over a six to eight week period during
Creek Name Site Identification 2007 2008 2009 2010 2011
Christensen VA23A 54 NS NS NS NS
Fisher VA41A 107 56 168 73 44
Gorsuch VA65A 41 13 47 9* NS
Judd VA42A 160 110 159 87 46
Mileta VA45A 25 28 73 20 15
Shinglemill VA12A 34 22 43 12 17
Tahlequah VA37A 31 NS NS NS NS
Notes:
VMI streams have the extraordinary criteria of 50 CFU/100ml.
The stream results exceed the criteria, inferring poor water quality.
“*” = refers to sites with missing data – incomplete water year dataset.
cfu/100ml = standard unit of measure for bacteria data; colony forming units per 100 milliliters.
NS = Not sampled in this year.
Water Years

Vashon-Maury Island Water Resources – A Retrospective of Contributions & Highlights
King County Science and Technical Support Section 67 December 2013
autumn. These materials are processed by organisms that break down wood, leaves and other debris
into smaller pieces (May, 2003).
Agricultural activities such as farming and animal grazing can also significantly increase nitrogen levels.
Based on monitoring in small streams, runoff from residential and agricultural areas carries higher levels
of nitrogen and other pollutants than runoff from natural land covers (Adelsman, 2013). In general,
research has indicated that use of best management practices, such as limiting grazing access to a stream
and riparian area using fencing, as well as maintenance of vegetative buffers along the riparian corridor
can significantly reduce the impacts of agricultural activities (May, 2003). High levels of nitrogen to a
stream can lead to uncontrolled plant and algae growth. Excessive aquatic plant growth, due to
excessive nitrogen, can also lead to oxygen depletion in both freshwater and marine water systems.
Ecology reported that nitrate plus nitrite flux entering the Puget Sound was highly seasonal; highest in
the winter, especially November through January, and lowest in the summer. There were no seasonal
components to the trends and no significant trend in the nitrate plus nitrite flux from all major rivers
entering Puget Sound (Figure 41; Hallock, 2009). These low nitrogen concentrations in the summer
coincide with lower stream flows and lowering of water levels in shallow water bearing geologic zones.
The low stream flows in the summer are mostly a result of groundwater inflow.
Figure 41. Nitrate + Nitrite Flux entering Puget Sound from Thirteen Largest Rivers.
Note: Modified from Hallock, 2009.
After the 14 month assessment period of the WRE, surface water monitoring continued due to
reported lower water quality index values for Fisher, Talequah and Judd Creeks (Table 12) plus nitrate
concentrations of over 6 mg/L during winter months in Mileta Creek (Figure 42). As part of the
Quartermaster Harbor Nitrogen Management Study, the Nearshore Freshwater Inflows Assessment
was conducted to identify small previously unmonitored streams draining to Quartermaster Harbor that
might have relatively high nitrate concentrations. This study was conducted on October 2010 at 21
locations along the perimeter of the harbor (Figure 43; KC, 2012d).
Nit
rate
+ N
itri
te F
lux
(kg
/mo
nth
*10
-6)
3.5
3
2.5
2
1.5
1
0.5
094 95 96 97 98 99 00 01 02 03 04 05 06 07
Year

Vashon-Maury Island Water Resources – A Retrospective of Contributions & Highlights
King County Science and Technical Support Section 68 December 2013
In general, it appears that the range in nitrate concentrations measured in October 2010 in small
freshwater inflows to Quartermaster Harbor was larger than that observed since 2006 in monthly grab
samples collected in three of the largest tributaries to the harbor (Fisher, Judd and Mileta Creeks).
Figure 42. Nitrate + Nitrite Concentrations for Selected Vashon-Maury Island Creeks.
Figure 43. Range of Nitrate + Nitrite Nitrogen at Sampling Locations for the Nearshore
Freshwater Inputs Assessment Study in 2010.
Nit
rate
+ N
itri
te c
onc
entr
atio
ns
(mg/
L)
10
9
8
7
6
5
4
3
2
1
00
1
2
3
4
5
6
7
8
9
10
Oct-06 Oct-07 Oct-08 Oct-09 Oct-10 Oct-11
Nit
rate
+N
itri
te (
mg
/L)
Date
Shinglemill Crk Fisher Crk Judd Crk Mileta Crk
Christensen Crk Tahlequah Crk Gorsuch Crk
0
1
2
3
4
5
6
7
8
9
10
Oct-06 Oct-07 Oct-08 Oct-09 Oct-10 Oct-11
Nit
rate
+N
itrit
e (m
g/L
)
Date
Shinglemill Crk Fisher Crk Judd Crk Mileta Crk
Christensen Crk Tahlequah Crk Gorsuch Crk
Nit
rate
+ N
itri
te c
on
cen
tra
tio
ns
(mg/L
)
10/2006 10/2007 10/2008 10/2009 10/2010 10/2011
10
9
8
7
6
5
4
3
2
1
00
1
2
3
4
5
6
7
8
9
10
Oct-06 Oct-07 Oct-08 Oct-09 Oct-10 Oct-11
Nit
rate
+N
itri
te (
mg
/L)
Date
Shinglemill Crk Fisher Crk Judd Crk Mileta Crk
Christensen Crk Tahlequah Crk Gorsuch Crk
0
1
2
3
4
5
6
7
8
9
10
Oct-06 Oct-07 Oct-08 Oct-09 Oct-10 Oct-11
Nitrate+
Nitrite (m
g/L
)
Date
Shinglemill Crk Fisher Crk Judd Crk Mileta Crk
Christensen Crk Tahlequah Crk Gorsuch Crk
LEGEND
<=0.2 mg/L
0.2-0.5 mg/L
0.5-0.75 mg/L
0.75-1 mg/L
1 -2.24 mg/L
Nearshore nitrate concentrations
Figure modified from (KC, 2012d)
Puget
Sound

Vashon-Maury Island Water Resources – A Retrospective of Contributions & Highlights
King County Science and Technical Support Section 69 December 2013
Routine monthly samples taken from Fisher, Judd and Mileta Creek showed a seasonal trend of lower
concentrations of nitrate + nitrite nitrogen in summer months (May through October) and higher
concentrations of nitrate + nitrite nitrogen in winter months (November through April) (Figure 42 and
Figure 44). This pattern is typical of rural lowland streams, highest concentrations occur during winter
when plant uptake is lowest and rain flushes nitrates from surface soils into nearby streams and lowest
concentrations occur during summer when plant uptake is greatest and soils are general dry and
accumulating nitrate.
Figure 44. Monthly Nitrate + Nitrite Nitrogen from Routine Monthly Samples from Fisher,
Judd and Mileta Creeks.
Note: Measurements for November 2006 through December 2010. Gray boxes define the
median and lower and upper quartiles, while the whiskers denote the upper and lower 95th
percentiles of the data for a particular month. The black circles identify the observed
concentrations that are higher or lower than the 95th percentile. (KC, 2012d).
Although there were increases in nitrate in all streams during the winter months, the nitrate results
from the sampling locations in Mileta Creek were reported as elevated and several times higher in
concentration than in Judd and Fisher Creeks in the Quartermaster Harbor area during the winter
months (Figure 42). Mileta Creek is a relatively small tributary to Quartermaster Harbor and it is the
only tributary routinely monitored on the Maury portion of the Island. The Mileta Creek Nitrogen
Source Tracking Study (part of the Quartermaster Harbor Nitrogen Management Study) was then
conducted to identify locations on Mileta Creek where nitrate concentrations are elevated during
winter months and to evaluate possible sources. The study was conducted in November 2010 at 16
locations in the drainage area representing Mileta Creek and associated smaller tributaries (Figure 45;
KC, 2012a).
JAN FEB MAR APR MAY JUN JUL AUG SEP OCT NOV DEC
Nitra
te+
Nitrite
-N (
mg/L
)
0
2
4
6
8
Jan Feb Mar Apr May Jun Jul Aug Sep Oct Nov Dec
8
6
4
2
0
Nit
rate
+ N
itri
te N
itro
gen (
mg/
L)

Vashon-Maury Island Water Resources – A Retrospective of Contributions & Highlights
King County Science and Technical Support Section 70 December 2013
The source tracking study eliminated two potential sources (a golf course and some abandoned chicken
barns) as the cause of elevated winter nitrate concentrations observed in Mileta Creek. The actual
source remains unknown, but has been isolated to the reaches upstream of the main stem of Mileta
Creek (KC, 2012a).
Figure 45. Locations of Nitrate + Nitrite Nitrogen Concentrations Measured during the
Mileta Creek Nitrogen Source Tracking Study in 2010.
4.4.2.4 Stream Temperatures
Extensive development can substantially alter the extent of riparian shade that moderates daily peak
stream temperatures. Development induced increases in high flows combined with the loss of riparian
tree cover can also cause the stream to become wider and shallower, which also contributes to higher
peak stream temperatures. Climate change, particularly predicted increases in air temperature are
expected to result in warmer stream conditions without substantial investment in restoring riparian
shade and summer flow conditions (KC, 2013d).
Stream temperatures for the Island creeks are typically below the state criteria of 16 degrees
Centigrade (C) Seven-day Average of the Daily Maximum (7DADMax) for all locations (Figure 46). Being
below the criteria indicates good water quality with respect to temperature. Judd and Fisher Creeks did
have a few days over the criteria. For Judd Creek, a total of 23 days are over the 16 degrees C criteria
for a13 water year period (WY2000-2011). These warmer periods occurred in mid/late July of 2003,
2004, 2006, 2007 and 2009. Fisher Creek has a total of five days for seven water years (2005-2011) all of
which occurred in July/August of 2009. For Shinglemill (WY1999-2011) and Tahlequah (WY2005-2011)
Creeks, stream temperature data are below the criteria for these periods, indicating good water quality
with respect to stream temperature.
Figure modified from (KC, 2012a)
<=1.0 mg/L
1.0-2.0 mg/L
2.0-3.0 mg/L
3.0-6.62 mg/L
Revised watercourse
Original basin delineation
LEGEND
Nitrate + Nitrate Nitrogen

Vashon-Maury Island Water Resources – A Retrospective of Contributions & Highlights
King County Science and Technical Support Section 71 December 2013
Figure 46. Seven-Day Average of the Daily Maximum Stream Temperatures for Judd and
Fisher Creeks.
Note: The criteria for the Island creeks is 16°C.
4.4.2.5 Stream (or Benthic) Invertebrate Index
The Benthic Index of Biological Integrity (B-IBI) is another assessment of stream health that provides a
"report card" for measuring the health of the benthic invertebrate community and for the stream
ecosystem. The B-IBI scores are based on what stream invertebrate types (typically insect larva) and
numbers are living in the stream. By using this scoring system, very different streams can be compared
to each other and their ecological health ranked. On the Island, B-IBI data has been collected from a few
stations since 2005 with increased monitoring at 14 locations representing eight different stream basins
in 2010. The eight monitored stream basins are McCormick; Shinglemill, Christenson, Tahlequah, Fisher,
Judd, Ellis, and Gorsuch (Figure 47). As a result of budget limitations, the sample collection program on
the Island was reduced to six locations in 2011 and is currently included in the VMI Sustainability
Indicators program as a Stream Benthic Macroinvertebrate Monitoring metric (KC, 2013b).
In 2012, King County updated the Puget Sound Stream Benthos database to reflect a more current best
available science for calibrating the B-IBI scores (KC, 2013h). The scores shown in Table 13 and Figure
47 reflect the updated methodology. B-IBI Scores shown in Appendix A reflect the former calibration
method.
0
2
4
6
8
10
12
14
16
18
Oct-99 Oct-01 Oct-03 Oct-05 Oct-07 Oct-09 Oct-11 Oct-13
Tem
pera
ture
(°C
)
Judd CreekFisher Creek

Vashon-Maury Island Water Resources – A Retrospective of Contributions & Highlights
King County Science and Technical Support Section 72 December 2013
Figure 47. Benthic Index of Biologic Integrity Sampling Locations on Vashon-Maury Island
in 2010.
Most samples from the streams scored between ―Very Poor‖ and ―Fair‖ rankings. These rankings appear
to be low for rural streams having low development. Six samples scored a ―Good‖ ranking and were
widely distributed across years and streams. One location, Ellis Creek, has maintained a ―Very Poor‖
ranking for the period of 2005 through 2010. After further review, the sampling location appeared to be
within the tidally affected zone of the creek. The tidal affect is likely to have a negative impact on the
diversity and type of insect communities present in this portion of the creek. Assessments of other
locations are ongoing to evaluate the possible cause/reason for their respective B-IBI scores. Overall,
the Island‘s B-IBI scores vary with a few locations increasing overall and others decreasing over time.
There are currently insufficient data to conduct statistical trend analysis.
LEGEND
Figure modified from KC, 2013b and KC, 2013h.
Colvos
Passage
Puget
Sound

Vashon-Maury Island Water Resources – A Retrospective of Contributions & Highlights
King County Science and Technical Support Section 73 December 2013
Table 13. Benthic Index of Biologic Integrity Ranking and Scores for Selected the Island
Creeks.
4.4.3 Vashon-Maury Island’s Groundwater Quality
Groundwater water quality impacts may occur naturally or as a result of human activity. Runoff, or
water flowing over the land surface, may pick up pollutants from wildlife and soils. Wells having water
levels close to the ground surface are at most risk. The groundwater and surface water provide all of
the water used on the Island. The majority of the residents obtain their water from shallow water
sources, which are more vulnerable to contamination (VMI GWMC, 1998a and KC, 2005c).
The USEPA posits the following as examples of impacts to groundwater quality (USEPA, 2013):
Bacteria and other microorganisms in the soil.
Underground rocks and soils may contain metals such as arsenic.
Fertilizers used to promote growth on farms, private lawns and golf courses.
Chemicals used to treat homes and lawns to reduce insect damage.
Improper disposal of many common products in households and faulty septic systems can
pollute ground water. Pollutants can include cleaning solvents, used motor oil, or paint thinners.
Even soaps and detergents can harm drinking water.
Heavy metals releases can occur by mining and construction into nearby ground water sources.
Some older fruit orchards may contain high levels of arsenic, once used as a pesticide.
Creek Name Site Identification 2005 2006 2007 2008 2009 2010 2011 2012
Christenson VashChris 34 36 36 32 38 36 30 36
Ellis E1223 14 14 14 14 14 12 — —
65B — — — 30 31.3 32 26.7 20.7
E1227 26 38 36 38 36 20 — —
Gorsuch P847 24 20 24 18 26 20 — —
28A — — — 26 25.3 31.3 29.3 26
VashJudd 30 30 34 — 32 28 36 38
E1231/1232 28 30 32 42 22 28 — —
E2770 24 28 30 38 36 36 — —
McCormick E1219 36 32 32 34 26 28 — —
VashShing 28 32 24 30 14 20 16 24
E1236 18 28 22 30 26 30 — —
65A — — — 32.7 34.7 36 32.7 26
E2887 28 36 40 36 36 28 — —
Rank Score
Excellent 46-50
Good 38-45
Fair 28-37
Poor 18-27
Very Poor 10-17
Modified from http://pugetsoundstreambenthos.org
Using Fore, Wisseman (2012)
Calendar Years
Fisher
Judd
Shinglemill
Tahlequah

Vashon-Maury Island Water Resources – A Retrospective of Contributions & Highlights
King County Science and Technical Support Section 74 December 2013
Spills and improper disposal of harmful chemicals used in commercial businesses can threaten
ground water supplies.
Petroleum products and wastes stored in underground storage tanks and pipes may end up in
the ground water.
Older landfills or unmanaged dump sites may have a wide variety of pollutants that can seep into
ground water.
Within this section, the following freshwater groundwater quality topics are discussed in more detail:
Arsenic
Chloride
Nitrate
Other parameters
4.4.3.1 Arsenic in Groundwater
Arsenic is a metal common in the groundwater in this region and is one of three parameters selected as
an indicator metric for the VMI Sustainability Indicators program (KC, 2013b) due largely to its potential
carcinogenic effects. Arsenic enters water supplies either from natural deposits in the earth or from
industrial and/or agricultural pollution. Arsenic is a parameter of concern as identified by the WA DOH
requirement to have all active sources monitored annually for arsenic and the GWP Committee‘s focus
on environmental indicators (nitrate, arsenic and chloride). The USEPA drinking water standard for
arsenic is a maximum contaminant level (MCL) of10 micrograms per liter (µg/L) (USEPA, 2009).
A county-wide study, entitled Ambient Groundwater Monitoring Study - 2001-2004 Results, was
implemented by King County WLRD. This study reported that arsenic was reported as consistently
having exceeded the MCL (KC, 2005a). King County has monitored 30 locations for arsenic since about
2001 which represents about 3 percent of the over 1,000 wells on the Island. WA DOH reported
arsenic data from 71 public water sources which are 35 percent of the Island‘s 200 public water sources
(KC, 2013b). Data from multiple sources including the Island water purveyors, the King County‘s
Groundwater Protection Program, Public Health‘s Drinking Water Program, and WA DOH Office of
Drinking Water, was used to evaluate an overall condition of arsenic concentrations (Figure 48).
Only arsenic exceeded the MCL for USEPA Drinking Water Standards during King County sampling
events. Arsenic was found at higher concentrations above the MCL in samples from a few wells around
the Island. These wells have deep water sources in older geologic units/aquifers that appear to have
naturally occurring arsenic. The shallower Principal aquifers (younger geologic units) have little to no
arsenic present in the samples of drinking water.
Eleven of the 95 locations sampled had arsenic levels above the MCL, indicating poor conditions (Figures
48 and 49; KC, 2013b). Twenty three locations had sample values between 5 to 10 µg/L. The remaining
61 locations had values below 5 µg/L (KC, 2013b). There was no apparent change in concentration at
wells monitored on a regular basis, although this conclusion was not based on statistical trend testing
(KC, 2013b).

Vashon-Maury Island Water Resources – A Retrospective of Contributions & Highlights
King County Science and Technical Support Section 75 December 2013
Figure 48. Maximum Arsenic Concentrations (µg/L) in Groundwater Samples (1990 to 2010).
Figure 49. Maximum Arsenic Levels in Groundwater at Sampling Wells between 1990 and
2010.
Figure source (KC, 2013b).
LEGEND
Arsenic ConditionsGood (0 – 5 µg/L)
Fair (5 – 10 µg/L)
Poor (>10 µg/L)
Stream
Colvos
Passage
Puget
Sound
0
10
20
30
40
50
60
0 10 20 30 40 50 60 70 80 90 100
Ars
enic
(µ
g/L)
Sites
Maximum Result (1990-2010)
MCL for Arsenic (10µg/L)
Half the MCL for Arsenic

Vashon-Maury Island Water Resources – A Retrospective of Contributions & Highlights
King County Science and Technical Support Section 76 December 2013
The WRE conducted a special study of arsenic at selected monitoring wells by evaluating the arsenic
speciation. Dissolved arsenic in groundwater is typically in two different states: (1) Arsenite As(III) –
H3AsO3 or (2) Arsenate As(V) –H2AsO4 (KC, 2007). Fourteen wells were sampled for arsenic
speciation (Table 14).
In eight wells sampled, the predominant form of arsenic found was arsenite, As(III). The remaining five
wells were found to have mostly arsenate, As(V). Three of the 14 wells had arsenic concentrations over
the MCL (10 µg/L) (KC, 2012e). For public water systems that may have had elevated arsenic
concentrations in the system‘s source water, these public water systems treat the water in a variety of
ways such that the water delivered to the user does not exceed the MCL standard for arsenic. All large
public water systems test the system‘s water after treatment to ensure compliance at the point of
delivery (KC, 2007).
Table 14. Arsenic Speciation Details at Groundwater Sampling Wells.
4.4.3.2 Chloride in Groundwater
Chloride in groundwater can affect potability and may act as a conservative tracer of human activities.
Pumping wells in aquifers that are hydraulically connected to Puget Sound can cause salt water intrusion
into the aquifer. Chloride is also concentrated in animal urine and concentrations of animals (human or
Arsenic
(total)
Arsenite
As(iii)
Arsenate
As(v)
Percent
Arsenite
As(iii)
Percent
Arsenate
As(v)
Depth to
bottom of
well
Bottom
of well
elevation
Dissolved
Oxygen
(µg/L) (µg/L) (µg/L) (%) (%)
(feet
below
ground
surface)
(feet
above
MSL) (mg/L)
W-52 0.67 0.01 0.67 1.30 99.60 80 190 6.87 7.01
W-21 1.66 0.92 0.74 55.50 44.60 133 166 7.90 2.17
W-56 1.85 1.66 0.19 89.70 10.10 139 146 7.49 0.12
W-57 1.89 0.09 1.80 4.80 95.20 160 60 7.81 1.24
W-58 1.67 0.12 1.55 7.30 92.80 180 80 7.60 2.21
W-68 1.24 0.12 1.12 9.30 90.30 132 119 7.73 8.46
W-02A 5.24 0.04 5.20 0.70 99.20 177 83 7.36 3.90
W-66 43.10 36.00 7.17 83.50 16.60 204 96 8.18 0.06
W-67 Zone 3 - QAc 1.41 0.26 1.15 18.20 81.60 160 -30 7.64 0.28
W-54 Zone 3 - QBc 5.69 3.95 1.74 69.40 30.60 185 -125 7.72 2.01
W-07 Zone 3 - QAc 11.80 11.70 0.40 99.20 0.80 297 -37 8.31 3.96
W-04 Zone 3 - QBc 20.10 17.50 2.66 87.10 13.20 305 -107 8.28 0.94
W-09A Zone 3 - QAc 5.03 4.50 0.53 89.50 11.10 450 -39 7.60 0.77
W-12 Zone 3 - QBc 4.86 5.50 0.04 113.20 0.80 473 -363 8.19 1.13
Notes: Colors assigned to show range of values. Darker colors, higher values.
<2 µg/L or % <100 feet below ground surface
<10 µg/L or % 100-200 feet below ground surface
>10 µg/L or % >200 feet below ground surface
MSL = mean sea level
pHWell
NameAquifer Zone
Zone 1 - Qva
Zone 2 - Qac
OR Zone 2 -
Qpf

Vashon-Maury Island Water Resources – A Retrospective of Contributions & Highlights
King County Science and Technical Support Section 77 December 2013
otherwise) have the potential to elevate the chloride levels in groundwater (KC, 2013b). The USEPA
drinking water standard for chloride is 250 mg/L (USEPA, 2009).
The Carr Report reported that wells in the Principal aquifer had specific conductance levels (a surrogate
for chloride levels) at 100 to150 micromhos per centimeter (µmhos/cm), whereas conductance in the
Deep aquifer is about 300 µmhos/cm. The lowest chloride levels were found along the west side of
Vashon Island with levels gradually increasing to the east and north. Isolated areas of higher chloride
levels were also present in some wells along the margins of the Island at about 500 µmhos/cm. Chloride
levels were also reported to have increased in some deep wells over the same time period.
King County has monitored 35 locations for chloride since about 2001 and representing about 4
percent of the over 1,000 wells on the Island. WA DOH reported chloride data from 55 public water
sources which are 28 percent of the Island‘s 200 public water sources (KC, 2013b). Data from multiple
sources including the Island water purveyors, the King County‘s Groundwater Protection Program,
Public Health‘s Drinking Water Program, and WA DOH Office of Drinking Water, were used to
evaluate an overall condition and trend of chloride concentrations.
Figure 50. Maximum Chloride Levels in Groundwater Wells (1990 to 2010).
LEGEND
Chloride Conditions
(mg/L)
Figure source (KC, 2013b).
Good (0 – 100)
Fair (100 - 250)
Poor (>250)
Stream
Colvos
Passage
Puget
Sound
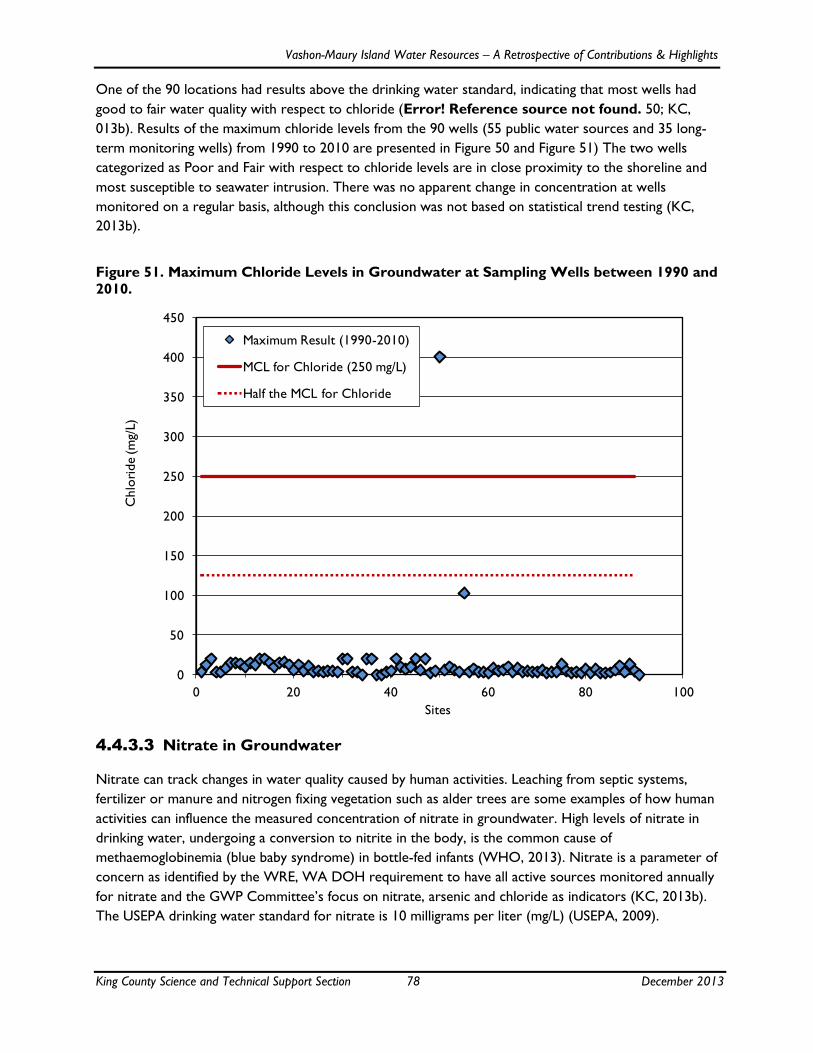
Vashon-Maury Island Water Resources – A Retrospective of Contributions & Highlights
King County Science and Technical Support Section 78 December 2013
One of the 90 locations had results above the drinking water standard, indicating that most wells had
good to fair water quality with respect to chloride (Error! Reference source not found. 50; KC,
013b). Results of the maximum chloride levels from the 90 wells (55 public water sources and 35 long-
term monitoring wells) from 1990 to 2010 are presented in Figure 50 and Figure 51) The two wells
categorized as Poor and Fair with respect to chloride levels are in close proximity to the shoreline and
most susceptible to seawater intrusion. There was no apparent change in concentration at wells
monitored on a regular basis, although this conclusion was not based on statistical trend testing (KC,
2013b).
Figure 51. Maximum Chloride Levels in Groundwater at Sampling Wells between 1990 and
2010.
4.4.3.3 Nitrate in Groundwater
Nitrate can track changes in water quality caused by human activities. Leaching from septic systems,
fertilizer or manure and nitrogen fixing vegetation such as alder trees are some examples of how human
activities can influence the measured concentration of nitrate in groundwater. High levels of nitrate in
drinking water, undergoing a conversion to nitrite in the body, is the common cause of
methaemoglobinemia (blue baby syndrome) in bottle-fed infants (WHO, 2013). Nitrate is a parameter of
concern as identified by the WRE, WA DOH requirement to have all active sources monitored annually
for nitrate and the GWP Committee‘s focus on nitrate, arsenic and chloride as indicators (KC, 2013b).
The USEPA drinking water standard for nitrate is 10 milligrams per liter (mg/L) (USEPA, 2009).
0
50
100
150
200
250
300
350
400
450
0 20 40 60 80 100
Chlo
ride (m
g/L)
Sites
Maximum Result (1990-2010)
MCL for Chloride (250 mg/L)
Half the MCL for Chloride

Vashon-Maury Island Water Resources – A Retrospective of Contributions & Highlights
King County Science and Technical Support Section 79 December 2013
The Carr Report indicated that relatively high nitrate as nitrogen levels were found in the northern and
eastern areas of Vashon Island and the northern and southern ends of Maury Island. King County has
been monitoring nitrate concentrations annually on Vashon-Maury Island since 2001 and has monitored
35 locations for nitrate which represents about 4 percent of the over 1000 wells on the Island. In
addition, Public Health and WA DOH require annual nitrate testing of public water system sources. The
overall condition and trend of nitrate concentrations was evaluated using data from multiple sources
including the Island water purveyors, the King County‘s Groundwater Protection Program, Public
Health‘s Drinking Water Program, and WA DOH Office of Drinking Water (KC, 2013b).
Maximum nitrate as nitrogen levels collected at 190 wells (155 public water systems and 35 long-term
monitoring locations) from 1990 to 2010 indicate that most (186) wells had good conditions (below 5
mg/L) with respect to nitrate with a few (4) sampling locations having fair conditions (between 5 and 10
mg/L) (Figure 52). None were above the USEPA drinking water standard for nitrate (10 mg/L).
Figure 52. Maximum Nitrate Levels in Groundwater Wells (1990 - 2010).
LEGEND
Nitrate Conditions
(mg/L)
Good (0 – 5)
Fair (5 - 10)
Poor (>10)
Stream
Figure source (KC, 2013b).
Colvos
Passage

Vashon-Maury Island Water Resources – A Retrospective of Contributions & Highlights
King County Science and Technical Support Section 80 December 2013
Nitrate levels in shallow Principal and Deep aquifer wells supplying public water systems for the time
period between 1990 and 2013 are shown in Figure 53. Median nitrate levels in Principal aquifer public
water system wells were typically higher than those in public water system wells completed in deeper
aquifers. The average for nitrate in shallow Principal aquifer public water system wells was almost three
times more than the average for public water systems supplied from Deep aquifers. These results
support that the susceptibility to impacts is greater in shallow groundwater systems than in the deeper
groundwater systems.
Figure 53. Nitrate from Shallow and Deep Aquifer Public Water System Groundwater
Samples (1990 – 2013).
Note: The box plot graph was created by first ranking and plotting values smallest to
largest as points without regard to which PWS or date each value came from. The
ends of the box define the 25th and 75th percentile. The line in the box is the
median and the whisker bars indicate the 10th and 90th percentile.
To illustrate the susceptibility of the shallow groundwater on the Island, Figure 53 and the following are
three examples of negative nitrate impacts to groundwater from human and land use activities on
groundwater water quality.
Example 1- Fertilizer usage of manure in the vicinity of a shallow well
Excessive use of raw (uncomposted) manure occurred in garden areas in the vicinity of a shallow (67
feet deep) well in the Vashon advance deposits (Qva). Reportedly high concentrations (3 - 7 mg/L) in the
2000s were compared to historical data (1 - 3 mg/L). After educating the homeowner about improved
practices near wells the homeowner stopped the activity after sampling restarted in 2001. Since then,
nitrate concentration have been decreasing from greater than 6 mg/L down to 3.3 mg/L in 2011 (Figure
54).
Nit
rate
as
nit
roge
n (
mg/
L)
Shallow Aquifer Deep Aquifer
2D Graph 1
X Data
1 2
Y D
ata
0
2
4
6
8
10
Plot 1

Vashon-Maury Island Water Resources – A Retrospective of Contributions & Highlights
King County Science and Technical Support Section 81 December 2013
Figure 54. Response of Nitrate in Groundwater in a Shallow Well (W-16A) to Excessive
Manure Application.
Note: Data sources in parenthesis of legends.
Example 2 - An onsite septic system drain field stopped functioning
An onsite septic system (OSS) failure occurred in the Gold Beach area when a drain field stopped
functioning. Elevated nitrate concentrations relative to historic (about 3 to 1 mg/L) were detected in
groundwater from the Vashon advance deposits (Qva). After the OSS was fixed and or replaced in 2005
nitrate concentrations remained near 4 mg/L until 2012 when the most recent reported value was 1.9
mg/L. (Figure 55).
Figure 55. Response of Nitrate in Groundwater in Shallow Wells to Septic System Failure.
Note: Data sources in parenthesis of legends.
0
2
4
6
8
10
1/1/1970 1/1/1980 1/1/1990 1/1/2000 1/1/2010
Nitra
te a
s N
itro
gen (
mg/
L)
Historic data (WA DOH)
Well VAS_W-16A (KC)
0
2
4
6
8
10
1/1/1970 1/1/1980 1/1/1990 1/1/2000 1/1/2010
Nitra
te a
s N
itro
gen (
mg/
L)
Gold Beach Well #1 (WA DOH)
Gold Beach Well #2 (WA DOH)
Well VAS_W-10A (KC)
Historical data (WA DOH)

Vashon-Maury Island Water Resources – A Retrospective of Contributions & Highlights
King County Science and Technical Support Section 82 December 2013
Example 3 - Land clearing and livestock management practices
A 2007 report prepared by CDM (CDM, 2007) documented a review of five years of livestock and farm
management activities, groundwater, and soil nitrate concentrations on Misty Isle Farms and suggested
that prior to 1990s land clearing and tree removal practices on several parcels on the Island contributed
to elevated nitrate concentrations in local groundwater and in the nearby Burton public water system.
An analysis of the stable isotopes for nitrogen and oxygen was conducted to determine the predominant
source of nitrate at the levels found in the shallow groundwater and compared with that of the fertilizer
used by Misty Isle Farms. CDM applied the results to plots by published reports (Panno et al., 2001;
Kendall and McDonnell, 1998) and stated that the nitrate in groundwater is associated with naturally
present soil organic nitrogen and that the two forms of nitrogen in the fertilizer are within the isotopic
ranges for mineralized and synthetic fertilizer. These results also support that the nitrate present in
groundwater is not from the fertilizer sampled by CDM (CDM, 2007). However, high concentrations of
livestock and excessive pasture fertilization cannot be ruled out as a contributor to the elevated
groundwater nitrate concentrations. In more recent years, the Misty Isle Farms no longer stocks cattle.
Reported nitrate concentrations for pre-treatment, post-treatment and composite samples are shown in
Figure 56 for several wells at Misty Isle Farms and the nearby Burton public water system. These wells
receive water from the Vashon recessional deposits (Qvr) and typically range between 3 and 5 mg/L.
None of the groundwater well samples showed nitrate levels above the USEPA drinking water standard
for nitrate (10 mg/L).
Figure 56. Response of Nitrate in Groundwater in Shallow Wells to Upland Land Clearing
and Agricultural Activities.
Note: Pre-treatment, composite and post-treatment sample designation set by public water system. For example, treatment may
include chlorination.
0
1
2
3
4
5
6
7
8
9
10
1/1/1970 1/1/1980 1/1/1990 1/1/2000 1/1/2010
Nitra
te a
s N
itro
gen (
mg/
L)
MW-1 (MI Farms)
MW-3 (MI Farms)
North Well (MI Farms)
MW-B (MI Farms)
Misty Isle Farms Report (MI Farms)
Pre-Treatment Sample (WA DOH)
Post-Treatment or Composite Sample (WA DOH)

Vashon-Maury Island Water Resources – A Retrospective of Contributions & Highlights
King County Science and Technical Support Section 83 December 2013
4.4.3.4 Other Groundwater Parameters
The Carr Report presented iron levels up to 16.6 mg/L and that the Deep aquifer generally showed
slightly higher iron levels than the Principal aquifer. Relatively high nitrate as nitrogen levels were found
as well as having gradually increasing concentrations.
As in the Carr Report, the GWMP reported that fecal coliforms were detected above regulatory levels
in some wells; some wells showing increasing trends. Iron and manganese were detected in several
wells, as had been in the Carr Report. Levels of mercury and zinc were reported as having a possible
increase from 1989 to 1990 data (VMI GWMC, 1998b).
The Ambient Study reported metal parameters such as arsenic, iron and manganese most frequently
exceeding the MCL (KC, 2005a). These metals are all common in the groundwater in this region.
Sodium levels were elevated in some samples, up to about 58.6 mg/L (KC, 2005a). Iron results were
stable, as expected due to being naturally derived from dissolution of geologic material.
Groundwater samples collected in 2001 and 2002 for the Ambient Study (KC, 2005a) had no detections
of volatile and synthetic organic compounds. In addition, samples tested during the WRE study (KC,
2006 and 2006b) in 2005 and 2007, had no detections for selected organic compounds, such as
pesticides, herbicides and endocrine disrupting compounds.

Vashon-Maury Island Water Resources – A Retrospective of Contributions & Highlights
King County Science and Technical Support Section 84 December 2013
5.0. SUMMARY OF SCIENTIFIC
FINDINGS
Climate and water resources conditions on Vashon-Maury Island were presented in Sections 3.0 (Island-
wide Climate Conditions) and 4.0 (Island-wide Water Resources). The following subjects were discussed
in detail and the highlights of the findings are summarized in this section:
Climatic conditions
Air Temperature
Precipitation
Stream Flows
Hydrologic Water Budget
Island-Wide Water Resources
Water Usage
Groundwater Quantity
Marine Water Quality
Freshwater Surface Water Quality
Groundwater Quality
5.1 Findings for Climatic Conditions
The climatic conditions for Vashon-Maury Island are summarized as:
The mean monthly average air temperature for the first half of the last century ranged between
38.7 to 62.9 degrees Fahrenheit. There has not been much work done to develop a more
current understanding of air temperatures and the spatial pattern of temperatures across the
Island.
Average annual temperatures rose in the Pacific Northwest on average about 1.5 degrees
Fahrenheit in the last century. A warming temperature trend is occurring in this region and is
present in local and regional data. The long-term rise in global surface land and seawater
temperatures and ocean heat anomalies appears to have stalled in the recent decade. This
change in the warming rates since the 1990‘s is also present in local data. The pause is likely due
to several factors.
Precipitation data collection has been sporadic and sparsely located across the Island. A spatial
pattern is present with precipitation rates increasing from the east to the west, between about
35 and 50 inches per year.
Recent studies show that since 2005, the Island receives between -4 to 15 percent of the
precipitation observed at the Seattle-Tacoma International Airport and that this difference
occurs only about 4.5 miles southwest of the airport.
The creeks in the 75 drainage basins on the Island originate from a series of upland seeps and
springs and flow down steep and incised ravines into the Puget Sound and Colvos Passage.
Seasonally varying spring discharges emerge in valleys or on hillsides, making spring discharge
difficult to quantify.
Peak flows occur during winter months in response to increased precipitation and uniform low
flows occur through the summer months from late May through August. Annual stream flow
data indicated responses were as expected with increases in discharge during wet years and
decreases during drier periods.

Vashon-Maury Island Water Resources – A Retrospective of Contributions & Highlights
King County Science and Technical Support Section 85 December 2013
There does not appear to be a systematic trend in stream flow flashiness. Additional data is
required to determine if any changes are occurring beyond the variability induced by interannual
variation in precipitation.
The 7-day moving average low-flows were maintained or improved from 2001 to 2010. The
Baseflow Index (ratio of baseflow or groundwater inflow to total stream flow) for Shinglemill,
Judd, Fisher and Tahlequah Creeks had values of 70, 69, 79 and 74 percent, respectively.
Groundwater contribution to the total annual stream flow was between 69 to 79 percent.
Relative baseflow contributions during summer were higher by about 17 to 25 percent. Results
suggest that reductions in groundwater discharge to streams during this period, as a result of
increased groundwater withdrawals for example, could impact the instream flows needed to sustain fish and maintain water quality.
5.2 Findings of the Island-wide Hydrologic Budget
Highlights of the island-wide hydrologic budgets completed for Vashon-Maury Island are:
Analytical methods to assess the island-wide water budget concluded that the Island had only
precipitation as the source of recharge and that outflow from the hydrologic system included
evapotranspiration, stream flow, and discharge to Puget Sound through the groundwater.
Four water budgets (Carr Report, GWMP, and WRE Phases I and II) were proposed since the
1980s, each using more data, detailed analysis and both analytical and computer modeling
techniques. Estimates varied based on differing assumptions of inflows and outflows, using more
available data and improved modeling techniques.
The more recent and more accurate computer models (WRE-Phase I and II) were able to
replicate previous observations and incorporate recharge due to irrigation and septic flow and
discharges due to wells and springs. In addition, more recent monitoring data and geologic
mapping efforts were used to better refine the assumptions and showed that many features that
had been observed previously about the Island‘s groundwater could be replicated.
The estimated amount of discharge to Puget Sound is larger in the WRE-Phase I model than in
previous studies. The WRE-Phase I and II models yielded similar groundwater inflow (recharge)
estimates that were less than that of the GWMP while being twice the amount calculated by the
initial work in the Carr Report.
A difference between the results of the WRE Phase I and II modeling and GWMP budgets is the
amount of water creating a freshwater lens beneath the Island. Resulting budgets of the GWMP
and the Carr Report estimated the majority of the groundwater inflow going to the streams and
not infiltrating into deeper zones before discharging to Puget Sound. The WRE-Phase I and II
models reported greater volumes of water infiltrating (Puget Sound outflow) into these deeper
zones.
5.3 Findings for Island-Wide Water Resources
5.3.1 Water Usage
Highlights of island-wide water usage on Vashon-Maury Island are:
The population of the Island is growing steadily, historically at about two percent per year, and
will likely continue to grow at a rate of 100 people per year, currently 1percent of the
population.
Vashon-Maury Island Water Resources – A Retrospective of Contributions & Highlights
King County Science and Technical Support Section 86 December 2013
Estimated average water use has been measured at between about 100 and 120 gallons per
person per day. Municipal and domestic water demand on the Island was calculated to be
approximately 375 million gallons per year in 2010. Out of the at least 1,000 permit exempt
wells on the Island, eight self-metered wells showed a range of usage patterns.
Group A public water system water providers have a range of average daily usage of 100 to 200
gallons per day per connection. Increased usage occurs during May through October with 60 to
75 percent of the total annual use during this period, similar to some exempt well users.
Water use peaks in the summer by a factor of 1.8 based on an island-wide average, whereas, the
summer water use peaking factors ranged from 1.2 to 2 at selected Group A public water
systems.
The 10 year (2001-2010) average of total island-wide water consumption is 515 million gallons
per year. The annual total consumption ranged from 496 to 535 million gallons per year during
this period. The overall per capita water consumption during the time period 2001 through
2010 was 83 gallons per day. Typically, consumption increased during periods with lower rainfall
totals and decreased during periods with higher rainfall totals.
Modeling results yielded noticeable drawdown in the vicinity of some Group A public water
system wells, though generally very small numerically, and it also showed slightly higher shallow
groundwater levels in many other areas of the Island, where increased septic system returns
were modeled.
5.3.2 Groundwater Quantity
The groundwater quantity findings for Vashon-Maury Island can be summarized as:
The three main groundwater bearing geologic units of interest on the Island are Zone 1 -
shallow Vashon recessional outwash deposits (Qvr) and Principal/ Main Vashon advance
outwash deposits (Qva) ; Zone 2 – Deep 1 Pre Fraser coarse grained deposits (Qpfc ); and
Zone 3 - Deep 2 Olympia coarse grained deposits (Qpoc) and deeper units.
Groundwater contour maps indicate that slopes are steeper on the west than on the east and
steeper in the spring than the fall. Vertical groundwater gradients (and thus flows) were
downward throughout the Island, although somewhat less along the coastline, where deep
groundwater must flow up towards Puget Sound discharge locations.
Water table contour maps of the Qva/Principal aquifer have not changed substantially over time
(1982-2010) illustrating that the Qva/Principal aquifer unit responds consistently over time and
the patterns are consistent with our basic understanding of unconfined groundwater hydrology,
where water level contours reflect overlying topography.
Measured groundwater levels in wells showed responses to seasonal and long-term recharge
variations, tidal and barometric influences and pumping. The largest responses were observed in
the recharge areas of the Principal/Main Qva aquifer.
Water level fluctuations showed different patterns in the Principal/Main Qva aquifer from those
in the deeper aquifers. These fluctuations tended to correlate with rainfall (with lags of time up
to four months), with seasonal highs in during summer months and lows during fall months.
Some wells showed little to no seasonal influence, indicating the wells were not screened in
units directly recharged by rainfall.
The GWMP reported that long-term (1989-1992) trends indicated that the hydrostratigraphic
zones were generally stable and had not been affected by ground water withdrawals. Overall,
data from 2001 through 2012 indicated that levels were generally stable with no significant declines.
Vashon-Maury Island Water Resources – A Retrospective of Contributions & Highlights
King County Science and Technical Support Section 87 December 2013
5.3.3 Marine Water Quality
The marine water quality conditions for the Vashon-Maury Island can be summarized as:
Dissolved oxygen levels below the Washington State water quality standard (extraordinary
criteria of 7 mg/L) have been observed in Quartermaster Harbor over the last seven years (KC,
2010c and 2013f).
For data collected since 2006, all marine water sampled met state water quality criteria for fecal
coliform bacteria. All samples were well below the WA standard for fecal coliform bacteria in
marine waters. In addition, there also were no exceedances of the criteria of marine water
quality samples collected by WA DOH along Quartermaster Harbor for fecal coliform analysis.
5.3.4 Freshwater Surface Water Quality
The freshwater surface water quality conditions for Vashon-Maury Island can be summarized as:
The water quality index for each location varied year to year. Overall for 2007 through 2011,
WQI scores varied from one year to the next and data are currently not sufficient (of adequate
length) to conduct statistical trend analysis. However, conditions appear to be improving.
Fecal coliform bacteria levels in Judd, Fisher, Mileta and Christensen Creeks from 2007 through
2011 had exceedances of the state extraordinary criteria for at least one year. Exceedances of
the criteria occurred repeatedly for the time period on Fisher and Judd Creeks. Cattle and
horse manure, septic systems, and farming practices are all potential sources of fecal coliform
bacteria to these streams.
The Nearshore Freshwater Inflows Assessment reported that the range in nitrate
concentrations measured in October 2010 in small freshwater inflows to Quartermaster Harbor
were larger than that observed since 2006 in monthly grab samples collected in three of the
largest tributaries to the harbor (Fisher, Judd and Mileta Creeks).
Routine monthly samples taken from Fisher, Judd and Mileta Creek showed a seasonal trend of
lower concentrations of nitrate plus nitrite nitrogen in summer months (May through October)
and higher concentrations of nitrate plus nitrite nitrogen in winter months (November through
April). This pattern is typical of rural lowland streams, highest concentrations occur during
winter when plant uptake is lowest and rain flushes nitrates from surface soils into nearby
streams and lowest concentrations occur during summer when plant uptake is greatest and soils
are general dry and accumulating nitrate.
Although there were increases in nitrate in all streams during the winter months, the nitrate
results from the sampling locations in Mileta Creek were reported as elevated and several times
higher in concentration than in Judd and Fisher Creeks in the Quartermaster Harbor area
during the winter months. The Mileta Creek Nitrogen Source Tracking Study (part of the
Quartermaster Harbor Nitrogen Management Study) was then conducted to identify locations
on Mileta Creek where nitrate concentrations are elevated during winter months and to
evaluate possible sources. The actual source for elevated winter nitrate concentrations
observed in Mileta Creek remains unknown, but has been isolated to the reaches upstream of
the main stem of Mileta Creek.
With the exception of a few temperature exceedances on Judd and Fisher Creeks, overall
stream temperatures for the Island creeks are typically below the state criteria of 16 degrees C,
indicating good water quality with respect to stream temperature during water years 2000 to
about 2011. As expected, the exceedances on Judd and Fisher Creeks occurred during the
months of July or August.
Overall, the Benthic Index of Biological Integrity scores of samples from the streams scored
between ―Very Poor‖ and ―Fair‖ rankings. These rankings appear to be low for rural streams

Vashon-Maury Island Water Resources – A Retrospective of Contributions & Highlights
King County Science and Technical Support Section 88 December 2013
having low development. Overall, the Island‘s B-IBI scores vary with a few locations increasing
overall and others decreasing improving and a few locations worsening in recent years over time. There are currently insufficient data to conduct statistical trend analysis..
5.3.5 Groundwater Quality
The groundwater water quality conditions for Vashon-Maury Island can be summarized as:
Arsenic is common in the deeper groundwater in this region and was measured consistently at
higher than the USEPA drinking water standard, indicating poor conditions in wells drawing
water from Deep aquifers.
There was no apparent change in arsenic at wells monitored on a regular basis and there were
not enough samples collected to evaluate if a trend exists.
In the past 15 years, only one well had chloride above the drinking water standard, indicating
that most wells had good to fair water quality with respect to chloride. There was no apparent
change in concentration at wells monitored on a regular basis.
Recent studies showed maximum nitrate as nitrogen levels collected at 190 wells from 1990 to
2010 indicate that most wells had good conditions (below 5 mg/L) with respect to nitrate with a
few sampling locations having fair conditions (between 5 and 10 mg/L). None were above the
USEPA drinking water standard for nitrate (10 mg/L).
Since 1990, median nitrate levels in shallow public water system wells were typically higher than
those in deep public water system wells. The average for nitrate in shallow public water system
wells was almost three times more than the average for deep public water systems. These
results support that the susceptibility to impacts is greater in shallow groundwater systems than
in the deeper groundwater systems.
With the exception of arsenic, no samples exceeded the MCL for USEPA Drinking Water
Standards during King County sampling events including selected organics
(pesticides/fertilizers/Endocrine Disrupting Compounds). The WA DOH dataset of public water
systems on the Island show similar results as the King County monitoring data with no reported
exceedances.

Vashon-Maury Island Water Resources – A Retrospective of Contributions & Highlights
King County Science and Technical Support Section 89 December 2013
6.0. MOVING FORWARD
6.1 Future Sustainability Monitoring
In 2010, the GWP Committee generated a list of eleven sustainability indicators for the Island‘s water
resources (Table 3). These indicators, divided into four main groups of water quality, water quantity,
ecosystem health and water use/management measure progress in approaching or meeting the target
goals set to preserve the water resources quality and quantity on the Island. Ongoing monitoring and
project work on the Island is aligned with these sustainability indicators. More detail about the VMI
Sustainability Indicators is presented in Appendix A.
6.2 Key Challenges
6.2.1 Continuing to Engage and Educate Islanders
A variety of activities such as engaging stakeholders, managing volunteer well owners and salmon
watchers, and holding public meetings have occurred on the Island. Various efforts to educate residents
on groundwater, surface water, wastewater treatment and conservation were also completed. A recent
example is the Protecting our Liquid Assets (KC, 2012b) series of informational pages developed to
encourage Islanders to work together to educate Islanders about their water resources. The Protecting
our Liquid Assets series of mailers sent to residents was a collaboration of the GWP Committee and KC
WLRD. The series subjects were:
Island Stories
Watch Out for that Ditch!
What‘s Your Watershed Address?
Going Under Ground - Geology of ―The Rock‖
Setting the Water Table
Sipping Sand Slurpies
Experienced Water, Where Does It All GO?
Doing Our Business
While these efforts have been useful for educational purposes and involved many residents, the number
of volunteers for the Salmon Watchers and the Groundwater Well Self-Monitoring Program have
declined. As a result, the Salmon Watcher program is no longer active on the Island and only four
private well owners remain in the Groundwater Well Self-Monitoring Program.
An education and outreach program was included as part of the Quartermaster Harbor Nitrogen
Management Study. The Phase 1 Findings were presented at a public meeting on Vashon Island on
October 6, 2010 to introduce to the Islanders the background, tasks, and outputs of the study (KC,
2010c). An update was given to the residents on October 12, 2011 using technical posters and
presentations on all aspects of the study, including water monitoring, special studies, model
development, and policy recommendations (KC, 2011a). In addition, a project overview and technical
presentations were given at the Salish Sea Ecosystem Conference in Vancouver, British Columbia,
Canada on October 25-27, 2011(KC, 2011b).

Vashon-Maury Island Water Resources – A Retrospective of Contributions & Highlights
King County Science and Technical Support Section 90 December 2013
Quarterly updates on all aspects of water resources work are given to the GWP Committee during the
year and will continue, as requested by the GWP Committee, in the future.
6.2.2 Implications of the Earth Justice Challenge
Earth Justice is a non-profit public interest law firm dedicated to protecting natural resources and
wildlife, and to defending the right of people to a healthy environment. The organization currently has
presented a legal challenge concerning permit exempt well management in closed stream basins
(Washington Administrative Code (WAC) 173-507-030; WAC 173-508-040; WAC 173-509-040; WAC
173-510-040; and WAC 173-515-040) and relationship to salmon listings under the Endangered Species
Act. The result of this challenge may have implications for quantifying water availability and for tracking
water rights more closely.
6.2.3 Adapting to a Changing Climate
Ecology reports that:
―Many of these challenges created by changing climate and environmental conditions are
similar to those we have been wrestling with for decades – water supply and quality,
ecosystem health, air quality, and shoreline and habitat protection and restoration. But the
rate and severity of the changes we are likely to witness in the coming years will be unlike
anything Washingtonians have ever experienced.‖ (WA Ecology, 2012)
Statewide trends of worsening conditions are evident and projections follow a similar trend. In addition,
Washington State reports that ―climate-influenced conditions and events such as temperatures, sea
levels, and storms can no longer be expected to remain within their historical ranges, and these trends
are likely to continue well beyond the end of the 21st century.‖ (WA Ecology, 2012).
Human health and economic impacts are also showing worsening trends. Some examples of these
impacts are increased coastal and storm damage costs, increased energy-related costs (reduced
hydropower production and increased demand), increased wildfire costs, increased health-related costs,
and costs associated with reduced water availability. The state is ―already experiencing challenging
economic conditions. The risks of not taking action to address climate change impacts now will only
compound these economic challenges.‖ (WA Ecology, 2012).
The Watershed Plan (KC, 2005c) posed climate change could impact the Island could be in several ways,
such as seawater intrusion, increased water usage, and/or reduced recharge. Recharge to the
groundwater system of the Island will be affected by changes to precipitation patterns. Less total annual
rainfall would lead to less groundwater recharge while increased rainfall may lead to more surface water
discharge than groundwater recharge Any assessment of future water needs for the Island needs to
include some consideration of potential climate change impacts and leave a margin of safety to help
address the uncertainty that remains (KC, 2005c).
Continuing to collect or analyze available scientific indicator data related to these impacts will assist in
planning for adaptations to these changing environmental conditions and to reduce the impact of
worsening conditions.
Vashon-Maury Island Water Resources – A Retrospective of Contributions & Highlights
King County Science and Technical Support Section 91 December 2013
6.2.4 Uncertainties Affecting Water Resources
6.2.4.1 Water Availability
In 1998, the Vashon-Maury Island Ground Water Management Plan noted that during the 1990s several
public water systems were experiencing shortages (Water District 19, Heights, Burton and Westside)
(VMI GWMC, 1998a). Since that time, Dockton Water has been able to keep a constant average daily
consumption (Dockton Water, 2013). Heights Water members have greatly reduced their consumption
through conservation methods (Heights Water, 2011 and 2013).
In the 2007 Water System Plan for Vashon-Maury Island‘s Water District 19 (the ―District‖), the
District reported that although the water rights are sufficient to meet the current and anticipated needs
of the District, the District does not have enough source capacity to meet WA DOH recommendations
during summertime peak usage (District 19, 2008). Water supply is limited by the inability of the existing
sources of supply to keep up with historic peak water system demands. This is the limiting system factor
prohibiting the addition of new connections to the system (District 19, 2008). Alternatives were
identified and recommended for further analysis. In 2012, ending a 15 year moratorium on new water
shares was lifted, in part due to conservation by customers and from a new well. The District released
30 shares to those on its lengthy wait list (VMI Beachcomber, 2011 and 2013).
All of these purveyors are working to reduce their system loss (Burton Water, 2013; Dockton Water,
2013; Heights Water, 2011 and 2013; and District 19, 2013) and at the present time these purveyors
are considered adequate for existing uses and adding new service connections up to the number of
approved service connections (WA DOH, 2013a). These water purveyors have been able to meet
demand through increased conservation methods and improving infrastructure issues causing leakage.
Changing climate conditions and aging infrastructure may have an impact on the water availability in the
future.
6.2.4.2 How Much Water Are We Really Using?
There is no current requirement for recording the volume of water pumped at exempt wells, nor for
enforcing allowable amounts. As a result, it is unknown exactly how much water is consumed and used
on the Island from these types of wells. A few exempt well owners on the Island have volunteered and
self-monitored their well usage. This has assisted in collecting some information on this subject. Due to
the wide range of uses of the wells (irrigation, seasonal or year-round garden use, grass watering, farm
animal water, etc), conditions of the pumps, and the large number of exempt wells on the Island, it is
unlikely that these values reasonably represent actual island-wide usage.
A more extensive and longer program would refine the knowledge island-wide and improve the
understanding of the Island‘s wider use of exempt wells.
6.2.4.3 Institutional Funding for Water Resources Monitoring
The ending of capital funding in recent years for the County‘s Groundwater Protection Program
reduced the budget by about $200,000 per year for monitoring and outreach activities on the Island.
The reduction of financial resources may have had a negative impact on volunteerism. As a result, water

Vashon-Maury Island Water Resources – A Retrospective of Contributions & Highlights
King County Science and Technical Support Section 92 December 2013
resources data that may help with understanding the impacts on where water is available and where
water is impacted are not being collected.
In mid-2012, it was reported to the GWP Committee that the King County code authorizing the GWP
Committee will sunset at the end of December 2013 if reauthorization legislation is not enacted by the
King County Council. King County advised that the GWP Committee could pursue one of three broad
legislative options: (1) dissolve the GWP Committee at the end of 2013, (2) seek an extension with the
same ―groundwater protection‖ mandate currently outlined in King County Code, or (3) seek an
extension with a new ―watershed and groundwater protection‖ mandate (KC, 2012f).
King County offered a recommendation that the GWP Committee seek a legislative extension with a
new ―watershed and groundwater protection‖ mandate to reflect their broader interest for water
resources, beyond groundwater. The basis for this recommendation was cited as the preparation of the
Vashon-Maury Island Watershed Plan in 2005, the multiple watershed management recommendations
submitted by the GWP Committee for consideration in the 2012 King County Comprehensive Plan
amendment and the GWP Committee‘s strong interest in watershed sustainability (KC, 2012f).
The funding for future water resource efforts on the Island is uncertain. At the time of this report, the
GWP Committee has decided to request authorization from the King County Council and has voted to
continue as a ―groundwater protection‖ committee but still want to do a variety of watershed activities.
The GWP Committee also wants additional services to be done, likely requiring more funding. The
focus would be on VMI Sustainability Monitoring, described in Appendix A.

Vashon-Maury Island Water Resources – A Retrospective of Contributions & Highlights
King County Science and Technical Support Section 93 December 2013
7.0. REFERENCES Adelsman, Hedia. 2013. Initial Recommendations for Local Source Reduction. WA Department of
Ecology. Presentation.
Baker, D.B., P. Richards, T.L. Loftus, and J.W. Kramer (Baker et al). 2004. A New Flashiness Index:
Characteristics and Applications to Midwestern Rivers and Streams. Journal of the American
Water Resources Association 40(2):503 – 522.
http://chagrin.epa.state.oh.us/dsw/nps/NPSMP/docs/JAWRA_03095_Baker.pdf
Berryman & Henigar, Inc. and Udaloy Environmental Associates (B&H/UES). 2004. Vashon Island Landfill
Hydrogeologic Report Update. Prepared for King County Department of Natural Resources,
Solid Waste Division. December.
Booth, D. B. 1991. Geologic Map of Vashon and Maury Islands, King County, Washington. U.S.
Geological Survey Miscellaneous Field Studies Map: 2161.
http://pubs.usgs.gov/mf/1991/2161/report.pdf
Burton Water Company (Burton Water). 2013. Water Use Efficiency Annual Performance Report –
2012. June 14.
https://fortress.wa.gov/doh/eh/portal/odw/si/SingleSystemViews/RptViewSingleSys.aspx?rptName
=wue&orgnum=09800&RptYear=2012
Carr/Associates (Carr/Assoc.). 1983. Vashon/Maury Island Water Resources Study. Submitted to the
King County Department of Planning and Community Development. December 1, 1983.
CDM. 2007. Conditional Permit Summary Report (2002 – 2006); Development Services of America,
Misty Isle Farms, Vashon Island, Washington. March 6, 2007.
DeGasperi, Curtis L., Hans B. Berge, Kelly R. Whiting, Jeff J. Burkey, Jan L. Cassin, and Robert R.
Fuerstenberg (DeGasperi et al). 2009. Linking Hydrologic Alteration to Biological Impairment in
Urbanizing Streams of the Puget Lowland, Washington, USA. Journal of the American Water
Resources Association (JAWRA) 45(2):512-533. DOI: 10.1111/j.1752-1688.2009.00306.x
http://onlinelibrary.wiley.com/doi/10.1111/j.1752-1688.2009.00306.x/pdf
Dockton Water Association (Dockton Water). 2013. Water Use Efficiency Report – 2012. July 26.
https://fortress.wa.gov/doh/eh/portal/odw/si/SingleSystemViews/RptViewSingleSys.aspx?rptName
=wue&orgnum=19550&RptYear=2012
The Economist. 2013a. Apocalypse perhaps a little later: Climate change may be happening more slowly
than scientists thought. But the world still needs to deal with it. Print Edition. March 30.
http://www.economist.com/news/leaders/21574490-climate-change-may-be-happening-more-
slowly-scientists-thought-world-still-needs

Vashon-Maury Island Water Resources – A Retrospective of Contributions & Highlights
King County Science and Technical Support Section 94 December 2013
The Economist. 2013b. A sensitive matter: The climate may be heating up less in response to
greenhouse-gas emissions than was once thought. But that does not mean the problem is going
away. Print Edition. March 30.
http://www.economist.com/news/leaders/21574490-climate-change-may-be-happening-more-
slowly-scientists-thought-world-still-needs
Garling, M.E., D. Molenaar, et al (Garling et al). 1965. Water Resources and Geology of the Kitsap
Peninsula and Certain Adjacent Islands. Washington Division of Water Resources, Water Supply
Bulletin No. 18. With contributions by the US Geological Survey.
http://www.ecy.wa.gov/programs/eap/wsb/wsb_Hydrologic-Systems.html
Guemas, Virginia, F. J. Doblas-Reyes, I. Andreu-Burillo and M. Asif (Guemas et al). 2013. Retrospective
prediction of the global warming slowdown in the past decade. Nature Climate Change. Volume
3. Pages 649–653. April 07.
http://www.nature.com/nclimate/journal/v3/n7/full/nclimate1863.html
Hallock, D. 2009. River and Stream Water Quality Monitoring Report, Water Year 2008. Washington
State Department of Ecology Freshwater Monitoring Unit, Environmental Assessment Program.
Publication No. 09-03-041. August.
https://fortress.wa.gov/ecy/publications/summarypages/0903041.html
Heights Water. 2011. Water Use Efficiency Program. May 24.
http://www.heightswater.org/
Heights Water. 2013. Water Use Efficiency Annual Performance Report – 2012. May 21.
https://fortress.wa.gov/doh/eh/portal/odw/si/SingleSystemViews/RptViewSingleSys.aspx?rptName
=wue&orgnum=32300&RptYear=2012
Kendall, C and J.J. McDonnell. 1998. Isotope Tracers in Catchment Hydrology. Elsevier Science B.V. pp.
519-576.
King County (KC). 2003. King County Groundwater Program – 2002 Annual Report. April 1.
King County (KC). 2004a. Vashon-Maury Island Water Resources Evaluation Work Plan. Prepared by
King County Department of Natural Resources and Parks, Water and Land Resources Division,
Seattle, Washington.
http://your.kingcounty.gov/dnrp/library/archive-documents/wlr/wq/vashon-island/pdf/Vashon-
Maury-Island-plan.pdf
King County (KC). 2004b. Vashon-Maury Island Rapid Rural Reconnaissance Report. Prepared by King
County Department of Natural Resources and Parks, Water and Land Resources Division.
Seattle, Washington.
http://www.kingcounty.gov/environment/watersheds/central-puget-sound/vashon-maury-
island/recon-report.aspx

Vashon-Maury Island Water Resources – A Retrospective of Contributions & Highlights
King County Science and Technical Support Section 95 December 2013
King County (KC). 2005a. Ambient Groundwater Monitoring -- 2001-2004 Results. Prepared by Anchor
Environmental and King County Department of Natural Resources and Parks, Water and Land
Resources Division. Seattle, Washington.
http://www.kingcounty.gov/environment/waterandland/groundwater/maps-reports/ambient-
monitoring01-04.aspx
King County (KC). 2005b. Vashon-Maury Island Phase I Groundwater Model – A Part of the Vashon-
Maury Island Water Resources Evaluation. Prepared by the King County Department of Natural
Resources and Parks, Water and Land Resources Division.
http://your.kingcounty.gov/dnrp/library/2005/kcr1895.pdf
King County (KC). 2005c. Vashon-Maury Island Watershed Plan. Prepared by King County Department
of Natural Resources and Parks, Water and Land Resources Division. June 6.
http://www.kingcounty.gov/environment/watersheds/central-puget-sound/vashon-maury-
island/watershed-plan.aspx
King County (KC). 2006. Vashon-Maury Island 2005 Water Resources Data Report. Prepared by Eric
W. Ferguson, King County Department of Natural Resources and Parks, Water and Land
Resources Division. Seattle, Washington.
http://your.kingcounty.gov/dnrp/library/2006/kcr2106_2005.pdf
King County (KC). 2007. Vashon-Maury Island 2006 Water Resources Data Report. Prepared by Eric
W. Ferguson, King County Department of Natural Resources and Parks, Water and Land
Resources Division. Seattle, Washington.
http://your.kingcounty.gov/dnrp/library/2007/kcr2106_2006.pdf
King County (KC). 2008a. Areas Susceptible to Groundwater Contamination in King County. Prepared
and maintained by the King County Department of Natural Resources and Parks, Water and
Land Resources Division. Seattle, WA.
http://www5.kingcounty.gov/sdc/Metadata.aspx?Layer=asgwc
King County (KC). 2008b. Vashon-Maury Island 2007 Water Resources Data Report. Prepared by Eric
W. Ferguson, King County Department of Natural Resources and Parks, Water and Land
Resources Division. Seattle, Washington.
http://your.kingcounty.gov/dnrp/library/2008/kcr2106_2007.pdf
King County (KC). 2009a. Vashon-Maury Island 2008 Water Resources Data Report. Prepared by Eric
W. Ferguson, King County Department of Natural Resources and Parks, Water and Land
Resources Division. Seattle, Washington.
http://your.kingcounty.gov/dnrp/library/2009/kcr2106_2008.pdf

Vashon-Maury Island Water Resources – A Retrospective of Contributions & Highlights
King County Science and Technical Support Section 96 December 2013
King County (KC). 2009b. Vashon-Maury Island Hydrologic Modeling – Technical Report. Prepared by
DHI Water & Environment for King County Department of Natural Resources and Parks,
Water and Land Resources Division. Seattle, Washington.
http://www.kingcounty.gov/environment/waterandland/groundwater/management-areas/vashon-
maury-island-gwma/vashon-island/WRE-Phase2-modeling-report.aspx
King County (KC). 2010a. Initial Assessment of Nutrient Loading to Quartermaster Harbor. Prepared
by Curtis DeGasperi, King County Department of Natural Resources and Parks, Water and
Land Resources Division. Seattle, Washington.
http://your.kingcounty.gov/dnrp/library/2010/kcr2119.pdf
King County (KC). 2010b. Vashon-Maury Island 2009 Water Resources Data Report. Prepared by Eric
W. Ferguson, King County Department of Natural Resources and Parks, Water and Land
Resources Division. Seattle, Washington.
http://www.kingcounty.gov/environment/waterandland/groundwater/management-areas/vashon-
maury-island-gwma/vashon-island/WRE-data-report.aspx
King County (KC). 2010c. Quartermaster Harbor Nitrogen Management Study Public Workshop.
Prepared by King County Department of Natural Resources and Parks, Water and Land
Resources Division in cooperation with University of Washington Tacoma and Washington
State Department of Ecology. Public Presentation at Vashon Island High School. October 6.
http://your.kingcounty.gov/dnrp/library/water-and-land/watersheds/central-puget-sound/vashon-
maury-island/QMH_VashonHighSchool_101006.pdf and
http://your.kingcounty.gov/dnrp/library/water-and-land/watersheds/central-puget-sound/vashon-
maury-island/QMH_VHS_UWT_20101006.pdf
King County (KC). 2011a. Quartermaster Harbor Nitrogen Loading Study: Phase One Findings.
Prepared by King County Department of Natural Resources and Parks, Water and Land
Resources Division in cooperation with University of Washington Tacoma and Washington
State Department of Ecology. Public Presentation at Vashon Island High School. October 12.
http://your.kingcounty.gov/dnrp/library/water-and-land/watersheds/central-puget-sound/vashon-
maury-island/QMH_VashonHighSchool_101006.pdf and
http://your.kingcounty.gov/dnrp/library/water-and-land/watersheds/central-puget-sound/vashon-
maury-island/QMH_VHS_UWT_20101006.pdf
King County (KC). 2011b. Quartermaster Harbor Nitrogen Management Study: Project Overview and
Preliminary Nitrogen Loading Estimates to the Harbor. Prepared by King County Department of
Natural Resources and Parks, Water and Land Resources Division in cooperation with
University of Washington Tacoma and Washington State Department of Ecology. Public
Presentation at Salish Sea Ecosystem Conference, Vancouver, BC, Canada. October 25.
http://your.kingcounty.gov/dnrp/library/water-and-land/watersheds/central-puget-sound/vashon-
maury-island/QMH_Salish-Sea-2011.pdf

Vashon-Maury Island Water Resources – A Retrospective of Contributions & Highlights
King County Science and Technical Support Section 97 December 2013
King County (KC). 2012a. Mileta Creek Nitrogen Source Tracking Study. Prepared by Curtis DeGasperi
and Eric Ferguson, King County Department of Natural Resources and Parks, Water and Land
Resources Division. Seattle, Washington.
http://your.kingcounty.gov/dnrp/library/2012/kcr2309.pdf
King County (KC). 2012b. Protecting Our Liquid Assets: Water Resource Information for Vashon-
Maury Island. Includes ―Island Stories‖, ―Watch Out for that Ditch!!‖, ―What‘s Your Watershed
Address?‖, ―Going Under Ground - Geology of ―The Rock‖‖, ―Setting the Water Table‖,
―Sipping Sand Slurpies‖, ―Experienced Water, Where Does It Go?‖, and ―Doing Our Business‖.
http://www.kingcounty.gov/environment/waterandland/groundwater/management-areas/vashon-
maury-island-gwma/liquid-assets.aspx
King County (KC). 2012c. Quartermaster Harbor Benthic Flux Study. Prepared by Curtis DeGasperi,
King County Department of Natural Resources and Parks, Water and Land Resources Division.
Seattle, Washington.
http://your.kingcounty.gov/dnrp/library/2012/kcr2320.pdf
King County (KC). 2012d. Quartermaster Harbor Nearshore Freshwater Inflows Assessment. Prepared
by Curtis DeGasperi and Eric Ferguson, King County Department of Natural Resources and
Parks, Water and Land Resources Division. Seattle, Washington.
http://your.kingcounty.gov/dnrp/library/2012/kcr2319.pdf
King County (KC). 2012e. Vashon-Maury Island Water Resources Assessment Report (not published).
Prepared by Eric Ferguson, King County Department of Natural Resources and Parks, Water
and Land Resources Division. Seattle, Washington.
King County (KC). 2012f. Vashon-Maury Island Groundwater Protection Committee Meeting Notes,
July 25, 2012. Prepared by King County Department of Natural Resources and Parks, Water and
Land Resources Division. Seattle, Washington.
King County (KC). 2013a. Assessing Our Liquid Assets: A Report Card to the Community
http://www.kingcounty.gov/environment/waterandland/groundwater/management-areas/vashon-
maury-island-gwma/Assess-assets.aspx
King County (KC). 2013b. Sustainability Indicators.
http://www.kingcounty.gov/environment/waterandland/groundwater/management-areas/vashon-
maury-island-gwma/Assess-assets.aspx
King County (KC). 2013c. King County Groundwater Well Data Website Database.
http://green.kingcounty.gov/groundwater/default.aspx
King County (KC). 2013d. KingStat Environmental Indicators. King County Department of Natural
Resources and Parks. Seattle, Washington.
http://your.kingcounty.gov/dnrp/measures/indicators/

Vashon-Maury Island Water Resources – A Retrospective of Contributions & Highlights
King County Science and Technical Support Section 98 December 2013
King County (KC). 2013e. Quartermaster Harbor Nitrogen Management Study. King County
Department of Natural Resources and Parks. Seattle, Washington.
http://www.kingcounty.gov/environment/watersheds/central-puget-sound/vashon-maury-
island/quartermaster-nitrogen-study.aspx
King County. (KC). 2013f. Quartermaster Harbor Marine Water Quality Report. Prepared by Kimberle
Stark (Water and Land Resources Division), Cheryl Greengrove, and Nick Schlafer (University of
Washington-Tacoma). Submitted by King County Department of Natural Resources and Parks,
Seattle, Washington. DRAFT. August
King County (KC). 2013h. Puget Sound Stream Benthos website.
http://pugetsoundstreambenthos.org
Lyman, John. M., S. A. Good, V. V. Gouretski, M. Ishii, G. C. Johnson, M. D. Palmer, D. M. Smith and J. K.
Willis (Lyman et al) 2010. Robust warming of the global upper ocean. Nature. Volume 465,
Pages 334–337. May 20.
http://www.nature.com/nature/journal/v465/n7296/full/nature09043.html
May, Christopher W. 2003. Stream-Riparian Ecosystems In the Puget Sound Lowland Eco-Region; A
Review of Best Available Science. Watershed Ecology LLC. 76 p.
http://www.kitsapgov.com/dcd/lu_env/cao/bas/fw/Riparian_BAS_Rpt_May.pdf
Mote, P. W. 2003. Trends in Temperature and Precipitation in the Pacific Northwest During the
Twentieth Century. Northwest Science V. ol.77. No. 4.
https://research.wsulibs.wsu.edu:8443/xmlui/bitstream/handle/2376/1032/v77%20p271%20Mote.P
DF?sequence=1
Naiman, R.J. and H. Decamps. (Naiman et al).1997. The ecology of interfaces: riparian zones. Annual
Review of Ecological Systems 28:621-658.
http://micssrv22.epfl.ch/images/6/64/RECORD_Naiman_1997.pdf
Pacific Groundwater Group (PGG). 2000. Maury Island Gravel Mine Hydrogeologic Impact Assessment.
Prepared for Washington State Department of Ecology. WA Ecology Publication 00-10-026.
May.
https://fortress.wa.gov/ecy/publications/publications/0010026.pdf
Pacific Marine Environmental Laboratory (PMEL). 2013. Upper Ocean Heat Content Anomaly.
http://oceans.pmel.noaa.gov/index.html
Panno, S.V., K.C. Hackley, H.H. Hwang, W.R. Kelley (Panno et al). 2001. Determination of the Sources
of Nitrate Contamination in Karst Springs using Isotopic and Chemical Indicators. Chemical
Geology 179 (2001) 113-128.
Vashon-Maury Island Water Resources – A Retrospective of Contributions & Highlights
King County Science and Technical Support Section 99 December 2013
Public Health-Seattle-King County (Public Health). 2007. King County On-Site Septic System
Management Plan. Prepared by Community Environmental Health Program. July.
http://www.kingcounty.gov/healthservices/MRA/~/media/health/publichealth/documents/mra/King
CountyOSSManagementPlanJuly2007.ashx
Public Health-Seattle-King County (Public Health). 2013. Vashon-Maury Island Marine Recovery Area.
http://www.kingcounty.gov/healthservices/MRA/~/media/health/publichealth/documents/mra/King
CountyOSSManagementPlanJuly2007.ashx
Puget Sound Restoration Fund (PSRF). 2013. Nutrient Mitigation Study.
http://www.restorationfund.org/projects/mitigation
Rosenthal, Y., B. K. Linsley, and D. W. Oppo (Rosenthal et al). 2013. Pacific Ocean Heat Content During
the Past 10,000 Years. Science. Vol. 342 no 6158 pp. 617-621. November.
http://www.sciencemag.org/content/342/6158/617
Sinclair, K.A., and Pitz, C.F.. 1999. Estimated base-flow characteristics of selected Washington rivers and
streams: Washington State Department of Ecology Water Supply Bulletin No. 60 (pub. No. 99-
327), 24 p.
https://fortress.wa.gov/ecy/publications/summarypages/99327.html
Stockton, L and E. Ferguson. 2009. Managing Water Resources for Sustainability on Vashon-Maury
Island, King County, Washington. Sea Grant Law and Policy Journal, Vol. 2, No. 1. June.
http://nsglc.olemiss.edu/SGLPJ/Vol2No1/Stockton.pdf
Tung, K. K. and J. Zhou. 2013. Using Data to Attribute Episodes of Warming and Cooling in
Instrumental Records. Proceedings of National Academy of Sciences. Edition 110.
http://depts.washington.edu/amath/research/articles/Tung/journals/Tung_and_Zhou_2013_PNAS
United Kingdom National Weather Service. (UK NWS). 2013. The recent pause in global warming (2):
What are the potential causes? Prepared by the MetOffice Hadley Centre. July.
http://www.metoffice.gov.uk/media/pdf/q/0/Paper2_recent_pause_in_global_warming.PDF
U. S. Census Bureau. 2013a. King County, Washington QuickLinks- Website.
http://quickfacts.census.gov/qfd/states/53/53033.html
U. S. Census Bureau. 2013b. Vashon CDP, Washington QuickLinks- Website.
http://quickfacts.census.gov/qfd/states/53/5374305.html
U.S. Environmental Protection Agency (USEPA). 2009. National Primary Drinking Water Regulations.
EPA 816-F-09-004 May.
http://water.epa.gov/drink/contaminants/upload/mcl-2.pdf
http://water.epa.gov/drink/contaminants/index.cfm

Vashon-Maury Island Water Resources – A Retrospective of Contributions & Highlights
King County Science and Technical Support Section 100 December 2013
U.S. Environmental Protection Agency (USEPA). 2013. Human Health.
http://water.epa.gov/drink/info/well/health.cfm
Vashon-Maury Island Beachcomber (VMI Beachcomber). 2011. ―Water District 19 to issue new shares,
ending its 15-year moratorium‖. December 21.
http://www.vashonbeachcomber.com/news/135957073.html
Vashon-Maury Island Beachcomber (VMI Beachcomber). 2013. ―Candidates Address Vashon‘s Water
Future‖. October 29.
http://www.vashonbeachcomber.com/news/228823061.html
Vashon-Maury Island Groundwater Management Committee (VMI GWMC). 1998a. Vashon-Maury Island
Ground Water Management Plan-Management Strategies. Prepared by King County of Natural
Resources and Parks and Seattle-King County Department of Public Health. Final, submitted
December 1998.
http://www.kingcounty.gov/environment/waterandland/groundwater/maps-reports/management-
plans.aspx
Vashon-Maury Island Groundwater Management Committee (VMI GWMC). 1998b. Vashon-Maury
Island Ground Water Management Plan-Supplement 1 – Area Characterization. Prepared by
King County of Natural Resources and Parks and Seattle-King County Department of Public
Health. Final, submitted December 1998.
http://www.kingcounty.gov/environment/waterandland/groundwater/maps-reports/management-
plans.aspx
Washington State (WA). Department of Ecology; Washington Administrative Code 173 (WAC 173)
http://apps.leg.wa.gov/WAC/default.aspx?cite=173
Washington State (WA). Department of Health; Washington Administrative Code 246 (WAC 246)
http://apps.leg.wa.gov/WAC/default.aspx?cite=246
Washington State (WA). Growth management - planning by selected counties and cities (Growth
Management Act (GMA)); Revised Code of Washington (RCW Section 36.70A).
http://apps.leg.wa.gov/rcw/default.aspx?cite=36.70A
Washington State (WA). Groundwater Management Areas and Programs; Washington Administrative
Code 173-100 (WAC 173-100)
http://apps.leg.wa.gov/WAC/default.aspx?cite=173-100
Washington State (WA). Guidelines to classify agriculture, forest, and mineral lands and critical areas;
Revised Code of Washington (RCW Section 36.70A.050).
http://apps.leg.wa.gov/rcw/default.aspx?cite=36.70A.050

Vashon-Maury Island Water Resources – A Retrospective of Contributions & Highlights
King County Science and Technical Support Section 101 December 2013
Washington State (WA). Instream resources protection program—Cedar-Sammamish basin, water
resource inventory area (WRIA) 8; Washington Administrative Code 173-508 (WAC 173-508).
http://apps.leg.wa.gov/wac/default.aspx?cite=173-508
Washington State (WA). Instream resources protection program—Green-Duwamish River basin, water
resource inventory area (WRIA) 9; Washington Administrative Code 173-509 (WAC 173-509).
http://apps.leg.wa.gov/wac/default.aspx?cite=173-509
Washington State (WA). Instream resources protection program—Kitsap water resource inventory
area (WRIA) 15; Washington Administrative Code 173-515 (WAC 173-515).
http://apps.leg.wa.gov/wac/default.aspx?cite=173-515
Washington State (WA). Instream resources protection program—Puyallup River basin, water resource
inventory area (WRIA) 10; Washington Administrative Code 173-510 (WAC 173-510).
http://apps.leg.wa.gov/wac/default.aspx?cite=173-510
Washington State (WA). Instream resources protection program—Snohomish River basin, water
resource inventory area (WRIA) 7; Washington Administrative Code 173-507 (WAC 173-507).
http://apps.leg.wa.gov/wac/default.aspx?cite=173-507
Washington State (WA). On-site Sewage Disposal Systems – Marine Recovery Areas; Revised Code of
Washington (RCW Section 70.118A).
http://apps.leg.wa.gov/rcw/default.aspx?cite=70.118A
Washington State (WA). Permit to Withdraw; Revised Code of Washington (RCW Section 90.44.050).
http://apps.leg.wa.gov/rcw/default.aspx?cite=90.44.050
http://www.ecy.wa.gov/programs/wr/comp_enforce/gwpe.html
Washington State (WA). Regulation of Public Groundwaters; Revised Code of Washington (RCW
Section 90.44).
http://apps.leg.wa.gov/rcw/default.aspx?cite=90.44
Washington State (WA). Water Code; Revised Code of Washington (RCW Section 90.03).
http://apps.leg.wa.gov/rcw/default.aspx?cite=90.03
Waterloo Hydrogeologic Inc. (WHI). 2004. Visual MODFLOW v.4.0 User‘s Manual/ Waterloo, Ontario.
Washington State Department of Ecology (WA Ecology). Water quality standards for surface waters of
the state of Washington; Washington Administrative Code 173-201A (WAC 173-201A).
http://apps.leg.wa.gov/wac/default.aspx?cite=173-201A
Washington State Department of Ecology (WA Ecology). 2002. Evaluating Standards for Protecting
Aquatic Life in Washington's Surface Water Quality Standards: Temperature Criteria. Discussion
Paper and Literature Summary. Prepared by Water Quality Program/Watershed Management
Section. Publication Number 00-10-070. December.
https://fortress.wa.gov/ecy/publications/publications/0010070.pdf
Vashon-Maury Island Water Resources – A Retrospective of Contributions & Highlights
King County Science and Technical Support Section 102 December 2013
Washington State Department of Ecology (WA Ecology). 2012. Preparing for the Impacts of Climate
Change: Washington State‘s Integrated Climate Response Strategy. Pub. No. 12-01-004. April.
https://fortress.wa.gov/ecy/publications/publications/1201004b.pdf
Washington State Department of Health. (WA DOH). 2013a. Sentry Internet Database.
https://fortress.wa.gov/doh/eh/portal/odw/si/Intro.aspx
Washington State Department of Health. (WA DOH). 2013b. Recreational Shellfish Program.
http://www.doh.wa.gov/AboutUs/ProgramsandServices/EnvironmentalPublicHealth/Shellfishand
WaterProtection/ShellfishProgram/RecreationalShellfish.aspx
Washington State Department of Natural Resources. (WA DNR). 2013. Maury Island Aquatic Reserve.
http://www.ecy.wa.gov/puget_sound/dissolved_oxygen_study.html
Water District 19 (District 19). 2008. 2007 Water System Plan.
http://water19.com/plan.html
Water District 19 (District 19). 2012. Water Use Efficiency Annual Performance Report – 2011. April
16.
https://fortress.wa.gov/doh/eh/portal/odw/si/SingleSystemViews/RptViewSingleSys.aspx?rptName
=wue&orgnum=38900&RptYear=2011
Western Regional Climate Center (WRCC). 2013. Air Temperature Summary Tables and Graphs for
NCDC COOP Station Number 458802 (Vashon Island).
http://www.wrcc.dri.edu/cgi-bin/cliMAIN.pl?wa8802
World Health Organization (WHO). 2013. Water-related diseases: Methaemoglobinemia.
http://www.who.int/water_sanitation_health/diseases/methaemoglob/en/

Vashon-Maury Island Water Resources – A Retrospective of Contributions & Highlights
King County Science and Technical Support Section A-1 December 2013
APPENDIX A - Sustainability
Indicators
Vashon Maury Island Groundwater Protection Committee document about Sustainability Definition,
Indicators and Measures
July 28, 2010
Vashon-Maury Island Water Resources – A Retrospective of Contributions & Highlights
King County Science and Technical Support Section A-2 December 2013
DEFINITION
Sustainable: Water use rate at which neither water quality nor available quantity is perceptibly diminished.
(Appendix A - p.10 Vashon-Maury Island Watershed Plan, June 6, 2005)
BACKGROUND
While surface water currently meets a portion of Vashon-Maury Island water demand, ground water is expected
to be the primary source of the Island‘s future water supply. Island streams, although tapped by a number of
Islanders, are too small to sustain much use. Springs and shallow wells are used by many Island water systems. All
of these – streams, springs, and aquifer – form an integral hydrologic system. We want to insure that our
groundwater resource can provide a safe, sustainable source of supply to meet forecasted population growth and
future water demand, while protecting the island‘s hydrologic system. (p. 4-7
Vashon-Maury Island Watershed Plan)
We recognize that:
Island water sources are not replenished by off-island snow melt or aquifers, but only by island rain water.
Surface and ground water resources are interrelated.
Both water quality and quantity need to be maintained to provide water for present and future use.
Preservation of our natural hydrology is directly related to preservation of our water supplies.
GOALS
The Watershed Plan discusses a range of issues related to the preservation of our water supply. In order to
preserve the quality and quantity of our water resources, we will strive to achieve the following goals.
An ―early warning system‖ of sustainability indicators needs to be developed to identify any decline in
water quality and quantity since once a decline is identified; it is very difficult to reverse.
Maintain water quality at current levels.
Maintain water quantity without decline.
Use our water supply more efficiently.
Protect and enhance groundwater recharge.
Ensure water resource needs of all future inhabitants are not compromised.
Use both preventive and adaptive strategies to maintain and enhance the integrity of the hydrologic
system.
Use the best available science in the decision-making process.
INDICATORS
Indicators are used to measure the status of water resources. These provide ways we can measure how well we
are adhering to the goals described above, and are used to report progress. The Vashon-Maury Island Ground
Water Protection Committee (GWPC) plans to use the sustainability indicators to measure progress in meeting
their goals to preserve the quality and quantity of water resources as guided by the Vashon-Maury Island
Watershed Plan. The GWPC will assess the indicators and monitor changing water resource conditions to identify
trends. The GWPC will identify specific strategies in response to observed trends to achieve the sustainability
goals.

Vashon-Maury Island Water Resources – A Retrospective of Contributions & Highlights
King County Science and Technical Support Section A-3 December 2013
Indicator Method Data Analysis Target
Sustainable Water Quality
Groundwater
quality 1
Measure groundwater quality
in Group A wells, Group B
wells and the 19 long term
monitoring wells. This
indicator is implemented by
annually obtaining reported test results for applicable
water quality parameters
from public health (DOH and
PHSHC) and the KC WLRD
monitoring.
Water quality results are
compared to adopted drinking water standards
Groundwater quality meets or
exceeds drinking water quality
standards (test results are below
the maximum contaminant level
(MCL)) and there is no increase greater than 10% over baseline for
any parameter over two years for
nitrate or since prior test results
for all other standards.
Stream water
quality 2
This indicator is implemented
by monthly measuring
bacteria, nutrients, and
conventional parameters in
five streams.
Stream water quality
results are compared to
Washington State water
quality standards
Stream water quality meets or
exceeds surface water quality
standards for the protection of
aquatic life and there is no increase
greater than 10% over baseline for
any parameter over two years.
Quartermaster
Harbor water
quality
3
This indicator is implemented
by conducting continuous and
monthly oxygen monitoring
and monthly bacteria
monitoring in Quartermaster
Harbor
Quartermaster Harbor
water quality results are
compared to
Washington State water
quality standards for
marine waters
Quartermaster Harbor water
quality meets or exceeds surface
water quality standards for the
protection of aquatic and shellfish
harvesting and there is no increase
in bacteria or decrease in oxygen
greater than 10% over baseline for
any parameter over two years.
Sustainable Water Quantity
Seasonal
groundwater
levels
4
This indicator is measured by
continuous monitoring in 10
KC WLRD monitoring wells
and 2 private wells near the
Glacier gravel mine, along
with monthly monitoring in
volunteer wells
Annual and seasonal
groundwater levels are
graphed and trends over
time are analyzed
Groundwater levels are maintained
or improved
Summer instream
flows 5
This indicator is measured by
using continuous flow data
from 4 stream gages
maintained by King County
(Shinglemill, Judd, Tahlequah,
and Fisher) and 1 stream gage maintained by Water District
19 (Beal)
The annual minimum 7-
day average low flows
are calculated and
tracked from year-to-
year
Summer low flows are maintained
or increased over time
Stream flashiness 6
This indicator is measured by
using gage data for the same 6
streams
The percent of time per
year that each stream‘s
flow exceeds its average
flow for that year will be
calculated and tracked
from year-to-year.
Decreases in percent of
time exceeding the annual average are
generally associated with
increased development
and impervious area.
The percent of time that flow
exceeds the average flow is
maintained or increased over time.

Vashon-Maury Island Water Resources – A Retrospective of Contributions & Highlights
King County Science and Technical Support Section A-4 December 2013
Indicator Method Data Analysis Target
Healthy Ecosystem
Stream benthic
macroinvertebrate
populations
7
This indicator is measured by
conducting annual stream
benthic macroinvertebrate
monitoring at three locations
by KC WLRD and eight
locations by KC Roads
The Benthic Index of
Biologic Integrity (BIBI)
will be calculated for
each site and tracked
from year-to-year.
The BIBI scores are maintained or
improved.
Salmon
populations 8
This indicator is measured by
using data from the Salmon
Watcher Program that
estimate the number of
salmon returning to spawn on
Vashon-Maury Island
The number of salmon
returning to spawn will
be estimated each year
and compared from
year-to-year.
The number of salmon returning to
spawn in Vashon-Maury Island
streams is maintained or increased.
Sustainable Water Resources Use and Management
Annual total
island-wide water
consumption
9
This indicator is measured by
obtaining annual withdrawal
data from Group A water
systems via DOH and
withdrawal data from
individual volunteer well
owners as part of the Water
Resources Evaluation. No
Group B system data are
currently available. Eight
exempt well owners
voluntarily provide usage data
as part of an assessment of permit-exempt wells.
Annual total
consumption calculated
by estimating Group B
and exempt well
withdrawals and adding
them to the Group A
withdrawals. Total
annual consumption is
tracked from year-to-
year.
Per capita water
consumption 10
This indicator is measured by
using the same consumption
data as above, along with
population data from the
assessor office.
Per capita consumption
is calculated by dividing
total annual consumption
by total population and is
tracked from year-to-
year.
Per capita consumption does not
increase.
Summer water
use peaking factor 11
This indicator is measured
using monthly withdrawal
data, obtained from Larger
Group A PWS and comparing
to their Water System Plan
peaking factor.
Monthly summer water
withdrawals are divided
by monthly winter water
withdrawals to calculate
the summer peaking
factor. Peaking factor is
tracked from year-to-
year.
Summer water use peaking factors
do not increase.
Vashon-Maury
Island watershed
plan
implementation
12
This indicator is measured by
tracking the number of
GWPC priority implementation items that are
accomplished each year.
The cumulative number
of items accomplished is
divided by the number of
priority items in the plan to calculate the percent
of priority items
completed.
The percent of priority items
completed increases year-to-year.

Vashon-Maury Island Water Resources – A Retrospective of Contributions & Highlights
King County Science and Technical Support Section A-5 December 2013
Other Possible Indicators to be Implemented Should Funding and/or Data Become
Available
1. Land cover is maintained in a manner that allows for maintenance of a natural hydrologic cycle. This
indicator is measured by comparing the percent of land cover classified as ―impervious‖ and the
percent classified as ―forest‖ every two years by subbasin on Vashon-Maury Island. Impervious land
cover targets for each subbasin are less than 10% and forested land cover targets for each subbasin
are greater than 65%. (Note: Fine scale land cover data is available for 1995 and 2002 to provide a
base line if measurement can be funded in the future)
2. Public attitudes and involvement demonstrate strong support for water resource stewardship. This
indicator is measured by conducting a survey of public attitudes about water resources every 2
years, and tracking changes in attitudes over time.
3. Groundwater recharge and quality, and stream flows and water quality are protected and enhanced
through aggressive implementation of Low Impact Development techniques. This indicator is
measured by calculating the acres of land developed per year using Low Impact Development
techniques, and tracking trends over time.
4. Groundwater and stream water quality are protected and enhanced through improved design,
operation, and maintenance of on-site septic systems. This indicator is measured by determining the
number of on-site septic systems that have been inspected each year and the number upgraded to
meet code each year based on information from SKCPH, and tracking trends over time.
5. Groundwater and stream water quality are protected and enhanced by reducing the amount of
pesticides applied to Vashon landscapes. This indicator is measured by obtaining the annual amount
of different pesticides sold by island retailers and tracking trends over time.
6. Basins are opened or closed to water allocations based on better understanding of surface water /
groundwater interaction and sustainability. This indicator is measured by identifying the number of
basin reviews DOE completes where surface water/groundwater interaction and sustainability are
substantially considered.
STRATEGIES FOR SUSTAINABILITY
The following strategies could be undertaken by the GWPC in the future to further implementation of
the sustainability goals:
Continue efforts to implement the recommendations contained in the VMI Watershed Plan.
Near term identify policy recommendations to improve water resource management including
nitrogen reduction for consideration in the 2012 amendment to the King County
Comprehensive Plan.
Revise the scope of the ongoing monitoring by KC WLRD to compile, evaluate, review and the
report the findings on indicators 1-10 to the GWPC and other interested parties including the
general public, on an annual basis. Develop strategies to fill data gaps for sustainability indicators
1-11.
Identify and evaluate hydrologic management and sustainability techniques being developed in
other island communities for application on VMI.
Evaluate the potential benefits or liabilities and feasibility of modifying the WRIA designation for
VMI

Vashon-Maury Island Water Resources – A Retrospective of Contributions & Highlights
King County Science and Technical Support Section A-6 December 2013
Summaries of the eleven indicators are presented in the following four main groups:
Water Quality Indicators:
Groundwater
Stream water
Quartermaster Harbor (marine) water
The water quality of the island is assessed by three components – groundwater, surface water and
marine (Quartermaster Harbor). The groundwater quality is very good. There are no reported
violations of United States Environmental Protection Agency drinking water standards and Maximum
MCLs for over 95 parameters during the last three (2008-2010) years. However, arsenic is one standard
that can have high levels at the source then be blended with other sources to produce concentrations
below the drinking water standard at the point of use. Surface water quality can and does vary by year
with the most recent data being of low to moderate concern. Water quality data from Quartermaster
Harbor shows low levels of fecal coliform bacteria but also has periods of low dissolved oxygen
especially in the inner harbor area.
Water Quantity Indicators:
Groundwater levels
Surface water summer low flows
Stream ―flashiness‖
The water quantity of the island is assessed by groundwater levels and stream flow indicators. Of the
more than 1,000 wells on VMI, only 60 have multiple years of water level data from 2001 to 2010.
Fifteen locations had sufficient data for a baseline assessment with one site showing a decline greater
than one standard deviation and one site having an increase in water table elevations greater than one
standard deviation. The other 13 sites have variations within one standard deviation indicating little to
no change over this time period. Judd and Shinglemill Creek have 10 years of flow data while Fisher and
Tahlequah creeks have been monitored since 2005. The stream flow data reflect changes in total
amount of precipitation over the ten years of 2001-2010. The stream flow flashiness assessment as
measured by the Richards-Baker index method appears to be maintaining uniform values; however,
additional data is required to determine if any changes are more than indicators of variation in the total
amount of precipitation. Ten years or more of continuing data is needed to assess longer term trends
for these hydrologic indicators.
Ecosystem Health Indicators
Stream benthic macro invertebrate
Salmon populations
The indicators of ecosystem health for the island are unexpectedly poor. The data from stream benthic
macroinvertebrate populations score in the ―fair‖ to ―very poor‖ categories which are lower than many
other rural streams in King County. The island –wide average of all sites has been declining (worse)
since 2005 when sampling began. The number of salmon reported per survey year has decreased since
2001 for several creeks. However, the number of volunteers reporting the data and the number of sites

Vashon-Maury Island Water Resources – A Retrospective of Contributions & Highlights
King County Science and Technical Support Section A-7 December 2013
surveyed has also decreased over the same period. At this point, there is insufficient data to conclude
whether salmon populations are maintaining.
Water Use Indicators
Annual total usage
Per capita usage
Summer peaking factor
The total water use for the island was estimated based on data from selected public water systems and
individual volunteer. The total island-wide water consumption was estimated for by water user type
including – Group A public water systems, Group B public water systems, self supply and agricultural
water users. Total water use was estimated to be 495 Million gallons per year for 2010. Average per
capita water usage was estimated to be 83 gallons per person, per day and water use peaks in the
summer ranges from a factor 1.1 to 4.4 based on data from selected Group A public water systems.
The data were assessed over a ten year period from 2001-2010, when possible. However, most
indicators, such as #2, 3, 5, 6, and 7, have shorter periods of record starting in 2005 or 2006 due to lack
of data. Other indicators, such as #1, 4, 9, 10 & 11, will require additional data collection from public
water systems around the island. This initial effort in assessing the Sustainability Indicators highlighted
the need to fill in data gaps and re-assess indicators periodically when sufficient new data is available,
typically every three years. This allows for additional data gathering and longer periods for analysis.

Vashon-Maury Island Water Resources – A Retrospective of Contributions & Highlights
King County Science and Technical Support Section A-8 December 2013
King County and the Groundwater Protection Committee placed an
insert in the Beachcomber Assessing Our Liquid Assets to help Vashon
Island residents learn about their water resources. Published
November 2012.
A copy of the report card to the Community and the indicators were
published via the King County Groundwater Management Area web
pages and can be found at:
http://www.kingcounty.gov/environment/waterandland/groundwater/ma
nagement-areas/vashon-maury-island-gwma/Assess-assets.aspx
The following indicators are a collaboration of the VMI-GWPC and
King County and are from a version of the Sustainability Indicators,
dated December 2012.

Vashon-Maury Island Water Resources – A Retrospective of Contributions & Highlights
King County Science and Technical Support Section A-9 December 2013

Vashon-Maury Island Water Resources – A Retrospective of Contributions & Highlights
King County Science and Technical Support Section A-10 December 2013
1A. Groundwater Quality — Nitrate
Target: Drinking Water below the Maximum Contaminant Level (MCL) About this indicator: Nitrate is one of three parameters selected as an indicator of groundwater quality because it can
track changes caused by human activities. High nitrate levels can cause methemoglobinemia (blue baby syndrome)
especially in infants under six months. The MCL for nitrate is 10 milligrams per liter (mg/L).
Influencing factors: Leaching from septic systems, runoff from fertilizer or manure and nitrogen fixing vegetation such
as alder trees can influence the measured concentration of nitrate in groundwater.
2010 Target: Groundwater quality meets drinking water quality standards (test results are below the MCL).
2010 Finding:
No sites above MCL
2010 Status: No nitrate results
were reported above the drinking
water standard (MCL of 10 mg/L). Four sites have
nitrate values between 5 to 10 mg/L (half of the
MCL up to the MCL). The remaining 186 locations
had result values below 5 mg/L.
Maximum result values for nitrate data collected at
190 locations (155 public water sources and 35
long-term monitoring sites) from 1990 to 2010 is
presented in Figure 1.
Other Drinking Water Standards: The United
States Environmental Protection Agency sets
drinking water standards and MCL‘s for over 95
parameters including microorganisms, disinfectants
& their byproducts, inorganic chemicals, organic
chemicals and radionuclide‘s.
Review of the public drinking water source data for
Group A water systems available from the
Washington Department of Health Drinking Water
Program from 2008 to 2010 found no value above
the MCL for the other 92 regulated parameters.
Figure 1. Maximum nitrate results from 1990 to 2010 for 190
locations. No sample results are above the MCL of 10 mg/L. Four
sites have results between 5 – 10 mg/L while the remaining 186
sites have result values below 5 mg/L.
Trend Target: For locations with more than 10 years of water quality samples, new data will be compared to the
baseline period to evaluate changes through time. Water quality changes that would trigger further evaluation were
defined in the Vashon-Maury Island Ground Water Management Plan management strategies as follows:

Vashon-Maury Island Water Resources – A Retrospective of Contributions & Highlights
King County Science and Technical Support Section A-11 December 2013
Any increase in the sampled contaminates level greater than 10% over the baseline for two or
more years;
Any trend that increases from zero to one quarter of the MCL or reaches one half the MCL limit.
Trend Finding:
21 sites; 4 increasing, 4 decreasing, 13 unchanged from 1990 to 2010
Trend Status Four of 21 sites had an increase when comparing averaged 2009-2010 data to their baseline (1990-
2008), Figure 2. Four other sites had a decrease when comparing averaged 2009-2010 data to their baseline while the
remaining 13 sites had no change between recent and baseline values.
Technical Notes: Nitrates in
Groundwater
Data source: The data for this indicator comes
from multiple sources including VMI water
purveyors, King County WLRD Groundwater
Protection Program, Public Health - Seattle &
King County Drinking Water Program, and
Washington State Department of Health Office of
Drinking Water.
Collection frequency: King County has been
monitoring nitrate concentrations annually on
Vashon-Maury Island since 2001 and monitored
21 and 22 locations during 2009 and 2010,
respectively. Department of Health – local and
state require annual nitrate testing of public water
system sources. Department of Health reported
data from 31 and 43 public water sources in 2009
and 2010, respectively.
Methods for analysis: Each result is compared
to the drinking water standard. Baseline
assessment was completed for 21 public water
sources that had at least 10 years from 1990 to
2008. Thirteen of these had no change, four
sources had decreases and four had increases
when comparing an averaged 2009 and 2010 data
to their baseline.
Figure 2. Baseline assessment locations. Twenty-one locations had
sufficient data to assess the recent data (2009 & 2010) to a baseline
(>10 year) average evaluating for change. Four sites had increases
in recent data compared to baseline, four additional sites had lower
values recently and the remaining 13 sites had no change
comparing recent to baseline data.

Vashon-Maury Island Water Resources – A Retrospective of Contributions & Highlights
King County Science and Technical Support Section A-12 December 2013
Data Reliability and Quality: The data quality of this indicator is high based on the SAP/SOP of sample collection.
The reliability is fair to good. Data reliability from the sources can and does vary. King County has monitored 35
locations for nitrate which is represents about 4% of the over 1000 wells on VMI. Department of Health reported
arsenic data from 155 public water sources which is 78% of the island‘s 200 public water sources.
Data Gaps: Collection of historic monitoring data directly from the public water purveyors might expand the data set
sufficiently to permit extended trend analysis for many of the 71 public water sources.
Data Reference:
King County - Water Resources Evaluation Project – Data Report 2005-2009.
http://www.kingcounty.gov/environment/waterandland/groundwater/management-areas/vashon-maury-island-
gwma/vashon-island.aspx
Washington State Department of Health – Sentry - database of public water systems (1990-2010).
https://fortress.wa.gov/doh/eh/portal/odw/si/Intro.aspx
Washington Administrative Code (WAC) — 173-200 Water quality standards for groundwater
Arsenic (1B) and Chloride (1C) were selected for the other groundwater quality indicator parameters.

Vashon-Maury Island Water Resources – A Retrospective of Contributions & Highlights
King County Science and Technical Support Section A-13 December 2013
1B. Groundwater Quality — Arsenic
Target: Drinking Water below the Maximum Contaminant Level
(MCL)
About this indicator: Arsenic is one of three parameters selected as an indicator of groundwater quality due to its
potential carcinogenic effects. The MCL for arsenic is 10 micrograms per liter (µg/L).
Influencing factors: Arsenic enters water supplies either from natural deposits in the earth or from industrial and/or
agricultural pollution.
Target: Groundwater quality meets MCL drinking
water quality standards (test results are below the
MCL).
2010 Finding:
11 sites above MCL
Status: Eleven of the 95 sites sampled had arsenic
levels above the drinking water standard (MCL of 10
µg/L). Twenty three sites had sample values between
5 to 10 µg/L. The remaining 61 locations had result
values below 5 µg/L.
Maximum values for arsenic data collected for 95 (71
public water sources and 24 long-term monitoring
sites) locations between 1990 and 2010 are
represented in Figure 1. Maximum sample values for
each site are shown in Figure 2.
Other Drinking Water Standards: The United
States Environmental Protection Agency sets drinking
water standards and MCL‘s for over 95 parameters
including microorganisms, disinfectants & their
byproducts, inorganic chemicals, organic chemicals
and radionuclide‘s.
Review of the public drinking water source data for
Group A water systems available from the
Washington Department of Health Drinking Water
Program from 2008 to 2010 found no value above
the MCL for the other 92 regulated parameters.
Figure 1. Maximum arsenic results from 1990 to 2010 for 95
locations. Eleven sample results are above the MCL of 10 µg/L.
Twenty-three sites have results between 5 – 10 µg/L while the
remaining 61 sites have result values below 5 µg/L.
Trend Target: For locations with more than 10 years of water quality samples, new data will be compared to the
baseline period to evaluate changes through time. Water quality changes that would trigger further evaluation were
defined in the Vashon-Maury Island Ground Water Management Plan management strategies as follows:

Vashon-Maury Island Water Resources – A Retrospective of Contributions & Highlights
King County Science and Technical Support Section A-14 December 2013
Any increase in the sampled contaminates level greater than 10% over the baseline for two or
more years;
Any trend that increases from zero to one quarter of the MCL or reaches one half the MCL limit.
Trend Finding: Reported arsenic data has too short a period of record
to complete an analysis;
Trend Status: Baseline assessment was not done due to insufficient data. No site has more than
10 years of arsenic data. Sixteen sites have 10 years and two additional sites have eight years of data.
Recent Status: No apparent recent change in concentration in sites monitored on a regular basis,
Figure 3.
Technical Notes: Arsenic in Groundwater
Data source: The data for this indicator comes from multiple sources including VMI water purveyors, King County
WLRD Groundwater Protection Program, Public Health - Seattle & King County Drinking Water Program, and
Washington State Department of Health Office of Drinking Water.
Collection frequency: King County has been monitoring arsenic concentrations annually on Vashon-Maury Island since
2001. Department of Health – local and state require arsenic testing of public water system sources.
Methods for analysis: Each result is compared to the drinking water standard. Baseline assessment was not done due
to insufficient data. No site has more than 10 years of arsenic data. Sixteen sites have 10 years and two additional sites
have eight years of data.
Data Quality and Reliability: The quality of data for this indicator is high and reliability is considered to be good
though data reliability from the sources can and does vary. King County has monitored 30 locations for arsenic which is
represents about 3% of the over 1000 wells on VMI. Department of Health reported arsenic data from 71 public water
sources which are 35% of the island‘s 200 public water sources.
Data Gaps: Collection of historic monitoring data directly from the public water purveyors might expand the data set
sufficiently to permit trend analysis for many of the 71 public water sources.
Data Reference:
King County - Water Resources Evaluation Project – Data Report 2005-2009.
http://www.kingcounty.gov/environment/waterandland/groundwater/management-areas/vashon-maury-island-
gwma/vashon-island.aspx
Washington State Department of Health – Sentry - database of public water systems (1990-2010).
https://fortress.wa.gov/doh/eh/portal/odw/si/Intro.aspx
Washington Administrative Code (WAC) — 173-200 Water quality standards for groundwater
Nitrate (1A) and Chloride (1C) were selected for the other groundwater quality indicator parameters.
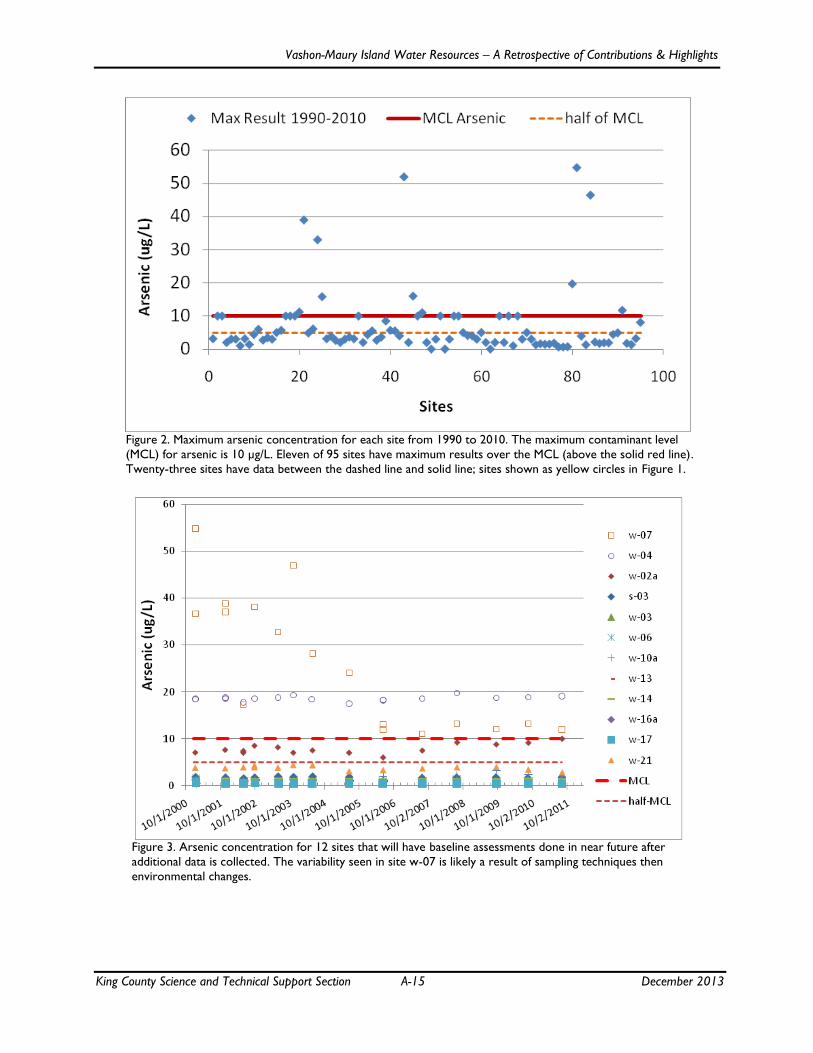
Vashon-Maury Island Water Resources – A Retrospective of Contributions & Highlights
King County Science and Technical Support Section A-15 December 2013
Figure 2. Maximum arsenic concentration for each site from 1990 to 2010. The maximum contaminant level
(MCL) for arsenic is 10 µg/L. Eleven of 95 sites have maximum results over the MCL (above the solid red line).
Twenty-three sites have data between the dashed line and solid line; sites shown as yellow circles in Figure 1.
Figure 3. Arsenic concentration for 12 sites that will have baseline assessments done in near future after
additional data is collected. The variability seen in site w-07 is likely a result of sampling techniques then
environmental changes.
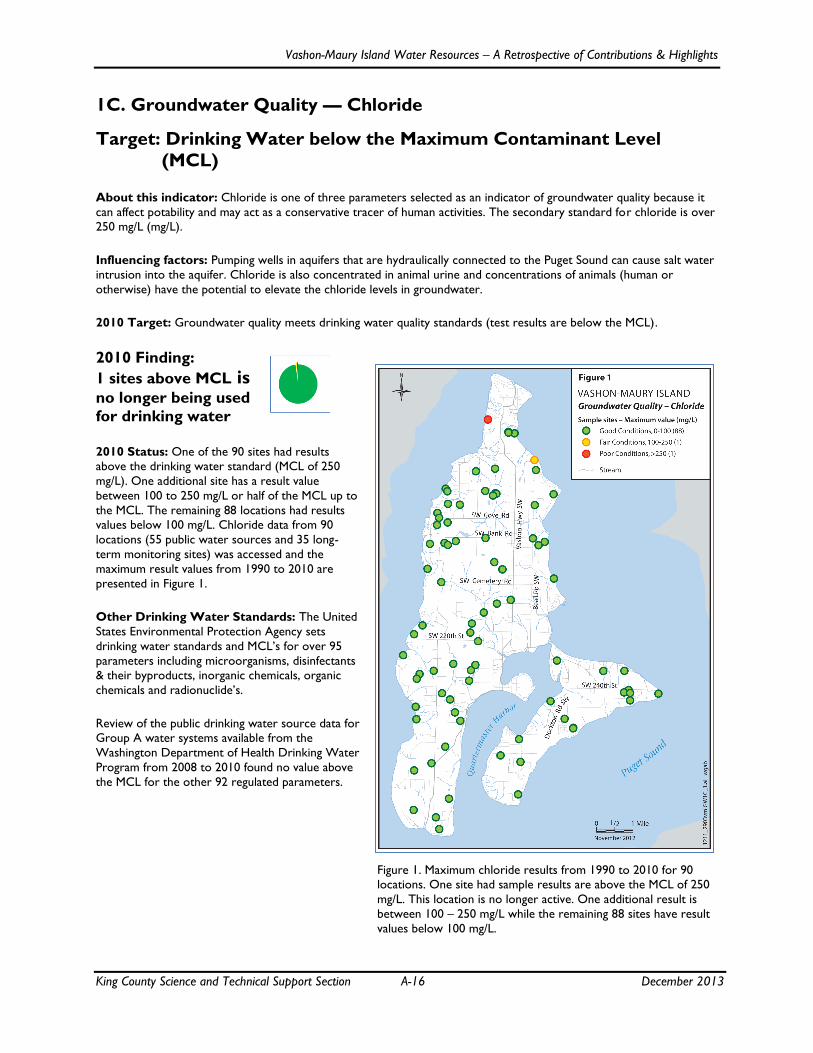
Vashon-Maury Island Water Resources – A Retrospective of Contributions & Highlights
King County Science and Technical Support Section A-16 December 2013
1C. Groundwater Quality — Chloride
Target: Drinking Water below the Maximum Contaminant Level
(MCL)
About this indicator: Chloride is one of three parameters selected as an indicator of groundwater quality because it
can affect potability and may act as a conservative tracer of human activities. The secondary standard for chloride is over
250 mg/L (mg/L).
Influencing factors: Pumping wells in aquifers that are hydraulically connected to the Puget Sound can cause salt water
intrusion into the aquifer. Chloride is also concentrated in animal urine and concentrations of animals (human or
otherwise) have the potential to elevate the chloride levels in groundwater.
2010 Target: Groundwater quality meets drinking water quality standards (test results are below the MCL).
2010 Finding:
1 sites above MCL is
no longer being used
for drinking water
2010 Status: One of the 90 sites had results
above the drinking water standard (MCL of 250
mg/L). One additional site has a result value
between 100 to 250 mg/L or half of the MCL up to
the MCL. The remaining 88 locations had results
values below 100 mg/L. Chloride data from 90
locations (55 public water sources and 35 long-
term monitoring sites) was accessed and the
maximum result values from 1990 to 2010 are
presented in Figure 1.
Other Drinking Water Standards: The United
States Environmental Protection Agency sets
drinking water standards and MCL‘s for over 95
parameters including microorganisms, disinfectants
& their byproducts, inorganic chemicals, organic
chemicals and radionuclide‘s.
Review of the public drinking water source data for
Group A water systems available from the
Washington Department of Health Drinking Water
Program from 2008 to 2010 found no value above
the MCL for the other 92 regulated parameters.
Figure 1. Maximum chloride results from 1990 to 2010 for 90
locations. One site had sample results are above the MCL of 250
mg/L. This location is no longer active. One additional result is
between 100 – 250 mg/L while the remaining 88 sites have result
values below 100 mg/L.
Vashon-Maury Island Water Resources – A Retrospective of Contributions & Highlights
King County Science and Technical Support Section A-17 December 2013
Trend Target: For locations with more than 10 years of water quality samples, new data will be compared to the
baseline period to evaluate changes through time. Water quality changes that would trigger further evaluation were
defined in the Vashon-Maury Island Ground Water Management Plan management strategies as:
Any increase in the sampled contaminates level greater than 10% over the baseline for two or
more years;
Any trend that increases from zero to one quarter of the MCL or reaches one half the MCL limit.
Trend Finding:
Reported data has too short a period of record to complete an
analysis.
Trend Status: Baseline assessment was not done due to insufficient data. No site has more than
10 years of chloride data. Fifteen sites have 10 years and two additional sites have eight years of data.
Recent Status: No apparent recent change in concentration in sites monitored on a regular basis, Figure 3.
Technical Notes: Chloride in Groundwater
Data source: The data for this indicator comes from multiple sources including VMI water purveyors, King County
WLRD Groundwater Protection Program, Public Health - Seattle & King County Drinking Water Program, and
Washington State Department of Health Office of Drinking Water.
Collection frequency: King County has been monitoring chloride concentrations annually on Vashon-Maury Island
since 2001 and has monitoring data from 35 locations. Department of Health – local and state require chloride testing of
public water system sources. Department of Health reported chloride data from 55 public water sources.
Methods for analysis: Each result is compared to the drinking water standard. Baseline assessment was not done due
to insufficient data. No site has more than 10 years of chloride data. Fifteen sites have 10 years of data and Figure 3
shows the results for some of these sites.
Data Reliability and Quality: The data quality of this indicator is high based on SAP/SOP of sample collection. The
reliability is fair to good. Data reliability from the sources can and does vary. King County has monitored 35 locations for
chloride which is represents about 4% of the over 1000 wells on VMI. Department of Health reported chloride data
from 55 public water sources which are 28% of the island‘s 200 public water sources.
Data Gaps: Collection of historic monitoring data directly from the public water purveyors might expand the data set
sufficiently to permit extended trend analysis for many of the 71 public water sources.
Data Reference:
King County - Water Resources Evaluation Project – Data Report 2005-2009.
http://www.kingcounty.gov/environment/waterandland/groundwater/management-areas/vashon-maury-island-
gwma/vashon-island.aspx
Washington State Department of Health – Sentry - database of public water systems (1990-2010).
https://fortress.wa.gov/doh/eh/portal/odw/si/Intro.aspx
Washington Administrative Code (WAC) — 173-200 Water quality standards for groundwater
Nitrate (1A) and Arsenic (1B) were selected for the other groundwater quality indicator parameters.

Vashon-Maury Island Water Resources – A Retrospective of Contributions & Highlights
King County Science and Technical Support Section A-18 December 2013
Figure 2. Maximum chloride concentration for each site from 1990 to 2010. The maximum
contaminant level (MCL) for chloride is 250 mg/L. The one site with exceedance is a public water
system source that is no longer being used for drinking water purposes.
Figure 3. Chloride concentration for 12 sites that will have baseline assessments done in near
future after additional data is collected.
2. Stream Water Quality Index
0
50
100
150
200
250
Ch
lori
de
(mg
/L)
s-03
w-02a
w-03
w-04
w-06
w-07
w-10a
w-13
w-14
w-16a
w-17
w-21
MCL
half-MCL

Vashon-Maury Island Water Resources – A Retrospective of Contributions & Highlights
King County Science and Technical Support Section A-19 December 2013
Target: Good Stream Water Quality
About this indicator: Water Quality Index (WQI) integrates key factors into a single number
that can be compared over time and across locations. This index compares monthly data of
temperature, pH, fecal coliform bacteria, dissolved oxygen, turbidity, total suspended solids, and nutrients (phosphorus
and nitrogen) relative to state standards and guidelines.
Influencing factors: Overall stream water quality in
King County is impacted by increased development in
our region — primarily stormwater runoff. The
reduced scores may have resulted from intense rainfall
events.
2010 Target: Stream water quality index for the
majority of the sites are ―low concern‖ reflecting good
water quality within those basins annually.
2010 Finding:
2 sites with Good water quality;
3 sites with
Moderate water
quality
2010 Status: The Water Year
20101 WQI scores indicated that 2 of the 5 sampling
sites were of low concern (good water quality) while
the remaining 3 sites had moderate concern
(moderate water quality). No sites were rated of high
concern with low water quality, Figure 1 and Table 1.
Rating for scores are explained in the technical notes
section.
Related indicator: Indicator #7 is another indication
of stream health by assessing the Benthic Index of
Biological Integrity (BIBI) of the islands creeks
Figure 1. Stream water quality locations shown with WY
2010 WQI scores. Five sites were sampled. In 2010, two
sites had scored ―Good‖ water quality; three sites had
scored ―Moderate‖ water quality and zero sites had ―Poor‖
water quality. Two inactive sites (Tahlequah and Christensen
Creeks) are shown for reference.
2001-2010 Target: Maintaining or improved good water quality for stream sites through time.
1 Water Year (WY) is a 12 month period starting October 1 and ending September 30 in the following year. Example
given: WY2010 is from October 1, 2009 until September 30, 2010. Most hydrologic data are reported by the water
year.

Vashon-Maury Island Water Resources – A Retrospective of Contributions & Highlights
King County Science and Technical Support Section A-20 December 2013
2001-2010 Assessment: 5 sites; All scores improved in 2010.
2001-2010 Status: Five of 5 sites had WQI scores in the good to moderate water quality range in 2010 which
improved from the previous year, Figure 2 & Table 1. The data has been collected since November 2006. Gorsuch
Creek only had 6 samples collected in water year 2010.
Figure 2. Water Quality Index (WQI) scores for Vashon-Maury Island creeks by water year (October to
September). Scores 80 or higher are for sites of low concern – good water quality (green color); Scores 40
or less are for sites of high concern – poor water quality (red color) and scores between 40 and 80 are for
sites with Moderate concern with a mix of good and poor water quality (yellow color). Christensen and
Tahlequah creeks were only sampled in water year 2007. NOTE: colors above are for VMI indicators and are
not ‗typical‘ for reporting WQI scores
Technical Notes: Water Quality Index for Vashon-Maury Island Creeks
Data source: The data for this indicator comes from the King County DNRP/WLRD Science, Monitoring and Data
Management Section.
Collection frequency: King County has been monitoring stream water quality monthly at five locations on Vashon-
Maury Island since November 2006. Recent budget changes to the program required a removal of one site (Gorsuch
Creek) from the monitoring program in April 2010.
Methods for analysis: This water quality index will generate a number ranging from 1 to 100. Higher numbers reflect
better water quality. The index uses data for temperature, pH, fecal coliform bacteria, dissolved oxygen, turbidity, total
suspended solids, and nutrients (phosphorus and nitrogen) relative to state standards required to maintain beneficial
uses. The multiple water quality parameters are combined and results aggregated over the water year to produce a
single score for each sample station. In general, stations scoring 80 and above meet expectations and are of "low
0
10
20
30
40
50
60
70
80
90
100
2007 2008 2009 2010
Wa
ter
Qu
ali
ty In
de
x
Shinglemill Fisher Judd Mileta Gorsuch Christensen Tahlequah

Vashon-Maury Island Water Resources – A Retrospective of Contributions & Highlights
King County Science and Technical Support Section A-21 December 2013
concern‖ with good water quality, scores 40 to 80 indicate "moderate concern and water quality", and stations with
scores below 40 do not meet expectations and are of "high concern‖ with poor water quality. Analysis was done using
Washington Department of Ecology - Water Quality Index for Washington State Streams (version 5).
Data Reliability and Quality: The data quality of this indicator is high based on the KC SAP/SOP of sampling
collection. The reliability is good based on the consistent and regular collection of the data.
Data Reference: King County - Water Resources Evaluation Project – Data Report 2007-2010.
Washington Department of Ecology - Water Quality Index for Washington State Streams (version 5);
http://www.ecy.wa.gov/programs/eap/fw_riv/docs/WQIOverview.html .
Table 1. Water Quality Index (WQI) for stream on Vashon-Maury Island. Data are presented as Water Year
since data collected started in November 2006. WQI scores are explained in the Technical Notes section.
Scores 80 or higher are for sites of low concern – good water quality; Scores 40 or less are for sites of high
concern – poor water quality and scores between 40 and 80 are for sites with Moderate concern with a mix
of good and poor water quality. NOTE: colors below are for VMI indicators and are not ‗typical‘ for
reporting WQI scores.
―*‖ = Gorsuch Creek only has 6 samples (Oct-Mar) in WY10.
―— ‖ = Not sampled during that water year.
Creek Name Locator WY07 WY08 WY09 WY10
Shinglemill VA12A 71 78 61 83
Fisher VA41A 31 68 24 50
Judd VA42A 58 67 26 61
Mileta VA45A 72 61 47 68
Gorsuch VA65A 74 75 44 83*
Christensen VA23 71 — — —
Tahlequah VA37A 55 — — —
Total Low Concern – Good WQ 0 0 0 1
Total Moderate Concern & WQ 6 5 3 3
Total High Concern – Poor WQ 1 0 2 0
Total Streams 7 5 5 4
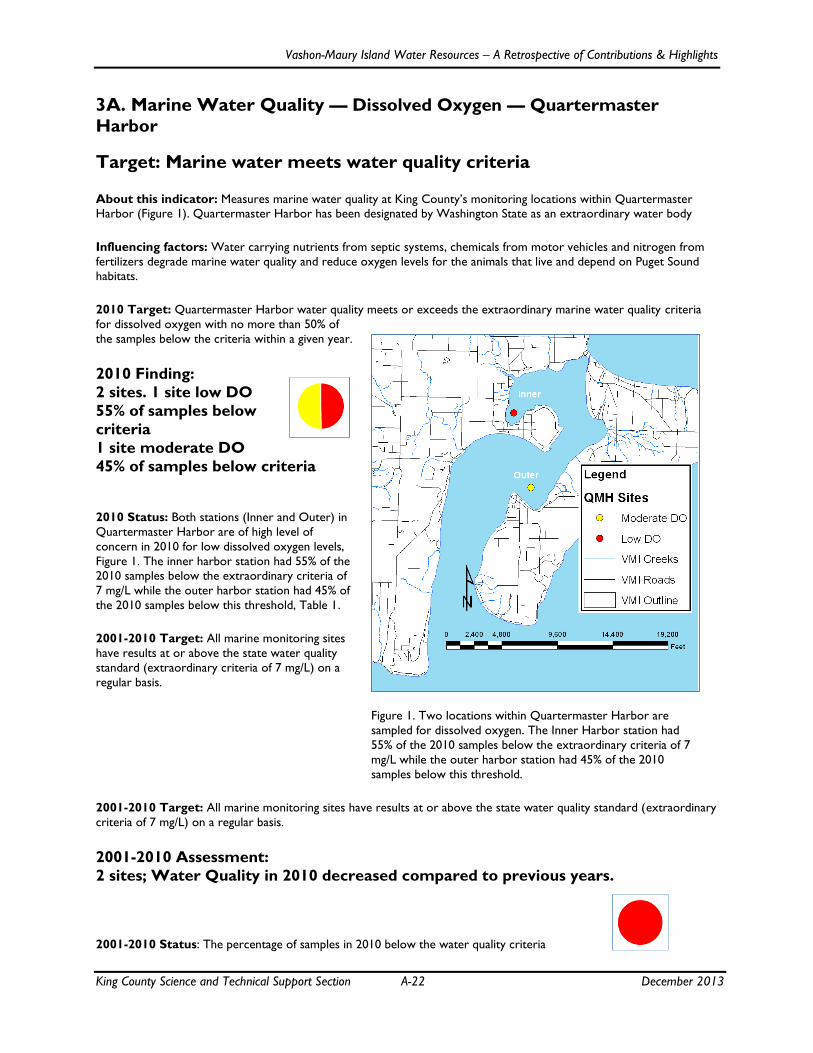
Vashon-Maury Island Water Resources – A Retrospective of Contributions & Highlights
King County Science and Technical Support Section A-22 December 2013
3A. Marine Water Quality — Dissolved Oxygen — Quartermaster
Harbor
Target: Marine water meets water quality criteria
About this indicator: Measures marine water quality at King County‘s monitoring locations within Quartermaster
Harbor (Figure 1). Quartermaster Harbor has been designated by Washington State as an extraordinary water body
Influencing factors: Water carrying nutrients from septic systems, chemicals from motor vehicles and nitrogen from
fertilizers degrade marine water quality and reduce oxygen levels for the animals that live and depend on Puget Sound
habitats.
2010 Target: Quartermaster Harbor water quality meets or exceeds the extraordinary marine water quality criteria
for dissolved oxygen with no more than 50% of
the samples below the criteria within a given year.
2010 Finding:
2 sites. 1 site low DO
55% of samples below
criteria
1 site moderate DO
45% of samples below criteria
2010 Status: Both stations (Inner and Outer) in
Quartermaster Harbor are of high level of
concern in 2010 for low dissolved oxygen levels,
Figure 1. The inner harbor station had 55% of the
2010 samples below the extraordinary criteria of
7 mg/L while the outer harbor station had 45% of
the 2010 samples below this threshold, Table 1.
2001-2010 Target: All marine monitoring sites
have results at or above the state water quality
standard (extraordinary criteria of 7 mg/L) on a
regular basis.
Figure 1. Two locations within Quartermaster Harbor are
sampled for dissolved oxygen. The Inner Harbor station had
55% of the 2010 samples below the extraordinary criteria of 7
mg/L while the outer harbor station had 45% of the 2010
samples below this threshold.
2001-2010 Target: All marine monitoring sites have results at or above the state water quality standard (extraordinary
criteria of 7 mg/L) on a regular basis.
2001-2010 Assessment:
2 sites; Water Quality in 2010 decreased compared to previous years.
2001-2010 Status: The percentage of samples in 2010 below the water quality criteria

Vashon-Maury Island Water Resources – A Retrospective of Contributions & Highlights
King County Science and Technical Support Section A-23 December 2013
increased compared to previous years, Table 1. For the inner harbor station, the 2010 data had more samples below the
criteria than any other year. For the outer harbor station, the 2010 data had more samples below the criteria than 3 out
of the 4 previous years. The data has been collected since 2006.
Table 1. Dissolved Oxygen data from the bottom values with percentages
below the state water quality standard (extraordinary criteria of 7 mg/L)
for each year sampled since 2006. Locations of each site are shown in
Figure 1.
Technical Notes: Marine Water Quality – Dissolved Oxygen – Quartermaster
Harbor
Data source: The data for this indicator comes from King County DNRP/WLRD Marine Monitoring Group.
Collection frequency: The King County DNRP/WLRD Marine Monitoring Group conducts monthly sampling at the
inner and outer harbor since 2006. The Burton Acres County Park station is not used in the assessment of dissolved
oxygen.
Methods for analysis: The dissolved oxygen (bottom station) data is compared to the extraordinary quality criteria of
7 mg/L, Figure 2. The total number of annual samples and the number of monthly samples below the criteria are used to
calculate the percentage of samples below the criteria
Data Reliability and Quality: The data quality of this indicator is high based on the KC SAP/SOP of sampling
collection. The reliability is good based on the consistent and regular collection of the data.
Data Reference: King County, Water and Land Resources Division, Science, Monitoring and Data Management
Section
Fecal Coliform (3B) is another marine water quality indicator for overall health of Quartermaster Harbor.
Station Year Total
Number Percentage of samples
below criteria
Inner
2006 9 22%
2007 12 25%
2008 12 17%
2009 12 25%
2010 11 55%
Outer
2006 12 25%
2007 12 50%
2008 12 42%
2009 12 17%
2010 11 45%

Vashon-Maury Island Water Resources – A Retrospective of Contributions & Highlights
King County Science and Technical Support Section A-24 December 2013
Figure 2. Dissolved Oxygen data (bottom values) for the Inner and Outer Quartermaster Harbor. The
extraordinary quality criteria for DO in marine water is 7.0 mg/L - above the line is better
Bet
ter
Wo
rse

Vashon-Maury Island Water Resources – A Retrospective of Contributions & Highlights
King County Science and Technical Support Section A-25 December 2013
3B. Marine Water Quality — Fecal Coliform — Quartermaster Harbor
Target: Marine water meets water quality criteria
About this indicator: Measures marine water quality at King County‘s monitoring locations within Quartermaster
Harbor (Figure 1). Quartermaster Harbor has been designated by Washington State as an extraordinary water body.
Influencing factors: Water carrying nutrients from septic systems, chemicals from motor vehicles and nitrogen from
fertilizers degrade marine water quality and reduce oxygen levels for the animals that live and depend on Puget Sound
habitats.
2010 Target: Quartermaster Harbor water quality meets marine water quality criteria for the bacteria relating to
shellfish harvesting and primary contract recreation.
2010 Finding:
All 3 sites meet
state water
quality criteria
2010 Status: All
three Quartermaster Harbor stations
met the state water quality criteria for
fecal coliform bacteria (low bacteria
counts), Figure 1 & 2.
2001-2010 Target: All marine
monitoring sites meet the state water
quality standard (low bacteria counts).
2001-2010 Assessment:
3 sites; 100% meeting
Water Quality
standards since
2006
2001-2010 Status: All
three sites had annual data that meet
state water quality criteria for fecal
coliform bacteria, Figure 2. The data
has been collected since 2006. The
2006-2010 average is 100% for sites
meeting the state water quality criteria.
Figure 1. Sampling locations within Quartermaster Harbor for fecal
coliform bacteria. All three stations (Inner Harbor, Burton, and Outer
Harbor) met (below) the state water quality criteria for fecal coliform
bacteria in 2010.

Vashon-Maury Island Water Resources – A Retrospective of Contributions & Highlights
King County Science and Technical Support Section A-26 December 2013
Figure 2. Fecal Coliform bacteria data shown as geometric mean (cfu/100ml) for each station within
Quartermaster Harbor (QMH). Inner and outer harbor stations started in 2006 and the Burton station
started in 2007. Washington State (WA) standard for fecal coliform bacteria in marine waters is shown at
14 cfu/100ml.
Technical Notes: Marine Water Quality – Fecal Coliform – Quartermaster
Harbor
Data source: The data for this indicator comes from King County DNRP/WLRD Marine Monitoring Group.
Collection frequency: The King County DNRP/WLRD Marine Monitoring Group conducts monthly sampling at the
inner and outer harbor since 2006. A third station in Quartermaster Harbor, Burton Acres County Park, started in 2007
and is used in the assessment of fecal coliform bacteria.
Methods for analysis: Fecal coliform results are compared to the current marine water fecal coliform criteria, a
geometric mean of 14 colony forming units /100ml. Samples either meet or do not meet the marine water fecal coliform
criteria. This fecal coliform criteria is calculated over a 12-month sampling period.
Data Reliability and Quality: The data quality of this indicator is high based on the KC SAP/SOP of sampling
collection. The reliability is good based on the consistent and regular collection of the data.
Data Reference: King County, Water and Land Resources Division, Science, Monitoring and Data Management
Section
Dissolved Oxygen (3A) is another marine water quality indicator for overall health of Quartermaster Harbor.

Vashon-Maury Island Water Resources – A Retrospective of Contributions & Highlights
King County Science and Technical Support Section A-27 December 2013
4. Groundwater Water Levels
Target: Water table levels are maintained or improved with time
About this indicator: Water levels are measured at numerous locations across the island within several different
water bearing zones. The frequency of this dataset varies from monthly to annual to longer periods of time between
measurements.
Influencing factors: Amount of precipitation for a given year. Changes to recharge areas from land use changes.
Changes in water use patterns for a given year.
2010 Target: 2010 data within one standard deviation of baseline average.
2010 Finding: 13
sites; 3 sites higher,
6 sites lower, 4 no
change
2010 Status: Sixty sites have water level data
during 2001-2010. The majority of these sites are
not being actively monitored or monitored on an
infrequent (once a year) basis. Thirteen sites have
2010 water level data along with an averaged
baseline (2001-2008), Figure 1 and Table 1. Three
sites have higher water table elevations in 2010
compared to their baseline average value shown in
Figure 1 with bold green color. Six sites have
lower 2010 values compared to baseline: yellow
for values between 1 & 2 standard deviations; red
for values past 2 standard deviations, Table 1 and
Figure1. The remaining four sites have 2010 values
within their standard deviation also reported as
green color in Table 1.
Vashon-Maury Island has multiple water bearing
zones, aquifers that are being monitored with the
help of volunteers and monitoring wells, Table 1
and Table 2. Consistent regular data allows for the
assessment of conditions. Volunteer monitoring
began in 2001 while monitoring wells were
installed in 2005 and 2007.
Figure 1. Water level locations used in this indicator. Data
shown represent 2010 assessment compared to baseline
average. Three sites have higher water table elevations in 2010
compared to their baseline average value: green w/ dot. Six sites
have lower 2010 values compared to baseline: yellow for values
between 1 & 2 standard deviations; red for values past 2
standard deviations. The remaining four sites have 2010 values
within their standard deviation also reported as green color. The
remaining 47 sites have too few data points to assess baseline.

Vashon-Maury Island Water Resources – A Retrospective of Contributions & Highlights
King County Science and Technical Support Section A-28 December 2013
Table 1. 2010 Water Table elevations for baseline sites and King County Monitoring wells. An average of the data
collected in 2010 was compared to the baseline average (see Table 2) to assess any change. Colors represent
change: green (with bold) for sites with higher 2010 values compared to baseline; Yellow for sites with lower (> 1
st dev) values; Red for sites with lower (>2 st dev) values; Green also represent sites with no change ( data within
the standard deviation)
Count = Number of data points – volunteers typically report monthly – continuous recorder data are also shown as
monthly.
Avg-WT elev = Average water table elevation in feet above sea level.
2001-2010 Target: No long term declines in water table levels over baseline.
2001-2010 Assessment:
15 sites; 1 site - lower levels,
1 site - higher levels, 13 sites - no change 2001 to 2010
2001-2010 Status: One site has a decrease in the water table elevation greater than 1 standard
deviation when comparing recent (2009-2010) averaged water table levels to an averaged baseline (2001-2008), Table 2.
One site has a greater than 1 standard deviation increase in their recent averaged water table levels as compared to
baseline. The remaining 13 sites in Table 2 have difference within 1 standard deviation of data. Another 45 sites have too
few data points to assess change through time. King County has 10 monitoring wells which have a limited dataset of
water levels data from 2006-2010.
Technical Notes Water Levels on Vashon-Maury Island
Data source: The data for this indicator comes from multiple sources including volunteers, VMI water purveyors and
King County WLRD Groundwater Protection Program. Vashon-Maury Island has over 1000 wells including public water
sources and individuals.
Collection frequency: A volunteering program was started in 2001 for well owner to self monitor their water levels.
Four sites are currently active that started in 2001. Water purveyors monitor their sources on a regular basis and have
report their data to King County upon request. The groundwater program collects water level data at 10 monitoring
well locations which began in 2006. The KC wells typically have continuous data loggers recording daily water level
information. Additional water level data is collected during annual water quality sampling if possible.
Site Id 2010 Assessment
Aquifer Count Avg-WT elev difference st-dev_ft
vol_w-06 12 197.0 -0.6 0.2 Qva - Main
vol_w-13 12 158.7 -1.4 1.3 Qpfc - Deep
w-21 11 184.1 0.4 0.3 Qva - Main
vol_w-02 6 25.8 -0.5 2.0 Qpo - Deep
KC
Wells
w-60 9 178.2 -1.7 0.5 Qva - Main
w-61 12 240.6 0.2 0.1 Qva - Main
w-63 9 180.1 -0.2 0.1 Qva/Qpfc
w-64 3 199.7 1.0 0.2 Qva - Main
w-65 12 240.4 0.1 0.1 Qva - Main
w-70 12 178.3 0.0 0.2 Qpo- Deep
w-71 10 282.8 0.3 0.3 Qva - Main
w-72 12 260.6 -0.8 0.3 Qva - Main
w-73 3 134.7 -1.0 0.8 Qvr - Shallow

Vashon-Maury Island Water Resources – A Retrospective of Contributions & Highlights
King County Science and Technical Support Section A-29 December 2013
Methods for analysis: Total count of water level
measurements per site done over 2001 to 2010. For
those sites with more than 30 measurements, a
baseline average was calculated. This baseline average
was compared to a recent (2009-2010) average of
water level measurements to assess any change
greater than 1 standard deviation. One site has a
decline more than 1 standard deviation when
comparing recent averaged water level data to
baseline. Another site shows an increase over the
same time period yet has a limited dataset, Table 2.
The remaining 13 sites have no change (within the
standard deviation) when comparing baseline to
recent data. All other sites (45) have too few data to
assess changes through time. The KC well data is
reported as monthly data for similar count periods as
other datasets.
Data Reliability and Quality: The data quality of
this indicator is high based on the KC SOP/training of
data collection. The reliability is fair to good. Data
reliability from the sources varies. A direct solicitation
of data from the water purveyors began in 2011.
Vashon-Maury Island has over 1000 wells including
public water sources and individuals. King County
monitors water levels in 10 monitoring wells.
Figure 2. Water level locations used in this indicator. Data
shown represent recent status conditions with 1 site having
lower recent water table elevation data compared to their
baseline while one site has an increase in their recent water
table data, Table 2. Thirteen sites have no change in the water
table levels when comparing baseline (2001-2008) data to
recent (2009-2010) data based on their standard deviation.
The remaining 45 sites have too few data points to assess
baseline.
Data Reference: King County - Water Resources Evaluation Project – Data Report 2005-2009.
http://www.kingcounty.gov/environment/waterandland/groundwater/management-areas/vashon-maury-island-
gwma/vashon-island.aspx
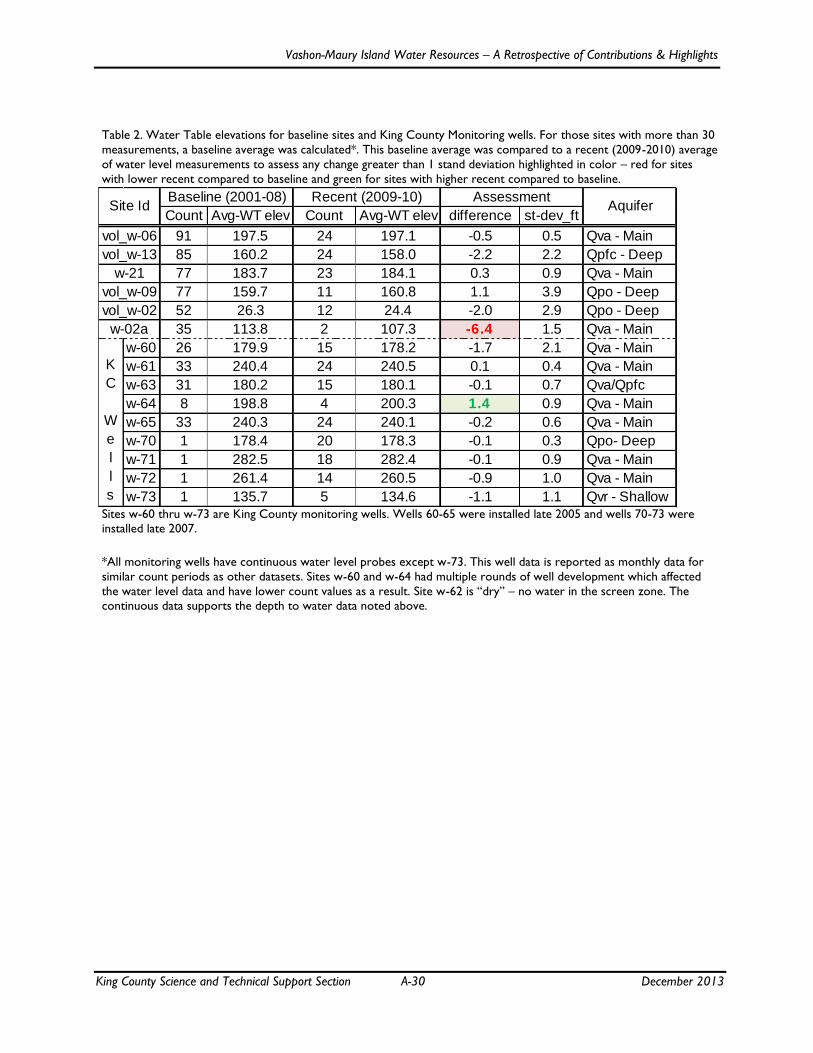
Vashon-Maury Island Water Resources – A Retrospective of Contributions & Highlights
King County Science and Technical Support Section A-30 December 2013
Table 2. Water Table elevations for baseline sites and King County Monitoring wells. For those sites with more than 30
measurements, a baseline average was calculated*. This baseline average was compared to a recent (2009-2010) average
of water level measurements to assess any change greater than 1 stand deviation highlighted in color – red for sites
with lower recent compared to baseline and green for sites with higher recent compared to baseline.
Sites w-60 thru w-73 are King County monitoring wells. Wells 60-65 were installed late 2005 and wells 70-73 were
installed late 2007.
*All monitoring wells have continuous water level probes except w-73. This well data is reported as monthly data for
similar count periods as other datasets. Sites w-60 and w-64 had multiple rounds of well development which affected
the water level data and have lower count values as a result. Site w-62 is ―dry‖ – no water in the screen zone. The
continuous data supports the depth to water data noted above.
Count Avg-WT elev Count Avg-WT elev difference st-dev_ft
91 197.5 24 197.1 -0.5 0.5 Qva - Main
85 160.2 24 158.0 -2.2 2.2 Qpfc - Deep
77 183.7 23 184.1 0.3 0.9 Qva - Main
77 159.7 11 160.8 1.1 3.9 Qpo - Deep
52 26.3 12 24.4 -2.0 2.9 Qpo - Deep
35 113.8 2 107.3 -6.4 1.5 Qva - Main
w-60 26 179.9 15 178.2 -1.7 2.1 Qva - Main
w-61 33 240.4 24 240.5 0.1 0.4 Qva - Main
w-63 31 180.2 15 180.1 -0.1 0.7 Qva/Qpfc
w-64 8 198.8 4 200.3 1.4 0.9 Qva - Main
w-65 33 240.3 24 240.1 -0.2 0.6 Qva - Main
w-70 1 178.4 20 178.3 -0.1 0.3 Qpo- Deep
w-71 1 282.5 18 282.4 -0.1 0.9 Qva - Main
w-72 1 261.4 14 260.5 -0.9 1.0 Qva - Main
w-73 1 135.7 5 134.6 -1.1 1.1 Qvr - Shallow
Baseline (2001-08) Recent (2009-10) AssessmentAquifer
vol_w-13
vol_w-06
Site Id
K
C
W
e
l
l
s
w-02a
vol_w-02
vol_w-09
w-21
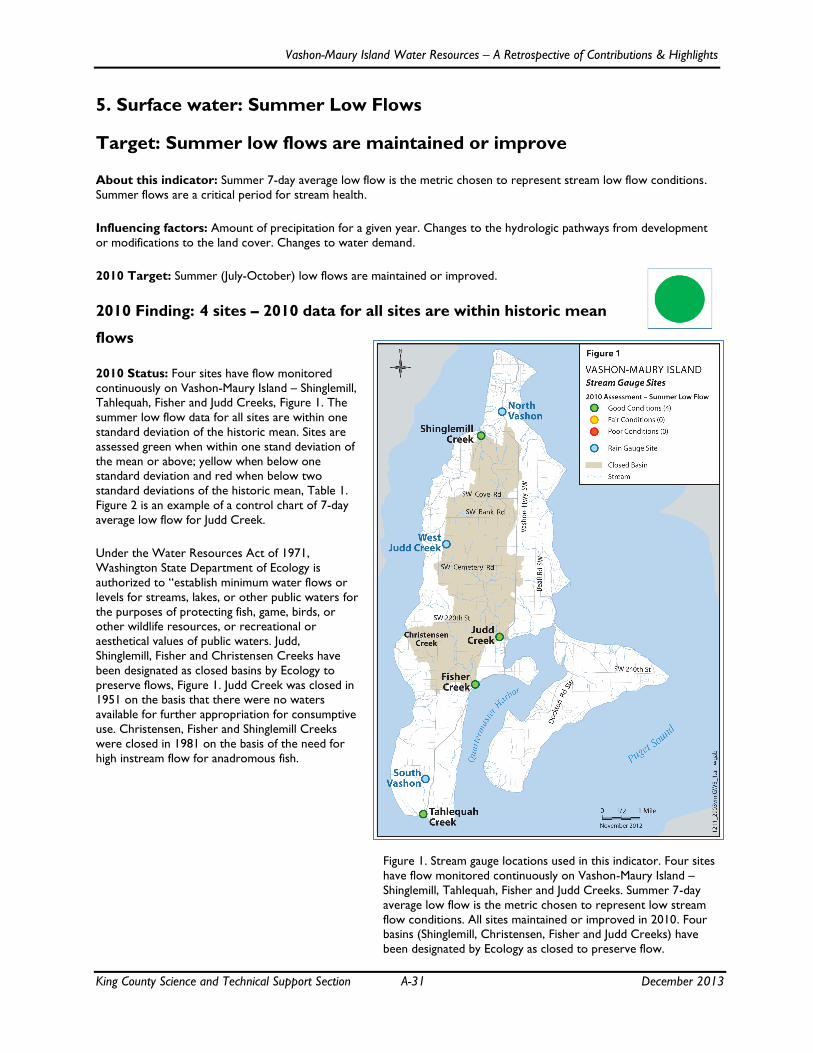
Vashon-Maury Island Water Resources – A Retrospective of Contributions & Highlights
King County Science and Technical Support Section A-31 December 2013
5. Surface water: Summer Low Flows
Target: Summer low flows are maintained or improve
About this indicator: Summer 7-day average low flow is the metric chosen to represent stream low flow conditions.
Summer flows are a critical period for stream health.
Influencing factors: Amount of precipitation for a given year. Changes to the hydrologic pathways from development
or modifications to the land cover. Changes to water demand.
2010 Target: Summer (July-October) low flows are maintained or improved.
2010 Finding: 4 sites – 2010 data for all sites are within historic mean
flows
2010 Status: Four sites have flow monitored
continuously on Vashon-Maury Island – Shinglemill,
Tahlequah, Fisher and Judd Creeks, Figure 1. The
summer low flow data for all sites are within one
standard deviation of the historic mean. Sites are
assessed green when within one stand deviation of
the mean or above; yellow when below one
standard deviation and red when below two
standard deviations of the historic mean, Table 1.
Figure 2 is an example of a control chart of 7-day
average low flow for Judd Creek.
Under the Water Resources Act of 1971,
Washington State Department of Ecology is
authorized to ―establish minimum water flows or
levels for streams, lakes, or other public waters for
the purposes of protecting fish, game, birds, or
other wildlife resources, or recreational or
aesthetical values of public waters. Judd,
Shinglemill, Fisher and Christensen Creeks have
been designated as closed basins by Ecology to
preserve flows, Figure 1. Judd Creek was closed in
1951 on the basis that there were no waters
available for further appropriation for consumptive
use. Christensen, Fisher and Shinglemill Creeks
were closed in 1981 on the basis of the need for
high instream flow for anadromous fish.
Figure 1. Stream gauge locations used in this indicator. Four sites
have flow monitored continuously on Vashon-Maury Island –
Shinglemill, Tahlequah, Fisher and Judd Creeks. Summer 7-day
average low flow is the metric chosen to represent low stream
flow conditions. All sites maintained or improved in 2010. Four
basins (Shinglemill, Christensen, Fisher and Judd Creeks) have
been designated by Ecology as closed to preserve flow.

Vashon-Maury Island Water Resources – A Retrospective of Contributions & Highlights
King County Science and Technical Support Section A-32 December 2013
2001-2010 Target: Summer low flows are maintained or improve
2001-2010 Assessment: All sites maintained or improved in 2010
2001-2010 Status: Three of the four sites (all but Tahlequah) show changes in summer low flows that reflect changes
in total amount of precipitation when looking over the last ten years; 2001-2010, Figure 3. Tahlequah has maintained the
same flows for the last five years and doesn‘t show the same pattern that reflects total rainfall as the other sites.
Table 1. Summer low flow data for 4 creeks on Vashon-Maury Island. Data are presented as 7-day low flow for July
through October for each Water Year 2001-2010. Sites are assessed green when within one stand deviation of the
mean or above; yellow when below one standard deviation and red when below two standard deviations of the historic
mean. Locations of each site are shown in Figure 1. Units are cubic feet per second (cfs).
Monitoring began on Fisher and Tahlequah Creek in 2005; Judd Creek in 2000 and Shinglemill Creek in 1999.
Figure 2. Control chart for Judd Creek. Data presented as 7-day low flow for July through October for each
Water Year since data collection started. Solid line is the mean of all historic data. Dashed lines are standard
deviations (SD) from the mean. Increasing values represent more flow. Assessment colors are shown for
reference and are explained in greater detail within technical notes section. Units are cubic feet per second.
Creek\Year 2001 2002 2003 2004 2005 2006 2007 2008 2009 2010
Judd 1.4 1.5 1.3 1.2 1.2 1.2 1.5 1.3 1.1 1.4
Shinglemill 1.4 1.4 1.5 1.5 1.4 1.6 1.8 1.4 1.4 1.4
Fisher — — — — 0.4 0.4 0.6 0.3 0.4 0.4
Tahlequah — — — — 0.1 0.2 0.2 0.2 0.2 0.2
0
0.5
1
1.5
2
2.5
3
2000 2001 2002 2003 2004 2005 2006 2007 2008 2009 2010
7D
Av
era
ge
Lo
w F
low
(Ju
ly-O
cto
be
r)
Year
Judd 7D Low SD +2 SD +1 Mean SD -1 SD -2

Vashon-Maury Island Water Resources – A Retrospective of Contributions & Highlights
King County Science and Technical Support Section A-33 December 2013
Technical Notes Surface Water: Summer Instream Flows
Data source: The data for this indicator comes from King County Water and Land Resources Division.
Collection frequency: King County has been monitoring stream flow continuously at four sites since 2005 –
Shinglemill, Judd, Fisher, and Tahlequah Creeks. Shinglemill and Judd Creeks have been monitored since 1999 and 2000,
respectively.
Methods for analysis: A 7-day low flow for a stream is the average flow measured during the 7 consecutive days of
lowest flow during any given year. The summer period is assessed as July through October. The minimum flow for the
summer period is recorded and tracked year to year, Figure 3. Sites are assessed ‗green‘ when within one stand
deviation of the mean or above; ‗yellow‘ when below one standard deviation and ‗red‘ when below two standard
deviations of the historic mean, Table 1.
Data Reliability and Quality: The data quality of this indicator is high based on the KC SAP/SOP of the data
collection. The reliability is good based on the consistent and regular collection of the data. Vashon-Maury Island has
over 70 stream basins. Judd, Shinglemill, Fisher, and Tahlequah Creeks are the four largest basins representing 32% of the
total area of the island.
Data Reference: King County Water Resources Evaluation Project – Data Reports 2005-2010.
Figure 3. Summer low flow data for 4 creeks on Vashon-Maury Island. Data are presented as 7-day low flow for July
through October for each Water Year 2001-2010. Increasing values represent more flow. All sites improved or
maintained in the last two years (2009-2010). Rainfall totals (inches per water year) are shown on the second axis for
three (North, Middle and South) precipitation sites on Vashon Island.

Vashon-Maury Island Water Resources – A Retrospective of Contributions & Highlights
King County Science and Technical Support Section A-34 December 2013
6. Surface water: Stream Flashiness
Target: Flashiness Indicator is maintained or improved
About this indicator: A metric to indicate how a stream responds to increased flow associated with routine
storm events. The R-B Index has lower inter-annual variability than many other flow regime indicators, making it well
suited for detecting gradual changes in flow regimes associated with changes in land use and in land management
practices.
Influencing factors: Changes to the hydrologic pathways from development or modifications to the land cover.
Amount of precipitation for a given year. The index values increase as the frequency and magnitude of storm events
increase and decrease accordingly.
2010 Target: The flashiness indicator is maintained or improved.
2010 Finding: 4 sites – 2010 data for all sites are within historic
mean values
2010 Status: Four sites have flow monitored
continuously on Vashon-Maury Island – Shinglemill,
Tahlequah, Fisher and Judd Creeks, Figure 1. All sites
have maintained their R-B index values since
measurements began however more time is necessary
before a trend can be determined. For Shinglemill and
Judd Creeks that began in 1999 while Fisher and
Tahlequah creeks have been monitored since 2005.
The R-B index values are shown in Table 1 and Figure
2 for the last ten years; 2001-2010.
2001-2010 Target: Flashiness Indicator is
maintained or improved
2001-2010 Assessment:
All sites maintained in
2009 and 2010.
2001-2010 Status: When
assessing the ten year period of 2001-2010, all four
sites respond to changes to the environment such as
lower R-B index values for years with lower
precipitation totals and higher values when the
opposite occurs, Figure 2. Judd and Shinglemill Creek
have 10 years of flow data and appear to be
maintaining R-B index values however additional data
(5+ years or more) is required to determine if any
changes are more than variations in total amount of
precipitation.
Figure 1. Stream gauge locations used in this indicator. Four
sites have flow monitored continuously on Vashon-Maury
Island – Shinglemill, Tahlequah, Fisher and Judd Creeks. All
sites maintained or improved in 2009 and 2010.

Vashon-Maury Island Water Resources – A Retrospective of Contributions & Highlights
King County Science and Technical Support Section A-35 December 2013
Table 1. R-B Index data for 4 creeks on Vashon-Maury Island for each Water Year 2001-2010. The R-B Index
has annual variability and the overall trend (over many years) can indicate gradual changes in flow regimes
associated with changes in land use and in land management practices. Locations of each site are shown in
Figure 1. A range of R-B index values is shown in Figure 3. Units are cubic feet per second.
Technical Notes Surface Water: Stream Flashiness
Data source: The data for this indicator comes from monitoring done by King County Water and Land Resources
Division.
Collection frequency: King County has been monitoring stream flow continuously at four sites since 2005 –
Shinglemill, Judd, Fisher, and Tahlequah Creeks. Shinglemill and Judd Creeks have been monitored since 1999 and 2000,
respectively.
Methods for analysis: Each site has flow measured continuously. The R-B index is calculated for each site for a given
water year. The flashiness indicator is the sum of the absolute values of the day-to-day changes in mean daily flow divided
by mean daily flow for the year. The resulting index is unit-less. The data are presented for the last 10 water years 2001 -
2010, Figure 2. Lower values represent a more stable hydrologic system than higher values, Figure 3.
Data Reliability and Quality: The data quality of this indicator is high based on the KC SAP/SOP of the data
collection. The reliability is good based on the consistent and regular collection of the data. The R-B index is an indicator
that shows trends with longer (~20 years or more) data sets. As notes above, additional data will need to be collected
before a full assessment can be done. Vashon-Maury Island has over 70 stream basins. Judd, Shinglemill, Fisher, and
Tahlequah Creeks are the four largest basins representing 32% of the total area of the island.
Data Reference:
King County - Water Resources Evaluation Project – Data Report 2005-2009.
http://www.kingcounty.gov/environment/waterandland/groundwater/management-areas/vashon-maury-island-
gwma/vashon-island.aspx
Baker et al., 2004, A new flashiness index: Characteristics and applications to Midwestern rivers and streams, Journal of
the American Water Resources Association (JAWRA) 40(2):503-522.
Creek\Year 2001 2002 2003 2004 2005 2006 2007 2008 2009 2010
Judd 0.2 0.4 0.3 0.3 0.3 0.3 0.3 0.3 0.4 0.3
Shinglemill 0.2 0.4 0.3 0.4 0.3 0.3 0.4 0.3 0.3 0.3
Fisher — — — — 0.2 0.2 0.3 0.2 0.2 0.2
Tahlequah — — — — 0.2 0.3 0.3 0.3 0.3 0.3
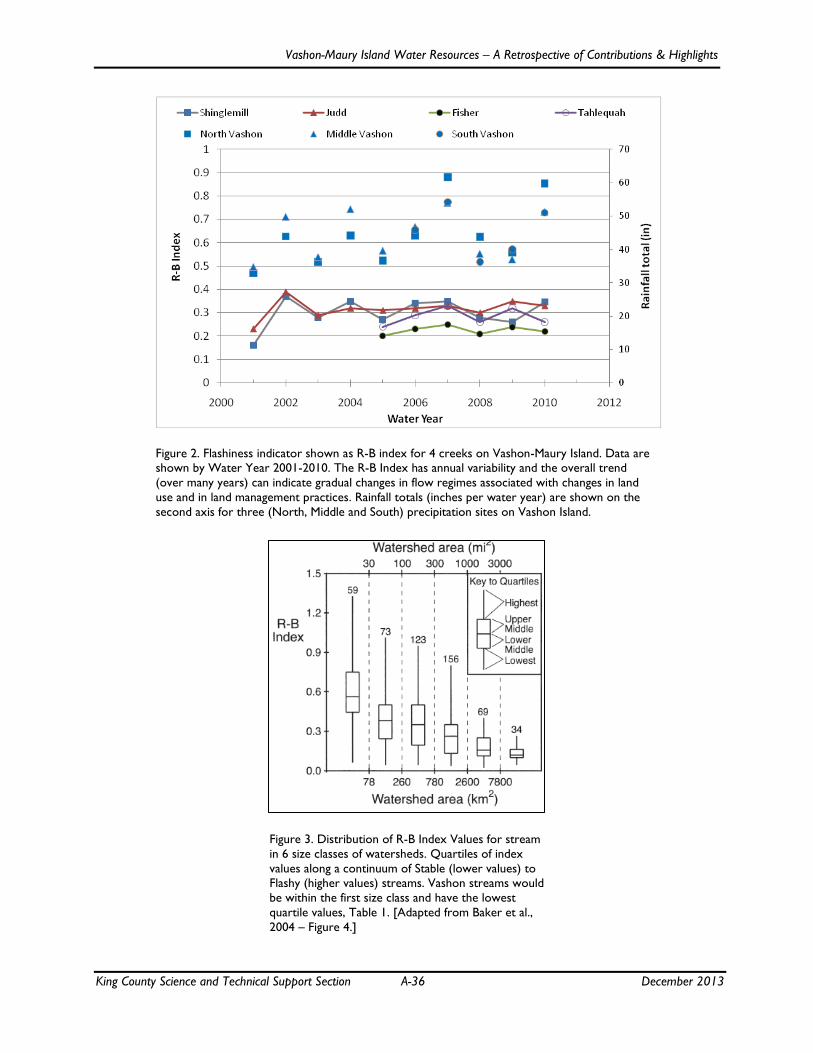
Vashon-Maury Island Water Resources – A Retrospective of Contributions & Highlights
King County Science and Technical Support Section A-36 December 2013
Figure 2. Flashiness indicator shown as R-B index for 4 creeks on Vashon-Maury Island. Data are
shown by Water Year 2001-2010. The R-B Index has annual variability and the overall trend
(over many years) can indicate gradual changes in flow regimes associated with changes in land
use and in land management practices. Rainfall totals (inches per water year) are shown on the
second axis for three (North, Middle and South) precipitation sites on Vashon Island.
Figure 3. Distribution of R-B Index Values for stream
in 6 size classes of watersheds. Quartiles of index
values along a continuum of Stable (lower values) to
Flashy (higher values) streams. Vashon streams would
be within the first size class and have the lowest
quartile values, Table 1. [Adapted from Baker et al.,
2004 – Figure 4.]
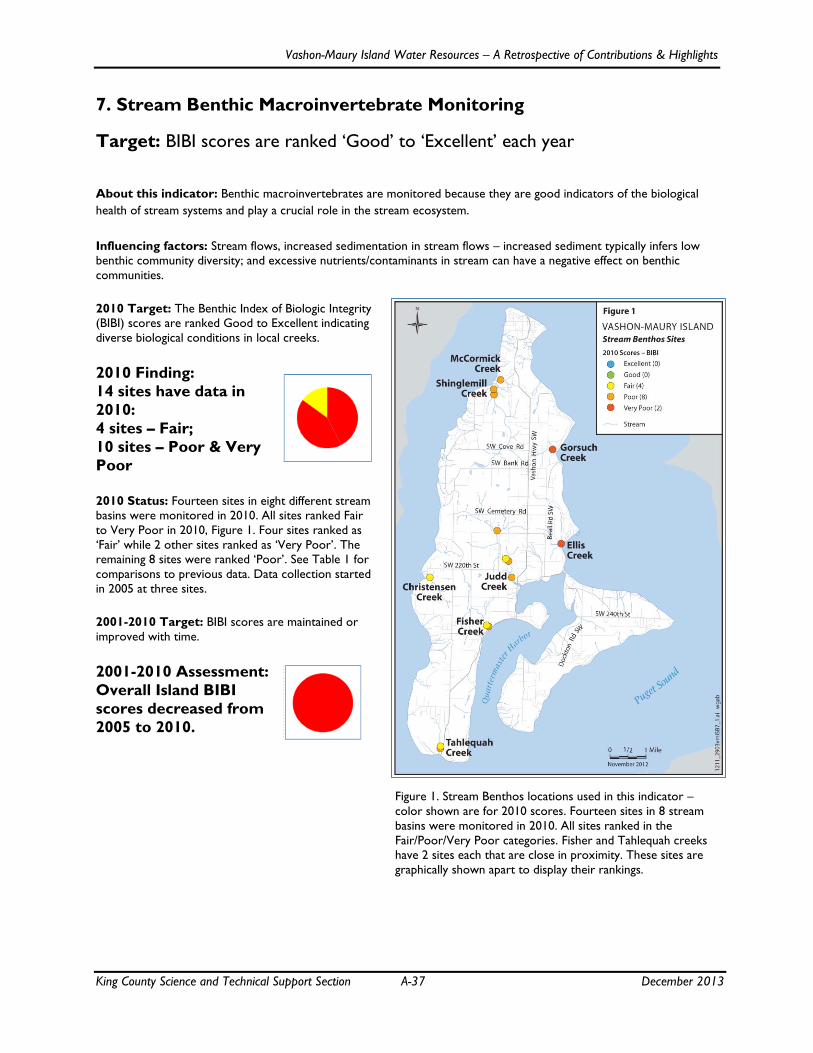
Vashon-Maury Island Water Resources – A Retrospective of Contributions & Highlights
King County Science and Technical Support Section A-37 December 2013
7. Stream Benthic Macroinvertebrate Monitoring
Target: BIBI scores are ranked ‗Good‘ to ‗Excellent‘ each year
About this indicator: Benthic macroinvertebrates are monitored because they are good indicators of the biological
health of stream systems and play a crucial role in the stream ecosystem.
Influencing factors: Stream flows, increased sedimentation in stream flows – increased sediment typically infers low
benthic community diversity; and excessive nutrients/contaminants in stream can have a negative effect on benthic
communities.
2010 Target: The Benthic Index of Biologic Integrity
(BIBI) scores are ranked Good to Excellent indicating
diverse biological conditions in local creeks.
2010 Finding:
14 sites have data in
2010:
4 sites – Fair;
10 sites – Poor & Very
Poor
2010 Status: Fourteen sites in eight different stream
basins were monitored in 2010. All sites ranked Fair
to Very Poor in 2010, Figure 1. Four sites ranked as
‗Fair‘ while 2 other sites ranked as ‗Very Poor‘. The
remaining 8 sites were ranked ‗Poor‘. See Table 1 for
comparisons to previous data. Data collection started
in 2005 at three sites.
2001-2010 Target: BIBI scores are maintained or
improved with time.
2001-2010 Assessment:
Overall Island BIBI
scores decreased from
2005 to 2010.
Figure 1. Stream Benthos locations used in this indicator –
color shown are for 2010 scores. Fourteen sites in 8 stream
basins were monitored in 2010. All sites ranked in the
Fair/Poor/Very Poor categories. Fisher and Tahlequah creeks
have 2 sites each that are close in proximity. These sites are
graphically shown apart to display their rankings.
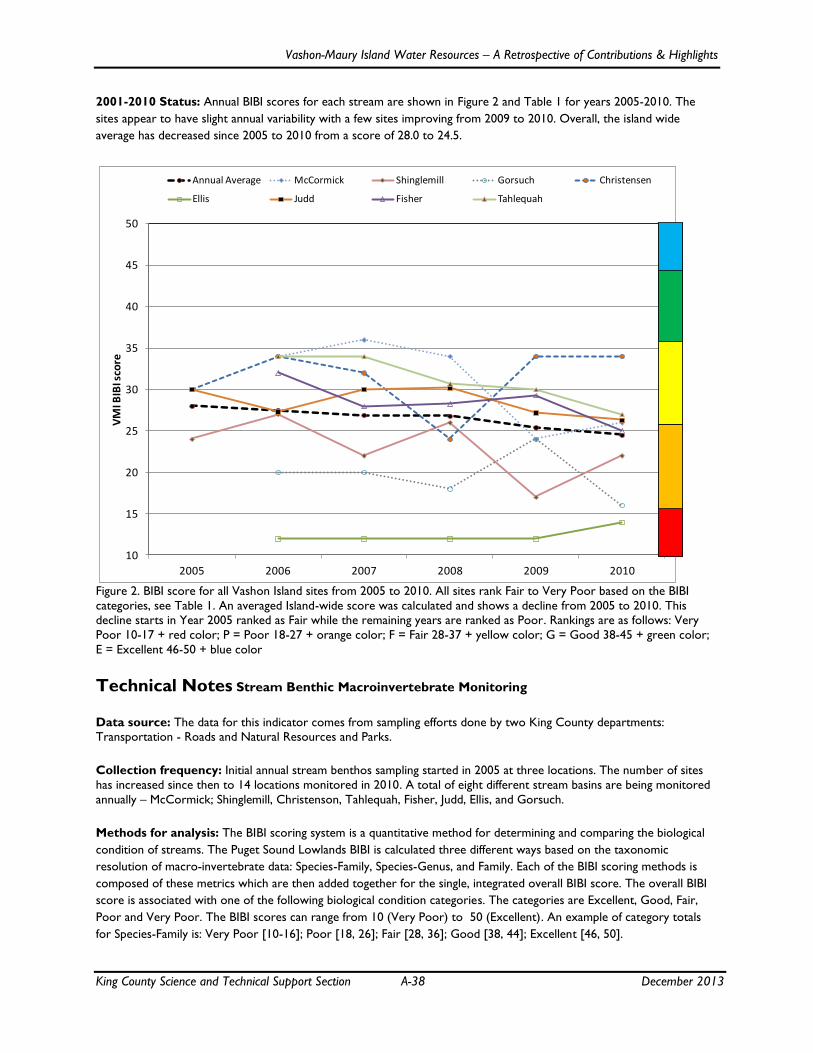
Vashon-Maury Island Water Resources – A Retrospective of Contributions & Highlights
King County Science and Technical Support Section A-38 December 2013
2001-2010 Status: Annual BIBI scores for each stream are shown in Figure 2 and Table 1 for years 2005-2010. The
sites appear to have slight annual variability with a few sites improving from 2009 to 2010. Overall, the island wide
average has decreased since 2005 to 2010 from a score of 28.0 to 24.5.
Figure 2. BIBI score for all Vashon Island sites from 2005 to 2010. All sites rank Fair to Very Poor based on the BIBI
categories, see Table 1. An averaged Island-wide score was calculated and shows a decline from 2005 to 2010. This
decline starts in Year 2005 ranked as Fair while the remaining years are ranked as Poor. Rankings are as follows: Very
Poor 10-17 + red color; P = Poor 18-27 + orange color; F = Fair 28-37 + yellow color; G = Good 38-45 + green color;
E = Excellent 46-50 + blue color
Technical Notes Stream Benthic Macroinvertebrate Monitoring
Data source: The data for this indicator comes from sampling efforts done by two King County departments:
Transportation - Roads and Natural Resources and Parks.
Collection frequency: Initial annual stream benthos sampling started in 2005 at three locations. The number of sites
has increased since then to 14 locations monitored in 2010. A total of eight different stream basins are being monitored
annually – McCormick; Shinglemill, Christenson, Tahlequah, Fisher, Judd, Ellis, and Gorsuch.
Methods for analysis: The BIBI scoring system is a quantitative method for determining and comparing the biological
condition of streams. The Puget Sound Lowlands BIBI is calculated three different ways based on the taxonomic
resolution of macroinvertebrate data: Species-Family, Species-Genus, and Family. Each of the BIBI scoring methods is
composed of these metrics which are then added together for the single, integrated overall BIBI score. The overall BIBI
score is associated with one of the following biological condition categories. The categories are Excellent, Good, Fair,
Poor and Very Poor. The BIBI scores can range from 10 (Very Poor) to 50 (Excellent). An example of category totals
for Species-Family is: Very Poor [10-16]; Poor [18, 26]; Fair [28, 36]; Good [38, 44]; Excellent [46, 50].
10
15
20
25
30
35
40
45
50
2005 2006 2007 2008 2009 2010
VM
I BIB
I sco
re
Annual Average McCormick Shinglemill Gorsuch Christensen
Ellis Judd Fisher Tahlequah

Vashon-Maury Island Water Resources – A Retrospective of Contributions & Highlights
King County Science and Technical Support Section A-39 December 2013
Data Reliability and Quality: The data quality of this indicator is high based on the KC SAP/SOP of sampling
collection. The reliability is good based on the consistent and regular collection of the data. Vashon-Maury Island has 75
mapped streams discharging into Puget Sound.
Data Reference: Puget Sound Stream Benthos http://pugetsoundstreambenthos.org/default.aspx
Table 1 Benthic Index of Biologic Integrity (BIBI) scores for all Vashon Island
creeks from 2005 to 2010. For creeks with more than one site, the score
represents an average. All sites rank between Fair to Very Poor based on the BIBI
categories. An Island-wide score was calculated by averaging all the data into a
single score and shows a decline from 2005 to 2010.
Ranks: Very Poor =10-17 + red color
Poor = 18-27 + orange color
Fair = 28-37 + yellow color
Good = 38-45 + green color
Excellent = 46-50 + blue color
Creeks\Year 2005 2006 2007 2008 2009 2010
Christensen 30 34 32 24 34 34
Ellis — 12 12 12 12 14
Fisher — 32 28 28.3 29.3 25
Gorsuch — 20 20 18 24 16
Judd 30 27.3 30 30.2 27.2 26.3
McCormick — 34 36 34 24 26
Shinglemill 24 27 22 26 17 22
Tahlequah — 34 34 30.7 30 27
Annual Average
28.0 27.5 26.9 26.8 25.4 24.5

Vashon-Maury Island Water Resources – A Retrospective of Contributions & Highlights
King County Science and Technical Support Section A-40 December 2013
8. Salmon Population
Target: Number of Salmon returning is maintained or increased
About this indicator: The number of returning salmon are recorded and tracked year to year. This is an indicator of
the biological health of stream systems and can play a crucial role in the stream ecosystem.
Influencing factors: Numerous items
influence the number of salmon returning
year to year. Data on Vashon is not assessed
due to lack of data collection in 2010.
2010 Target: The number of returning
salmon are recorded and tracked year to
year
2010 Finding:
No data
reported in
2010
2010 Status: No data were reported to
Salmon Watchers in 2010. Overall
participation in Salmon Watchers data
collection has been decreasing since 2002.
Data shown in Figure 1 is from 2002 as an
example of the potential data collection.
2001-2010 Target: The number of
returning salmon are maintained or increase
over time.
2001-2010
Assessment:
Overall Salmon
Watchers data
collection effort
has been decreasing from 2002
to 2010.
Figure 1. Salmonids Observed on Vashon-Maury Island in 2002. No data
was reported in 2010. This Figure is an example plot of data if
community involvement in Salmon Watchers increases again to
previous levels. Most recent data in 2009 had no salmonids observed at
two locations on Shinglemill Creek.

Vashon-Maury Island Water Resources – A Retrospective of Contributions & Highlights
King County Science and Technical Support Section A-41 December 2013
2001-2010 Status: No data were reported to Salmon Watchers program in 2010. Overall participation in Salmon
Watchers data collection has been decreasing since 2002. The number of salmon reported per survey year has
decreased since 2001 for several creeks, Table 1. However, the number of volunteers reporting the data and the number
of sites surveyed has also decreased over the same period. At this point, there is insufficient data to conclude whether
salmon populations are maintaining.
Table 1. Overall Salmon Watchers data collection effort on Vashon Maury Island in the last 10 years. The table shows an
―S‖ for surveyed creek or ―N‖ for no data collected for a given creek by year from 2001 until 2010. The number shown
in parenthesis (1) refers to the number of live fish reported during that surveyed year. Each creek may have numerous
reaches surveyed – as example in 2002: 5 reaches in Shinglemill Creek were surveyed, 2 reaches in Gorsuch Creek and 8
reaches in Judd Creek. No data were reported in 2010. In 2009, only 2 reaches of Shinglemill Creek were surveyed.
Technical Notes Salmon Population
Data source: The data for this indicator comes from King County‘s Salmon Watchers Program. This program involves
volunteers watching streams for spawning salmon in King and Snohomish Counties.
Collection frequency: Volunteers watch for fish on their assigned creeks two times a week from September through
December. Volunteers report their data to King County when completed. No data were reported in 2010. As many as
five creeks have been monitored in the past – Shinglemill, Christenson, Fisher, Judd, and Gorsuch Creek, Table 1.
Methods for analysis: Volunteers are trained to identify fish in creeks and report their data to King County when their
surveying period is completed. King County compiles the data by stream, reach, Juveniles, Redds, Citizens, SpeciesCode,
LiveCount, DeadCount, FinsClipped, and Tagged. King County writes a report summarizing the data collected annually,
(see link below).
Data Reliability and Quality: The data quality of this indicator can be good to high based on the training of observers.
The reliability is poor based on the recent participation. Vashon-Maury Island has 75 mapped streams. Sixteen of these
creeks are reported as fish bearing in the VMI Reconnaissance Report (2004).
Data Reference: Salmon Watcher Program, Volunteer Monitoring Program
http://www.kingcounty.gov/environment/animalsandplants/salmon-and-trout/salmon-watchers.aspx
Vashon-Maury Island Reconnaissance Report (2004) King County
http://www.kingcounty.gov/environment/watersheds/central-puget-sound/vashon-maury-island/recon-report.aspx
Creek\Year 2001 2002 2003 2004 2005 2006 2007 2008 2009 2010
Shinglemill Creek S (33) S (11) S (2) S (0) S (1) S (0) S (1) S (0) S (0) N
Christensen Creek S (0) S (1) S (1) N S (0) S (0) N N N N
Fisher Creek S (30) S (6) S (1) N S (2) N S (2) S (1) N N
Judd Creek S (136) S (163) S (321) S (146) S (31) S (27) S (1) S (4) N N
Gorsuch Creek N S (0) N N N N N N N N
Number of reported surveyed periods per year - all creeks
195 302 285 79 113 67 58 70 16 0

Vashon-Maury Island Water Resources – A Retrospective of Contributions & Highlights
King County Science and Technical Support Section A-42 December 2013
9. Total Annual Island-wide Water Use
Target: Total water consumption is reliability tracked year to year
About this indicator: The total island-wide water consumption is calculated from four water users – Group A public
water systems (PWS), Group B PWS, individuals and agricultural water users.
Influencing factors: Not all of the water users report their usage. Weather influences overall usage with drier years
typically having higher annual totals
2010 Target: Total island-wide water
consumption is calculated per year
2010 Finding: 2010 total water
usage estimated to be 489 Million
gallons per year (MGY)
2010 Status: Water use is estimated to be 489
Million gallons per year (MGY) Island-wide for
2010. The water usage is estimated from the
following water users: 21 Group A PWS; 143
Group B PWS; over 1000 individual wells and
almost 200 agricultural water users, Figure 1.
Public water systems serve approximately 90% of
the island population with Group A PWS (~80%)
and Group B PWS (~10%). The remaining
(~10%) population get their water from
individual wells.
Several studies have assessed the amount of
recharge that potentially occurs annually on VMI
and provides a range of recharge from 3200 to
over 10,900 Million gallons per year. Not all of
the recharge water is available for usage due to
aquifer retention and recovery factors. The 2010
water use estimate of 489 MGY is 4 to 15% of
the recharge range, Table 1.
Figure 1. Location of water sources for four water users – Group
A public water systems (PWS), Group B PWS, individuals and
irrigators. The water service areas for seven Group A PWS are
shown. These seven water service areas are the largest on the
island serving an associated population of 7,500. In total, there
are 21 Group A PWS; 143 Group B PWS; over 1000 individual
wells and almost 200 agricultural water users.

Vashon-Maury Island Water Resources – A Retrospective of Contributions & Highlights
King County Science and Technical Support Section A-43 December 2013
2001-2010 Target: Total island-wide water consumption is tracked year to year
2001-2010 Assessment: Average annual consumption – 515 MPY
from 2001-2010
2001-2010 Status: The 10 year (2001-2010) average of total Island-wide water consumption is
515 MGY. The annual total consumption ranged from 496 to 535 MGY during this period. Typically, consumption
increased during periods with lower rainfall totals and decreased during periods with higher rainfall totals. Water use is
estimated from four types of water users as noted in the Technical Notes section.
Technical Notes Annual Total Island-wide Water Consumption
Data source: The data for this indicator comes from Group A and Group B public water systems (PWS), individuals
and agricultural water users. Group B PWS are not required to report their usage and individual wells do not typically
have meters to assess their usage. Both of these user groups have a small subset that do report their usage. However,
this subset of users and their usage data are not totally representative of the entire user group. The irrigation data was
estimated based on agricultural categories [horticulture; livestock; mixed and unknown], input from King County
agricultural program & King Conservation District. Irrigation rates are derived from NRCS – Natural Resources
Conversation Service and refined based on irrigation practices on island.
Collection frequency: Group A PWS are required to keep track of their water usage. Recent changes require more
Group A PWS to report their usage annually. Thirteen of the 21 Group A PWS have reported their usage for 2010 via
the new state reporting requirement. The other water users are not required to report their usage. King County has
volunteers who reported their usage. Two group B PWS report their usage along with eight individual well owners. Data
from each of these user groups represent about 1% of their respective users. Water use data has been requested from a
variety of users.
Methods for analysis: Annual data that is reported is compiled into island-wide totals. For systems without data,
averages of reported data are applied to the remaining PWS. Recent modeling work on VMI required a gathering of
water use information. Much of this data is based on that initial gathering and supplemented with a small subset of users
who report their water usage.
Data Reliability and Quality: The data quality of this indicator can be good when data is reported from users.
Estimates are based on a small subset of data users and compared to other published data – see collection frequency for
number of reported users for each type. The reliability is fair based on the recent participation and should improve due
to changes in reporting requirements for most Group A PWS. In total, there are 21 Group A PWS; 143 Group B PWS;
over 1000 individual wells and almost 200 agricultural water users.
Data Reference: Water Purveyors; various King County programs including Groundwater, Agricultural, UTRC; and
VMI Volunteer Monitoring Program who self report usage.
Carr / Assocs. 1983. Vashon / Maury Island Water Resources Study. Submitted to the King County Dept of Planning and
Community Development. December 1983.
U.S. Geological Survey, 2004b, Estimated domestic, irrigation, and industrial water use in Washington, 2000: U.S.
Geological Survey Scientific Investigations Report 2004-5015,16p.
Vashon-Maury Island Groundwater Advisory Committee (VMI GWAC). 1998. Vashon-Maury Island Ground Water
Management Plan. Prepared by King County DNR and Seattle-King County Dept of Public Health. Final, submitted
December 1998
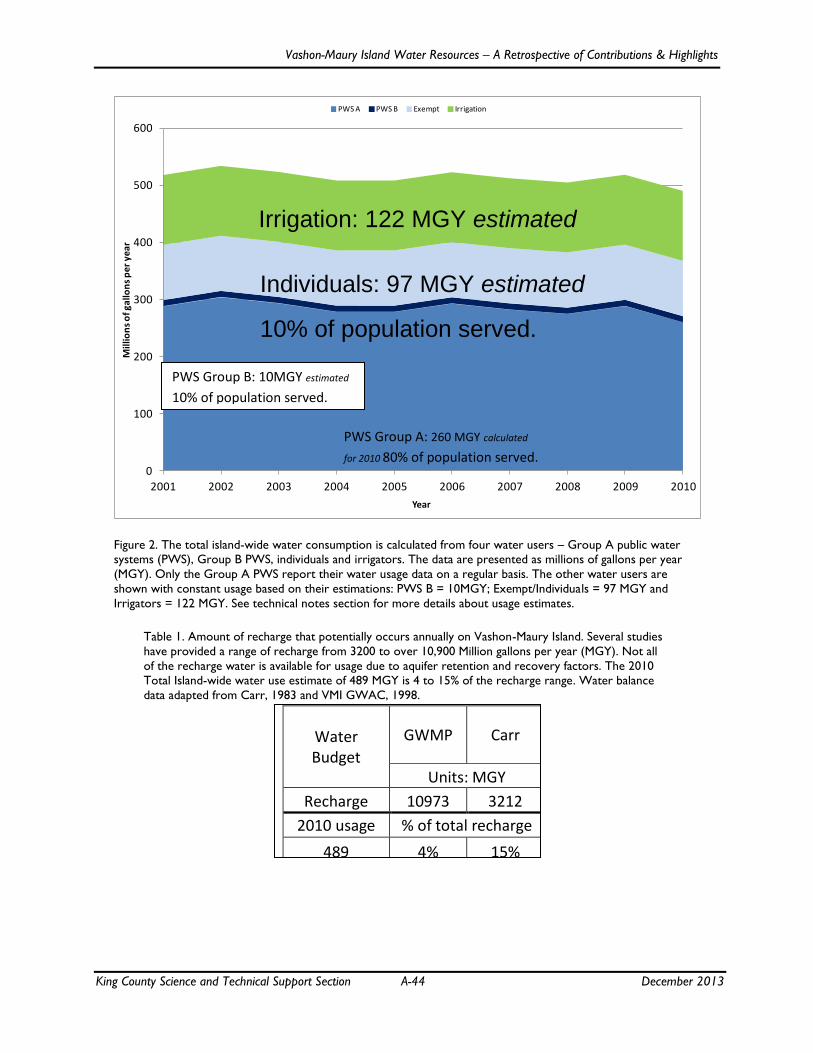
Vashon-Maury Island Water Resources – A Retrospective of Contributions & Highlights
King County Science and Technical Support Section A-44 December 2013
Figure 2. The total island-wide water consumption is calculated from four water users – Group A public water
systems (PWS), Group B PWS, individuals and irrigators. The data are presented as millions of gallons per year
(MGY). Only the Group A PWS report their water usage data on a regular basis. The other water users are
shown with constant usage based on their estimations: PWS B = 10MGY; Exempt/Individuals = 97 MGY and
Irrigators = 122 MGY. See technical notes section for more details about usage estimates.
Table 1. Amount of recharge that potentially occurs annually on Vashon-Maury Island. Several studies
have provided a range of recharge from 3200 to over 10,900 Million gallons per year (MGY). Not all
of the recharge water is available for usage due to aquifer retention and recovery factors. The 2010
Total Island-wide water use estimate of 489 MGY is 4 to 15% of the recharge range. Water balance
data adapted from Carr, 1983 and VMI GWAC, 1998.
0
100
200
300
400
500
600
2001 2002 2003 2004 2005 2006 2007 2008 2009 2010
Mill
ion
s o
f gal
lon
s p
er y
ear
Year
PWS A PWS B Exempt Irrigation
Water Budget
GWMP Carr
Units: MGY
Recharge 10973 3212
2010 usage % of total recharge
489 4% 15%
PWS Group A: 260 MGY calculated
for 2010 80% of population served.
PWS Group B: 10MGY estimated
10% of population served.
Individuals: 97 MGY estimated
10% of population served.
Irrigation: 122 MGY estimated

Vashon-Maury Island Water Resources – A Retrospective of Contributions & Highlights
King County Science and Technical Support Section A-45 December 2013
10. Per Capita Water Consumption
Target: Per Capita water usage is tracked year to year
About this indicator: Per capita water consumption is calculated from the total island wide water consumption
divided by population. This indicator reports data from three types of water users Group A public water system (PWS)
users, Group B PWS users and individuals.
Influencing factors: Weather conditions - amount of precipitation and average daily temperature for a given year.
Limited water usage data available because not all water users report their usage.
2010 Target: Per capita water usage is calculated per year
2010 Finding: 2010 per capita water usage ~ 80 gallons per day
2010 Status: 2010 Per capita water use of 80 gallons per day is based on an average of the two largest group A PWS
per capita data (70 and 90), Table 1.
Table 1. 2010 Per Capita Data shown as gallons per day based on the
two largest Group A public water systems on Vashon-Maury Island.
NOTE*: both systems have non-residential connections and residential
equivalence units are shown – average population per connection is 2.3.
GPD: gallons per day.
2001-2010 Target: No long term (10 or more years) increase in per capita water consumption.
2001-2010 Assessment: Per capita usage – 83 GPD from 2001-2010
2001-2010 Status: Per capita water consumption is estimated to be 83 gallons per person per day
from 2001 to 2010. The per capita data is estimated from the total usage divided by the population served to provide a
per person usage value. Selected per capita usage data are shown in Figure 1.
Technical Notes Per Capita Water Consumption
Data source: The data for this indicator comes from Group A public water systems (PWS), Group B PWS, and
individual water users. Group B PWS are not required to report their usage and individual wells do not typically have
meters to assess their usage. Both of these user groups have a small subset that do report their usage. However, this
subset of users and their usage data are not totally representative of the entire user group.
2010 Data
User Group A PWS
- H Group A PWS
- 19
Total - Gallons 46,578,890 107,138,197
Population served 1,830 2,641
Residential usage per connection - GPD 160 208
Per Capita - GPD* 70 90
Averaged Per Capita - gallons per day (GPD)
80

Vashon-Maury Island Water Resources – A Retrospective of Contributions & Highlights
King County Science and Technical Support Section A-46 December 2013
Collection frequency: Group A PWS are required to keep track of their water usage. Recent changes require more
Group A PWS to report their usage annually. The other water users are not required to report their usage. Water use
data has been requested from a variety of users.
Methods for analysis: Total Annual water consumption is divided into a daily measure. This daily usage is divided by
the number of people per household (2.3 – 2010 US Census data). For PWS with data, the total water use is divided by
the number of connections. This usage per connection is divided by the population per connection value. This population
per connection is a calculation of reported population served divided by the number of connections. The range of per
capita usage for Group A PWS is 45 to 140 gallons per person per day with the average being 83 gallons per person per
day. Eight individual well owners have installed a meter and reported usage data. This subset of users has a range of per
capita from 40 to 150 gallons per person per day from annual usage totals with the average being 100 gallons per person
per day.
Data Reliability and Quality: The data quality of this indicator can be good when reported from purveyors.
Estimates are based on a small subset of data users and compared to other published data. The reliability is fair based in
the recent participation and should improve due to changes in reporting requirements for most Group A PWS.
Data Reference: VMI Water Purveyors; US Census Data – 2010; various King County program including
Groundwater, UTRC; and VMI Volunteer Monitoring Program who self report usage.
Figure 1. Example of per capita water usage by user type – Group A Public Water System (PWS); Group B PWS and
individuals. One example of each type is shown to highlight annular variation. This data was calculated based on annual
total usage divided by the number of people per household and reported as a daily usage – gallons per person per day
(GPD). Rainfall for the North Vashon gauge also shown as inches/year. Data collection of usage for selected Group B
PWS and individual well users began in 2007 and 2008, respectively.

Vashon-Maury Island Water Resources – A Retrospective of Contributions & Highlights
King County Science and Technical Support Section A-47 December 2013
11. Summer Water Use Peaking Factor
Target: Peaking factor is tracked year to year
About this indicator: Summer water use peaking factor is calculated from the maximum consumption divided by
average usage. This indicator reports data from three types of water users Group A public water system (PWS) users,
Group B PWS users and individuals.
Influencing factors: Weather conditions during the summer time - amount of precipitation for a given year and/or the
average daily temperature. Limited water usage data available.
2010 Target: Summer water use peaking factor is tracked year to year.
2010 Finding: Water use peaks in the summer by a factor 1.8 based on an island-
wide average.
2010 Status: Summer water use peaking factors range from 1.2 to 2.4 based on data from selected Group A public
water systems. The average of the 2010 data is 1.8. No assessment is done annually.
Figure 1. Average water use of individuals with monthly rainfall totals for the North Vashon rain gauge (43U).
Rainfall data are average monthly totals from water years 2004-2010. Water usage is averaged gallons per day
(GPD) by month from individuals who participate in self monitoring/metering volunteer program. This usage
data is from 2007 to 2010. Maximum usage typically occurs in August with a peaking factor of 3.2 for all users.
On average, two-thirds of the total annual usage is consumed during May thru October period while July thru
September can be over 40% of the total annual usage.
0
1
2
3
4
5
6
7
8
9
10
0
50
100
150
200
250
300
350
400
450
500
Jan Feb Mar Apr May Jun Jul Aug Sep Oct Nov Dec
Rai
nfa
ll t
ota
l (in
)
Gal
lon
s p
er
day
Average Rainfall (in) Average GPD

Vashon-Maury Island Water Resources – A Retrospective of Contributions & Highlights
King County Science and Technical Support Section A-48 December 2013
2001-2010 Target: No long term (10 or more years) increase in summer water use peaking factor.
2001-2010 Assessment: Summer water use peaking factors range from
1.2 to 4.4 based on 2001 – 2010 data from selected Group A public water
systems.
2001-2010 Status: Summer water use peaking factors range from 1.2 to 4.4 based on data from
selected Group A public water systems, Table 1. A Group B PWS and individuals who report their usage have similar
peaking factor. High peaking factor of ~8 can occur as noted by one individual user, Table 1. A range of calculated
peaking factor from different users are presented in Figure 2.
Table 1. Peaking Factors (2001 to 2010) from selected water users. Peaking factor is calculated annually from
the maximum monthly usage divided by an average monthly usage.
―*‖ = Data not reported
ND = No data collected for this year.
―—‖ = Data collect did not start until 2007.
Technical Notes Summer Water Use Peaking Factor
Data source: The data for this indicator comes from Group A public water systems (PWS), Group B PWS, and
individual water users. Group B PWS are not required to report their usage and individual wells do not typically have
meters to assess their usage. Both of these user groups have a small subset that do report their usage. However, this
subset of users and their usage data are not totally representative of the entire user group.
Collection frequency: Group A PWS are required to keep track of their water usage. Recent changes require more
Group A PWS to report their usage annually. The other water users are not required to report their usage. Water use
data has been requested from a variety of users.
Methods for analysis: For Group A systems with a published water system plan, the peaking factor is for that system is
reported. For users with monthly usage data, a peaking factor is calculated annually from the maximum monthly usage
divided by an average usage month. When multi-years of data are assessed, the annual peaking factor is averaged. The
range of peaking factors for Group A PWS is 1.2 to 4.4 based on data from 7 systems. Eight individual well owners have
installed a meter and reported usage data. One Group B PWS reports their usage on a regular basis.
Data Reliability and Quality: The data quality of this indicator can be good when data is provided by the island
purveyors. Estimates are based on a small subset of data users and compared to other published data. The reliability is
fair based in the recent participation and should improve due to changes in reporting requirements for most Group A
PWS.
Water User\Year 2001 2002 2003 2004 2005 2006 2007 2008 2009 2010
Grp A PWS - H 1.4 1.9 2.2 2.1 1.9 1.9 1.9 1.8 2.3 1.6
Grp A PWS -19 1.6 1.9 1.7 2.3 2.0 2.2 1.9 2.0 2.4 2.0
Grp A PWS -D * * * * * * * * * 1.8
Grp A PWS -NC * * 3.7 2.8 2.8 4.4 2.8 2.6 3.3 2.4
Grp A PWS -BP * * * * * * 1.9 2.0 1.6 1.2
Grp B PWS - BC * * * * * * 2.3 1.6 1.7 1.6
Individual A — 1.3 1.7 2.3 1.3
Individual B — 8.8 8.6 7.4 ND

Vashon-Maury Island Water Resources – A Retrospective of Contributions & Highlights
King County Science and Technical Support Section A-49 December 2013
Data Reference: VMI Water Purveyors; various King County programs including Groundwater, UTRC; and VMI
Volunteer Monitoring Program who self report usage.
Figure 2. Example of peaking factors by user type – Group A Public Water System (PWS); Group B PWS and
individuals. The peaking factor calculation is the maximum monthly usage divided by the average monthly usage.
Example data are from 2 Group A PWS (pf 1.7; pf 3.7), 1 Group B PWS (pf 2.3) and 2 individual well owners (pf
1.1; pf 8.1). The user with a PF 1.7 (not pf 8.1) uses the most water annually based on the cumulative total of
the daily usage.
0
100
200
300
400
500
600
700
800
900
Jan Feb Mar Apr May Jun Jul Aug Sep Oct Nov Dec
Mo
nth
ly U
sage
(GP
D)
PF 1.1 PF 1.7 PF 2.3 PF 3.7 PF 8.1

Vashon-Maury Island Water Resources – A Retrospective of Contributions & Highlights
King County Science and Technical Support Section A-50 December 2013
a.
b.
Figure 3 (a + b). Data from West Judd Creek – gauge site 28Y and one Group A public water system from 2007 to
2010. Figure 3a - Monthly maximum temperatures are shown for the summer period of June through September along
with total usage from a public water system shown on the second axis. Figure 3b - Monthly median temperatures along
with monthly total precipitation (second axis). Peaking occurs typically during July or August during periods of higher
temperatures and lower precipitation. Units are degrees Fahrenheit (deg F); inches (in); millions of gallons (Mgal).