vcm or ppm? a comparison of the performance of two
TRANSCRIPT

Journal of Public Economics 89 (2005) 1581–1592
www.elsevier.com/locate/econbase
VCM or PPM? A comparison of the performance of
two voluntary public goods mechanisms
Daniel Rondeaua, Gregory L. Poeb, William D. Schulzeb,*
aDepartment of Economics, University of Victoria, CanadabDepartment of Applied Economics and Management, Cornell University, United States
Received 6 May 2003; received in revised form 6 May 2004; accepted 3 June 2004
Available online 21 November 2004
Abstract
Little progress has been made toward understanding the relative performance of the two
mechanisms most widely used for fundraising: the Voluntary Contribution (VCM) and Provision
Point (PPM) mechanisms. This paper provides direct comparisons of the relative performance of
variants of the VCM and PPM as they are most commonly implemented in the field. The research
makes use of 1296 individual observations from 721 subjects, including 40 observations from a field
experiment. A meta-analysis of the determinants of contribution levels and bootstrap estimates of the
relative efficiency of the two mechanisms provide novel analyses of public goods experimental data.
Overall, the PPM is found to increase total contributions, to be more responsive to changes in induced
value, and to be generally more efficient than the VCM. For public goods with a benefit–cost ratio in
the interval [1, 1.4), however, the VCM captures a greater portion of available benefits than the PPM.
D 2004 Elsevier B.V. All rights reserved.
JEL classification: H41 public goods; C92 design of experiments, laboratory, group behavior; C93 design of
experiments, field experiments
Keywords: Voluntary public goods mechanisms; Provision point; VCM; PPM; Efficiency
1. Introduction
Economists have long sought to develop public goods contribution mechanisms that
overcome the free or cheap-rider problem (e.g. Clarke, 1971; Groves, 1973; Groves and
0047-2727/$ -
doi:10.1016/j.
* Correspon
E-mail add
see front matter D 2004 Elsevier B.V. All rights reserved.
jpubeco.2004.06.014
ding author. Fax: +1 607 255 9611.
ress: [email protected] (W.D. Schulze).

D. Rondeau et al. / Journal of Public Economics 89 (2005) 1581–15921582
Ledyard, 1977). While much insight has been gained from the development of incentive-
compatible mechanisms, these institutions are of little practical significance since they are
either too complex, require some form of coercive power, or rely on unanimity or iterative
group procedures. This makes them unsuitable for most field applications. Such barriers
led Laffont (1987) to conclude that bany real application will be made with methods which
are crude approximations [of incentive-compatible mechanisms]Q (p. 567).Fundraisers most often rely on the Voluntary Contributions Mechanism (VCM) or the
Provision Point Mechanism (PPM), neither of which is theoretically incentive compatible.
Although these mechanisms are widely used in the real world and have been extensively
studied in the laboratory, remarkably little is known about their relative performance.
This paper provides a direct large-scale cross-mechanism comparison of variants of the
VCM and PPM as they are implemented in real fund raising campaigns. The large dataset
and its collection method enable the use of meta-analysis and bootstrapping techniques.
With these methods, we econometrically analyze the determinants of contributions in the
VCM and PPM, and study their relative efficiency using 430,000 simulated public goods
with benefit–cost ratios ranging from 0.42 to 2.48. The paper concludes by reporting the
results of a within-subject experiment conducted in the field with both mechanisms.
2. Experimental design
The core of the analysis makes use of 1176 individual observations obtained from single
shot, no-feedback laboratory experiments. These experiments were set in an environment
deliberately chosen to mimic field conditions. They were conducted with large groups of
subjects who had heterogeneous induced values and incomplete information about both the
distribution of values and the exact number of individuals in their group.
Design choices were generally motivated by the pragmatic need to understand and
improve the application of public goods mechanisms in the field. Specifically the
experimental design was intended to closely correspond to the fieldwork of Champ et al.
(1997) in which a real VCM was implemented to fund the removal of abandoned roads that
continued to provide access to ecologically sensitive areas of Grand Canyon National Park.
The removal of all 215 miles of unwanted roads had an estimated total cost of US$142,000.
However, the project was presented to potential donors as a divisible good by stressing that
each US$1 donation would cover the cost of removing eight feet of road. No provisions were
made for spending donations in excess of removal costs and it was assumed that little or no
additional benefits would accrue to donors from contributions exceeding the total cost.1
1 Marks and Croson (1998) note that a similar effort to raise funds for a new baseball stadium in Seattle devoted
the surplus to the State’s general funds, making it impossible for contributors to assess the existence or value of
returns from excess contributions. We contend that there is a major class of public goods in the real world where
there are either institutional or physical reasons for a sudden drop in marginal utility: often fund drives are
centered on constructing a building of a specific size or purchasing an existing building; many VCMs use a
thermometer to measure how close the total contributions are to the stated goal which allows some discrete level
of activity to be reached which the organization argues is necessary or dire consequences will result; land trusts
usually try to fund specific purchases.

D. Rondeau et al. / Journal of Public Economics 89 (2005) 1581–1592 1583
Thus, if one assumes a constant level of individual benefits per unit of road removed, this
project corresponds to a standard VCM up to the total cost of the project, and no benefits
thereafter.
The VCM we implemented in the laboratory reflects these features of the Grand Canyon
campaign. Each individual received a constant positive individual return from the public
good, up to a maximum level. Beyond that point, the rate of return fell to zero. Subjects
were given an initial endowment (US$10, US$15, US$18 or US$20 depending on the
treatment) and asked to divide this sum between a private account and a group investment
fund. Subjects were told that they would receive an individual return (a number of cents) for
each of the first US$100 (or US$250 depending on treatment) deposited in the group
exchange. The threshold (US$100 or US$250) defines the point beyond which additional
contributions no longer increase benefits.2 This design provides a simple and transparent
way to induce both diminishing marginal utility for the public good and a maximum
willingness to pay, while making the threshold the socially optimal level of contributions.
The individual rates of return varied across subjects from 0.004 to 0.14. Subjects were
also told what their corresponding maximum personal payoff would be (US$1 to US$14)
in the event that total group contributions reached or exceeded the threshold. In the VCM,
contributions in excess of the threshold were not rebated and did not generate additional
benefits. As in the Grand Canyon and Seattle fund-raising campaigns (see Footnote 1), this
limit represents the cost of fully funding the public good. In this context, the maximum
individual benefits of US$1 to US$14 are the value to a subject of the fully funded project.
It is worth noting that in contrast with the laboratory VCM most commonly found in the
literature, the endowment level was always large enough to allow subjects to make
contributions that reflect their true value of the public good.
The general procedures and the relevant parameter values implemented in PPM
experiments were kept identical to those in the VCM in order to ensure comparability
across mechanisms. The provision point was set at either US$100 or US$250 to match the
maximum cost in VCM treatments. Subjects in PPM groups were presented with the same
task of dividing their endowment but were told that money in the group fund would yield a
personal payoff (between US$1 and US$14) only if the sum of contributions to the group
fund equals or exceeds the announced provision point. Failure to reach the threshold
resulted in a full refund of contributions, whereas contributions in excess of the threshold
were rebated to individual contributors in a manner proportional to the share of their initial
contribution into the group fund.3 The money back guarantee and proportional rebate
features were added to the PPM to suit the prior objective of providing an alternative to the
Champ et al. VCM that would be more effective in eliciting voluntary contributions in
field situations (we later implemented a similar PPM in a field experiment—see Rose et
al., 2002 and Poe et al., 2002).
2 The choice of threshold level is undoubtedly an important design variable in both public goods experiments
and in real fund raising. It is beyond the scope of the present paper to investigate this important question.3 In their comparison of alternative rebate rules for contributions in excess of the provision point, Marks and
Croson (1998) find no statistical difference between mean contributions in the Proportional Rebate and the No
Rebate treatments. Thus, we do not believe that the difference between our implementations of the PPM and
VCM significantly affects relative contributions levels.

D. Rondeau et al. / Journal of Public Economics 89 (2005) 1581–15921584
In all sessions and treatments, subjects had knowledge of their initial endowment and
that all subjects in their group had an equal endowment. They also knew their own
potential private payoff from the public good, but they were only told that others in their
group may have different payoff amounts. This feature once again mimics field conditions
where individuals value public goods differently but are generally unaware of others’
values (Alston and Nowell, 1996). Finally, subjects were only informed that they were part
of a blarge groupQ and that the actual group size used for earnings calculations would be
revealed at the end of the experiment.
In summary, the VCM provides a constant individual rate of return up to a maximum
level of benefits corresponding to the total cost of the project, no marginal benefit
thereafter. No rebate of excess contributions is made. In the parallel PPM, the entire public
good is provided if total contributions equal or exceed the project’s total cost,
contributions are refunded if the threshold is not met, and a proportional rebate rule is
applied to excess contributions.
These mechanisms have advantages over the standard experimental design. In the most
commonly implemented VCM (Isaac et al., 1989, 1984, 1994), it is socially optimal for
subjects to contribute their entire endowment when the sum of individual rates of return
exceeds one. However, potential individual benefits from the public good exceed the
subjects’ initial endowment. As a result, contribution levels cannot be judged against the
total individual value of the public good. In the PPM with similar induced value structures,
past efficiency discussions have focused on the frequency at which the cost of the project
is exactly met (e.g., Bagnoli and McKee, 1991; Marks and Croson, 1998) or on the
proportion of times that the public good is provided (e.g., Cadsby and Maynes, 1998).4
Typically, such analyses can only been done on a small scale since one round of a public
goods experiment constitutes one data point.
By not constraining a subject’s contributions to be below his valuation of the public
good, it becomes possible to directly compare the relative efficiency of the PPM and VCM
on the basis of total benefit–cost ratios (BCRs). More importantly, because of the subject’s
ignorance of the group size and distribution of induced values in their group, groups of
various size and value composition can be simulated to provide an analysis of the
performance of the two mechanisms for a nearly continuous distribution of BCRs,
including for goods that should not be provided because their BCR is less than one.
Four experimental sessions were conducted with a total of 621 subjects. In each
session, two or more treatments were conducted at the end of regular introductory
economics lectures with students agreeing to participate voluntarily. In three of the
sessions, individual students were randomly assigned to either a PPM or VCM treatment
and participated in a single-shot application of the mechanism. Each student read
instructions in silence. Aspects common to all treatments were verbally summarized and
subjects were given the opportunity to ask questions in private. In the fourth session,
4 Many of the existing PPM experiments reported in the literature (e.g., Rapoport and Suleiman (1993); Marks
and Crosson (1998); and, in particular, Asch et al. (1993), who finds no difference in the performances of the
PPM and VCM) provided subjects with endowments smaller than the individual return from the group project.
Once again, this prevents subjects from making demand revealing contributions. Correspondingly, the social
optimum is for subjects to give their entire endowments (if the total benefit-cost ratio exceeds 1).
D. Rondeau et al. / Journal of Public Economics 89 (2005) 1581–1592 1585
identical procedures were followed with the exception that all subjects participated in
four treatments without feedback. Each subject was presented with two PPM and two
VCM situations. An individual’s rate of return from the public good was identical across
mechanisms but changed between their first and second applications. In this experiment,
subjects were given the information about all four situations, given the opportunity to ask
questions in private, and then asked to record all four decisions. After the experiment was
completed, a draw determined which of the four treatments generated monetary
earnings.5
3. Aggregate contribution levels and demand revelation
Table A1 on the Journal’s webpage shows that the percentage of demand revelation
(total contributions divided by total induced value) across experimental sessions varies
from 63.9% to 135.3% for the PPM, and 41.2% to 80.7% for the VCM. An alternative
central measure of the mechanisms’ performance is the median of the subject’s bid/value
ratio. This statistic ranges from 0.60 to 1.00 for the PPM and from 0.29 to 0.43 for the
VCM. Formally testing the difference in these statistics reveals that the PPM stochastically
and statistically dominates the corresponding values in parallel VCM experiments.6
Hence, the fraction of induced value contributed to the public good is consistently higher
in the PPM.
To explore factors affecting contribution levels under the PPM and VCM, a meta-
analysis is employed in which the mean and median contribution level for each induced
value in each experiment is treated as the dependent variable. While the mean is consistent
with Kaldor–Hicks aggregation, the median is more robust to outliers (e.g., contributions
equal to endowment). The contributions of all subjects who had the same induced value in
the same experimental treatment were grouped, serving as an observation point. For each
of the resulting 62 groups we computed the mean and median contribution levels, which
were then separately regressed on the induced value of subjects (Vi), whether the treatment
was a PPM (D(PPM)=1) or VCM (D(PPM)=0), a slope interaction variable
(Vi*(D(PPM)), the endowment level (x), and the threshold (TC) defining the maximum
cost of the public good or provision point. Pooling the data across mechanisms was
necessary because of the small sample size.
5 Experiments were conducted by a faculty member and his assistants in large lecture halls (with up to 220
students), none of whom had prior or further contacts with the students except for the payment of earnings after
the next lecture. It was emphasized that the experiment was performed for research purposes only. The regular
instructor was not involved. Treatments were bpre-setQ in groups of 40 for the purpose of calculating earnings but
students had no knowledge of this. With up to six groups per class, individuals were randomly assigned to a
treatment and an induced value. Instructions are available on the Journal’s website.6 Paired t-tests and the Wilcoxon Matched-Pairs Signed Rank Test both indicate that the experimental
distribution of the percentage of demand revealed (t=8.29, p=0.000, n=8; z=2.52, p=0.012, n=8) and the median
bid/value ratio (t=8.68, p=0.000, n=8; z=2.52, p=0.012, n=8) for the VCM and PPM are significantly different.
Poe et al. (2002) further demonstrate that individual demand revelation is enhanced and free-riding is reduced in
the PPM.

D. Rondeau et al. / Journal of Public Economics 89 (2005) 1581–15921586
Table 1 reports six equations estimated by (frequency) weighted least squares with
standard errors derived using the Huber–White consistent covariance estimator to account
for heteroskedasticity across groups. The first (last) three columns of coefficients in this table
pertain to regressions on the mean (median) contribution. In the blongQ regressions, theaforementioned design variables are all included as potential determinants of contribution
levels. We first note that the coefficients on the amount of endowment and the threshold
levels are not significantly different from zero for either the mean or the median contribution.
bShort (1)Q regressions therefore excluded these covariates. As the coefficient on D(PPM)
was not significant in any of these regressions, the list of covariates was further shortened in
the bShort (2)Qmodel, to simply a constant, a slope variable for VCM, and a slope shifter for
the PPM. The results from this regression are graphically depicted in Fig. 1 for the mean
contributions rates along with the individual data points used in the meta-analysis. Fig. A1
on the Journal’s webpage provides a similar graph for median contributions.
In both the mean and median regressions, our empirical results indicate that contribution
levels are positive and significantly different from zero even at very low induced values for
both the VCM and the PPM. Furthermore, the constant terms for the PPM and VCM are not
statistically different from each other. Thus, comparable levels of bover contributingQ bylow induced value subjects can be expected with both mechanisms. In related work it has
been shown that such over contributions at low induced values are attributed to a
combination of other-regarding behavior and errors (Ferraro et al., 2003).
Second, the analysis reveals that mean and median contribution levels are more
responsive to changes in induced values in the PPM than in the VCM. While all four slopes
are significantly greater than zero, the slope of the PPM is significantly different, and
substantially steeper, than that of the VCM response function. Yet, neither approaches
Table 1
Analysis of mean and median bids across induced value (TVI), mechanism (VCM v. PPM), endowment (x), and
total cost (TC)
Mean (S.D.)
[range]
Means Medians
Long
(S.E.)
Short 1
(S.E.)
Short 2
(S.E.)
Long
(S.E.)
Short 1
(S.E.)
Short 2
(S.E.)
Constant 2.52
(1.38)
2.12**
(0.50)
2.51**
(0.45)
2.48*
(0.99)
0.22
(0.21)
0.75*
(0.33)
Vi 7.45 (4.25)
[1–14]
0.22**
(0.05)
0.21**
(0.05)
0.17**
(0.04)
0.32**
(0.02)
0.30**
(0.02)
0.24**
(0.03)
D(PPM) 0.50 (0.50)
[0,1]
0.76
(0.85)
0.74
(0.89)
1.00
(0.51)
1.00
(0.65)
Vi*D(PPM) 3.73 (4.81)
[0–14]
0.19*
(0.08)
0.20*
(0.08)
0.27**
(0.04)
0.27**
(0.04)
0.28**
(0.05)
0.38**
(0.03)
x 18.23 (2.54)
[10–20]
0.04
(0.07)
�0.06
(0.07)
TC 220.97 (59.75)
[100–250]
�0.01
(0.00)
�0.01
(0.00)
N 62 62 62 62 62 62
R2 0.67 0.67 0.66 0.80 0.78 0.78
* and ** mean significance at the 5% and 1% levels, respectively. Observations weighted by corresponding group
size. Standard errors are Huber–White consistent as described in text.

Fig. 1. Mean bids and estimated Huber consistent, weighted response across induced values PPM and VCM.
D. Rondeau et al. / Journal of Public Economics 89 (2005) 1581–1592 1587
perfect demand revelation at the margin (as a slope coefficient equal to one would indicate).
Using the Short (2) model, the slope, or marginal contributions rate, of the VCM for the
means (medians) is 0.17 (0.24) while the slope of the PPM is 0.44 (0.62).
As indicated in Fig. 1 (and Fig. A1 on the Journal’s web page) the combined effects of
observing positive intercepts and marginal contribution rates smaller than one are that
individuals over contribute at low induced values and under contribute at high induced
values. In general, therefore, it cannot be said that either mechanism generates empirical
contribution levels that approximate demand revelation.7
4. Relative efficiency of the VCM and PPM
4.1. A tournament
We now explore the relative efficiency of the VCM and PPM. Underlying this analysis
are 540 PPM and 504 VCM observations from treatments with a threshold of US$250, and
covering induced values ranging from US$1 to US$14.8 Two key features of the data
7 This result sheds additional light on the earlier findings of Rondeau et al. (1999). The predicted PPM
contributions intersects the 458 line (total contributions=total induced value, implying aggregate demand
revelation) at US$1.99 for the medians and US$4.49 for the means. These two points of intersection bound the
range of mean induced values examined in Rondeau et al. The 1999 results are therefore consistent with the more
general new findings, however, it appears that the aggregate demand revelation previously observed was a special
case defined by the particular combination of induced values used.8 The analysis is limited to this subset of the data for consistency in the construction of simulated groups.

D. Rondeau et al. / Journal of Public Economics 89 (2005) 1581–15921588
collection allow bootstrapping estimates of the efficiency of the two mechanisms: (1)
subjects were not aware of the other individuals’ induced values; and (2) they did not
know the size of the group they were in. It is thus possible to randomly form groups to
analyze the efficiency of the mechanisms.
In theory, the PPM data could be combined in 3.599 E+162 different groups while the
VCM observations could form 5.237 E+151 different combinations. Since it is not
possible (nor desirable) to examine them all, they are systematically sampled to produce a
statistical measure of success rates and compare welfare gains in groups of size 24 to 66
inclusively. For groups of less (more) than 24 (66) observations the PPM is nearly
perfectly efficient. For each group size, five thousand PPM and five thousand VCM
groups where randomly formed in pairs using an algorithm designed to keep the number of
subjects and the distribution of induced values identical within the pair.9 The 215,000 pairs
that result can then be used to analyze the performance of the two mechanisms directly in
pair-wise comparisons or after aggregation.
The total induced value of individual simulated groups ranges from US$104 to US$620
with mean and median values of US$339.68 and US$339.00, respectively. With a provision
point of US$250, the corresponding BCRs range from 0.416 to 2.48, with an average of
1.36. Contributions by PPM subjects averaged US$260.55 (76.7% of the average induced
value) while total VCM contributions averaged US$168.89 (49.1% of the average value of
the fully funded public good). In pair-wise comparisons of total contributions (where total
induced values are kept constant) the VCM generated higher contributions in 4082 of the
215,000 pairs (1.9% of the time).
4.2. Efficiency as successes and failures
Fig. 2 is a scatter plot of a representative sub-sample of the normalized tournament data.
The horizontal axis shows the BCR of the public good, obtained by dividing the total
induced values of a group by US$250. The vertical axis tracks total contributions by PPM
and VCM groups, also normalized by dividing each observation by US$250. Quadrants A
and C correspond to socially undesirable public goods with a BCRb1. For efficiency, these
should not be funded. Of the 215,000 PPM groups, only 265 lie in quadrant A where the
public goods are funded but result in a net loss. In contrast, none of the VCM observations
fall into this category, an encouraging result. The discouraging counterpart is, however,
that 48,573 VCM observations are in quadrant C, resulting in the partial but inefficient
funding of public goods. In terms of outcome, this sharply contrasts with the 48,308 PPM
groups in quadrant C, which are 100% efficient as a result of the money back guarantee
(contributions are refunded, none of the bgoodQ is provided).Quadrants B and D correspond to socially desirable public goods. In B, 114,802 PPM
goods are fully funded and efficiently provided, while 14,754 VCM projects are just
funded or over funded. Almost one quarter of all PPM groups (51,625) fall in Quadrant D
and fail to provide beneficial public goods, whereas the VCM provides at least partial
welfare-improving funding in 151,673 instances.
9 The sampling algorithm is described in Appendix A on the Journal’s website.

Fig. 2. Normalized aggregate contributions by BCR.
D. Rondeau et al. / Journal of Public Economics 89 (2005) 1581–1592 1589
The PPM has an undeniably high failure rate. It either fails to provide desirable public
goods or funds undesirable ones 24% of the times (51,890 trials). However, further
analysis shows that (i) the PPM failure rate is highest when potential gains from the public
good are relatively small, and (ii) the risk of failure for socially desirable public goods
decreases with the BCR. For BCRs in the interval [1, 1.05) the PPM fails 96.0% of the
time. This failure rate decreases to 68.4% in the [1.2, 1.25) BCR range to 15.8% for goods
with BCRs between 1.45 and 1.5. The PPM only becomes fully efficient for goods with a
BCRN2 (Fig. A2 on the Journal’s website illustrates the failure rate by BCR for the entire
dataset).
4.3. Efficiency as welfare gains
Since most PPM failures are for desirable public goods with relatively low BCRs, the
net welfare losses stemming from the non-provision of these goods are disproportionately
small. Over all 215,000 draws, the PPM captured US$18.64 million in surplus, or 87.9%
of the total available (US$21.21 million). This is far superior to the US$10.21 million
(48.2% of available surplus) captured by the VCM. By this measure, the PPM is at least
87% efficient. This is a lower bound for the mechanism’s efficiency since the sampling
was restricted to group sizes where the PPM showed some level of failure after 5,000
draws. The absolute level of efficiency of the PPM should approach 100% since it
performs nearly perfectly for group sizes below 24 and above 66. In comparison, the
VCM can only be 100% efficient if contributions equal zero when the BCRb1, or if they

D. Rondeau et al. / Journal of Public Economics 89 (2005) 1581–15921590
exactly equal US$250 when the BCRz1. This latter outcome occurs only 25 times out of
all trials (there are no instances of zero contributions). Yet, in pair-wise comparisons, the
surplus captured by the VCM exceeds the PPM surplus in 51,217 cases (23.8% of the
time). Most of those cases arise from a failure of the PPM to fund marginally desirable
goods.
An alternative comparison of the relative performance of the two mechanisms is
obtained by tracking the mean of the pair-wise difference in surplus captured (PPM
surplus minus VCM surplus for matched pairs) broken down by BCR. For BCRsb1
(48,573 pairs) the provision point is rarely reached. Thus, welfare losses are avoided with
the PPM while the VCM always partially funds the goods at a net cost. This results in
losses per group that are on average US$15.67 smaller with the PPM than with the VCM
(US$0.07 vs. US$15.74). Similarly, for BCRsz1.4 (100,411 pairs), the PPM fully
implements a majority of projects while the VCM either fails to fully provide the goods or
funds them at a level greater than cost.10 On average, the surplus captured by the PPM
groups is US$82.84 greater than the net benefits of VCM groups (US$171.99 vs.
US$89.15).
Most interestingly, the VCM performs better than the PPM when the BCR ranges
between 1.0 and 1.4. In this range of marginally to reasonably desirable public goods,
the VCM consistently captures a fraction of the benefits available while PPM groups
often fail to reach the provision point. As a result, implementing a VCM for a project
with a BCR in the interval [1.0, 1.4) yields an expected surplus which is on average
US$9.84 greater per group than implementing a PPM (US$20.88 vs. US$30.72—
66,016 pairs). While this is noteworthy, the higher performance of the VCM in this
range is overwhelmed by the great advantage associated with employing a PPM outside
of it. Overall, the mean surplus captured by the PPM exceeds that of the VCM by
US$39.21 (US$86.72 vs. US$47.51). The detailed U-shaped graph plotting the mean
difference in surplus captured by BCR category is found in Fig. A3 on the Journal’s
website.
5. A synthetic field experiment and final remarks
For a glimpse into the relative efficacy of the PPM and VCM in field conditions,
two parallel mechanisms similar to those described above were utilized with the
Cornell Council (a select group of Alumni who provide support and advice to Cornell
University) in an attempt to fund an Undergraduate Award for Environmental
Research (to be awarded once to the best Honors Thesis covering any environmental
topic).
Each year, members of the council visit Ithaca, NY, to attend seminars and participate in
other activities on campus. At the beginning of a seminar on public goods and
10 Only 14,729 VCM groups exceed the threshold level of contributions, but typically by a small amount. The
overall efficiency of the VCM is only marginally increased if contributions in excess of the threshold are not
considered blostQ.
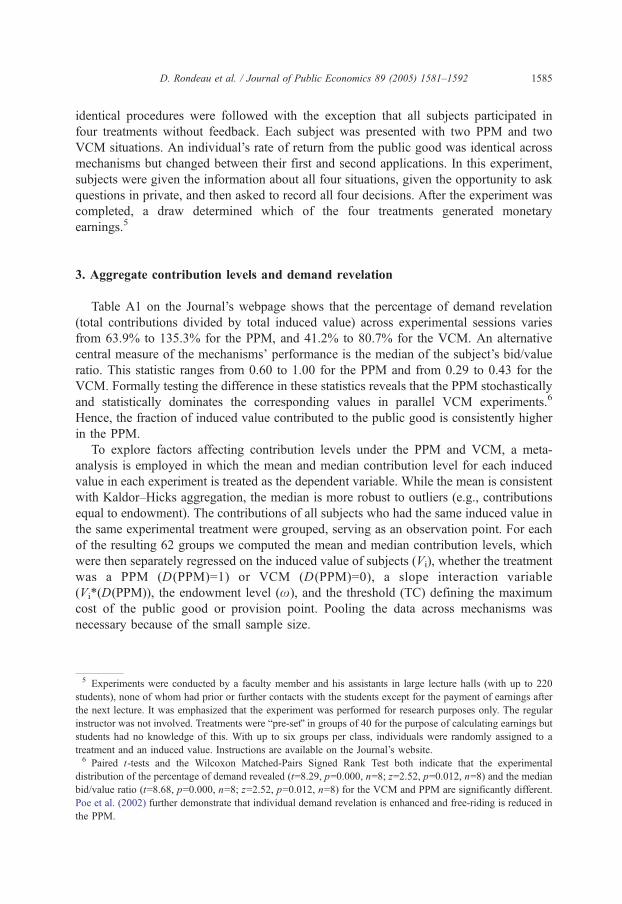
Fig. 3. Individual contributions in the PPM and VCM real field contributions (Cornell Council) vs. laboratory
experiment.
D. Rondeau et al. / Journal of Public Economics 89 (2005) 1581–1592 1591
environmental research, 20 members of the Cornell Council were asked to contribute some
of their own money to fund the award, the amount of which (US$1000) was decided by
the group prior to any commitment of funds. Each member of the Council was then invited
to commit to two possible contributions: the first contribution was under the rules of a
PPM, the second amount under a VCM.11 Council members were informed that only one
of the two commitments would be randomly selected and that it would be binding. Under
the VCM, the total amount collected would become the value of the award. Under the
terms of the PPM, an award of US$1000 would be made only if sufficient donations were
received. Both the money back guarantee and a proportional rebate of excess contributions
were explained.
Members contributed a total of US$751 under the VCM compared to US$941 under the
PPM—just short of the provision point. The VCM was implemented by the toss of a coin,
actual funds were collected from participants, and the Cornell Council awarded its
environmental award at the end of the 1999–2000 academic year. Fig. 3 compares the
revealed demand curves for the VCM and PPM in the Cornell Council field experiment
(left panel) with the results of a subsequent induced value laboratory experiment
(right panel).
The laboratory experiment was designed to approximate the conditions of the
field test: both the provision point/threshold and the group size (40) were fully
known. The remarkable similarity between the two sets of demand curves suggests
that a substantial degree of parallelism may be present between the field and the
laboratory. If this is the case, the conclusion that the PPM is superior to the VCM
in the laboratory may well extend to the field. Previous success of the PPM in field
applications is cause for hope (Rose et al., 2002). However, non-profit organizations
are reluctant to use the PPM with money back guarantee, in part because of the risk
of failure to fund a cherished project. This tradeoff between higher contributions and
the risk of non-funding was starkly illustrated in both the laboratory and field
results.
11 These conditions differ from the previous experiments in that the total number of members in the groups was
known.

D. Rondeau et al. / Journal of Public Economics 89 (2005) 1581–15921592
Acknowledgements
This research was funded through NSF grant #SBR-9727375, The Kenneth Robinson
Chair in Applied Economics, and USDA-Hatch Funds (Cornell University). Financial
support from the Social Sciences and Humanities Research Council of Canada is also
acknowledged. We are indebted to Duane Chapman, William Rosen and Robert Frank for
granting us access to their students.
Appendix A
Supplementary data associated with this article can be found, in the online version, at
doi:10.1016/j.jpubeco.2004.06.014
References
Alston, R.M., Nowell, C., 1996. Implementing the voluntary contribution game: a field experiment. Journal of
Economic Behavior and Organization 31, 357–368.
Asch, P., Gigliotto, G.A., Polito, J.A., 1993. Free riding with discrete and continuous public goods: some
experimental evidence. Public Choice 77, 293–305.
Bagnoli, M., McKee, M., 1991. Voluntary contributions games: efficient private provision of public goods.
Economic Inquiry 29, 351–366.
Cadsby, C.B., Maynes, E., 1998. Gender and free riding in a threshold public goods game: experimental evidence.
Journal of Economic Behavior and Organization 34, 603–620.
Champ, P.A., Bishop, R.C., Brown, T.C., McCollum, D.W., 1997. Using donation mechanisms to value nonuse
benefits from public goods. Journal of Environmental Economics and Management 33 (2), 51–162.
Clarke, E.H., 1971. Multipart pricing of public goods. Public Choice 8, 19–33.
Ferraro, P., Rondeau, D., Poe, G.L., 2003. Detecting other-regarding behavior with virtual players. Journal of
Economic Behavior and Organization 51 (1), 99–109.
Groves, T., 1973. Incentives and teams. Econometrica 41, 617–631.
Groves, T., Ledyard, J., 1977. Optimal allocation of public goods: a solution to the dfree riderT problem.
Econometrica 45, 783–809.
Isaac, R.M., Walker, J., Thomas, S., 1984. Divergent evidence on free riding: an experimental examination of
possible explanations. Public Choice 43, 113–149.
Isaac, R.M., Schmidtz, D., Walker, J., 1989. The assurance problem in laboratory markets. Public Choice 62,
217–236.
Isaac, R.M., Walker, J., Williams, A., 1994. Group size and the voluntary provision of public goods: experimental
evidence using very large groups. Journal of Public Economics 54, 1–36.
Laffont, J.-J., 1987. Incentives and the allocation of public goods. In: Auerbach, A.J., Feldstein, M. (Eds.),
Handbook of Public Economics. Elsevier.
Marks, M.B., Croson, R., 1998. Alternative rebate rules in the provision of a threshold public good: an
experimental investigation. Journal of Public Economics 67, 195–220.
Poe, G.L., Clark, J.E., Rondeau, D., Schulze, W.D., 2002. Provision point mechanisms and field validity tests of
contingent valuation. Environmental and Research Economics 23, 105–131.
Rapoport, A., Suleiman, R., 1993. Incremental contribution in step-level public goods games with asymmetric
players. Organizational Behavior and Human Decision Processes 44, 325–344.
Rondeau, D., Schulze, W.D., Poe, G.L., 1999. Voluntary revelation of the demand for public goods using a
provision point mechanism. Journal of Public Economics 72, 455–470.
Rose, S.K., Clark, J., Poe, G.L., Rondeau, D., Schulze, W.D., 2002. The private provision of public goods: test of a
provision point mechanism for funding green power programs. Resource and Energy Economics 24, 131–155.