vdsl2 performance test plan - broadband-forum.org · 01.11.2009 · vdsl2 performance test plan...
TRANSCRIPT

TECHNICAL REPORT
© The Broadband Forum. All rights reserved.
TR-114VDSL2 Performance Test Plan
Issue: 1Issue Date: November 2009

VDSL2 Performance Test Plan TR-114 Issue 1
November 2009 © The Broadband Forum. All rights reserved. 2 of 144
Notice
The Broadband Forum is a non-profit corporation organized to create guidelines for broadband network system development and deployment. This Broadband Forum Technical Report has been approved by members of the Forum. This Broadband Forum Technical Report is not binding on the Broadband Forum, any of its members, or any developer or service provider. This Broadband Forum Technical Report is subject to change, but only with approval of members of the Forum. This Technical Report is copyrighted by the Broadband Forum, and all rights are reserved. Portions of this Technical Report may be copyrighted by Broadband Forum members.
This Broadband Forum Technical Report is provided AS IS, WITH ALL FAULTS. ANY PERSON HOLDING A COPYRIGHT IN THIS BROADBAND FORUM TECHNICALREPORT, OR ANY PORTION THEREOF, DISCLAIMS TO THE FULLEST EXTENT PERMITTED BY LAW ANY REPRESENTATION OR WARRANTY, EXPRESS OR IMPLIED, INCLUDING, BUT NOT LIMITED TO, ANY WARRANTY:
(A) OF ACCURACY, COMPLETENESS, MERCHANTABILITY, FITNESS FOR A PARTICULAR PURPOSE, NON-INFRINGEMENT, OR TITLE;
(B) THAT THE CONTENTS OF THIS BROADBAND FORUM TECHNICAL REPORT ARE SUITABLE FOR ANY PURPOSE, EVEN IF THAT PURPOSE IS KNOWN TO THE COPYRIGHT HOLDER;
(C) THAT THE IMPLEMENTATION OF THE CONTENTS OF THE TECHNICAL REPORT WILL NOT INFRINGE ANY THIRD PARTY PATENTS, COPYRIGHTS, TRADEMARKS OR OTHER RIGHTS.
By using this Broadband Forum Technical Report, users acknowledge that implementation may require licenses to patents. The Broadband Forum encourages but does not require its members to identify such patents. For a list of declarations made by Broadband Forum member companies, please see http://www.broadband-forum.org. No assurance is given that licenses to patents necessary to implement this Technical Report will be available for license at all or on reasonable and non-discriminatory terms.
ANY PERSON HOLDING A COPYRIGHT IN THIS BROADBAND FORUM TECHNICAL REPORT, OR ANY PORTION THEREOF, DISCLAIMS TO THE FULLEST EXTENT PERMITTED BY LAW (A) ANY LIABILITY (INCLUDING DIRECT, INDIRECT, SPECIAL, OR CONSEQUENTIAL DAMAGES UNDER ANY LEGAL THEORY) ARISING FROM ORRELATED TO THE USE OF OR RELIANCE UPON THIS TECHNICAL REPORT; AND (B) ANY OBLIGATION TO UPDATE OR CORRECT THIS TECHNICAL REPORT.
Broadband Forum Technical Reports may be copied, downloaded, stored on a server or otherwise re-distributed in their entirety only, and may not be modified without the advance written permission of the Broadband Forum.
The text of this notice must be included in all copies of this Broadband Forum Technical Report.

VDSL2 Performance Test Plan TR-114 Issue 1
November 2009 © The Broadband Forum. All rights reserved. 3 of 144
Issue History
Issue Number Issue Date Issue Editor Changes1 November 2009 Arlynn Wilson, ADTRAN Original
Comments or questions about this Broadband Forum Technical Report should be directed [email protected].
Editor: Arlynn Wilson ADTRAN
Testing and Interoperability WG Chair:
Les Brown Lantiq
VDSL2 Performance Test Plan TR-114 Issue 1
November 2009 © The Broadband Forum. All rights reserved. 4 of 144
Table of Contents
1 PURPOSE AND SCOPE .................................................................................................................................13
1.1 PURPOSE....................................................................................................................................................131.2 SCOPE........................................................................................................................................................13
2 REFERENCES AND TERMINOLOGY .......................................................................................................14
2.1 CONVENTIONS...........................................................................................................................................142.2 REFERENCES .............................................................................................................................................142.3 DEFINITIONS..............................................................................................................................................152.4 ABBREVIATIONS........................................................................................................................................15
3 TECHNICAL REPORT IMPACT.................................................................................................................17
3.1 ENERGY EFFICIENCY.................................................................................................................................173.2 IPV6 ..........................................................................................................................................................173.3 SECURITY ..................................................................................................................................................17
4 COMMON TEST INFORMATION ..............................................................................................................18
4.1 COMPLIANCE REQUIREMENTS...................................................................................................................18
5 EQUIPMENT FEATURES.............................................................................................................................19
5.1 EUT INFORMATION...................................................................................................................................195.2 TEMPERATURE AND HUMIDITY .................................................................................................................205.3 TEST EQUIPMENT CALIBRATION ...............................................................................................................20
6 TESTING ENVIRONMENTS........................................................................................................................20
6.1 TEST CONFIGURATIONS.............................................................................................................................216.2 SYSTEM UNDER TEST SETTINGS................................................................................................................236.3 TEST SETUP...............................................................................................................................................28
7 TEST EQUIPMENT REQUIREMENTS AND CALIBRATION ...............................................................33
7.1 ACCURACY OF LOOP SIMULATORS AND NOISE SOURCES............................................................................33
8 PHYSICAL LAYER TEST CASES ...............................................................................................................42
8.1 VERIFICATION OF CRC ERROR REPORTING CPE .......................................................................................428.2 MARGIN VERIFICATION TEST....................................................................................................................438.3 ERASURE DECODING TESTS (OPTIONAL) ....................................................................................................468.4 VERIFICATION OF DOWNSTREAM FINE GAINS ............................................................................................508.5 MIXED LOOP IMPEDANCE TESTING ...........................................................................................................51
9 HIGHER LAYER TEST CASES ...................................................................................................................52
9.1 PTM THROUGHPUT TEST ..........................................................................................................................52
A ANNEX A PHYSICAL LAYER TEST CASES FOR G.993.2 REGION A (NORTH AMERICA) .........54
A.1 ANNEX A SPECIFIC TEST SETUP INFORMATION ..........................................................................................54A.1.1 VDSL2 SELF-NEXT AND FEXT ...............................................................................................................54A.1.2 ADSL2PLUS NEXT AND FEXT ................................................................................................................55A.1.3 ANNEX A NOISE........................................................................................................................................55A.1.4 PASS/FAIL CRITERIA FOR ANNEX A TESTING............................................................................................57A.1.5 TEST CASES FOR CRC ERROR REPORTING VERIFICATION TEST ..................................................................58A.1.6 TEST CASES FOR CPE MARGIN VERIFICATION TEST ..................................................................................59A.2 PERFORMANCE TESTS FOR BAND-PROFILE AA8D .....................................................................................61A.2.1 RATE ADAPTIVE TESTS WITH STRAIGHT LOOPS..........................................................................................61A.2.2 RATE ADAPTIVE TESTS WITH BRIDGED TAP LOOPS.....................................................................................63A.2.3 FIXED RATE TESTS WITH STRAIGHT LOOPS ................................................................................................63
VDSL2 Performance Test Plan TR-114 Issue 1
November 2009 © The Broadband Forum. All rights reserved. 5 of 144
A.3 REIN TESTING FOR AA8D ........................................................................................................................64A.4 LONG TERM STABILITY TESTING FOR AA8D.............................................................................................66A.4.1 LONG TERM STABILITY TEST....................................................................................................................66A.5 FLUCTUATING NOISE TESTING ..................................................................................................................66
B ANNEX B PHYSICAL LAYER TEST CASES FOR G.993.2 REGION B (EUROPE) ............................68
B.1 ANNEX B-SPECIFIC TEST SETUP INFORMATION..........................................................................68
B.1.1 PASS/FAIL CRITERIA FOR ANNEX B TESTING...............................................................................68
B.1.2 NOISE IMPAIRMENTS ............................................................................................................................69
B.1.2.1 SETTINGS FOR NOISE GENERATOR G1, G2 AND G4 ................................................................70
B.2 RATE ADAPTIVE PERFORMANCE TESTS FOR BA8B....................................................................71
B.3 RATE ADAPTIVE PERFORMANCE TESTS FOR BA12A..................................................................72
B.4 RATE ADAPTIVE PERFORMANCE TESTS FOR BA17A..................................................................73
B.5 RATE ADAPTIVE PERFORMANCE TESTS FOR BB8B....................................................................74
B.6 RATE ADAPTIVE PERFORMANCE TESTS FOR BB12A..................................................................75
B.7 RATE ADAPTIVE PERFORMANCE TESTS FOR BB17A..................................................................76
B.8 RATE ADAPTIVE PERFORMANCE TESTS FOR BA17A WITH DPBO AND UPBO....................77
B.9 RATE ADAPTIVE PERFORMANCE TESTS FOR BB17A WITH DPBO AND UPBO....................80
B.10 RATE ADAPTIVE PERFORMANCE TESTS FOR BA8C WITH DPBO AND UPBO......................83
B.11 VDSL2OPOTS AND VDSL2OISDN TEST CASES FOR CRC ERROR REPORTINGVERIFICATION TEST ............................................................................................................................................85
B.12 VDSL2OPOTS AND VDSL2OISDN TEST CASES FOR DOWNSTREAM MARGIN VERIFICATION TEST ............................................................................................................................................87
B.13 VDSL2OPOTS AND VDSL2OISDN TEST CASES FOR UPSTREAM MARGIN VERIFICATION TEST (OPTIONAL) ..................................................................................................................................................89
B.14 REIN TESTING FOR BA8C .....................................................................................................................92
B.14.1 COMMON LINE SETTING VARIATIONS.......................................................................................92
B.14.2 REIN NOISE MODELS ........................................................................................................................93
B.14.3 REIN TESTING IN RATE ADAPTIVE MODE.................................................................................93
B.14.4 REIN TESTING IN FIXED RATE MODE .........................................................................................95
B.15 SINGLE HIGH IMPULSE NOISE (SHINE) TESTING FOR BA8C ....................................................97
B.15.1 COMMON LINE SETTING VARIATIONS.......................................................................................97

VDSL2 Performance Test Plan TR-114 Issue 1
November 2009 © The Broadband Forum. All rights reserved. 6 of 144
B.15.2 SHINE NOISE MODELS......................................................................................................................99
B.15.3 SHINE TESTING IN RATE ADAPTIVE MODE ..............................................................................99
B.16 COMBINED NOISE IMPAIRMENT FOR BA8C ................................................................................100
B.16.1 TYPE 1 COMBINED THREAT NOISE TEST INCLUDING HIGH LEVEL REIN....................100
B.16.2 TYPE 2 COMBINED THREAT NOISE TEST INCLUDING FLUCTUATING RFI...................102
B.16.3 COMMON SETTINGS FOR COMBINED THREAT NOISE TESTS...........................................104
B.16.3.1 PERFORMANCE TESTS WITH TYPE 1 COMBINED THREAT NOISE ..................................106
B.16.3.2 PERFORMANCE TESTS WITH TYPE 2 COMBINED THREAT NOISE ..................................107
B.17 PERFORMANCE TESTS WITH MIXED IMPEDANCE LOOP FOR BB8B WITH UPBO...........108
B.18 PERFORMANCE TESTS WITH MIXED IMPEDANCE LOOP FOR BB17A WITH D&UPBO...108
C ANNEX C PHYSICAL LAYER TEST CASES FOR G.993.2 REGION C (JAPAN) .............................109
C.1 ANNEX C-SPECIFIC TEST SETUP INFORMATION .......................................................................109
C.2 PERFORMANCE TESTS WITH AWGNR NOISE IMPAIRMENT..................................................111
C.2.1 PERFORMANCE TESTS FOR CG8D – DOWNSTREAM .................................................................111
C.2.2 PERFORMANCE TESTS FOR CG12A - DOWNSTREAM................................................................111
C.2.3 PERFORMANCE TESTS FOR CG17A - DOWNSTREAM................................................................112
C.2.4 PERFORMANCE TESTS FOR CG30A – DOWNSTREAM ...............................................................113
C.3 PERFORMANCE TESTS WITH AWGNC NOISE IMPAIRMENT..................................................114
C.3.1 PERFORMANCE TESTS FOR CG8D – UPSTREAM.........................................................................114
C.3.2 PERFORMANCE TESTS FOR CG12A - UPSTREAM .......................................................................114
C.3.3 PERFORMANCE TESTS FOR CG17A – UPSTREAM.......................................................................115
C.3.4 PERFORMANCE TESTS FOR CG30A – UPSTREAM.......................................................................116
C.4 PERFORMANCE TESTS WITH (XTR+AWGNR) NOISE IMPAIRMENT.....................................118
C.4.1 PERFORMANCE TESTS FOR CG8D - DOWNSTREAM..................................................................118
C.4.2 PERFORMANCE TESTS FOR CG12A - DOWNSTREAM................................................................118
C.4.3 PERFORMANCE TESTS FOR CG17A - DOWNSTREAM................................................................119
C.4.4 PERFORMANCE TESTS FOR CG30A - DOWNSTREAM................................................................120
C.5 PERFORMANCE TESTS WITH (XTC+AWGNC) NOISE IMPAIRMENT.....................................122

VDSL2 Performance Test Plan TR-114 Issue 1
November 2009 © The Broadband Forum. All rights reserved. 7 of 144
C.5.1 PERFORMANCE TESTS FOR CG8D - UPSTREAM .........................................................................122
C.5.2 PERFORMANCE TESTS FOR CG12A - UPSTREAM .......................................................................122
C.5.3 PERFORMANCE TESTS FOR CG17A - UPSTREAM .......................................................................123
C.5.4 PERFORMANCE TESTS FOR CG30A - UPSTREAM .......................................................................124
D ANNEX D ALIEN NOISE DISTURBERS FOR ANNEX A & ANNEX B TESTING ............................126
D.1 PSD PROFILES FOR MD_EX SCENARIO..........................................................................................126
D.2 PSD PROFILES FOR MD_CAB27 SCENARIO ...................................................................................126
D.3 NOISE SOURCES FOR COMBINED NOISE TESTS .........................................................................127
D.3.1 REPETITIVE ELECTRICAL IMPULSE NOISE (REIN) MODEL ...................................................127
D.3.2 PROLONGED ELECTRICAL IMPULSE NOISE (PEIN) MODEL ..................................................128
D.3.3 REPEATABLE TEST PATTERN DEFINITION – (PEIN)..................................................................129
D.3.4 FLUCTUATING CROSSTALK MODEL..............................................................................................129
D.3.5 REPEATABLE TEST PATTERN DEFINITION – (FLUCTUATING CROSSTALK) ....................130
D.3.6 FLUCTUATING BROADBAND RFI MODEL.....................................................................................131
D.3.7 SYNCHRONIZATION OF THE MULTIPLE NOISE MODELS .......................................................136
APPENDIX A AMATEUR RADIO BANDS (INFORMATIVE)................................................................137
APPENDIX B INSIDE WIRING TOPOLOGIES (INFORMATIVE).......................................................138
APPENDIX C SUMMARY OF PROFILE AND LINE COMBINATIONS (INFORMATIVE) .............141
APPENDIX D CROSSTALK IMPAIRMENT FOR AA8D PERFORMANCE TESTING (INFORMATIVE) 143

VDSL2 Performance Test Plan TR-114 Issue 1
November 2009 © The Broadband Forum. All rights reserved. 8 of 144
List of Figures
Figure 1: Test configuration for Annex A testing over POTS...................................................... 21Figure 2: Test setup for configurations using data layer............................................................... 21Figure 3: Test configuration for Annex B over ISDN and Annex C over TCM-ISDN testing.... 22Figure 4: North American bridged tap topology........................................................................... 29Figure 5: Example of creation of fluctuating noise .................................................................... 132Figure 6:VDSL2 inside wire configuration 1 ............................................................................. 138Figure 7: VDSL2 inside wire configuration 2 (diplexer function and home data networking
functions MAY be integrated within CPE)......................................................................... 139Figure 8: VDSL2 inside wire configuration 3 (typical home without coax) .............................. 139Figure 9: VDSL2 inside wire configuration 4 (typical MDU without coax).............................. 140
List of Tables
Table 1: TR-114 requirements terminology ................................................................................. 14Table 2: TR-114 list of references ................................................................................................ 14Table 3: TR-114 definitions.......................................................................................................... 15Table 4: TR-114 abbreviations ..................................................................................................... 15Table 5: DSLAM information ...................................................................................................... 19Table 6: CPE information ............................................................................................................. 19Table 7: CO Splitter Information.................................................................................................. 20Table 8: CPE Splitter Information ................................................................................................ 20Table 9: Temperature and Humidity Range of Test Facility ........................................................ 20Table 10: Common Band Profiles................................................................................................. 23Table 11: List of common line settings for VDSL2 performance tests ........................................ 25Table 12: General line settings ..................................................................................................... 26Table 13: Specific line settings ..................................................................................................... 27Table 14: Concatenated common settings, testing combination description................................ 28Table 15: 26 AWG straight test loops for Annex A testing.......................................................... 29Table 16: VDSL2 transmit level for noise calculations................................................................ 30Table 17: ADSL2plus downstream transmit level for noise calculations..................................... 30Table 18: ADSL2plus upstream transmit level for noise calculations ......................................... 31Table 19: Noise models for Annex B testing................................................................................ 31Table 20: Loop calibration frequency boundaries for VDSL2 ..................................................... 34Table 21: Maximum attenuation for loop simulator calibration................................................... 34Table 22: Test procedure for verification of CRC error reporting................................................ 43Table 23: The equations for estimating BER................................................................................ 44Table 24: Test procedure for margin verification ......................................................................... 44Table 25: Erasure decoding test in FORCEINP=1 mode ............................................................. 47Table 26: Short loop erasure decoding test FORCEINP=1 mode ................................................ 48Table 27: Long loop erasure decoding test FORCEINP=1 mode................................................. 48Table 28: Erasure decoding test in FORCEINP=0 mode ............................................................. 49Table 29: Erasure Decoding Testing in FORCEINP=0 mode...................................................... 50Table 30: Verification of downstream gi settings......................................................................... 51Table 31: Packet throughput test bitrates...................................................................................... 52

VDSL2 Performance Test Plan TR-114 Issue 1
November 2009 © The Broadband Forum. All rights reserved. 9 of 144
Table 32: Packet Throughput Test............................................................................................... 52Table 33: Throughput Test Results: Connect Rates DS: 40.4 Mbps US: 5.7 Mbps.................. 53Table 34: Throughput Test Results: Connect Rates DS: 27 Mbps US: 2 Mbps.......................... 53Table 35: Annex A test configuration........................................................................................... 54Table 36: Upstream PBO settings for Annex A testing................................................................ 56Table 37: UPBOKL for straight 26 AWG loop testing ................................................................ 56Table 38: UPBOKL for 26 AWG with BT loop testing ............................................................... 57Table 39: Noise margin pass/fail requirements ............................................................................ 57Table 40: Pass/fail criteria for rate adaptive testing...................................................................... 58Table 41: CRC reporting tests for RA_I_096_056....................................................................... 59Table 42:CRC reporting tests for FX_I_027_002 ........................................................................ 59Table 43: Margin verification tests for RA_I_096_056 ............................................................... 59Table 44 Margin verification tests for FX_I_027_002 ................................................................. 60Table 45: Verification of downstream gains bi/gi settings ........................................................... 61Table 46: Profile-line combination AA8d_RA_I_096_056 ......................................................... 62Table 47: Profile-line combination AA8d_RA_I_096_056 ......................................................... 63Table 48: Profile-line combination AA8d_FX_I_027_002.......................................................... 64Table 49: Profile-line combination AA8d_FX_I_014_001.......................................................... 64Table 50: REIN testing for AA8d................................................................................................. 65Table 51: Long term stability test procedure ................................................................................ 66Table 52: Fluctuating noise test .................................................................................................... 67Table 53: Annex B test configurations ......................................................................................... 68Table 54: Noise margin pass/fail requirements ............................................................................ 69Table 55: Pass/fail criteria for rate adaptive testing..................................................................... 69Table 56: Power calculation of the XS profiles LT and NT......................................................... 71Table 57: Performance tests with BA8b_RA_F_150_150 ........................................................... 72Table 58: Performance tests with BA8b_RA_I_150_150. ........................................................... 72Table 59: Performance tests with BA12a_RA_F_150_150.......................................................... 73Table 60: Performance tests with BA12a_RA_I_150_150 .......................................................... 73Table 61: Performance tests with BA17a_RA_F_150_150.......................................................... 74Table 62: Performance tests with BA17a_RA_I_150_150 .......................................................... 74Table 63: Performance tests with BB8b_RA_F_150_150............................................................ 75Table 64: Performance tests with BB8b_RA_I_150_150 ............................................................ 75Table 65: Performance tests with BB12a_RA_F_150_150.......................................................... 76Table 66: Performance tests with BB12a_RA_I_150_150........................................................... 76Table 67: Performance tests with BB17a_RA_F_150_150.......................................................... 77Table 68: Performance tests with BB17a_RA_I_150_150........................................................... 77Table 69: Common Line Settings for BA17a_D&UPBO Band Profile ....................................... 77Table 70: Profile-line combinations for BA17a_D&UPBO......................................................... 78Table 71: Noise model n_BA17a_D&UPBO............................................................................... 79Table 72: kl0 for calculation of the single self-disturber PSD for BA17a_D&UPBO.................. 79Table 73: Performance tests with BA17a_D&UPBO_RA_F_150_150....................................... 79Table 74: Performance tests with BA17a_D&UPBO_RA_I_150_150........................................ 80Table 75: Common Line Settings for BB17a_D&UPBO Band Profile ....................................... 81Table 76: Profile-line combinations for BB17a_D&UPBO ......................................................... 81Table 77: Noise model n_BB17a_D&UPBO ............................................................................... 82

VDSL2 Performance Test Plan TR-114 Issue 1
November 2009 © The Broadband Forum. All rights reserved. 10 of 144
Table 78: kl0 for calculation of the single self-disturber PSD for BB17a_D&UPBO.................. 82Table 79: Performance tests with BB17a_D&UPBO_RA_F_150_150 ....................................... 82Table 80: Performance tests with BB17a_D&UPBO_RA_I_150_150........................................ 83Table 81: Common Line Settings for BA8c_D&UPBO Band Profile ......................................... 83Table 82: BA8c D&UPBO testing descriptions ........................................................................... 84Table 83: Noise model n_BA8c_D&UPBO................................................................................. 84Table 84: kl0 for calculation of the single self-disturber PSD for BA8c_D&UPBO.................... 84Table 85: Performance tests with BA8c_D&UPBO_RA_F_150_150......................................... 85Table 86: Performance tests with BA8c_D&UPBO_RA_I_150_150.......................................... 85Table 87: VDSL2oPOTS test cases for CRC error reporting verification test ............................. 86Table 88: VDSL2oISDN test cases for CRC error reporting verification test ............................. 86Table 89: Downstream Margin verification for VDSL2oPOTS (0.4mm PE) .............................. 87Table 90: Downstream margin verification for VDSL2oPOTS (TP-100).................................... 88Table 91: Downstream margin verification (0.4mm PE).............................................................. 88Table 92: Upstream margin verification for VDSL2oPOTS (0.4mm PE).................................... 89Table 93: Upstream Margin verification for VDSL2oPOTS (TP-100) ........................................ 90Table 94: Upstream Margin Verification for VDSL2oISDN(0.4mm PE).................................... 91Table 95: Common Line Settings for BA8c_D&UPBO Band Profile REIN Testing.................. 92Table 96: Modified BA8c D&UPBO Profile-line-combinations for REIN testing...................... 93Table 97: REIN noise model n_BA8c_D&UPBO........................................................................ 93Table 98: REIN test procedure – rate adaptive mode ................................................................... 94Table 99: REIN testing in rate adaptive mode - downstream....................................................... 95Table 100: REIN testing in rate adaptive mode - upstream.......................................................... 95Table 101: REIN test procedure – fixed rate mode ...................................................................... 96Table 102: DS Target REIN Reach impairment, Fixed Rate Profile............................................ 97Table 103: US Target REIN Reach impairment, Fixed Rate Profile............................................ 97Table 104: Common line settings for BA8c_D&UPBO band-profile SHINE testing ................. 98Table 105: BA8c D&UPBO profile-line combinations – SHINE testing .................................... 98Table 106: Noise model n_BA8c_D&UPBO SHINE testing....................................................... 99Table 107: SHINE rate adaptive test procedure ........................................................................... 99Table 108: SHINE test loop and burst lengths............................................................................ 100Table 109: Combined noise test procedure Type 1 – Rate Adaptive mode................................ 101Table 110: Combined noise test procedure Type 1 – Fixed Rate mode ..................................... 102Table 111: Combined noise test procedure Type 2 – Rate Adaptive mode................................ 103Table 112: Combined noise test procedure Type 2 – Fixed Rate mode ..................................... 104Table 113: Common line setting for BA8c_D&UPBO band-profile combined threat testing... 104Table 114: BA8c D&UPBO testing descriptions ....................................................................... 105Table 115: Combined threat noise test loops.............................................................................. 106Table 116: Combined noise impairment 1, rate adaptive profile................................................ 106Table 117: Combined noise impairment 1, fixed rate profile..................................................... 107Table 118: Combined noise impairment 2, rate adaptive profile................................................ 107Table 119: Combined noise impairment 2, fixed rate profile.................................................... 108Table 120: Annex C Test Configuration..................................................................................... 109Table 121: Profile-line combinations for Annex C testing......................................................... 109Table 122: Noise margin chart.................................................................................................... 110Table 123: Reported margin requirements ................................................................................. 110

VDSL2 Performance Test Plan TR-114 Issue 1
November 2009 © The Broadband Forum. All rights reserved. 11 of 144
Table 124: Noise AWGNr CG8d impairment, profile-line combination CG8d_ RA_I_105_105............................................................................................................................................. 111
Table 125: Noise AWGNr CG12a impairment, profile-line combination CG12a_ RA_I_105_105............................................................................................................................................. 112
Table 126: Noise AWGNr CG17a impairment, profile-line combination CG17a_ RA_I_105_105............................................................................................................................................. 113
Table 127: Noise AWGNr CG30a impairment, profile-line combination CG30a_ RA_I_105_105............................................................................................................................................. 113
Table 128: Noise AWGNc CG8d impairment, profile-line combination CG8d_ RA_I_105_105............................................................................................................................................. 114
Table 129: Noise AWGNc CG12a impairment, profile-line combination CG12a_ RA_I_105_105............................................................................................................................................. 115
Table 130: Noise AWGNc CG17a impairment, profile-line combination CG17a_ RA_I_105_105............................................................................................................................................. 116
Table 131:Noise AWGNc CG30a impairment, profile-line combination CG30a_ RA_I_105_105............................................................................................................................................. 117
Table 132: Noise (XTr+AWGNr) CG8d impairment, profile-line combination CG8d_ RA_I_105_105.................................................................................................................... 118
Table 133: Noise (XTr+AWGNr) CG12a impairment, profile-line combination CG12a_ RA_I_105_105.................................................................................................................... 119
Table 134: Noise (XTr+AWGNr) CG17a impairment, profile-line combination CG17a_ RA_I_105_105.................................................................................................................... 120
Table 135: Noise (XTr+AWGNr) CG30a impairment, profile-line combination CG30a_ RA_I_105_105.................................................................................................................... 120
Table 136: Noise (XTc+AWGNc) CG8d impairment, profile-line combination CG8d_ RA_I_105_105.................................................................................................................... 122
Table 137: Noise (XTc+AWGNc) CG12a impairment, profile-line combination CG12a_ RA_I_105_105.................................................................................................................... 123
Table 138: Noise (XTc+AWGNc) CG17a impairment, profile-line combination CG17a_ RA_I_105_105.................................................................................................................... 124
Table 139: Noise (XTc+AWGNc) CG30a impairment, profile-line combination CG30a_ RA_I_105_105.................................................................................................................... 125
Table 140: XA.LT and XA.NT component for MD_EX noise scenario.................................... 126Table 141: XA.LT and XA.NT component for MD_CAB27 noise scenario............................. 126Table 142: PEIN PSD levels....................................................................................................... 128Table 143: PEIN test pattern definition ...................................................................................... 129Table 144: Crosstalk coupling factor for the nth pair in the set.................................................. 130Table 145: Fluctuating crosstalk power test pattern ................................................................... 131Table 146: AM radio channel model .......................................................................................... 133Table 147:Amateur Radio Band Frequency Ranges (MHz)....................................................... 137Table 148: Summary of profile-line combinations used in TR-114 ........................................... 141Table 149: Annex A testing CPE Noise ..................................................................................... 143Table 150: Annex A testing DSLAM noise (at DSLAM) .......................................................... 144

VDSL2 Performance Test Plan TR-114 Issue 1
November 2009 © The Broadband Forum. All rights reserved. 12 of 144
Executive Summary
This Broadband Forum Technical Report, as part of the Broadband Suite, provides a set of region specific performance requirements and test methods for VDSL2 modems implemented in accordance with ITU-T G.993.2 (Very high speed Digital Subscriber Line transceivers 2). Its key value is in the verification of performance such that network operators may deploy consistent and successful VDSL2 services in their networks.
TR-114 accompanies TR-115 “VDSL2 Functionality Test Plan” and TR-138 “Accuracy Tests for Test Parameters”. TR-115 defines the tests for verification of functional requirements (physical layer and system level) defined in ITU-T G.993.2. TR-138 defines the tests for verification of the accuracy of the reported test (Physical Layer OAM configuration and performance monitoring) parameters defined in ITU-T G.993.2 and G.997.1.

VDSL2 Performance Test Plan TR-114 Issue 1
November 2009 © The Broadband Forum. All rights reserved. 13 of 144
1 Purpose and Scope
1.1 Purpose
TR-114 provides a set of performance requirements for VDSL2 (ITU-T G.993.2) modems. The contents includes the region specific requirements for North American, European and Japanese deployments which have been identified by the Broadband Forum as being of special importance for service operators’ deployment.
1.2 Scope
This test plan facilitates VDSL2 over POTS and over ISDN performance testing. This test plan embodies definitions of VDSL2 interoperability between one DSLAM and one CPE at a time and focuses on physical layer testing, as well as validation and verification of selected higher layer functionalities.
VDSL2 provides significant flexibility in transceiver functionality through configuration (e.g., band plans, PSDs, INP, delay) and therefore it is not practical to include tests for all possible combinations. Since network architectures and deployment practices vary greatly amongst service providers, the network conditions (loop models, noise models, loop lengths, etc.) were selected to represent nominal conditions under which dynamic (interoperability) performance is tested. This test plan is focused on ensuring laboratory repeatability such that equipment from different vendors can be easily validated and compared.
It is important to point out that this test plan does not replace operators' pre-deployment testing. Specific operator deployment and service requirements, as well as region specific regulatory requirements, could impose additional tests in addition to those described in this test plan.
The performance points in this test plan are based on DSLAM equipment, capable of providing the maximum allowable power. DSLAM equipment unable to provide this transmit power is considered to be out of the scope of this interoperability test plan.
Note: There is no requirement for VDSL2 modems to interoperate with G.993.1 (VDSL1) CPE.

VDSL2 Performance Test Plan TR-114 Issue 1
November 2009 © The Broadband Forum. All rights reserved. 14 of 144
2 References and Terminology
2.1 Conventions
In this Technical Report, several words are used to signify the requirements of the specification. These words are always capitalized. More information can be found be in RFC 2119 [1].
Table 1: TR-114 requirements terminology
SHALLThis word, or the term “REQUIRED”, means that the definition is an absolute requirement of the specification.
SHALL NOTThis phrase means that the definition is an absolute prohibition of the specification.
SHOULD
This word, or the adjective “RECOMMENDED”, means that there may exist valid reasons in particular circumstances to ignore this item, but the full implications need to be understood and carefully weighed before choosing a different course.
SHOULD NOT
This phrase, or the phrase "NOT RECOMMENDED" means that there may exist valid reasons in particular circumstances when the particular behavior is acceptable or even useful, but the full implications should be understood and the case carefully weighed before implementing any behavior described with this label.
MAY
This word, or the adjective “OPTIONAL”, means that this item is one of an allowed set of alternatives. An implementation that does not include this option SHALL be prepared to inter-operate with another implementation that does include the option.
2.2 References
The following references are of relevance to this Technical Report. At the time of publication, the editions indicated were valid. All references are subject to revision; users of this Technical Report are therefore encouraged to investigate the possibility of applying the most recent edition of the references listed below.A list of currently valid Broadband Forum Technical Reports is published at www.broadband-forum.org.
Table 2: TR-114 list of references
[1] RFC 2119Key words for use in RFCs to Indicate Requirement Levels
IETF 1997
[2] G.993.2Very high speed subscriber line transceivers 2 (VDSL2)
ITU-T 2006

VDSL2 Performance Test Plan TR-114 Issue 1
November 2009 © The Broadband Forum. All rights reserved. 15 of 144
[3] G.993.2 Amd 1
Very high speed digital subscriber linetransceivers 2 (VDSL2) Amdendment 1
ITU-T April, 2007
[4] G.997.1Physical Layer Management for Digital Subscriber Line (DSL) Transceivers.
ITU-T 2009
[5] 0600417.2003
Spectrum Management for Loop Transmission System
ATIS 2003
[6] TS101271v1.1.1
Access Terminals Transmission and Multiplexing (TM); Access transmission system on metallic pairs; Very High Speed digital subscriber line system (VDSL2)
ETSI January, 2009
[7] TS101388 v1.3.1
ADSL - European Specific Requirements
ETSI May, 2002
[8] TR-115 VDSL2 Functionality Test Plan Broadband Forum 2009
[9] TS101952-2
Specification of ADSL splitters for Europeandeployment.
ETSI April, 2002
2.3 Definitions
The following terminology is used throughout this Technical Report.
Table 3: TR-114 definitionsnet data rate Sum of net data rates of all bearer channels bit rate term used interchangeably with net data ratemicro-interuption
Disconnection of the loop for a very short time period
null Loop DSLAM/CPE wired “back to back”showtime DSLAM and CPE trained up to the point of passing data
fdeltaThe maximum frequency separation between two consecutive samples of loop attenuation or noise power during calibration
sync rate term used interchangeably with net data rateSOS VDSL2 function defined to avoid retrains by rapid reduction of bandwidth
2.4 Abbreviations
This Technical Report uses the following abbreviations:
Table 4: TR-114 abbreviationsADSL2 Asymmetric digital subscriber line transceivers 2

VDSL2 Performance Test Plan TR-114 Issue 1
November 2009 © The Broadband Forum. All rights reserved. 16 of 144
ADSL2plus Asymmetric Digital Subscriber Line (ADSL) transceivers – Extended bandwidth ADSL2
ANSI American National Standards InstituteATIS Alliance for Telecommunications Industry SolutionsAWG American Wire GaugeAWGN Additive White Gaussian NoiseBER Bit Error RateCPE Customer Premises Equipment (modem)dBm decibels relative to milliwattsDPBO Downstream Power BackoffDS DownstreamDSLAM Digital Subscriber Line Access MultiplexerEDC Erasure DecodingEMI Electromagnetic InterferenceES Errored SecondETSI European Telecommunications Standards InstituteEU Extended UpstreamEUT Equipment Under TestFEXT Far-End CrosstalkINP Impulse Noise ProtectionISDN Integrated Service Digital NetworkITU International Telecommunications UnionL0 Link state zero (G.993.2 [2] §12.1.1)L3 Link state three (G.993.2 [2] §12.1.1)MAC Media Access ControlMAE Mean Absolute ErrorMD Medium DensityME Mean ErrorMODEM End user device or CPE. Concatenation of Modulator-DemodulatorNEXT Near-End CrosstalkOLR On-line Reconfiguration PE PolyethylenePOTS Plain Old Telephone ServicePSD Power Spectral DensityRA Rate AdpativeRFI Radio Frequency IngressSES Severely Errored SecondSRA Seamless Rate Adaptation (G.993.2 [2], G.993.2 Amd 1 [3])STP Shielded Twisted PairSUT System Under TestUPBO Upstream Power BackoffUS UpstreamUTP Unshielded Twisted PairVDSL2 Very high speed digital subscriber line transceivers 2 (G.993.2 [2])

VDSL2 Performance Test Plan TR-114 Issue 1
November 2009 © The Broadband Forum. All rights reserved. 17 of 144
3 Technical Report Impact
3.1 Energy Efficiency
TR-114 has no impact on Energy Efficiency.
3.2 IPv6
TR-114 has no impact on IPv6.
3.3 Security
TR-114 has no impact on Security.
VDSL2 Performance Test Plan TR-114 Issue 1
November 2009 © The Broadband Forum. All rights reserved. 18 of 144
4 Common Test Information
4.1 Compliance RequirementsAny DSLAM/CPE combination claiming TR-114 interoperability for a specific profile SHALLcomply to the testing requirements for that profile. Any DSLAM/CPE combination claiming interoperability for several distinct profiles SHALL comply with each of the distinct profile test requirements.
A modem SHALL achieve at least the minimum required performance in every mandatory test with each DSLAM for which compliance is claimed, for each VDSL2 profile supported by the DSLAM/CPE pair.

VDSL2 Performance Test Plan TR-114 Issue 1
November 2009 © The Broadband Forum. All rights reserved. 19 of 144
5 Equipment Features
Reports of results obtained as a result of testing performed in accordance with TR-114 SHALL contain, at minimum, the information described in 5.1, 5.2 and 5.3.
5.1 EUT Information Table 5, Table 6, Table 7 and Table 8 are intended to provide test engineers and readers of test reports with sufficient information about the EUT in order to ensure repeatability of results and to allow for accurate comparisons of reported test results. The tables SHALL be populated prior to the start of any testing and SHALL be included as part of any written test report. All fields SHALL be populated; if an item is not applicable to the EUT, the item may be marked as "Not Applicable.
Table 5: DSLAM information
DSLAM Manufacturer
DSLAM Product Name/Model
DSLAM system software release number
Line Card Name/Model
Line Card part number
Line Card serial number
Line Card software/firmware release number
System Vendor ID
Chipset HW version
Chipset FW version
Table 6: CPE information
CPE Manufacturer
CPE Product Name/Model
CPE software release number
CPE serial number
System Vendor ID
Chipset Manufacturer
Chipset HW version
Chipset FW version
VDSL2 Band-Profiles tested
VDSL2 optional features tested
TPS-TC encapsulation tested (ATM, PTM)

VDSL2 Performance Test Plan TR-114 Issue 1
November 2009 © The Broadband Forum. All rights reserved. 20 of 144
Table 7: CO Splitter InformationManufacturerProduct Name/Model Version numberSerial numberType (ISDN 2B1Q, ISDN 4B3T, etc.)
Table 8: CPE Splitter InformationManufacturerProduct Name/ModelVersion number
Serial number
Type (ISDN 2B1Q, ISDN 4B3T, etc.)
5.2 Temperature and Humidity
The ranges of temperature and humidity of the test facility, over the entire time tests are conducted, SHALL be recorded in a manner similar to that shown in Table 9 and SHALL be included as part of any written test report. The acceptable range of temperatures SHALL be between 15 °C (59 °F) and 35 °C (95 °F). The humidity SHALL be between 5% and 85%.
Table 9: Temperature and Humidity Range of Test Facility
Parameter High Low
Temperature
Humidity
5.3 Test Equipment Calibration
A TR-114 report SHALL contain test equipment calibration data.
All initial and subsequent ME, MAE values and background noise measurements for all of the loops and noise used during tests conducted in accordance with TR-114, SHALL be included as part of any written test report.
6 Testing Environments

VDSL2 Performance Test Plan TR-114 Issue 1
November 2009 © The Broadband Forum. All rights reserved. 21 of 144
This section contains all the specifications and information required for building the basic testing environment (e.g. test configurations, setup of the simulated network environment, main settings of the equipment under test) for VDSL2 test cases defined in this test plan. Different configurations and settings needed for specific test cases are defined in the related section.
6.1 Test Configurations Physical layer testing MAY use test setups without data layer present as in Figure 1. OPTIONALLY, these tests MAY be performed with data layer (i.e. the router and traffic generator/analyzer) present as in Figure 2. When using the test setup with traffic analyzer present, the modem SHALL be set to a bridged configuration and the router configuration is OPTIONAL.
Figure 1: Test configuration for Annex A testing over POTS
Figure 2: Test setup for configurations using data layer

VDSL2 Performance Test Plan TR-114 Issue 1
November 2009 © The Broadband Forum. All rights reserved. 22 of 144
Line Simulator
High Z
NoiseSource
High Z
NoiseSource
DSLAM Splitter
Spl
itter
CPE
ISDN Terminating Impedance
ISDN Noise
ISDN Terminating Impedance
ISDN Noise
Figure 3: Test configuration for Annex B over ISDN and Annex C over TCM-ISDN testing

VDSL2 Performance Test Plan TR-114 Issue 1
November 2009 © The Broadband Forum. All rights reserved. 23 of 144
6.2 System Under Test Settings
6.2.1 Band Profiles
Band Profiles are used to describe the VDSL2 profile under test. The structure of the abbreviation used throughout the document for Band Profiles is as follows.
The abbreviation begins with a letter designating the G.993.2 Annex to which the profile refers. The next letter refers to the US0 type of the profile, hence indicating profiles for
AA: G.993.2 Annex A with US0 corresponding to Annex A of G.992.5 (VDSL2 over POTS)
BA: G.993.2 Annex B with US0 corresponding to Annex A of G.992.5 (VDSL2 over POTS). Note that the same abbreviation is used for profile 17a where US0 is not available
BB: G.993.2 Annex B with US0 corresponding to Annex B of G.992.5 (VDSL2 over ISDN)
CG: G.993.2 Annex C (VDSL2 over TCM-ISDN). Note that US0 is not available.
The next symbols are the numeric and letter description of the profile itself (8d, 8b, 8c, 12a, 17aand 30a.). Common band profiles are provided in Table 10.
Table 10: Common Band ProfilesAnnex A
VDSL2 band profile AA8d
Profile 8d
Annex A
Limit PSD MaskTable
A.1/G.993.2
US0 typeEU32
(see Table A.2/G.993.2)
MAXNOMATPds +14.5 dBm
Annex B
VDSL2 Band-profile BA8b BA8c BA12a BA17a
Profile 8b 8c 12a 17a
Annex B B B B

VDSL2 Performance Test Plan TR-114 Issue 1
November 2009 © The Broadband Forum. All rights reserved. 24 of 144
Limit PSD Mask
(short name)
998-M2x-A
(B8-4)997-M1c-A-7
998-M2x-A
(B8-4)
998E17-M2x-NUS0
(B8-8)
US0 type A A A N/A
MAXNOMATPds +20.5 dBm +11.5 dBm +14.5 dBm +14.5 dBm
Annex B
VDSL2 Band-profile BB8b BB12a BB17a
Profile 8b 12a 17a
Annex B B B
Limit PSD Mask
(short name)
998-M2x-B
(B8-6)
998-M2x-B
(B8-6)
998ADE17-M2x-B
(B8-12)
US0 type B B B
MAXNOMATPds +20.5 dBm +14.5 dBm +14.5 dBm
Annex C
VDSL2 Band-profile CG8d CG12a CG17a CG30a
Profile 8d 12a 17a 30a
Annex C C C C
Limit PSD Mask
(short name)
Tables C-9 and C-10/ G.993.2
Amd.1
Tables C-9 and C-10/ G.993.2
Amd.1
Tables C-9 and C-10/ G.993.2
Amd.1
Tables C-9 and C-10/ G.993.2
Amd.1
US0 type N/A N/A N/A N/A
MAXNOMATPds +14.5dBm +14.5dBm +14.5dBm +14.5dBm
6.2.2 Line Settings
6.2.2.1 Common Line Settings This section defines the modem settings of parameters that are common to the configurations of the SUT in this test plan. Common line settings are provided in Table 11.

VDSL2 Performance Test Plan TR-114 Issue 1
November 2009 © The Broadband Forum. All rights reserved. 25 of 144
Table 11: List of common line settings for VDSL2 performance tests
Parameter Setting Description
All parameters but those specified below Default value
Power management state forced (PMSF) 0
Power management state enabling (PMMode) 0
Loop diagnostic mode forced (LDMF) 0
Automode cold start forced 0
DPBO off
UPBO off activated for Annex A & C
RFI notches off
MAXSNRMds FFFF16
MAXSNRMus FFFF16
TARSNRMds 6 dB
TARSNRMus 6 dB
MINSNRMds 0 dB
MINSNRMus 0 dB
MSGMINds 16 kbps
MSGMINus 16 kpbs
Preemption option flag, ds 0016
Preemption option flag, us 0016
Short packet option flag, ds 0016
Short packet option flag, us 0016
FORCEINP 1
6.2.2.2 General Line Settings This section defines the profile, latency and INP settings of the SUT. Deviations from these modem settings are indicated in the description of each test or test section. General line settings are provided in Table 12.

VDSL2 Performance Test Plan TR-114 Issue 1
November 2009 © The Broadband Forum. All rights reserved. 26 of 144
Table 12: General line settings
General line-setting Parameter Setting Description
delay_maxn ds S1 Special value S1 as defined in G.997.1 section 7.3.2.2 indicating that S and D SHALL be selected such that S ≤ 1 and D=1
delay_maxn us S1 Special value S1 as defined in G.997.1 section 7.3.2.2 indicating that S and D SHALL be selected such that S ≤ 1 and D=1
INP_minn ds 0 symbols
F-1/0
INP_minn us 0 symbols
delay_maxn ds 8 ms
delay_maxn us 8 ms
INP_minn ds 2 symbols
I-8/2
INP_minn us 2 symbols
delay_maxn ds S2 Special value S2 as defined in G.997.1 section 7.3.2.2 indicating a delay bound of 1 ms.
delay_maxn us S2 Special value S2 as defined in G.997.1 section 7.3.2.2 indicating a delay bound of 1 ms.
INP_minn ds 0 symbols
I-1/0
INP_minn us 0 symbols
delay_maxn ds 32 ms
delay_maxn us 32 ms
INP_minn ds 16 symbols
I-32/16
INP_minn us 16 symbols
6.2.2.3 Specific Line Settings
Nomenclature adopted for the specific line settings is as follows:
The first two letters describe whether the SUT operates in rate adaptive (RA) or fixed rate (FX) mode
The next one or two letters describe the profile latency and INP settings according to Table 13 (Fast or Interleaved).

VDSL2 Performance Test Plan TR-114 Issue 1
November 2009 © The Broadband Forum. All rights reserved. 27 of 144
The following two numbers are the upper limits of the downstream and upstream rates rounded and expressed in Mbps.
Table 13: Specific line settings
Specific
line-setting
General
line-setting
RA-Mode DS net data rate (kbit/s)
(max- min)
US net data rate (kbit/s)
(max-min)
RA_F_150_150 F-1/0 AT_INIT 150000-128 150000-64
RA_I_150_150 I-8/2 AT_INIT 150000-128 150000-64
FX_I_027_002 I-8/2 Manual 27000-27000 2000-2000
FX_I_014_001 I-8/2 Manual 14000-14000 1000-1000
FX_I_040_006 I-8/2 Manual 40400-40400 5700-5700
RA_I_096_056 I-8/2 AT_INIT 96000-256 56000-128
RA_I_105_105 I-1/0 AT_INIT 104960-64 104960-64
RA_HI_150_150 I-32/16 AT_INIT 150000-128 150000-64
FX_HI_010_004 I-32/16 Manual 10000-10000 4000-4000
FX_HI_006_003 I-32/16 Manual 6000-6000 3500-3500
FX_HI_011_003 I-32/16 Manual 11000-11000 3000-3000
FX_I_027_009 I-8/2 Manual 27000-27000 9000-9000
FX_I_024_008 I-8/2 Manual 24000-24000 8000-8000
FX_I_014_005 I-8/2 Manual 14000-14000 5000-5000
FX_I_010_003 I-8/2 Manual 10000-10000 3000-3000
FX_I_005_001 I-8/2 Manual 5000-5000 1000-1000
6.2.3 Profile Line Combinations Common band-profiles as described in section 6.2.1 above are combined with line settings described in section 6.2.2 to specify the common settings for a system under test. Without enumerating each combination a new nomenclature is formed using the concatenation of the two common setting nomenclatures. Table 14 provides a few examples of these combinations without a complete listing of all of the expected combinations. Actual combinations to be used in Annex A, Annex B and Annex C testing SHALL be specified in the test setup description as listed in appendix C.

VDSL2 Performance Test Plan TR-114 Issue 1
November 2009 © The Broadband Forum. All rights reserved. 28 of 144
Table 14: Concatenated common settings, testing combination description
Band-profile Specific line-setting Profile-line combination
AA8d RA_ I_096_056 AA8d_RA_ I_096_056
BA12a RA_I_150_150 BA12a_RA_I_150_150
BB17a RA_F_150_150 BB17a_RA_F_150_150
BA8c_ D&UPBO FX_HI_010_004 BA8c_ D&UPBO_FX_HI_010_004
etc. etc. etc.
6.2.4 Test Plan Passing Criteria
For an SUT to pass this Test Plan for one of the VDSL2 band-profiles defined in Table 10, it is required that the SUT pass the set of physical layer performance test cases, common and region specific applicable to that band-profile as well as higher layer test cases if applicable to that band-profile and supported type of the TPS-TC layer.
6.3 Test Setup
6.3.1 Splitter Requirements
6.3.1.1 Splitter Requirements for Annex B TestingSplitter requirements for Annex B are as defined in TS101952-2 [9].
6.3.1.2 Splitter Requirements for Annex C TestingSplitter requirements for Annex C are as defined in G.993.2 Amd.1 Annex C §C.5 (Service Splitter). ISDN ports of ISDN splitters SHALL be terminated by 110 ohms.
6.3.2 Loop Models
6.3.2.1 Loop Models for Annex A TestingThe common loop models for Annex A performance testing consist of both straight loops and loops with bridged taps (BT). The 26 AWG loops are defined in Table 15. The 26 AWG bridged tapped loops have the topology shown in Figure 4.

VDSL2 Performance Test Plan TR-114 Issue 1
November 2009 © The Broadband Forum. All rights reserved. 29 of 144
Table 15: 26 AWG straight test loops for Annex A testing
Initial Length(ft)
Final Length(ft)
Increment (ft) # of Loops
Very Short 300 900 300 3
Short 1200 4000 400 8
Medium 4500 4500 500 1
Long 5500 8500 1000 4
Figure 4: North American bridged tap topology
6.3.2.2 Loop Models for Annex B testing For test cases applicable to systems using G.993.2 Annex B (Europe), the loop types are straight homogeneous loops PE04 and TP100 defined in TS101271 [6] Annex ZA.3. Loop type PE04 shall be used for all Annex B band profiles (Table 10), except the BA8c, for which the loop TP100 shall apply.
6.3.2.2.1 Mixed Impedance Loop ModelsFor further study.
6.3.2.3 Loop Models for Annex C testing For test cases applicable to systems using G.993.2 Annex C (Japan), the loop type is VLOOP-J1 (0.4mm PE cables with straight homogeneous loop topologies) as defined in G.993.2 Amd.1 Annex C section C.6.1.
6.3.3 Noise Models This section specifies noise models relevant for the execution of the test cases defined within this test plan. Given the broad set of VDSL2 configuration options and of relevant legacy broadband deployments (ADSL1/2/2plus, SDSL, ISDN, …), the number of possible reference noise scenarios MAY become quite high. The reference noise models specified for this Test Plan have been chosen as a reasonable compromise between covering a challenging set of noise conditions while keeping a manageable overall number of tests.
VDSL2 Performance Test Plan TR-114 Issue 1
November 2009 © The Broadband Forum. All rights reserved. 30 of 144
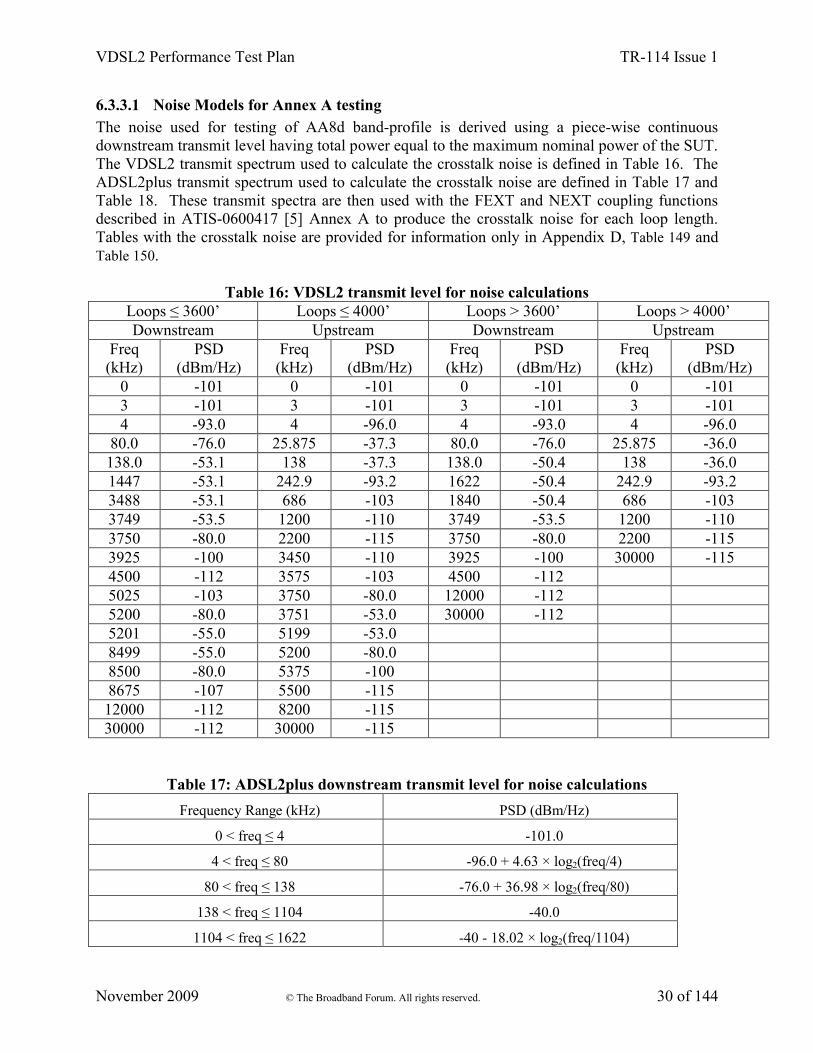
6.3.3.1 Noise Models for Annex A testingThe noise used for testing of AA8d band-profile is derived using a piece-wise continuous downstream transmit level having total power equal to the maximum nominal power of the SUT. The VDSL2 transmit spectrum used to calculate the crosstalk noise is defined in Table 16. The ADSL2plus transmit spectrum used to calculate the crosstalk noise are defined in Table 17 and Table 18. These transmit spectra are then used with the FEXT and NEXT coupling functions described in ATIS-0600417 [5] Annex A to produce the crosstalk noise for each loop length. Tables with the crosstalk noise are provided for information only in Appendix D, Table 149 and Table 150.
Table 16: VDSL2 transmit level for noise calculationsLoops ≤ 3600’ Loops ≤ 4000’ Loops > 3600’ Loops > 4000’Downstream Upstream Downstream Upstream
Freq (kHz)
PSD (dBm/Hz)
Freq (kHz)
PSD (dBm/Hz)
Freq (kHz)
PSD (dBm/Hz)
Freq (kHz)
PSD (dBm/Hz)
0 -101 0 -101 0 -101 0 -1013 -101 3 -101 3 -101 3 -1014 -93.0 4 -96.0 4 -93.0 4 -96.0
80.0 -76.0 25.875 -37.3 80.0 -76.0 25.875 -36.0138.0 -53.1 138 -37.3 138.0 -50.4 138 -36.01447 -53.1 242.9 -93.2 1622 -50.4 242.9 -93.23488 -53.1 686 -103 1840 -50.4 686 -1033749 -53.5 1200 -110 3749 -53.5 1200 -1103750 -80.0 2200 -115 3750 -80.0 2200 -1153925 -100 3450 -110 3925 -100 30000 -1154500 -112 3575 -103 4500 -1125025 -103 3750 -80.0 12000 -1125200 -80.0 3751 -53.0 30000 -1125201 -55.0 5199 -53.08499 -55.0 5200 -80.08500 -80.0 5375 -1008675 -107 5500 -11512000 -112 8200 -11530000 -112 30000 -115
Table 17: ADSL2plus downstream transmit level for noise calculations
Frequency Range (kHz) PSD (dBm/Hz)
0 < freq ≤ 4 -101.0
4 < freq ≤ 80 -96.0 + 4.63 × log2(freq/4)
80 < freq ≤ 138 -76.0 + 36.98 × log2(freq/80)
138 < freq ≤ 1104 -40.0
1104 < freq ≤ 1622 -40 - 18.02 × log2(freq/1104)
VDSL2 Performance Test Plan TR-114 Issue 1
November 2009 © The Broadband Forum. All rights reserved. 31 of 144
1622 < freq ≤ 2208 -50 - 2.92 × log2(freq/1622)
2208 < freq ≤ 2500 -51.3 – 64.74 × log2(freq/2208)
2500 < freq ≤ 3001.5 -62.9 – 78.10 × log2(freq/2500)
3001.5 < freq ≤ 3175 -83.5 – 246.69 × log2(freq/3001.5)
3175< freq ≤ 3750 -103.5
3750< freq ≤ 4545 -103.5 – 36.05 × log2(freq/3750)
4545 < freq -113.5
Table 18: ADSL2plus upstream transmit level for noise calculations
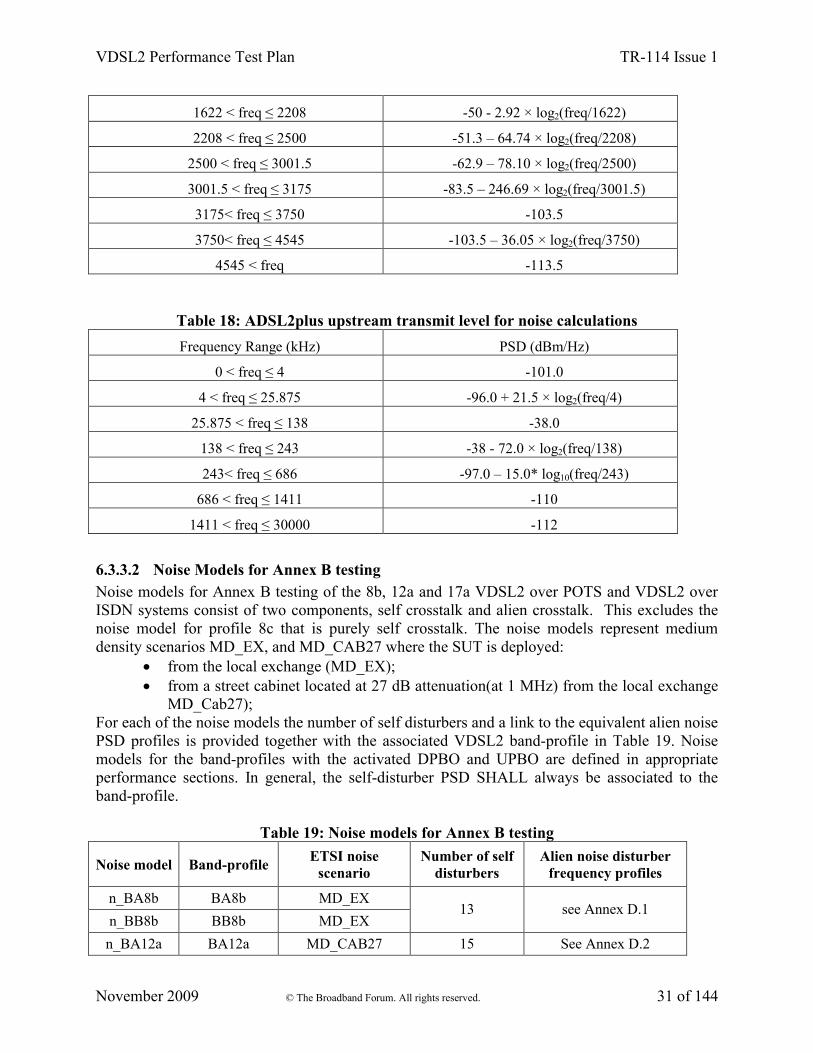
Frequency Range (kHz) PSD (dBm/Hz)
0 < freq ≤ 4 -101.0
4 < freq ≤ 25.875 -96.0 + 21.5 × log2(freq/4)
25.875 < freq ≤ 138 -38.0
138 < freq ≤ 243 -38 - 72.0 × log2(freq/138)
243< freq ≤ 686 -97.0 – 15.0* log10(freq/243)
686 < freq ≤ 1411 -110
1411 < freq ≤ 30000 -112
6.3.3.2 Noise Models for Annex B testing Noise models for Annex B testing of the 8b, 12a and 17a VDSL2 over POTS and VDSL2 over ISDN systems consist of two components, self crosstalk and alien crosstalk. This excludes the noise model for profile 8c that is purely self crosstalk. The noise models represent medium density scenarios MD_EX, and MD_CAB27 where the SUT is deployed:
from the local exchange (MD_EX); from a street cabinet located at 27 dB attenuation(at 1 MHz) from the local exchange
MD_Cab27); For each of the noise models the number of self disturbers and a link to the equivalent alien noise PSD profiles is provided together with the associated VDSL2 band-profile in Table 19. Noise models for the band-profiles with the activated DPBO and UPBO are defined in appropriate performance sections. In general, the self-disturber PSD SHALL always be associated to the band-profile.
Table 19: Noise models for Annex B testing
Noise model Band-profileETSI noise
scenarioNumber of self
disturbersAlien noise disturber
frequency profiles
n_BA8b BA8b MD_EX
n_BB8b BB8b MD_EX13 see Annex D.1
n_BA12a BA12a MD_CAB27 15 See Annex D.2
VDSL2 Performance Test Plan TR-114 Issue 1
November 2009 © The Broadband Forum. All rights reserved. 32 of 144
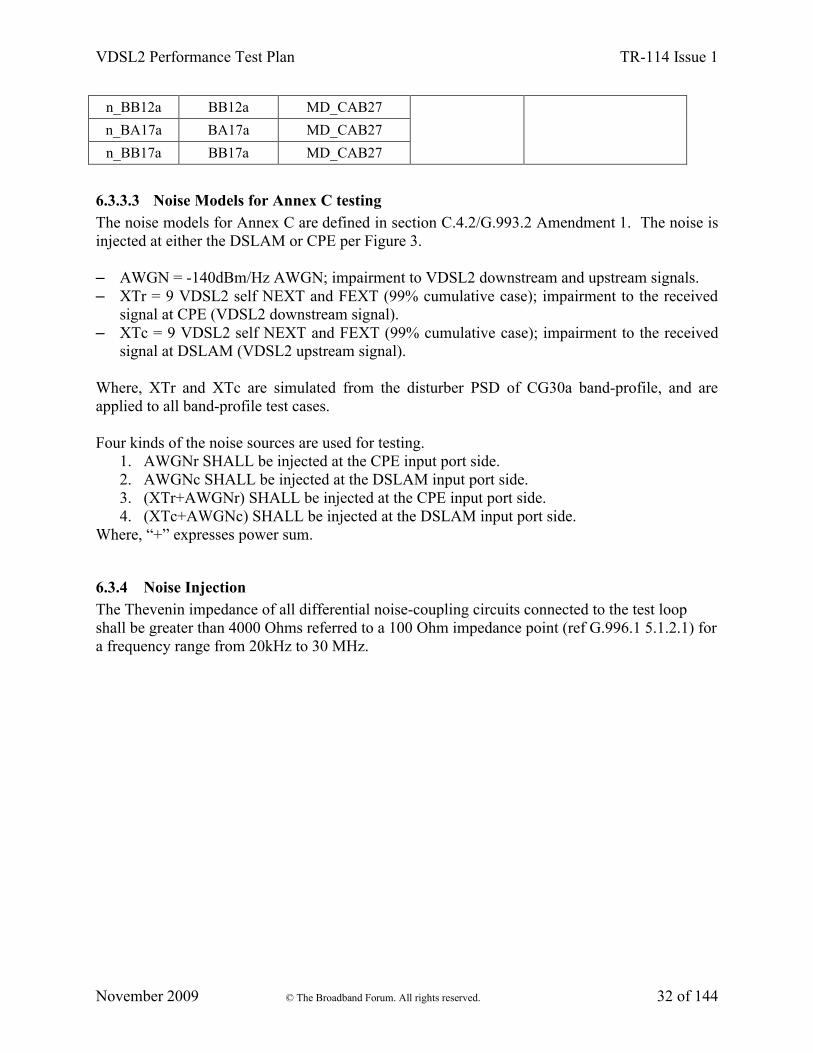
n_BB12a BB12a MD_CAB27
n_BA17a BA17a MD_CAB27
n_BB17a BB17a MD_CAB27
6.3.3.3 Noise Models for Annex C testing The noise models for Annex C are defined in section C.4.2/G.993.2 Amendment 1. The noise is injected at either the DSLAM or CPE per Figure 3.
– AWGN = -140dBm/Hz AWGN; impairment to VDSL2 downstream and upstream signals.– XTr = 9 VDSL2 self NEXT and FEXT (99% cumulative case); impairment to the received
signal at CPE (VDSL2 downstream signal).– XTc = 9 VDSL2 self NEXT and FEXT (99% cumulative case); impairment to the received
signal at DSLAM (VDSL2 upstream signal).
Where, XTr and XTc are simulated from the disturber PSD of CG30a band-profile, and are applied to all band-profile test cases.
Four kinds of the noise sources are used for testing.1. AWGNr SHALL be injected at the CPE input port side.2. AWGNc SHALL be injected at the DSLAM input port side.3. (XTr+AWGNr) SHALL be injected at the CPE input port side.4. (XTc+AWGNc) SHALL be injected at the DSLAM input port side.
Where, “+” expresses power sum.
6.3.4 Noise InjectionThe Thevenin impedance of all differential noise-coupling circuits connected to the test loop shall be greater than 4000 Ohms referred to a 100 Ohm impedance point (ref G.996.1 5.1.2.1) for a frequency range from 20kHz to 30 MHz.

VDSL2 Performance Test Plan TR-114 Issue 1
November 2009 © The Broadband Forum. All rights reserved. 33 of 144
7 Test Equipment Requirements and Calibration The following list of test equipment are used in VDSL2 performance testing:
Loop simulator protocol traffic simulator/analyzer with matching network interfaces Ethernet switch/router PC with USB/Ethernet interface Noise sources for both ends of the line (loop simulator integral noise sources or arbitrary
waveform generators)All these tools are part of configurations identified in Figure 1 − Figure 3. The Ethernet switch/router and PC used for throughput testing SHALL have adequate performance such that they do not affect the measured throughput over the VDSL2 link. The Ethernet switch or simulator MAY be removed if traffic simulator/analyzer in use is capable of terminating the IP traffic directly from the DSLAM.
7.1 Accuracy of loop simulators and noise sources
7.1.1 Loop Simulators
7.1.1.1 AttenuationFor the loop simulator used in testing, the simulated loop attenuation SHALL be measured over the frequency band [f1, f2], given by Table 20 for the different annexes. At least one measurement SHALL be made per fdelta interval. The Mean Error (ME) and Mean Absolute Error (MAE) of the measured simulated loop attenuation values (in dB), relative to the theoretical loop attenuation values (in dB), SHALL be calculated.
7.1.1.1.1 North American Annex A testingLoop Attenuation, which corresponds to the insertion loss, is expressed in dB and SHALL be calculated from RLCG parameters using two-port ABCD modeling methodology as specified in ATIS-0600417 [5] Section B.3.1 (for both straight loops and loops with bridge taps). The RLCG cable parameters SHALL be as specified in ATIS-0600417 [5] Table C-2 "Cable model parameters for 26-AWG twisted pair cable" and Table C-6 "Cable model parameters for 24-AWG twisted pair cable".
7.1.1.1.2 European Annex B testingLoop Attenuation, which corresponds to the insertion loss, is expressed in dB and SHALL be calculated from RLCG parameters using two-port ABCD modeling methodology as specified in ATIS-0600417 [5] Section B.3.1. The line constants for PE04 and TP100 cables are specified in Annex ZA.2 of TS101271 [6] table ZA.13.
VDSL2 Performance Test Plan TR-114 Issue 1
November 2009 © The Broadband Forum. All rights reserved. 34 of 144
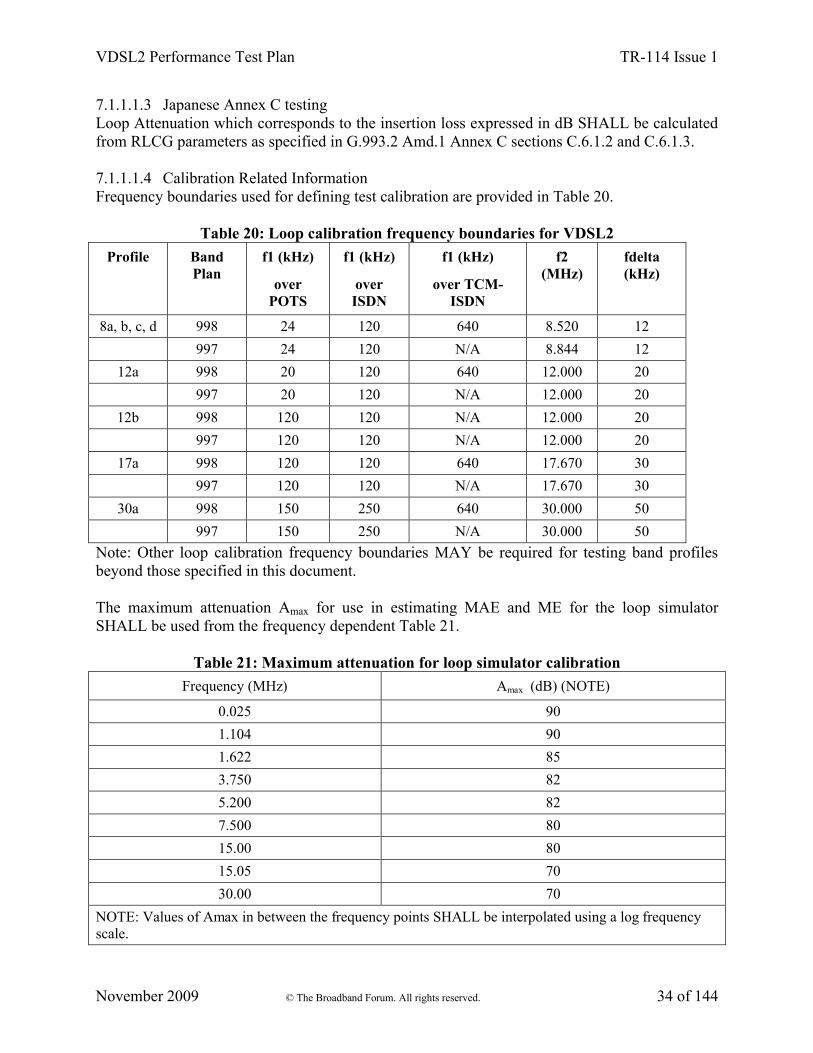
7.1.1.1.3 Japanese Annex C testingLoop Attenuation which corresponds to the insertion loss expressed in dB SHALL be calculated from RLCG parameters as specified in G.993.2 Amd.1 Annex C sections C.6.1.2 and C.6.1.3.
7.1.1.1.4 Calibration Related InformationFrequency boundaries used for defining test calibration are provided in Table 20.
Table 20: Loop calibration frequency boundaries for VDSL2
Profile Band Plan
f1 (kHz)
over POTS
f1 (kHz)
over ISDN
f1 (kHz)
over TCM-ISDN
f2 (MHz)
fdelta(kHz)
8a, b, c, d 998 24 120 640 8.520 12
997 24 120 N/A 8.844 12
12a 998 20 120 640 12.000 20
997 20 120 N/A 12.000 20
12b 998 120 120 N/A 12.000 20
997 120 120 N/A 12.000 20
17a 998 120 120 640 17.670 30
997 120 120 N/A 17.670 30
30a 998 150 250 640 30.000 50
997 150 250 N/A 30.000 50
Note: Other loop calibration frequency boundaries MAY be required for testing band profiles beyond those specified in this document.
The maximum attenuation Amax for use in estimating MAE and ME for the loop simulator SHALL be used from the frequency dependent Table 21.
Table 21: Maximum attenuation for loop simulator calibration
Frequency (MHz) Amax (dB) (NOTE)
0.025 90
1.104 90
1.622 85
3.750 82
5.200 82
7.500 80
15.00 80
15.05 70
30.00 70
NOTE: Values of Amax in between the frequency points SHALL be interpolated using a log frequency scale.

VDSL2 Performance Test Plan TR-114 Issue 1
November 2009 © The Broadband Forum. All rights reserved. 35 of 144
Mean Absolute Error (MAE) and Mean Error (ME) for loop X are given by:
Formula 7- 1: Determining MAE
5.0
XLoop
11MAE
max
MAXjRj
MAXjTj
j
jTiAAAA
j
MAXRjjAAi
TiRii
AAN
AAN
Formula 7- 2: Calculating ME
5.0
XLoop
11ME
max
MAXjRj
MAXjTj
j
jTiAAAA
j
MAXRjjAAi
TiRii
AAN
AAN
[positive error = too much attenuation]
ARi = Attenuation sample, in dB, of the measured loop XATi = Attenuation sample, in dB, of the theoretical loop X
The index “i” belongs to a set defined by the points necessary to measure the attenuation in steps of fdelta or less and taking into account only those points between f1 and f2 for which AT ≤ AMax
dB .Ni is the number of elements in the above set.The index “j” belongs to a set defined by the points necessary to measure the attenuation in steps of fdelta or less and taking into account only those points between f1 and f2 for which AT > AMax
dB and AR – AMax < -0.5 dB Nj is the number of elements in the above set.
The loop simulator SHALL be compensated by adjusting the loop length such that the absolute value of ME is minimized while maintaining an MAE less than 0.5 dB. This accuracy requirement SHALL apply for all test loops.
7.1.1.2 Average noise floorThe average noise floor in the wireline simulator SHALL be lower than –150 dBm/Hz within the VDSL2 band.
7.1.1.3 Impedance7.1.1.3.1 Input impedance for North American Annex A testingInput Impedance SHALL be calculated from RLCG parameters using two-port ABCD modeling methodology as specified in ATIS-0600417 [5] Section B.3.1 (for both straight loops and loops with bridge taps). The RLCG cable parameters SHALL be as specified in ATIS-0600417 [5] Table C-2 "Cable model parameters for 26-AWG twisted pair cable" and Table C-6 "Cable model parameters for 24-AWG twisted pair cable"
VDSL2 Performance Test Plan TR-114 Issue 1
November 2009 © The Broadband Forum. All rights reserved. 36 of 144
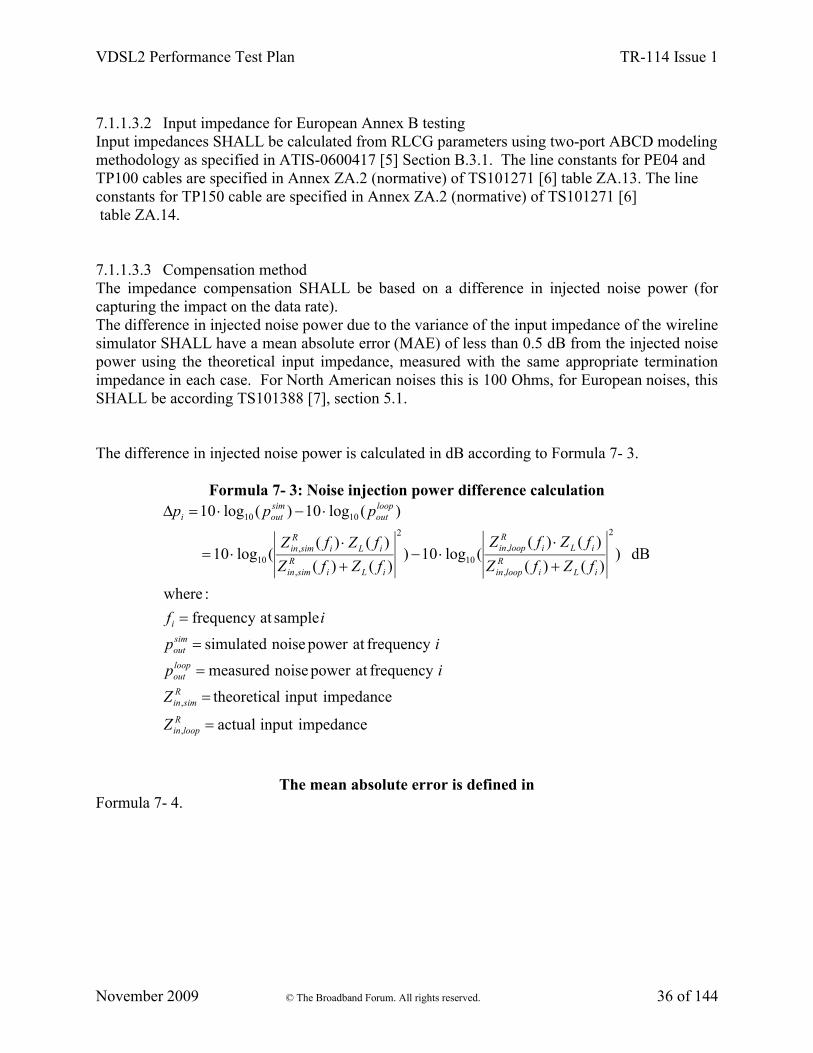
7.1.1.3.2 Input impedance for European Annex B testingInput impedances SHALL be calculated from RLCG parameters using two-port ABCD modeling methodology as specified in ATIS-0600417 [5] Section B.3.1. The line constants for PE04 and TP100 cables are specified in Annex ZA.2 (normative) of TS101271 [6] table ZA.13. The line constants for TP150 cable are specified in Annex ZA.2 (normative) of TS101271 [6] table ZA.14.
7.1.1.3.3 Compensation methodThe impedance compensation SHALL be based on a difference in injected noise power (for capturing the impact on the data rate).The difference in injected noise power due to the variance of the input impedance of the wireline simulator SHALL have a mean absolute error (MAE) of less than 0.5 dB from the injected noise power using the theoretical input impedance, measured with the same appropriate termination impedance in each case. For North American noises this is 100 Ohms, for European noises, this SHALL be according TS101388 [7], section 5.1.
The difference in injected noise power is calculated in dB according to Formula 7- 3.
Formula 7- 3: Noise injection power difference calculation
impedanceinputactual
impedanceinputltheoretica
frequencyatpowernoisemeasured
frequencyatpowernoisesimulated
sampleatfrequency
:where
dB ))()(
)()((log10)
)()(
)()((log10
)(log10)(log10
,
,
2
,
,10
2
,
,10
1010
Rloopin
Rsimin
loopout
simout
i
iLiR
loopin
iLiR
loopin
iLiR
simin
iLiR
simin
loopout
simouti
Z
Z
ip
ip
if
fZfZ
fZfZ
fZfZ
fZfZ
ppp
The mean absolute error is defined in Formula 7- 4.

VDSL2 Performance Test Plan TR-114 Issue 1
November 2009 © The Broadband Forum. All rights reserved. 37 of 144
Formula 7- 4: Input impedance MAE
37formulaindefineddifferencepower
samplespowernoiseofnumber
ErrorAbsoluteMean )(
:where
1)(
th
ip
N
pMAE
pN
pMAE
i
bins
ii
bins
and the sum is over those bins in the passband where the insertion loss is less than 90 dB.
7.1.1.3.4 Input impedance for Japanese Annex C testingInput Impedance SHALL be calculated from RLCG parameters as specified in G.993.2 Amd.1 Annex C sections C.6.1.2 and C.6.1.3.
7.1.1.4 Phase 7.1.1.4.1 North American RegionPhase SHALL be calculated from RLCG parameters using two-port ABCD modeling methodology as specified in ATIS-0600417 [9] Section B.3.1 (for both straight loops and loops with bridge taps). The RLCG cable parameters SHALL be as specified in ATIS-0600417 [5] Table C-2 "Cable model parameters for 26-AWG twisted pair cable" and Table C-6 "Cable model parameters for 24-AWG twisted pair cable".
7.1.1.4.2 European Region:Phase SHALL be calculated from RLCG parameters using two-port ABCD modeling methodology as specified in ATIS-0600417 Section B.3.1. The line constants for PE04 and TP100 cables are specified in Annex ZA.2 of TS101271 [6] table ZA.13. The line constants for TP150 cable are specified in Annex ZA.2 of TS101271 [6] table ZA.14.
Mean Average Percentage Error for Phase delay SHALL be defined as in Formula 7- 5
Formula 7- 5:Mean average percent error
where:Phase Delay( f ) = unwrapped(phase( f ))/ (2πf ) f is the frequency PDcable is the Phase Delay for a theoretical loop, and PDsim is the measured Phase Delay for the simulator, N is the number of frequencies used in the averaging.
Mean Average Percentage Error for Group Delay SHALL be defined as in Formula 7- 6.

VDSL2 Performance Test Plan TR-114 Issue 1
November 2009 © The Broadband Forum. All rights reserved. 38 of 144
Formula 7- 6: Group delay mean average percentage error
where: GDcable is the Group delay for a theoretical loop GDsim is the measured Group delay for the simulator, N is the number of frequencies used in the averaging.
Points where |GDcable| is ≤ 0.1 microseconds SHALL NOT be included in the sum and N SHALL be adjusted accordingly.
The maximum MAPE(PD) SHALL be 7% The maximum MAPE(GD) SHALL be 7%
The measurement of PD and GD, as defined above, SHALL be made over the frequency range appropriate to the profile, as defined in Table 20. The lowest frequency measured SHALL be as defined in Table 20, the highest frequency measured SHALL be the lower frequency of EITHER of the following:
1. The lowest frequency where the insertion loss begins to exceed Amax. 2. The highest frequency defined for the profile, as in Table 20.
At least one PD and GD measurement SHALL be made within each Fdelta interval, as defined in Table 20.
The Group delay is defined using the Formula 7- 7.
Formula 7- 7: Group delay formula
Wherephase is the unwrapped phase in radians the difference in frequency between fi+1 and fi SHALL be fdelta as per Table 20GD is not calculated or used at the two end frequency points
7.1.2 Noise sources Each noise SHALL be measured independently at the VTU terminal. This SHALL be done for one noise source at a time, using a zero-length loop. For North American cases, both VTUs are replaced by an 100 Ohm (±1%) resistor. For European cases the methodology in TS101271 [6]ZA.1.1.1 SHALL be used. The measured noise will be impacted by the noise generator tolerance, the coupling circuit tolerance, cabling tolerance and noise pickup.
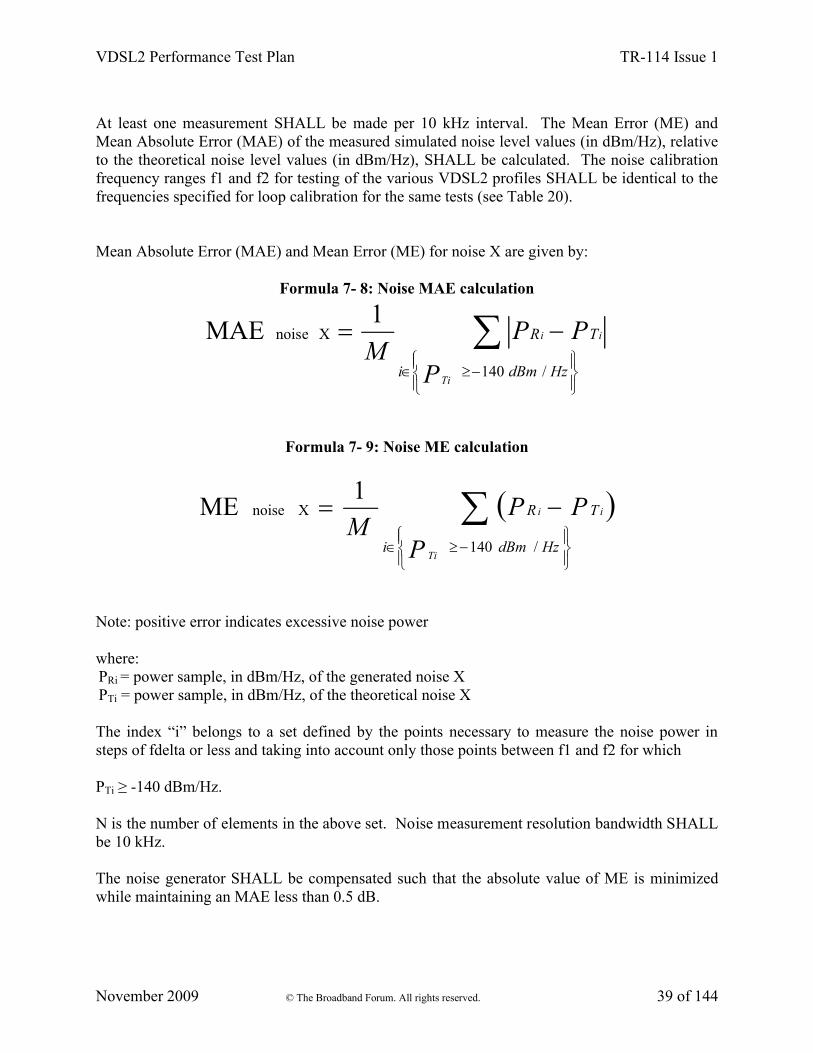
VDSL2 Performance Test Plan TR-114 Issue 1
November 2009 © The Broadband Forum. All rights reserved. 39 of 144
At least one measurement SHALL be made per 10 kHz interval. The Mean Error (ME) and Mean Absolute Error (MAE) of the measured simulated noise level values (in dBm/Hz), relative to the theoretical noise level values (in dBm/Hz), SHALL be calculated. The noise calibration frequency ranges f1 and f2 for testing of the various VDSL2 profiles SHALL be identical to the frequencies specified for loop calibration for the same tests (see Table 20).
Mean Absolute Error (MAE) and Mean Error (ME) for noise X are given by:
Formula 7- 8: Noise MAE calculation
HzdBmi
TR
P
PPM
Ti
ii
/140
X noise1
MAE
Formula 7- 9: Noise ME calculation
HzdBmi
TR
P
PPM
Ti
ii
/140
X noise1
ME
Note: positive error indicates excessive noise power
where:PRi = power sample, in dBm/Hz, of the generated noise XPTi = power sample, in dBm/Hz, of the theoretical noise X
The index “i” belongs to a set defined by the points necessary to measure the noise power in steps of fdelta or less and taking into account only those points between f1 and f2 for which
PTi ≥ -140 dBm/Hz.
N is the number of elements in the above set. Noise measurement resolution bandwidth SHALL be 10 kHz.
The noise generator SHALL be compensated such that the absolute value of ME is minimized while maintaining an MAE less than 0.5 dB.

VDSL2 Performance Test Plan TR-114 Issue 1
November 2009 © The Broadband Forum. All rights reserved. 40 of 144
Note: For noise calibration, there is measurement uncertainty that can not be compensated for, consisting of the following contributions:
1. absolute amplitude accuracy 2. vertical linearity 3. frequency response of the measurement equipment used 4. tolerance of the calibration impedance.
7.1.2.1 Noise Impairment Cumulative Amplitude Distribution 7.1.2.1.1 North American RegionNoise impairments used in this specification for Annex A (North America) SHALL comply with the following specifications. The theoretical noise level SHALL have a Gaussian amplitude distribution to 5 sigma. For a normalized Gaussian distribution with mean μ and sigma σ wewrite:
Formula 7- 10
ii
a
i
xaeap
i
2
2
2
1)(
and define the following limits
Formula 7- 11
50
52
1)1(LLimit
68.42
1ULimit
68.4410ULimit
42
1)1(ULimit
1.0105.0
i
i
)24.1802.0(i
i
20
i
ii
ii
ia
ii
a
aa
erf
aa
erf
a
aa
erf
i
7.1.2.1.2 European Region:Noise impairments used in this specification for Annex B (Europe) SHALL comply with thefollowing specifications which are based on section ZA1.3.4.3 of TS101271 [6].

VDSL2 Performance Test Plan TR-114 Issue 1
November 2009 © The Broadband Forum. All rights reserved. 41 of 144
7.1.2.2 Cabling
Cabling, switches and other equipment are needed to connect the DSLAM, the loop simulator, the noise generator and the CPE. Care SHALL be taken in order that the minimum noise is coupled into this cabling, so the wiring SHOULD be kept as short as practically possible. Recommended cables are Cat 5 UTP and STP. For all loops with bridged taps at modem side, the modem interconnect cable shall be included in the calculations. The modem cable used for these tests shall have an attenuation of 6ft 26 AWG.
For straight loops the length of this cable section is not important, as it is taken into account during the compensation procedure. STP is only required when there is high EMI in the vicinity (typically from engines, air conditioning units) or for longer cables coming from the DSLAM. If the test is performed in a large operational lab (where also other work is done), then consider this lab as a high-noise environment.
One SHOULD take care that the shielding is connected in an appropriate way. Connect the shield to the loop simulator ground only (one-sided grounding). A badly connected shield can even make the performance worse. In case of doubt, use the unshielded twisted pair.
Computer screens and power supplies radiate in the frequency bands used by VDSL. It is recommended that these devices be placed at a distance from the setup or even be switched off. This noise MAY be generated by either internal or external power supplies. When the pickup noise levels are greater than -150 dBm/Hz, they will limit the VDSL2 performance and influence the test results. The background noise measurement reported in section 7.1.2.3 provides the data necessary to evaluate whether this recommendation is satisfied. The background noise is measured at both ends of the loop as per 7.1.2 with the noise generator powered on but with no noise being generated.
The CPE and DSLAM and their wiring SHOULD be physically separated, since when testing on long loops, crosstalk can occur between the cabling. Independent of attenuation conditions special care SHOULD be taken with the wiring to avoid crosstalk. Variations of noise external to the test setup and coupled in will have a greater chance of influencing the test result for tests of long duration (e.g., upstream margin verification tests). Special attention should be made to make sure the influence of such variations is minimized. To obtain the maximum accuracy, the cables, switches and any other equipment used in the link between the DSLAM and the CPESHALL be included in the compensation process described above in section 7.1.1.
7.1.2.3 Calibration A test set-up background noise measurement SHALL be taken and recorded at the time ME and MAE measurement tests are conducted. If there is a change in test set-up, the ME and MAE and background noise measurements SHALL be redone.

VDSL2 Performance Test Plan TR-114 Issue 1
November 2009 © The Broadband Forum. All rights reserved. 42 of 144
8 Physical Layer Test Cases This section provides some information about general procedure for performance testing.
The CO splitter used SHALL be the splitter integral to the DSLAM, if that option exists. Otherwise, an external CO splitter as specified in section 6.3.1 SHALL be used.
Tests will be performed at consecutive loop lengths identified in tables of the region-specific annexes.
The tests are initiated by placing the VDSL2 port of the DSLAM out of service. Then the loop simulator is set with the appropriate noise impairments and loop length, after which the VDSL2 port of the DSLAM is placed in service.
At each test point, the line SHALL reach showtime within a total of 90 seconds, starting from the time that the DSLAM port / line was placed in service..
If the line fails to reach showtime within this 90-second period, a result of “no connect” SHALL be recorded as the result for that test point.
No retrain is allowed after the expiry of the 90-second timer. If the line retrains after the 90-second period, then a result of “no connect” SHALL be
recorded as the result for that test point.
When showtime is reached, a 60 second waiting time SHALL be started, to settle bitswap, etc. At the end of the 60-second waiting time the data rate and noise margins for the test point SHALL be recorded.The DSLAM port / line SHALL then be placed out of service, the loop simulator and noise generator are then configured for the next test point. The DSLAM line / port is placed back inservice, modem trained, and the 90 second timer is restarted. This sequence SHALL continue until all loop lengths defined in the table are complete. The CPE SHALL NOT be power cycled, rebooted or otherwise reinitialized between test points.
Any section containing a result of “no connect” SHALL result in the failure of that section.
To obtain a result for each individual test, each test SHALL be performed once. In rate-adaptive testing, any test point that fails to meet the requirement in downstream direction by 128 kbps or less or in the upstream direction by 64 kbps SHALL be re-tested, but no more than 3 times. If a re-test is performed, then the first passing value achieved, SHALL be recorded. If none of the retests provides a passing value then the highest non-passing value SHALL be recorded.
8.1 Verification of CRC error reporting CPEThe purpose of this test described in Table 22 is to verify that the CPE (or optionally the DSLAM) correctly reports CRC errors. CRC error counts are the basis of margin verification tests.

VDSL2 Performance Test Plan TR-114 Issue 1
November 2009 © The Broadband Forum. All rights reserved. 43 of 144
Table 22: Test procedure for verification of CRC error reportingTest Configuration
1. Configure the SUT according to the settings of the profile-line combination under test defined in regional annexes (A and B)
2. Test configuration (test loops, noise impairment) shall be according to regional annexes (A.1.5 and B.11). Annex B testing consists of two test conditions randomly selected from the 3 described in the table for any given profile-line combination.
Method of Procedure
1. Connect CPE and DSLAM to selected loop and noise condition among those applicable to the band-profile under test.
2. Force a new initialization and wait for modems to sync. Wait for 2 minutes after initialization for bitswaps to settle.
3. For CPE CRC error reporting test force a "micro-interruption" of the loop at the CPE side with duration of 10 ms. For DSLAM CRC error reporting test force a "micro-interruption" of the loop at the DSLAM side with duration of 10 ms.
4. Record the number of reported CRC errors.5. Repeat step 3 every 10 seconds, for a total test time of 120 seconds
(i.e. a total of 12 micro-interruptions are issued).
Expected Result 1. For CPE test: If each micro-interruption does not result in at least one reported downstream CRC error, then the CPE has failed the CPEerror-reporting test.
2. For DSLAM test: If each micro-interruption does not result in at least one reported upstream CRC error, then the DSLAM has failed the DSLAM error-reporting test.
8.2 Margin Verification Test
The measurement time is based on the occurrence of 10 error events and a confidence interval of 0.9. With this confidence interval the required BER limit for a 1e-7 target estimated bit error rate is 1.5e-7. Also due to this confidence interval, one out of 10 margin verification tests can result in a false FAIL. Therefore when the first margin verification test fails, the test SHALL be redone once, so that the confidence interval becomes 0.99.
Because of the significant dependency of achievable data rates on the noise margin, margin verification tests are performed across several loop and noise scenarios of TR-114 to ensure that there is no optimization of margin or modem performance for some specific test loops.
Table 23 shows how the estimated BER SHALL be derived from the CRC count. Table 24contains the test procedure on margin verification.

VDSL2 Performance Test Plan TR-114 Issue 1
November 2009 © The Broadband Forum. All rights reserved. 44 of 144
Table 23: The equations for estimating BERModem configuration
Equations for estimating BER
Fast path 60* test_time*1000*data_rate
countCRC_error_*15
bitsed transmittofNumber
errorsbit ofNumber BER
Interleaved path,
high latency60* test_time*1000*data_rate
countCRC_error_*40
bitsed transmittofNumber
errorsbit ofNumber BER
Since CRC error counts are the basis of margin verification tests, it is necessary to verify if the DSLAM or CPE accurately counts and reports CRC errors. A mandatory test procedure to verify CRC error reporting is required and defined in section 8.1.
Table 24: Test procedure for margin verificationTest Configuration
1. Configure the SUT according to the settings of the profile-line combination under test defined in regional annexes (A and B).
2. Test configuration (test loops, noise conditions) shall be according to regional annexes (A.1.6, B.12 and B.13). Annex B testing consists of two test conditions randomly selected from the 3 described in the table for any given profile-line combination.
Method of Procedure
1. Configure CPE and DSLAM according to the band-profile as indicated in the regional annexes.
2. Connect CPE and DSLAM to first test loop option, with the noise injected at the specified reference power level. This power level is considered the 0 dB noise power level for that type of noise.
3. Force a new initialization and wait for modems to sync.
4. Wait for 2 minutes for bit swaps to settle.
5. Check reported margin and document as initial_reported_margin.
6. For CPE margin verification tests increase the noise power level by 1 dB at CPE side only.
7. For DSLAM margin verification tests increase the noise power level by 1 dB at DSLAM side only.
8. Wait for 1 minute.
9. Repeat steps 6 and 7 until the noise power is increased by min(initial_reported_margin – 1, target margin) dB. At this point the power level of the noise is at the min(initial_reported_margin – 1, target margin) dB level.
10. Execute a BER test for the duration as specified in each testcase. Record the CRC and SES counts at the start and the end of the BER test. Actual number of CRCs and SESs is the difference between these two counts. Document the estimated BER.
11. If the estimated BER > the limit value or the link re-initializes during steps 4-10 then the test for that loop option SHALL be repeated once.

VDSL2 Performance Test Plan TR-114 Issue 1
November 2009 © The Broadband Forum. All rights reserved. 45 of 144
12. Repeat steps 2 to 10 for every test loop.
Expected Result 1. The SUT passes the margin verification test, if for every test loop: Estimated BER is less than the limit value in the margin verification table of that loop option
2. If the estimated BER > the limit value or the link re-initializes during the second attempt, the test fails.
3. No SES has been reported
An explanation of the regional margin verification tables ( Table 89 − Table 94 ) is given below.
Column 1 of each table specifies the profile-line combination (e.g. BA8b_RA_F_150_150)
Column 2 specifies the loop length and type (e.g. 150m).
Column 3 specifies the crosstalk impairment (e.g. n_BA8b).
Column 4 specifies the anticipated data rate (kbps).
Column 5 It is required that the achieved DS(US) net data rate SHALL be recorded twice: first at the start of the margin verification test and also at the end of the margin verification test. This captures a potential modem retrain and connection at lower DS net data rates due to the increase in injected noise level. It is expected that the actual data rate is close to the anticipated data rate. If the actual data rate is ≤ 75% of the anticipated rate, the test duration SHALL be increased by the scale value.
rateactual
ratedanticipatevaluescale
The actual net data rate is not a pass/fail criteria of this test.
Column 6 specifies the required test time in order to observe approximately 10 CRC error events at a target BER of 1e-7. These test times are calculated based on the data rates in the corresponding performance requirements section. To allow for modem connections with slightly lower than the anticipated data rates, the test durations are rounded up in increments of 5 minutes.
Column 7 asks for the insertion of the measured DS(US) CRC count after the injected noise level has been increased by min(initial_reported_margin – 1, target margin) dB. Measurement of initial_reported_margin SHALL be done from the DSLAM.
Column 8 asks for the computation of the estimated BER from the number of observed CRC error events according toTable 23. If the estimated BER is smaller than the BER limit in this column, then the test PASSES, else it FAILS.

VDSL2 Performance Test Plan TR-114 Issue 1
November 2009 © The Broadband Forum. All rights reserved. 46 of 144
Column 9 asks for the insertion of “PASS” or “FAIL”.
8.3 Erasure decoding tests (optional)This test applies only to CPE modems that claims support of the erasure decoding. For a CPE that does not claim EDC support, the expected result SHALL be not applicable (“N/A”).
FORCEINP is a G.997.1 parameter that:
when set to ONE, indicates that the CPE receiver SHALL set the impulse noise protection according to the formula specified in G.993.2 section 9.6. The receiver SHALL ensure that the impulse noise protection is greater than or equal to the minimal impulse noise protection requirement. FORCEINP=1 is sometimes referred to as the "I don't trust you" mode.
when set to ZERO, indicates that the CPE receiver is not required to set the impulse noise protection according to the formula specified in G.993.2 section 9.6. The receiver SHALL ensure that the impulse noise protection is greater than or equal to the minimal impulse noise protection requirement. FORCEINP=0 is sometimes referred to as the "I do trust you" mode.
8.3.1 Erasure decoding testing in FORCEINP=1 mode

VDSL2 Performance Test Plan TR-114 Issue 1
November 2009 © The Broadband Forum. All rights reserved. 47 of 144
Table 25: Erasure decoding test in FORCEINP=1 mode Test Configuration 1. Configure the SUT according to the settings of the
interleaved band-profile under test defined in regional annexes (A and B) from Table 148. Additionally, the following parameters configured:
INP_min_ds= 2 and 4 symbols INP_min_us = 2 × INP_min_ds (4 and 8, respectively) delay_max = 8ms
2. Configure the loop simulator according to the band-profiles under test:
8d profile 1.2 kft 26 AWG loop (Region A) 17a and 12a profiles 450 m PE04 (Region B) 8b profiles - 1200 m PE04 (Region B) 8c profile - 600 m TP-100 loop (Region B)
3. Inject -120dBm/Hz noise at both ends of the loop4. The REIN noise impairment consists of pulses at a level of -90 dBm/Hz with a repetition rate of 120 Hz (Region A) or 100 Hz (Region B). Each pulse SHALL be a burst of pseudo random AWGN. The REIN noise is injected at the CPE side.5. Additional test conditions:
Ts = 250µs δ = 15 s is correction factor for pulse spreading in
AFE The OPTIONAL OLR functionality (SRA, SOS)
SHALL NOT be used Method of Procedure Configure the SUT in the FORCEINP=1 mode. For each
INP_min setting, do the following steps:1. Inject the background noise at both sides (including DSLAM
noise from the upstream adaptive rate test for the same loop length) and let the system train
2. Wait for 1 minute after initialization and report the actual INP, delay and data rate3. At CPE side apply for 3 minutes the REIN noise with a variable pulse width - δ + [(INP_min -1 )…(2 INP_min -3 )] Ts in steps of one Ts. Wait 3 minutes between the two measurements4. For each pulse width report the actual INP, actual interleaving delay and actual data rate and measure number of code violations in the 3 minute measurement interval
Expected Test Result For a CPE claiming support of Erasure Decoding, For each pulse width and each loop distance:
1. Reported number of downstream code violations 1 per minute
2. Actual INP INP_min and actual delay delay_max

VDSL2 Performance Test Plan TR-114 Issue 1
November 2009 © The Broadband Forum. All rights reserved. 48 of 144
Table 26: Short loop erasure decoding test FORCEINP=1 modePulse width (in steps of one Ts)
Actual downstream net data rate
Actual INP
Actual delay
Reported CVs
Pass/fail
INP_min = 2
1
INP_min = 4
3
4
5
Table 27: Long loop erasure decoding test FORCEINP=1 modePulse width (in steps of one Ts)
Actual downstream net data rate
Actual INP
Actual delay
Reported CVs
Pass/fail
INP_min = 2
1
INP_min = 4
3
4
5

VDSL2 Performance Test Plan TR-114 Issue 1
November 2009 © The Broadband Forum. All rights reserved. 49 of 144
8.3.2 Erasure decoding test procedure in FORCEINP=0 mode
Table 28: Erasure decoding test in FORCEINP=0 modeTest Configuration 1. Configure the SUT according to the settings of the interleaved
band-profile under test defined in regional annexes (A and B) from Table 148. Additionally, the following parameters SHALL be configured:
INP_min_ds= 2 and 4 symbols INP_min_us = 2 × INP_min_ds (4 and 8, respectively) delay_max = 8ms
2. Configure the loop simulator according to the band-profiles under test:
8d profile 1.2 kft 26 AWG loop (Region A) 17a and 12a profiles 450 m PE04 (Region B) 8b profiles - 1200 m PE04 (Region B) 8c profile - 600 m TP-100 loop (Region B)
3. Inject -120dBm/Hz noise at both ends of the loop4. The REIN noise impairment consists of pulses at a level of -90 dBm/Hz with a repetition rate of 120 Hz (Region A) or 100 Hz (Region B). Each pulse SHALL be a burst of pseudo random AWGN. The REIN noise is injected at the CPE side.5. Additional test conditions:
Ts = 250µs δ = 15 s is correction factor for pulse spreading in AFE The OPTIONAL OLR functionality (SRA, SOS) SHALL
NOT be used
Method of Procedure Configure the SUT in the FORCEINP=0 mode. For each INP_min setting, do the following steps:1. Inject the background noise at both sides (including DSLAM noise from the upstream adaptive rate test for the same loop length) and let the system train2. Wait for 1 minute after initialization and report the actual INP, delay and data rate3. At CPE side apply for 3 minutes the REIN noise with a pulse width (INP_min -1) Ts - δ4. Report the actual INP, actual interleaving delay and actual data rate and measure number of code violations in the 3 minute measurement interval
Expected Test Result For a CPE claiming support of Erasure Decoding1. Reported number of code violations 1 per minute 2. Actual INP INP_min and actual delay delay_max3. The data rate SHALL be higher than the achieved data rate for the same band-profile condition in FORCEINP=1 mode.
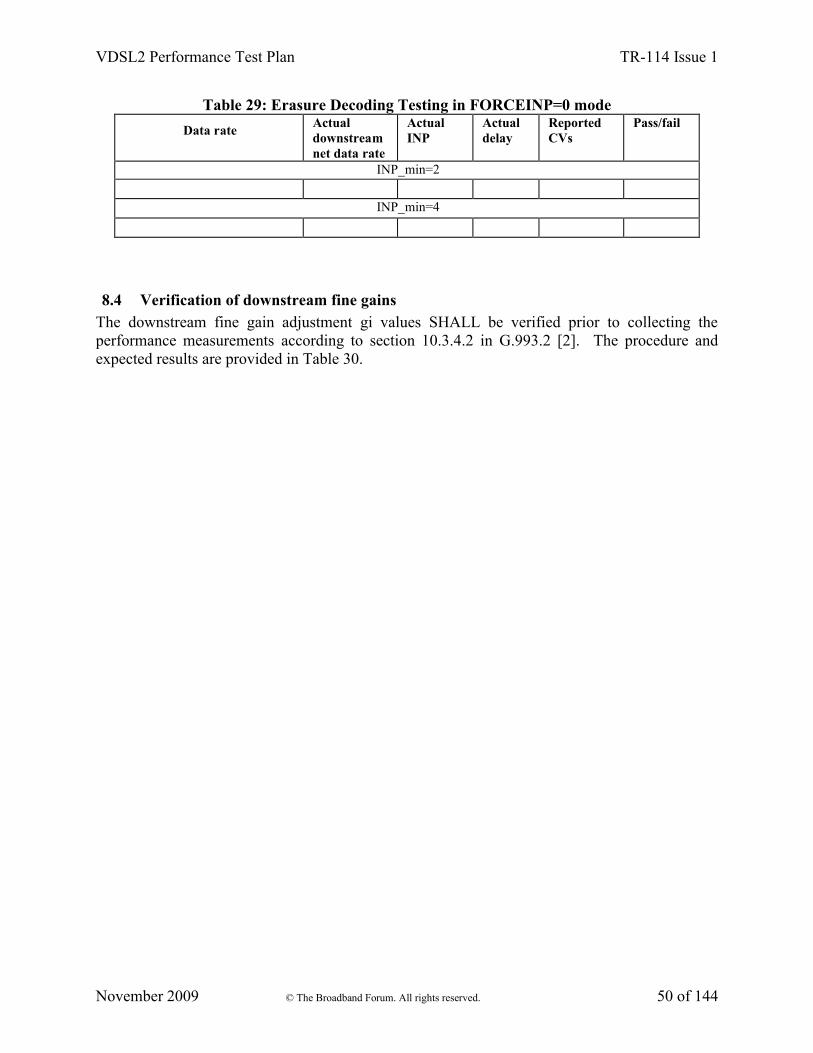
VDSL2 Performance Test Plan TR-114 Issue 1
November 2009 © The Broadband Forum. All rights reserved. 50 of 144
Table 29: Erasure Decoding Testing in FORCEINP=0 mode
Data rateActualdownstream net data rate
Actual INP
Actual delay
Reported CVs
Pass/fail
INP_min=2
INP_min=4
8.4 Verification of downstream fine gainsThe downstream fine gain adjustment gi values SHALL be verified prior to collecting the performance measurements according to section 10.3.4.2 in G.993.2 [2]. The procedure and expected results are provided in Table 30.

VDSL2 Performance Test Plan TR-114 Issue 1
November 2009 © The Broadband Forum. All rights reserved. 51 of 144
Table 30: Verification of downstream gi settings (bits, gains & NOMATP values)
Test Configuration 1. As per VDSL2 band-profile to be tested, configure the SUT with one of the profile-line combinations associated to that band-profile (see section 6.2.3). If, for the specific band-profile, profile-line combinations are defined with DPBO and/or UPBO enabled, these SHALL be applied.2. The DSLAM and CPE are connected in turn through TBD test loops.
Method of Procedure
1. Select randomly one test loop from the set 1.2. Train the modem. 3. Repeat steps 1 and 2 for one randomly selected loop from set 2.4. Repeat steps 1 and 2 for one randomly selected loop from set 3.
Expected Result to Pass
The gi settings (in the bits-and-gains table) SHALL comply with the following requirements:1. If bi > 0, then gi SHALL be in the [−14.5 to +2.5] (dB) range.2. If bi > 0, then the linear average of the gi
2’s in any band (as specified during the initialization procedure, see G.993.2 [2] §12.3.2) SHALL be 1.3. If bi = 0, then gi SHALL be equal to 0 (linear) or in the [−14.5 to 0] (dB) range.4. The value of NOMATPds defined as follows:
MREFPSD[ ]10 2
10 10MEDLEY set
NOMATP 10log 10log 10i
ii
f g
SHALL NOT exceed the CO-MIB parameter MAXNOMATPds and SHALL NOT exceed the maximum power specified for the VDSL2 profile from G.993.2 table 6-1.
8.5 Mixed Loop Impedance Testingfor further study.

VDSL2 Performance Test Plan TR-114 Issue 1
November 2009 © The Broadband Forum. All rights reserved. 52 of 144
9 Higher Layer Test Cases
9.1 PTM Throughput Test
This test applies only to VDSL2 modems that support the PTM-TC functionality (Annex K.3/G.993.2 [2]). Table 32 describes the test procedure for the PTM packet throughput test. Test setup is shown in Figure 2. PTM mode testing is specified for only two annex A, profile-line combinations Table 31 for the initial release of TR-114.
Table 31: Packet throughput test bitratesProfile-line
combinationDS bitrate (Mbps) US bitrate (Mbps) Loop Length (ft)
AA8d_ FX_I_040_006
40.4 5.7600
AA8d_ FX_I_027_002
27.0 2.02400
16 individual tests – 16 tests SHALL be passed
Table 32: Packet Throughput TestTest Configuration 1. The configuration SHALL be as shown in Figure 2,
depending on the customer interface of the modem.2. Set up the loop simulators at the specified loop lengths
26 AWG cable, or equivalent length 0.4 mm cable, with 24-self noise injected at the VTU-x under test (DSLAMor CPE).
3. Setup the traffic generator/analyzer to send Ethernet frames in both directions.
4. Configure both modems for PTM transport.

VDSL2 Performance Test Plan TR-114 Issue 1
November 2009 © The Broadband Forum. All rights reserved. 53 of 144
Method of Procedure 1. Configure the DSLAM to the profile line configuration forcing maximum and minimum rates to those in Table 9-1.
2. Let the CPE train.3. Setup traffic generator/analyzer to perform throughput test
for selected Ethernet frame length and connect rate.4. Set the throughput rate of the upstream direction to 50% of
the maximum FPS sustainable by the VDSL2 net data rate. 5. Test for the throughput in the downstream direction. Record
the downstream throughput rate as frames per second. The test SHALL be run for 120 seconds.
6. Set the throughput rate of the downstream direction to 50% of the maximum Ethernet frames sustainable by the VDSL2 downstream net data rate.
7. Repeat the test for throughput in the upstream direction. Record the upstream throughput rate as frames per second. The test SHALL be run for 120 seconds.
8. Divide the analyzer frames per second by the maximum PPS for the connect rate and frame size.
9. Record as percentage of maximum connect rate.Expected Result Based on the throughput tables: The percentage of FPS
achievable for all DSL modems SHALL be ≥ 95%.
Table 33: Throughput Test Results: Connect Rates DS: 40.4 Mbps US: 5.7 Mbps.Analyzer Recorded
Ethernet FPSMax FPS % of Max Pass/Fail
PacketSize
DS US DS US DS US DS US
64 73122 10316
256 19124 2698
1024 4836 682
1514 3275 462
Table 34: Throughput Test Results: Connect Rates DS: 27 Mbps US: 2 Mbps.Analyzer Recorded
Ethernet FPSMax FPS % of Max Pass/Fail
Packet Size
DS US DS US DS US DS US
64 48868 3619
256 12781 946
1024 3232 239
1514 2189 162

VDSL2 Performance Test Plan TR-114 Issue 1
November 2009 © The Broadband Forum. All rights reserved. 54 of 144
A Annex A Physical Layer Test Cases for G.993.2 Region A (North America)
A.1 Annex A specific test setup information
With reference to section 6.2 Table 35 indicates which test configuration shall be applied for tests related to the specific profiles associated with Annex A.
Table 35: Annex A test configurationType of VDSL2 deployment Band-profile Test configuration
VDSL2oPOTS AA8d Refer to Figure 1(configuration without splitters)
Listed are two known sources of variability that need to be taken into account when verifying the interoperability of a CPE and DSLAM combination.CPE Variability
For a modem type to be considered compliant, unit(s) submitted for compliance testing SHALLpass the performance requirements in this section. Taking into account the statistical variability in the manufacturing process, it is expected that the large majority of randomly-selected units will pass these requirements.
Bridged Tap Noise Injection Variability The noise injection method of the present version of the document for loops with bridge tap sections MAY lead to:
results differing from those on real loops, lower repeatability of results (due to, for example, varying noise floor and impedance)
from test environment to test environment even if they are compliant to this document.
The impact on the rate requirements contained herein and ways to improve test conditions are under study. A future version of this document MAY address this issue.
Following loops SHALL be used (ATIS-0600417 [5] cable models): 26-AWG variable length straight loop (6.3.2.1) 26-AWG loop with 26-AWG bridged tap segment and 50 ft 24-AWG segment at the
customer end of the loop (Figure 4)Note: Modems passing this test are not necessarily meeting the spectrum compatibility asdefined by ATIS-0600417 [5] for North America, or any other similar requirement specification. Users of this document SHOULD carry on additional testing to ensure spectral compatibility before deployment.
A.1.1 VDSL2 self-NEXT and FEXT

VDSL2 Performance Test Plan TR-114 Issue 1
November 2009 © The Broadband Forum. All rights reserved. 55 of 144
The VDSL2 near-end and far-end self-crosstalk (NEXT and FEXT) SHALL be based on the VDSL2 transmit level for noise calculations from Table 16 in section 6.3.3.1 and the loop transfer functions from ATIS-0600417 [5]
NEXT SHALL be calculated using the “Simplified Next Equation” from ATIS-0600417[5] section A.3.2.1.1. and the VDSL2 transmit level for the specified loop configuration, gauge, length and number of disturbers.
FEXT SHALL be calculated using the “Far end crosstalk” equation from ATIS-0600417[5] section A.3.2.2 and the VDSL2 transmit level for the specified loop configuration, gauge, length and number of disturbers.
Self-crosstalk at DSLAM is defined as NEXT from DS VDSL2 and FEXT from US VDSL2
Self- crosstalk at CPE is defined as NEXT from US VDSL2 and FEXT from DS VDSL2 US transmit level (noise PSD) assumes the use of simultaneous U0 and U1 and U2 US noise PSD in U0 is set to nominal level, i.e., mask – 3.5 dB, and assumes no UPBO US noise PSD in U1 and U2 assume UPBO, with the value of kl0 from Table 37 NEXT and FEXT component are numerically summed in linear units, not dB.
A.1.2 ADSL2plus NEXT and FEXT The ADSL2 near-end and far-end self-crosstalk (NEXT and FEXT) SHALL be based on the transmit level for noise calculations from Table 17 and Table 18 in section 6.3.3.1 and the loop transfer functions from ATIS-0600417 [5].
NEXT SHALL be calculated using the “Simplified Next Equation” from ATIS-0600417[5] section A.3.2.1.1 and the ADSL2plus transmit level for the specified loop configuration, gauge, length and number of disturbers.
FEXT SHALL be calculated using the “Far end crosstalk” equation from ATIS-0600417[5] section A.3.2.2 and the ADSL2plus transmit level for the specified loop configuration, gauge, length and number of disturbers.
ADSL2plus-crosstalk at the DSLAM is defined as NEXT from DS ADSL2plus and FEXT from US ADSL2plus
ADSL2plus-crosstalk at the CPE is defined as NEXT from US ADSL2plus and FEXT from DS ADSL2plus
ADSL2plus US and DS PSD is set to nominal level, i.e., mask – 3.5 dB, assume no cutback
ADSL2plus DS tones are: 33 – 511 ADSL2plus US tones are: 7 – 31 NEXT and FEXT component are numerically summed in linear units, not dB.
A.1.3 Annex A NoiseThe noise impairment for Annex A is defined as follows:
24 AA8d VDSL2-self + -140dBm/Hz AWGN 12 AA8d VDSL2-self + 12 ADSL2plus + -140dBm/Hz AWGN -140dBm/Hz AWGN

VDSL2 Performance Test Plan TR-114 Issue 1
November 2009 © The Broadband Forum. All rights reserved. 56 of 144
, where “+” expresses power sum.
Single sided noise injection shall be used to minimize the noise coupling through the loop simulator causing unrealistic noise conditions.
Common line settings for band profile AA8d.
Table 36: Upstream PBO settings for Annex A testingParameter Setting Description
UPBOKLF 1 CPE SHALL be forced to use the kl0 of the CO-MIB (UPBOKL) to compute the UPBO
UPBO setting for upstream performance requirements
UPBOA US0 40.00
UPBOB US0 0
A and B values US band 0
(These values imply no UPBO)
UPBOA US1 53 A value US band 1
UPBOB US1 21.2 B value US band 1
UPBOA US2 54 A value US band 2
UPBOB US2 18.7 B value US band 2
Table 37: UPBOKL for straight 26 AWG loop testing
Loop length (ft) UPBOKL (kl0)
300 2.32
600 4.64
900 6.97
1200 9.29
1600 12.39
2000 15.48
2400 18.58
2800 21.68
3200 24.78
3600 27.88
4000 30.97
4500 34.85
5500 42.59
6500 50.33
7500 58.08

VDSL2 Performance Test Plan TR-114 Issue 1
November 2009 © The Broadband Forum. All rights reserved. 57 of 144
8500 65.82
Table 38: UPBOKL for 26 AWG with BT loop testing
Loop length (ft) Bridge tap length (ft) UPBOKL (kl0)
300 20 2.32
600 100 4.64
900 200 6.97
1200 50 9.29
2000 100 15.48
2800 100 21.68
3200 200 24.78
4000 100 30.97
4500 50 34.85
5500 100 42.59
6500 100 50.33
7500 200 58.08
A.1.4 Pass/Fail Criteria for Annex A Testing
In addition to achieving the required rate, both downstream and upstream noise margin values are to be considered in determining the result of an individual section. It is acknowledged that achieving a desired noise margin is primarily the responsibility of the receiver. That is, the DSLAM is primarily responsible for achieving desired upstream noise margins, while the CPE is primarily responsible for achieving desired downstream noise margins. Table 39 outlines the pass/fail criteria on the reported noise margin.
Table 39: Noise margin pass/fail requirements Reported Noise Margin (dB) Requirement
< 4 On no test point≥ 4 and < 5 On at most 10% of the test points
≥ 5 On at least 90% of the test points ≥ 5.8 On at least 75% of the downstream test points
All measurements SHALL be from the DSLAM.
Overall pass/fail criteria for each adaptive rate testing is as follows: If any reported noise margin is less than 4dB, then the DSLAM/CPE pair fails the noise
margin requirements of that section.

VDSL2 Performance Test Plan TR-114 Issue 1
November 2009 © The Broadband Forum. All rights reserved. 58 of 144
If more than 10% of the reported noise margins are less than 5dB in a section, then the DSLAM/CPE pair fails the noise margin requirements of that section.
If more than 25% of the reported downstream noise margins are less than 5.8 dB in a section, then the DSLAM/CPE pair fails the noise margin requirements of that section.
If more than 10% of the net data rates are less than the data rate requirements in a section, then the DSLAM/CPE pair fails the data rate requirements of that section.
Overall pass/fail criteria for the fixed rate testing is as follows: If any of the reported noise margin is less than 5.8dB, then the DSLAM/CPE pair fails
the noise margin requirements If any of the data rates are less than the data rate requirements, then the DSLAM/CPE
pair fails the data rate requirements
If the DSLAM/CPE pair passes both the data rate and noise margin requirements, it passes the section; otherwise, it fails the section.
Table 40 lists the number of test points per section corresponding to the 10% and 25% limits mentioned above.
Table 40: Pass/fail criteria for rate adaptive testing
Section number Number of test cases 10% limit25% limit
(applies to downstream margins only)
A.2.1 32 3 4
A.2.2 24 2 3
A.1.5 Test cases for CRC error reporting verification test
Test loops and noise impairment for CRC error reporting verification test defined in section 8.1 are listed in Table 41
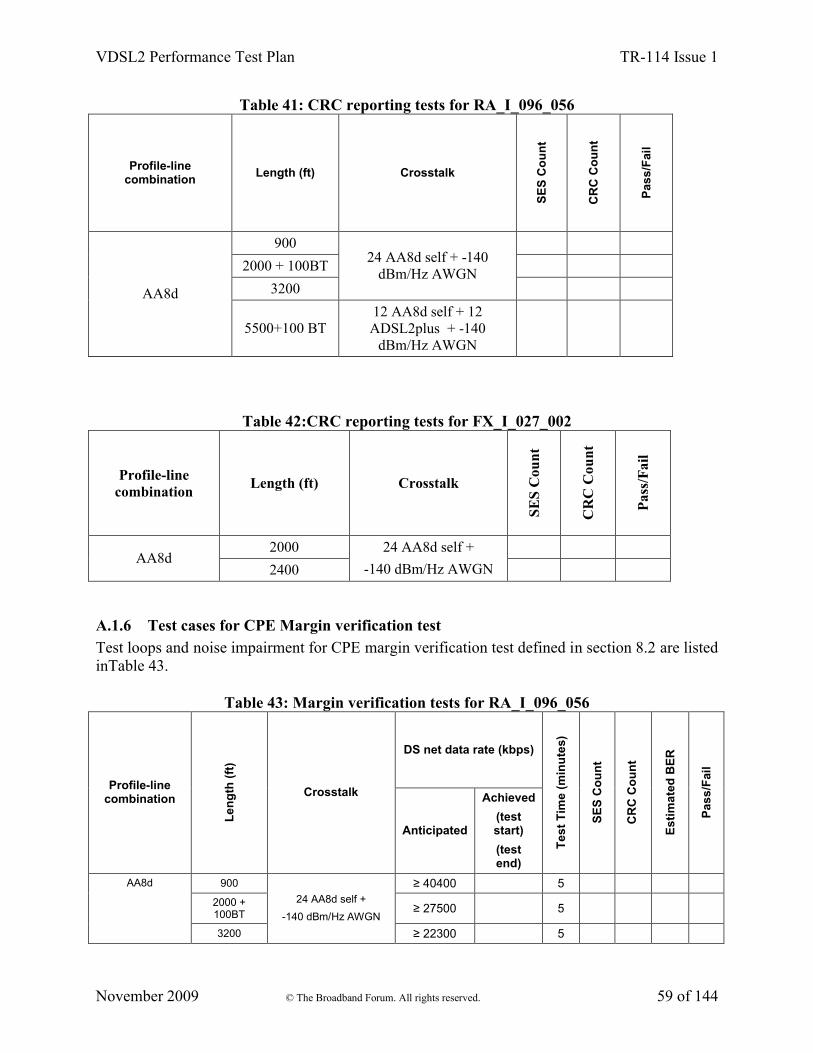
VDSL2 Performance Test Plan TR-114 Issue 1
November 2009 © The Broadband Forum. All rights reserved. 59 of 144
Table 41: CRC reporting tests for RA_I_096_056
Profile-linecombination
Length (ft) Crosstalk
SE
S C
ou
nt
CR
C C
ou
nt
Pa
ss
/Fai
l
900
2000 + 100BT
3200
24 AA8d self + -140 dBm/Hz AWGN
AA8d
5500+100 BT12 AA8d self + 12 ADSL2plus + -140
dBm/Hz AWGN
Table 42:CRC reporting tests for FX_I_027_002
Profile-linecombination
Length (ft) Crosstalk
SE
S C
oun
t
CR
C C
oun
t
Pas
s/F
ail
2000AA8d
2400
24 AA8d self +
-140 dBm/Hz AWGN
A.1.6 Test cases for CPE Margin verification test Test loops and noise impairment for CPE margin verification test defined in section 8.2 are listed inTable 43.
Table 43: Margin verification tests for RA_I_096_056
DS net data rate (kbps)
Profile-linecombination
Le
ng
th (
ft)
Crosstalk
Anticipated
Achieved
(test start)
(test end)
Te
st
Tim
e (
min
ute
s)
SE
S C
ou
nt
CR
C C
ou
nt
Es
tim
ate
d B
ER
Pa
ss
/Fai
l
900 ≥ 40400 5
2000 + 100BT ≥ 27500 5
AA8d
3200
24 AA8d self +
-140 dBm/Hz AWGN
≥ 22300 5

VDSL2 Performance Test Plan TR-114 Issue 1
November 2009 © The Broadband Forum. All rights reserved. 60 of 144
5500+100 BT
12 AA8d self +
12 ADSL2plus +
-140 dBm/Hz AWGN
≥ 4500 15
Note: Maximum BER is 1.5×10⁻⁷
Table 44 Margin verification tests for FX_I_027_002
DS net data rate (kbps)Profile-line
combinationLength (ft) Crosstalk
AnticipatedAchieved(test start)(test end)
Te
st
Tim
e
(min
ute
s)
SE
S C
ou
nt
CR
C C
ou
nt
Est
imat
ed B
ER
Pas
s/F
ail
2000 ≥ 27000 5
AA8d2400
24 AA8d self + -140 dBm/Hz
AWGN ≥ 27000 5
Note: Maximum BER is 1.5×10⁻⁷
Bi’s and gi’s SHALL be verified prior to collecting the performance measurements. The procedure and expected results are provided in Table 45.

VDSL2 Performance Test Plan TR-114 Issue 1
November 2009 © The Broadband Forum. All rights reserved. 61 of 144
Table 45: Verification of downstream gains bi/gi settings (bits, gains & NOMATP values)
Test Configuration 1. Configure the SUT in AA8d_RA_I_096_056 profile-line combination, with the UPBO settings from Table 36.2. The DSLAM and CPE are connected in turn through 3 randomly selected test loops (one from each of the sets below):set 1 (short loops): 600ft, 1200ft, 2400ftset 2 (medium loops): 3600ft, 4500ft, 6500ftset 3 (bridge tap loops): 2000ft + 100ft BT, 4000ft + 100ft BT, 7500ft + 200ft BT
Method of Procedure
Train the modem in the chosen testl oop and band-profile.Not sooner than two minutes after entering steady state operation (a.k.a. showtime), read from the DSLAM the bi and gi values.
Expected Result to Pass
The gi settings (in the bits-and-gains table) SHALL comply with the following requirements:1. If bi > 0, then gi SHALL be in the [−14.5 to +2.5] (dB) range.2. If bi > 0, then the linear average of the gi
2’s in any band (as specified during the initialization procedure, see G.993.2 [2] §12.3.2) SHALL be 1.3. If bi = 0, then gi SHALL be equal to 0 (linear) or in the [−14.5 to 0] (dB) range.4. The value of NOMATPds defined as follow
MREFPSD[ ]10 2
10 10MEDLEY set
NOMATP 10log 10log 10i
ii
f g
SHALL NOT exceed the CO-MIB parameter MAXNOMATPds and SHALL NOT exceed the maximum power specified for the VDSL2 profile 8d.
A.2 Performance tests for Band-Profile AA8d
A.2.1 Rate adaptive tests with straight loops 32 individual tests – 29 tests SHALL be passed

VDSL2 Performance Test Plan TR-114 Issue 1
November 2009 © The Broadband Forum. All rights reserved. 62 of 144
Table 46: Profile-line combination AA8d_RA_I_096_056
AA8d_RA_I_096_056
Downstream Upstream
Sync Rate (kbps) Sync Rate (kbps)
Loo
p L
engt
h
(ft,
26
AW
G lo
op)
Exp
ecte
d
Mea
sure
d
Pas
s/F
ail
Noi
se M
argi
n,
Rep
orte
d (
dB
)
Exp
ecte
d
Mea
sure
d
Pas
s/F
ail
Noi
se M
argi
n,
Rep
orte
d (
dB
)
Noise Profile: 24 AA8d self + -140 dBm/Hz AWGN300 48000 5500
600 43400 5800
900 40400 5700
1200 38200 5600
1600 36200 5500
2000 34100 5400
2400 31400 5300
2800 26300 4800
3200 22300 3200
3600 20300 1400
4000 16500 800
Noise Profile: 12 AA8d self + 12 ADSL2plus + -140 dBm/Hz AWGN
4500 13000 700
5500 8000 700
6500 5500 500
Noise Profile: -140 dBm/Hz AWGN
7500 6000 500
8500 3500 500

VDSL2 Performance Test Plan TR-114 Issue 1
November 2009 © The Broadband Forum. All rights reserved. 63 of 144
A.2.2 Rate adaptive tests with bridged tap loops
24 individual tests – 22 tests SHALL be passed
Table 47: Profile-line combination AA8d_RA_I_096_056AA8d_RA_I_096_056
Downstream UpstreamSync Rate (kbps) Sync Rate (kbps)
Len
gth
of
A(f
t, 26
AW
G lo
op)
Len
gth
of T
ap(f
t, 26
AW
G lo
op)
Exp
ecte
d
Mea
sure
d
Pas
s/F
ail
Noi
se M
argi
n,
Rep
orte
d (
dB
)
Exp
ecte
d
Mea
sure
d
Pas
s/F
ail
Noi
se M
argi
n,
Rep
orte
d (
dB
)
Noise profile: 24-self and -140dBm/Hz AWGN
300 20 41000 4500
600 100 36500 3500
900 200 33300 4200
1200 50 32000 4300
2000 100 27500 3200
2800 100 17500 2500
3200 200 16400 1800
4000 100 12300 800
Noise profile: 12-self + 12-ADSL2plus and -140dBm/Hz AWGN
4500 50 8700 700
5500 100 4500 600
6500 100 3500 600
Noise profile: -140dBm/Hz AWGN
7500 200 1000 400
A.2.3 Fixed rate tests with straight loopsFixed rate testing with noise associated with AA8d transmit power as described in section 6.3.3.1 The noise files associated with fixed rate testing SHALL be identical to those used for the same loop lengths in the adaptive rate testing above. The loop length dependent UPBO settings and kl0 method used for the adaptive rate testing SHALL be used for the fixed rate tests described in this section.
4 individual tests – 4 tests SHALL be passed

VDSL2 Performance Test Plan TR-114 Issue 1
November 2009 © The Broadband Forum. All rights reserved. 64 of 144
Table 48: Profile-line combination AA8d_FX_I_027_002AA8d_FX_I_027_002
Downstream UpstreamSync Rate (Mbps) Sync Rate (Mbps)
Loo
p L
engt
h(f
t, 2
6 A
WG
loop
)
Exp
ecte
d
Mea
sure
d
Rep
orte
dM
argi
n (
dB
)
Pas
s/F
ail
Exp
ecte
d
Mea
sure
d
Rep
orte
dM
argi
n (
dB
)
Pas
s/F
ail
Noise profile: 24-self and -140dBm/Hz AWGN2000 27 22400 27 2
4 individual tests – 4 tests SHALL be passed
Table 49: Profile-line combination AA8d_FX_I_014_001AA8d_FX_I_014_001
Downstream UpstreamSync Rate (Mbps) Sync Rate (Mbps)
Loo
p L
engt
h(f
t, 2
6 A
WG
loop
)
Exp
ecte
d
Mea
sure
d
Rep
orte
dM
argi
n
Pas
s/F
ail
Exp
ecte
d
Mea
sure
d
Rep
orte
dM
argi
n
Pas
s/F
ail
Noise profile: 24-self and -140dBm/Hz AWGN
3600 14 14000 14 1
A.3 REIN Testing for AA8dThe SUT shall be configured as described in section 6.2. The REIN test shall use a "burst of pseudo random AWGN" of 100us duration whose differential signal power spectral density is described below (formula A 1). The test procedure is described in Table 50. Reported data rate and noise margin SHALL NOT be considered in the pass/fail criteria.
Formula A 1: Annex A REIN Impulse PSD
Hzinis:
2.2;/150,102.2
log40116max
2.2/116
)(610
fwhere
MHzfHzdBmf
MHzfHzdBm
fNoiseREI

VDSL2 Performance Test Plan TR-114 Issue 1
November 2009 © The Broadband Forum. All rights reserved. 65 of 144
Table 50: REIN testing for AA8dTest Configuration 1. Configure the SUT in AA8d_RA_I_096_056 profile-line
combination, with the UPBO settings from Table 36.2. The DSLAM and CPE are connected in turn through 26 AWG straight loops: 1200ft and 4000ft.3. The crosstalk noise impairment as defined for the rate adaptive tests (Table 46) shall be applied at both DSLAM and CPE.4. The REIN noise impairment shall be applied at the CPE in addition to the crosstalk noise.5. Additional test conditions: optional OLR functionality (SRA, SOS) SHALL NOT be used
Method of Procedure For each INP_min setting, do the following steps:1. Inject the crosstalk impairment and let the system train.2. Wait for 3 minutes for bitswaps to settle.3. Record the net data rate and reported noise margin. 4. Apply the REIN impairment for 2 minutes and record the number of ES.5. Record the net data rate and reported noise margin.
Expected Test Result For each loop distance:1. Reported number of downstream code violations 2 per minute

VDSL2 Performance Test Plan TR-114 Issue 1
November 2009 © The Broadband Forum. All rights reserved. 66 of 144
A.4 Long Term Stability Testing for AA8d
This test applies only to VDSL2 modems that support the PTM-TC functionality.
A.4.1 Long Term Stability Test
Table 51: Long term stability test procedureTest Configuration 1. Configure the SUT for PTM transport in AA8d_FX_I_027_002
profile-line combination as defined in Table 10, with the UPBO settings from Table 36:The following parameters shall be indicated as follows:
TARSNMRds = 9 dB MAXSNRMds = 18 dB packet size: 1500 bytes
2. The loop simulator SHALL be configured to 2,000 feet, 26 AWG, no bridged tap.3. Inject -140 dBm/Hz white noise from 26 kHz to 8.5 MHz at both ends of the loop.
Method of Procedure
1. Train the CPE with the DSLAM2. Wait for 1 minute after initialization3.Check the reported margin and document as the initial reported margin.4. Adjust the noise level at the CPE side until the reported CPE-side margin is approximately 9 dB. 5. Configure the traffic generator/analyzer to provide MAC frames, both upstream and downstream, at a rate 85% the full bit-rate of the channel.6. Run for four hours with constant noise level.7. If there are more than 2 ES, then the measurement SHALL be extended for up to an additional four-hour period (for a maximum of 8 hours).
Expected Result 1. The customer end modem SHALL NOT lose synchronization at any time during the test.2. If during any 4 hour sliding window there are fewer than 3 ES then the CPE passes the test.
A.5 Fluctuating Noise Testing
This test applies only to VDSL2 modems that support the PTM-TC functionality.

VDSL2 Performance Test Plan TR-114 Issue 1
November 2009 © The Broadband Forum. All rights reserved. 67 of 144
Table 52: Fluctuating noise test Test Configuration 1. Configure the SUT for PTM transport in AA8d_FX_I_027_002
profile-line combination as defined in Table 10, with the UPBO settings from Table 36.2. The DSLAM and CPE are connected in turn through 2kft 26 AWG straight loop.3. The AWGN noise at -140dBm/Hz in frequency range from 26 kHz to 8.5MHz shall be applied at both DSLAM and CPE.4. The following parameters shall be indicated as follows:
Ethernet frame size without FCS: 1514 bytes TARSNRMds = 10dB MAXSNRMds = 18dB
5. Additional test conditions: optional OLR functionality (SRA, SOS) SHALL NOT be used. .
Method of Procedure
1. Inject the noise impairment and let the CPE and DSLAM train.
2. Wait for 2 minute for bitswaps to settle and record the reported downstream margin as the initial reported margin.
3. Adjust the AWGN level at the CPE side until the reported margin is approximately 10dB. This noise level is termed NL10.
4. Configure the traffic generator/analyzer to provide MAC frames, both upstream and downstream, at a rate 95% of the net data rate.
5. Run the SUT for two minutes with noise level NL10.6. Increase the noise level at the CPE side by 4dB (NL6), and
without re-training run the SUT for 2 minutes.7. Set the noise injected at the CPE side to -140dBm/Hz, and
without re-training run the SUT for 2 minutes.8. Set the noise injected at the CPE side to NL10 level, and
without re-training run the SUT for 2 minutes.9. Perform steps 6 through 8 a total of five times (total
duration: 2x3x5 minutes = 30 minutes)Note: To avoid the unintended generation of noise impulses, the noise levels SHALL be changed rapidly within a period of 250 microseconds or less. The noise generator SHALL maintain approximately flat spectrum throughout the transition in noise level.
Expected Result 1. The CPE modem SHALL NOT lose synchronization at any time during the test.
2. For the duration of the entire 30 minute test, no more than four packet errors SHALL occur.

VDSL2 Performance Test Plan TR-114 Issue 1
November 2009 © The Broadband Forum. All rights reserved. 68 of 144
B Annex B Physical Layer Test Cases for G.993.2 Region B (Europe)
B.1 Annex B-specific Test Setup Information
With reference to section “6.2.1 Band Profiles” Table 53 indicates which test configurations SHALL be applied for tests related to specific band-profiles associated to VDSL2oPOTS or VDSL2oISDN deployments:
Table 53: Annex B test configurations
Type of VDSL2 deployment Band-profile Test configuration
BA8b
BA8c_D&UPBO
BA12a
BA17a
Refer to Figure 1
(configuration without splitters)
VDSL2 over POTS
(VDSL2oPOTS)
BA17a D&UPBO
BB8b
BB12a
BB17a
VDSL2 over ISDN
(VDSL2oISDN)
BB17a D&UPBO
Refer to Figure 3
(configuration with splitters)
The specific SUT’s settings as defined in 6.2 SHALL be used.
B.1.1 Pass/fail criteria for Annex B testing
Tests SHALL be performed according to the general procedure described in section 8. Testing is defaulted to no PBO unless specified in specific test procedure.
For sections with more than 3 test loops, if more than 10% of the net data rates are less than the data rate requirements in a section, then the DSLAM/CPE pair fails the data rate requirements of that section.
For sections with less than 4 test loops, the data rate requirement is indicated per table.
In addition to achieving the required rate, both downstream and upstream noise margin values are to be considered in determining the result of an individual section. It is acknowledged that achieving a desired noise margin is primarily the responsibility of the receiver. That is, the DSLAM is primarily responsible for achieving desired upstream noise margins, while the CPE is primarily responsible for achieving desired downstream noise margins. Table 54 outlines the pass/fail criteria on the reported noise margin.

VDSL2 Performance Test Plan TR-114 Issue 1
November 2009 © The Broadband Forum. All rights reserved. 69 of 144
Table 54: Noise margin pass/fail requirements
Reported Noise Margin (dB) Requirement
< 5 On no test point≥ 5 and < 5.8 On at most 10% of the test points
≥ 5.8 On at least 90% of the test points
All values SHALL be collected at the DSLAM.
Overall pass/fail criteria for each rate adaptive test are as follows: If any reported noise margin is less than 5 dB, then the DSLAM/CPE pair fails the noise
margin requirements of that section. If more than 10% of the reported noise margins are less than 5.8 dB in a section, then the
DSLAM/CPE pair fails the noise margin requirements of that section. If more than 10% of the data rates are less than the data rate requirements in a section,
then the DSLAM/CPE pair fails the data rate requirements of that section. If the DSLAM/CPE pair passes both the data rate and noise margin requirements, it
passes the section; otherwise, it fails the section.
Table 55 lists the number of test points per section or table corresponding to the 10% limit mentioned above.
Table 55: Pass/fail criteria for rate adaptive testing
Section number Number of test cases 10% limit
B.2. 20 2
B.3. 16 2
B.5 20 2
B.6 16 2B.7 16 2
B.9 16 2
B.10 20 2
Section number Number of test cases (per table) 10% limit (per table)
B.4 6 1
B.8 6 1
B.1.2 Noise impairments The noise is specified in TS101271 [6] and includes the crosstalk noise and the white noise (NEXT noise generator G1, FEXT noise generator G2 and the white noise generator G4).
The noise injection SHALL be calibrated as defined in TS101271 [6].
Noise generators G1 and G2 are injected on one side at a time.
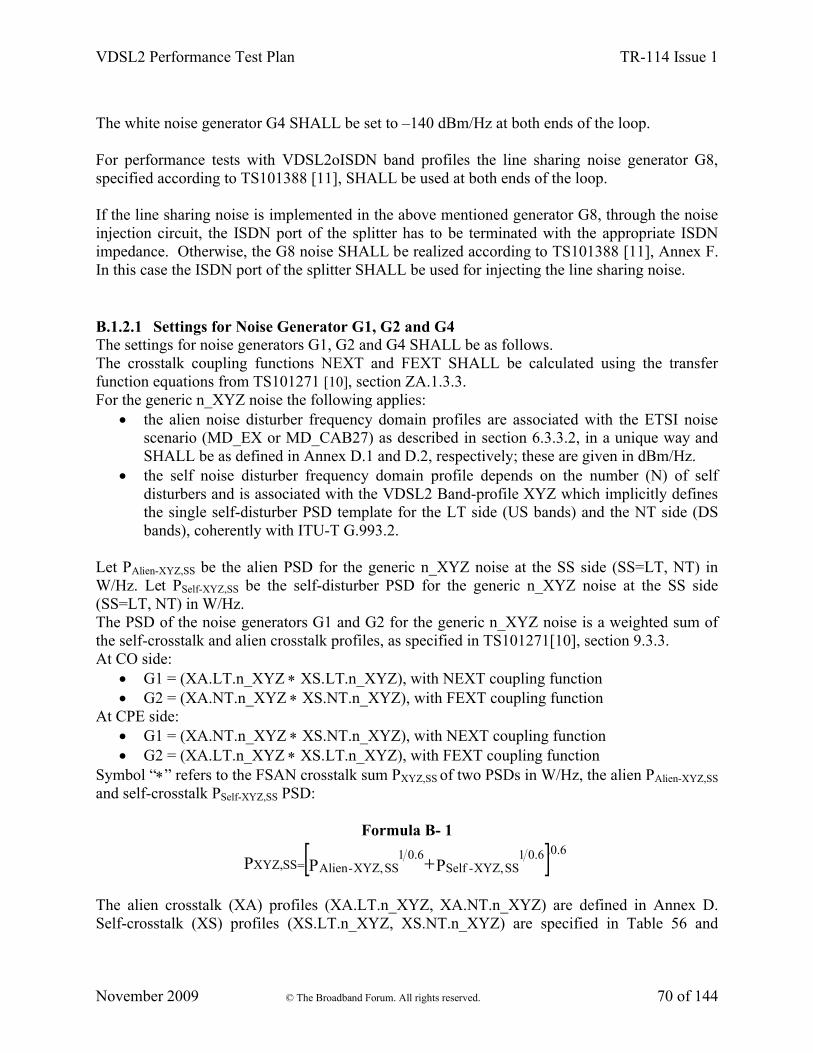
VDSL2 Performance Test Plan TR-114 Issue 1
November 2009 © The Broadband Forum. All rights reserved. 70 of 144
The white noise generator G4 SHALL be set to –140 dBm/Hz at both ends of the loop.
For performance tests with VDSL2oISDN band profiles the line sharing noise generator G8,specified according to TS101388 [11], SHALL be used at both ends of the loop. If the line sharing noise is implemented in the above mentioned generator G8, through the noise injection circuit, the ISDN port of the splitter has to be terminated with the appropriate ISDN impedance. Otherwise, the G8 noise SHALL be realized according to TS101388 [11], Annex F. In this case the ISDN port of the splitter SHALL be used for injecting the line sharing noise.
B.1.2.1 Settings for Noise Generator G1, G2 and G4The settings for noise generators G1, G2 and G4 SHALL be as follows.The crosstalk coupling functions NEXT and FEXT SHALL be calculated using the transfer function equations from TS101271 [10], section ZA.1.3.3.For the generic n_XYZ noise the following applies:
the alien noise disturber frequency domain profiles are associated with the ETSI noise scenario (MD_EX or MD_CAB27) as described in section 6.3.3.2, in a unique way and SHALL be as defined in Annex D.1 and D.2, respectively; these are given in dBm/Hz.
the self noise disturber frequency domain profile depends on the number (N) of self disturbers and is associated with the VDSL2 Band-profile XYZ which implicitly defines the single self-disturber PSD template for the LT side (US bands) and the NT side (DS bands), coherently with ITU-T G.993.2.
Let PAlien-XYZ,SS be the alien PSD for the generic n_XYZ noise at the SS side (SS=LT, NT) in W/Hz. Let PSelf-XYZ,SS be the self-disturber PSD for the generic n_XYZ noise at the SS side (SS=LT, NT) in W/Hz. The PSD of the noise generators G1 and G2 for the generic n_XYZ noise is a weighted sum of the self-crosstalk and alien crosstalk profiles, as specified in TS101271[10], section 9.3.3.At CO side:
G1 = (XA.LT.n_XYZ XS.LT.n_XYZ), with NEXT coupling function G2 = (XA.NT.n_XYZ XS.NT.n_XYZ), with FEXT coupling function
At CPE side: G1 = (XA.NT.n_XYZ XS.NT.n_XYZ), with NEXT coupling function G2 = (XA.LT.n_XYZ XS.LT.n_XYZ), with FEXT coupling function
Symbol “” refers to the FSAN crosstalk sum PXYZ,SS of two PSDs in W/Hz, the alien PAlien-XYZ,SS
and self-crosstalk PSelf-XYZ,SS PSD:
Formula B- 1
PPP SSXYZ,-Self6.01
SSXYZ,-Alien6.01
SSXYZ,6.0.
The alien crosstalk (XA) profiles (XA.LT.n_XYZ, XA.NT.n_XYZ) are defined in Annex D. Self-crosstalk (XS) profiles (XS.LT.n_XYZ, XS.NT.n_XYZ) are specified in Table 56 and

VDSL2 Performance Test Plan TR-114 Issue 1
November 2009 © The Broadband Forum. All rights reserved. 71 of 144
describe the self-crosstalk portion of an equivalent disturber co-located at the LT and NT end of the loop.
Table 56: Power calculation of the XS profiles LT and NT MD_EX MD_CAB27 19self_BA8c
XS.LT.n_XYZ PSingleSelf-XYZ,LT + 6.68dB PSingleSelf-XYZ,LT + 7.06dB PSingleSelf-XYZ,LT + 7.67dBXS.NT.n_XYZ PSingleSelf-XYZ,NT + 6.68dB PSingleSelf-XYZ,NT + 7.06dB PSingleSelf-XYZ,NT + 7.67dB
The values 6.68 dB, 7.06dB and 7.67 dB simulate the power generated by the sum of 13, 15 and 19 disturbers, which is added to the single self-disturber PSD PSingleSelf-XYZ,SS for the generic n_XYZ noise at the SS side (SS=LT, NT).
The following clause specifies the method of computation that applies for the single self-disturber PSD PSingleSelf-XYZ,SS. The basic PSD template corresponds to the associated VDSL2 Band-profile XYZ as per ITU-T G.993.2/Amd.1, sections B.2.4 and B.2.5 and is defined in accordance with the ITU-T G.993.2/Amd.1, section B.4. This is considered constant regardless of the loop length corresponding to the specific test point. The single self-disturber PSD PSingleSelf-XYZ, SS is always defined for the complete frequency spectrum as given by the Band-profile configuration. No power reallocation to lower frequencies is taken into account as the loop length increases from one test point to the next.
The following steps SHALL be applied: identify the basic PSD template that corresponds to the associated VDSL2 Band-profile
XYZ. where required, apply to the above basic PSD template the DPBO and UPBO shaping of the associated VDSL2 Band-profile XYZ to calculate a shaped PSD template
Note: for upstream shaped PSD templates the kl0 value varies with the test point apply a flattening operation that consists in lowering all the highest levels of the above
shaped PSD template down such that the power in all bands under the resulting template (all-bands) is less or equal, within a 0.1 dBm difference, to the MAXNOMATP of the associated VDSL2 Band-profile XYZ (as per Table 6-1/G.993.2), both for upstream and downstream. The calculated flattened PSD template corresponds to the PSingleSelf-XYZ,SS
B.2 Rate adaptive performance tests for BA8b
Noise n_BA8b settings as defined in section 6.3.3.2
Data rate criterion: 20 individual tests – 18 tests SHALL be passed

VDSL2 Performance Test Plan TR-114 Issue 1
November 2009 © The Broadband Forum. All rights reserved. 72 of 144
Table 57: Performance tests with BA8b_RA_F_150_150BA8b_RA_F_150_150
Downstream UpstreamSync Rate (kbps) Sync Rate (kbps)
Loo
p L
engt
h(m
, PE
0.4m
m lo
op)
Exp
ecte
d
Mea
sure
d
Pas
s/F
ail
Noi
se
Mar
gin
, R
epor
ted
(d
B)
Exp
ecte
d
Mea
sure
d
Pas
s/F
ail
Noi
se M
argi
n,
Rep
orte
d (
dB
)
150 44192 9488300 40712 8292750 27076 57601200 17328 3281800 8380 148
Table 58: Performance tests with BA8b_RA_I_150_150.BA8b_RA_I_150_150
Downstream UpstreamSync Rate (kbps) Sync Rate (kbps)
Loo
p L
engt
h(m
, PE
0.4m
m lo
op)
Exp
ecte
d
Mea
sure
d
Pas
s/F
ail
Noi
se M
argi
n,
Rep
orte
d (
dB
)
Exp
ecte
d
Mea
sure
d
Pas
s/F
ail
Noi
se M
argi
n,
Rep
orte
d (
dB
)
150 41792 8900
300 37928 7888
750 28196 5792
1200 16828 368
1800 7792 200
B.3 Rate adaptive performance tests for BA12aNoise n_BA12a settings as defined in section 6.3.3.2.
Data rate criterion:16 individual tests – 14 tests SHALL be passed

VDSL2 Performance Test Plan TR-114 Issue 1
November 2009 © The Broadband Forum. All rights reserved. 73 of 144
Table 59: Performance tests with BA12a_RA_F_150_150BA12a_RA_F_150_150
Downstream UpstreamSync Rate (kbps) Sync Rate (kbps)
Loo
p L
engt
h(m
, PE
0.4m
m lo
op)
Exp
ecte
d
Mea
sure
d
Pas
s/F
ail
Noi
se M
argi
n,
Rep
orte
d (
dB
)
Exp
ecte
d
Mea
sure
d
Pas
s/F
ail
Noi
se M
argi
n,
Rep
orte
d (
dB
)
150 44728 23056450 34332 156841050 20172 21841500 13096 640
Table 60: Performance tests with BA12a_RA_I_150_150BA12a_RA_I_150_150
Downstream UpstreamSync Rate (kbps) Sync Rate (kbps)
Loo
p L
engt
h(m
, PE
0.4m
m lo
op)
Exp
ecte
d
Mea
sure
d
Pas
s/F
ail
Noi
se M
argi
n,
Rep
orte
d (
dB
)
Exp
ecte
d
Mea
sure
d
Pas
s/F
ail
Noi
se M
argi
n,
Rep
orte
d (
dB
)
150 42696 21112
450 33896 15188
1050 19956 2216
1500 12584 632
B.4 Rate adaptive performance tests for BA17a
Noise n_BA17a settings as defined in section 6.3.3.2.
Data rate criterion: 6 individual tests – 5 tests SHALL be passed
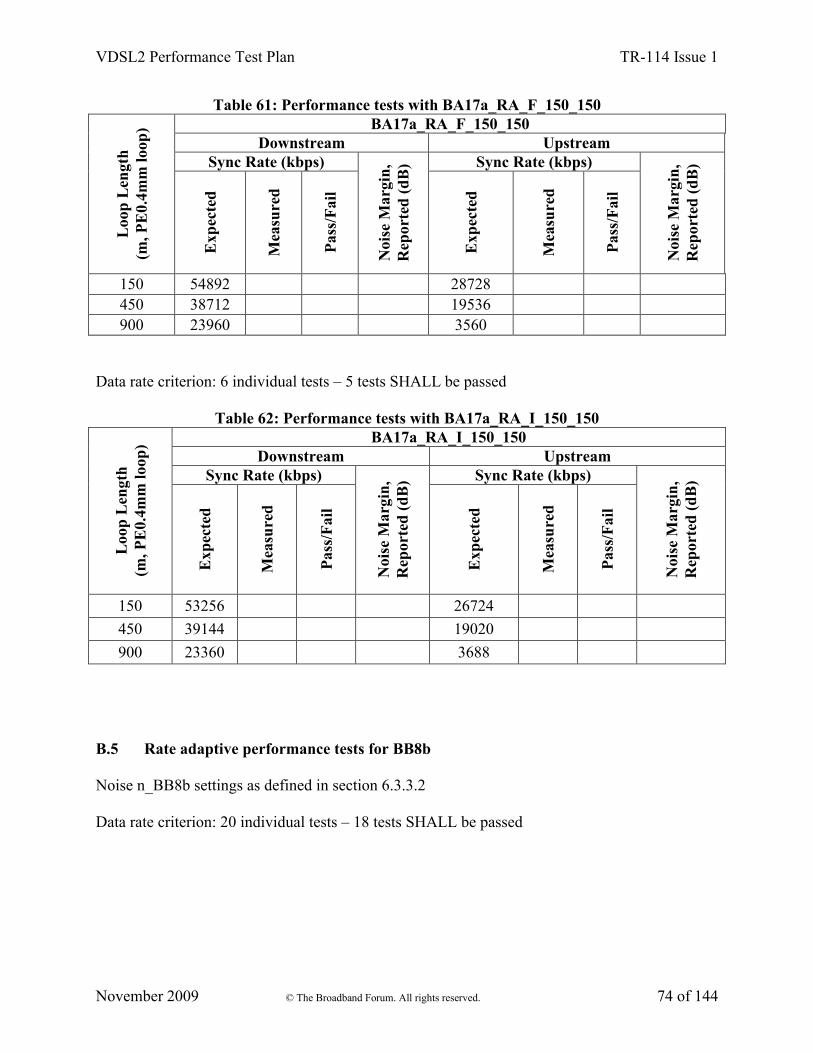
VDSL2 Performance Test Plan TR-114 Issue 1
November 2009 © The Broadband Forum. All rights reserved. 74 of 144
Table 61: Performance tests with BA17a_RA_F_150_150BA17a_RA_F_150_150
Downstream UpstreamSync Rate (kbps) Sync Rate (kbps)
Loo
p L
engt
h(m
, PE
0.4m
m lo
op)
Exp
ecte
d
Mea
sure
d
Pas
s/F
ail
Noi
se M
argi
n,
Rep
orte
d (
dB
)
Exp
ecte
d
Mea
sure
d
Pas
s/F
ail
Noi
se M
argi
n,
Rep
orte
d (
dB
)
150 54892 28728450 38712 19536900 23960 3560
Data rate criterion: 6 individual tests – 5 tests SHALL be passed
Table 62: Performance tests with BA17a_RA_I_150_150BA17a_RA_I_150_150
Downstream UpstreamSync Rate (kbps) Sync Rate (kbps)
Loo
p L
engt
h(m
, PE
0.4m
m lo
op)
Exp
ecte
d
Mea
sure
d
Pas
s/F
ail
Noi
se M
argi
n,
Rep
orte
d (
dB
)
Exp
ecte
d
Mea
sure
d
Pas
s/F
ail
Noi
se M
argi
n,
Rep
orte
d (
dB
)
150 53256 26724
450 39144 19020
900 23360 3688
B.5 Rate adaptive performance tests for BB8b
Noise n_BB8b settings as defined in section 6.3.3.2
Data rate criterion: 20 individual tests – 18 tests SHALL be passed

VDSL2 Performance Test Plan TR-114 Issue 1
November 2009 © The Broadband Forum. All rights reserved. 75 of 144
Table 63: Performance tests with BB8b_RA_F_150_150BB8b_RA_F_150_150
Downstream UpstreamSync Rate (kbps) Sync Rate (kbps)
Loo
p L
engt
h(m
, PE
0.4m
m lo
op)
Exp
ecte
d
Mea
sure
d
Pas
s/F
ail
Noi
se M
argi
n,
Rep
orte
d (
dB
)
Exp
ecte
d
Mea
sure
d
Pas
s/F
ail
Noi
se M
argi
n,
Rep
orte
d (
dB
)
150 43360 9928300 38368 8616750 26608 62081200 13040 6161800 4576 368
Table 64: Performance tests with BB8b_RA_I_150_150BB8b_RA_I_150_150
Downstream UpstreamSync Rate (kbps) Sync Rate (kbps)
Loo
p L
engt
h(m
, PE
0.4m
m lo
op)
Exp
ecte
d
Mea
sure
d
Pas
s/F
ail
Noi
se M
argi
n,
Rep
orte
d (
dB
)
Exp
ecte
d
Mea
sure
d
Pas
s/F
ail
Noi
se M
argi
n,
Rep
orte
d (
dB
)
150 40528 9304
300 36812 8284
750 27736 6128
1200 13976 600
1800 5320 420
B.6 Rate adaptive performance tests for BB12aNoise n_BB12a settings as defined in section 6.3.3.2.
Data rate criterion: 16 individual tests – 14 tests SHALL be passed

VDSL2 Performance Test Plan TR-114 Issue 1
November 2009 © The Broadband Forum. All rights reserved. 76 of 144
Table 65: Performance tests with BB12a_RA_F_150_150BB12a_RA_F_150_150
Downstream UpstreamSync Rate (kbps) Sync Rate (kbps)
Loo
p L
engt
h(m
, PE
0.4m
m lo
op)
Exp
ecte
d
Mea
sure
d
Pas
s/F
ail
Noi
se M
argi
n,
Rep
orte
d (
dB
)
Exp
ecte
d
Mea
sure
d
Pas
s/F
ail
Noi
se M
argi
n,
Rep
orte
d (
dB
)
150 43772 22166450 33704 158041050 17080 20881500 10008 652
Table 66: Performance tests with BB12a_RA_I_150_150BB12a_RA_I_150_150
Downstream UpstreamSync Rate (kbps) Sync Rate (kbps)
Loo
p L
engt
h(m
, PE
0.4m
m lo
op)
Exp
ecte
d
Mea
sure
d
Pas
s/F
ail
Noi
se M
argi
n,
Rep
orte
d (
dB
)
Exp
ecte
d
Mea
sure
d
Pas
s/F
ail
Noi
se M
argi
n,
Rep
orte
d (
dB
)
150 39928 20364
450 32828 15316
1050 17184 2600
1500 10384 680
B.7 Rate adaptive performance tests for BB17a
Noise n_BB17a settings as defined in section 6.3.3.2.
Data rate criterion: 16 individual tests – 14 tests SHALL be passed

VDSL2 Performance Test Plan TR-114 Issue 1
November 2009 © The Broadband Forum. All rights reserved. 77 of 144
Table 67: Performance tests with BB17a_RA_F_150_150BB17a_RA_F_150_150
Downstream UpstreamSync Rate (kbps) Sync Rate (kbps)
Loo
p L
engt
h(m
, PE
0.4m
m lo
op)
Exp
ecte
d
Mea
sure
d
Pas
s/F
ail
Noi
se M
argi
n,
Rep
orte
d (
dB
)
Exp
ecte
d
Mea
sure
d
Pas
s/F
ail
Noi
se M
argi
n,
Rep
orte
d (
dB
)
150 55676 20768450 35616 146441050 15968 20561500 8544 648
Table 68: Performance tests with BB17a_RA_I_150_150BB17a_RA_I_150_150
Downstream UpstreamSync Rate (kbps) Sync Rate (kbps)
Loo
p L
engt
h(m
, PE
0.4m
m lo
op)
Exp
ecte
d
Mea
sure
d
Pas
s/F
ail
Noi
se M
argi
n,
Rep
orte
d (
dB
)
Exp
ecte
d
Mea
sure
d
Pas
s/F
ail
Noi
se M
argi
n,
Rep
orte
d (
dB
)
150 53520 21392
450 38276 14228
1050 15628 2536
1500 9164 684
B.8 Rate adaptive performance tests for BA17a with DPBO and UPBO
The basic BA17a Band Profile SHALL be applied with the following modifications to the “Common Line Settings” specified in Table 11 to define the new shaped-PSD Band Profile BA17a_D&UPBO:
Table 69: Common Line Settings for BA17a_D&UPBO Band ProfileParameter Setting DescriptionAll parameters but those specified below
Value as specified in Table 11

VDSL2 Performance Test Plan TR-114 Issue 1
November 2009 © The Broadband Forum. All rights reserved. 78 of 144
DPBOEPSDADSL2plus Annex
APSD mask that is assumed to be permitted at the exchange
DPBOESEL 27dB@1MHz E-side electrical length
DPBOESCMA 0.1924Model of the frequency dependent loss of E-side cable: scalars DPBOESCMA (NOTE)
DPBOESCMB 0.5960Model of the frequency dependent loss of E-side cable: scalars DPBOESCMB (NOTE)
DPBOESCMC 0.2086Model of the frequency dependent loss of E-side cable: scalars DPBOESCMC (NOTE)
DPBOMUS -95 dBm/Hz Minimum usable receive signal PSD mask
DPBOFMIN 138 kHzMinimum frequency from which on the DPBO SHALL be applied
DPBOFMAX 2208 kHzMaximum frequency up to which the DPBO SHALL be applied
UPBOKLF 0Force CO-MIB electrical loop length(means that kl0 is estimated during training)
UPBOKLestimated during
trainingUpstream electrical loop length (kl0)
UPBOA US0 40.00A and B values US band 0(These values imply no UPBO)
UPBOB US0 0UPBOA US1 47.30 A value US band 1UPBOB US1 21.14 B value US band 1UPBOA US2 54.00 A value US band 2UPBOB US2 16.29 B value US band 2UPBOA US3 54.00 A value US band 3UPBOB US3 16.29 B value US band 3NOTE: the values of DPBOESCMA, B and C are referred to a PE 0.4mm loop. Values that are configured according to G.997.1 SHALL be rounded to the nearest scalar value.
The following Profile-line combinations SHALL be configured on the equipment under test:
Table 70: Profile-line combinations for BA17a_D&UPBOProfile-line combination Band-profile Specific line-setting
BA17a_D&UPBO_RA_F_150_150 BA17a_D&UPBO RA_F_150_150
BA17a_D&UPBO_RA_I_150_150 BA17a_D&UPBO RA_I_150_150
The noise model n_BA17a_D&UPBO defined in the following SHALL be used, which is coherent with the noise models framework specified in section 6.3.3.2:

VDSL2 Performance Test Plan TR-114 Issue 1
November 2009 © The Broadband Forum. All rights reserved. 79 of 144
Table 71: Noise model n_BA17a_D&UPBO
Noise modelAssociated
band-profileSelf noise disturbers Alien noise disturbers
n_BA17a_D&UPBO BA17a_D&UPBO MD_Cab27ETSI MD_Cab27
Table 141 Annex D.2
For this Band Profile the value of kl0 (UPBOKL) is estimated by the SUTs during training. The PSD of a single self-disturber SHALL be deterministically defined by the settings of Table 69above using as klo values for calculation of the single self-disturber PSD are listed in Table 72.
Table 72: kl0 for calculation of the single self-disturber PSD for BA17a_D&UPBOLoop Length
(m, PE0.4mm loop)kl0 (UPBOKL)(dB @ 1MHz)
150 3.7
450 11.1
900 22.3
Data rate criterion: 6 individual tests – 5 tests SHALL be passed
Table 73: Performance tests with BA17a_D&UPBO_RA_F_150_150BA17a_D&UPBO_RA_F_150_150
Downstream UpstreamSync Rate (kbps) Sync Rate (kbps)
Loo
p L
engt
h(m
, PE
0.4m
m lo
op)
Exp
ecte
d
Mea
sure
d
Pas
s/F
ail
Noi
se M
argi
n,
Rep
orte
d (
dB
)
Exp
ecte
d
Mea
sure
d
Pas
s/F
ail
Noi
se M
argi
n,
Rep
orte
d (
dB
)150 51336 19596
450 37744 16172
900 19700 3968
Data rate criterion: 6 individual tests – 5 tests SHALL be passed

VDSL2 Performance Test Plan TR-114 Issue 1
November 2009 © The Broadband Forum. All rights reserved. 80 of 144
Table 74: Performance tests with BA17a_D&UPBO_RA_I_150_150BA17a_D&UPBO_RA_I_150_150
Downstream UpstreamSync Rate (kbps) Sync Rate (kbps)
Loo
p L
engt
h(m
, PE
0.4m
m lo
op)
Exp
ecte
d
Mea
sure
d
Pas
s/F
ail
Noi
se M
argi
n,
Rep
orte
d (
dB
)
Exp
ecte
d
Mea
sure
d
Pas
s/F
ail
Noi
se M
argi
n,
Rep
orte
d (
dB
)
150 51728 20080
450 37924 15748
900 18828 4184
B.9 Rate adaptive performance tests for BB17a with DPBO and UPBO
The basic BB17a Band Profile SHALL be applied with the following modifications to the “Common Line Settings” specified in Table 11 to define the new shaped-PSD Band Profile BB17a_D&UPBO:

VDSL2 Performance Test Plan TR-114 Issue 1
November 2009 © The Broadband Forum. All rights reserved. 81 of 144
Table 75: Common Line Settings for BB17a_D&UPBO Band ProfileParameter Setting Description
All parameters but those specified below
Value as specified in
Table 11
DPBOEPSDADSL2plus
Annex BPSD mask that is assumed to be permitted at the exchange
DPBOESEL 27dB@1MHz E-side electrical length
DPBOESCMA 0.1924Model of the frequency dependent loss of E-side cable: scalars DPBOESCMA (NOTE)
DPBOESCMB 0.5960Model of the frequency dependent loss of E-side cable: scalars DPBOESCMB (NOTE)
DPBOESCMC 0.2086Model of the frequency dependent loss of E-side cable: scalars DPBOESCMC (NOTE)
DPBOMUS -95 dBm/Hz Minimum usable receive signal PSD mask
DPBOFMIN 254 kHzMinimum frequency from which on the DPBO SHALLbe applied
DPBOFMAX 2208 kHzMaximum frequency up to which the DPBO SHALLbe applied
UPBOKLF 0Force CO-MIB electrical loop length(means that kl0 is estimated during training)
UPBOKLestimated during
trainingUpstream electrical loop length (kl0)
UPBOA US0 40.00UPBOB US0 0
A and B values US band 0 (these values imply no UPBO)
UPBOA US1 47.30 A value US band 1 UPBOB US1 21.14 B value US band 1UPBOA US2 54.00 A value US band 2UPBOB US2 16.29 B value US band 2NOTE: the values of DPBOESCMA, B and C are referred to a PE 0.4mm loop. Values that are configured according to G.997.1 SHALL be rounded to the nearest scalar value.
The following Profile-line combinations SHALL be configured on the equipment under test:
Table 76: Profile-line combinations for BB17a_D&UPBOProfile-line combination Band-profile Specific line-setting
BB17a_D&UPBO_RA_F_150_150 BB17a_D&UPBO RA_F_150_150BB17a_D&UPBO_RA_I_150_150 BB17a_D&UPBO RA_I_150_150
The noise model n_BB17a_D&UPBO defined in the following SHALL be used, which is coherent with the noise models framework specified in section 6.3.3.2:

VDSL2 Performance Test Plan TR-114 Issue 1
November 2009 © The Broadband Forum. All rights reserved. 82 of 144
Table 77: Noise model n_BB17a_D&UPBO
Noise modelAssociated
band-profileSelf noise disturbers
Alien noise disturbers
n_BB17a_D&UPBO BB17a_D&UPBO MD_Cab27ETSI MD_Cab27
Table 141Annex D.2
As for this Band Profile the value of kl0 (UPBOKL) is estimated by the SUTs during training, the PSD of a single self-disturber SHALL be deterministically defined by the settings of Table 75above using as klo values for calculation of the single self-disturber PSD are listed in Table 78..
Table 78: kl0 for calculation of the single self-disturber PSD for BB17a_D&UPBOLoop Length (m, PE0.4mm loop) kl0 (UPBOKL) (dB)
150 3.7450 11.11050 26.01500 37.1
Data rate criterion: 16 individual tests – 14 tests SHALL be passed
Table 79: Performance tests with BB17a_D&UPBO_RA_F_150_150BB17a_D&UPBO_RA_F_150_150
Downstream UpstreamSync Rate (kbps) Sync Rate (kbps)
Loo
p L
engt
h(m
, PE
0.4m
m lo
op)
Exp
ecte
d
Mea
sure
d
Pas
s/F
ail
Noi
se M
argi
n,
Rep
orte
d (
dB
)
Exp
ecte
d
Mea
sure
d
Pas
s/F
ail
Noi
se M
argi
n,
Rep
orte
d (
dB
)150 54716 16668450 37212 148521050 11304 25841500 2648 772

VDSL2 Performance Test Plan TR-114 Issue 1
November 2009 © The Broadband Forum. All rights reserved. 83 of 144
Table 80: Performance tests with BB17a_D&UPBO_RA_I_150_150BB17a_D&UPBO_RA_I_150_150
Downstream UpstreamSync Rate (kbps) Sync Rate (kbps)
Loo
p L
engt
h(m
, PE
0.4m
m lo
op)
Exp
ecte
d
Mea
sure
d
Pas
s/F
ail
Noi
se M
argi
n,
Rep
orte
d (
dB
)
Exp
ecte
d
Mea
sure
d
Pas
s/F
ail
Noi
se M
argi
n,
Rep
orte
d (
dB
)
150 53036 16152
450 39724 14424
1050 10920 30161500 2952 756
B.10 Rate adaptive performance tests for BA8c with DPBO and UPBOThe basic BA8c Band Profile SHALL be applied with the following modifications to the “Common Line Settings” specified in Table 11 to define the new shaped-PSD Band Profile BA8c_D&UPBO:
Table 81: Common Line Settings for BA8c_D&UPBO Band Profile
Parameter Setting Description
All parameters but those specified below
Value as specified in Table 11
DPBOEPSD ADSL2plus Annex APSD mask that is assumed to be permitted at the exchange
DPBOESEL 27dB@1MHz E-side electrical length
DPBOESCMA 0.4218Model of the frequency dependent loss of E-side cable: scalars DPBOESCMA (f^0) - G.997.1 form = 364
DPBOESCMB 0.8136Model of the frequency dependent loss of E-side cable: scalars DPBOESCMB (f^0.5) - G.997.1 form = 464
DPBOESCMC 0.4417Model of the frequency dependent loss of E-side cable: scalars DPBOESCMC (f) - G.997.1 form = 369
DPBOMUS -101.5 dBm/Hz Minimum usable receive signal PSD mask
DPBOFMIN 138 kHzMinimum frequency from which on the DPBO SHALL be applied
DPBOFMAX 2208 kHzMaximum frequency up to which the DPBO SHALLbe applied
UPBOKLF 0 Force CO-MIB electrical loop length

VDSL2 Performance Test Plan TR-114 Issue 1
November 2009 © The Broadband Forum. All rights reserved. 84 of 144
(means that kl0 is estimated during training)
UPBOKLestimated during
trainingUpstream electrical loop length (kl0)
UPBOA US0 40.00UPBOB US0 0
A and B values US band 0 (these values imply no UPBO)
UPBOA US1 60 A value US band 1UPBOB US1 17 B value US band 1NOTE: the values of DPBOESCMA, B and C are referred to a PE 0.4mm loop @ 300kHz. Values that are configured according to G.997.1 SHALL be rounded to the nearest scalar value.
The following Profile-line combinations SHALL be configured on the EUT:
Table 82: BA8c D&UPBO testing descriptionsProfile-line combination Band-profile Specific line-setting
BA8c_D&UPBO_RA_I_150_150 BA8c_D&UPBO RA_I_150_150BA8c_D&UPBO_RA_F_150_150 BA8c_D&UPBO RA_F_150_150
The noise model n_BA8c_D&UPBO defined in the following table SHALL be used:
Table 83: Noise model n_BA8c_D&UPBO
Noise modelAssociated
band-profileSelf noise disturbers Alien noise disturbers
n_BA8c_D&UPBO BA8c_D&UPBO 19self_BA8c none
In the table above the 19 self BA8c noise scenario corresponds to 19 self disturbers. The associated self noise disturber frequency domain profiles SHALL be calculated as described inB.1.2.1.
As for this Band Profile the value of kl0 (UPBOKL) is estimated by the SUTs during training, the PSD of a single self-disturber SHALL be deterministically defined by the settings of Table 84 as kl0 values for calculation of the single self-disturber PSD are listed in Table 81. The UPBOKLE shall be reported.
Table 84: kl0 for calculation of the single self-disturber PSD for BA8c_D&UPBOLoop Length
(m, TP-100 loop)kl0 (UPBOKL)(dB @ 1MHz)
150 2.7450 8.11050 18.91200 21.71500 27.0
Data rate criterion: 20 individual tests – 18 tests SHALL be passed

VDSL2 Performance Test Plan TR-114 Issue 1
November 2009 © The Broadband Forum. All rights reserved. 85 of 144
Table 85: Performance tests with BA8c_D&UPBO_RA_F_150_150
BA8c_D&UPBO_RA_F_150_150
Downstream Upstream
Sync Rate (kbps) Sync Rate (kbps)
Loo
p L
engt
h
(m, T
P-1
00 lo
op)
Exp
ecte
d
Mea
sure
d
Pas
s/F
ail
Noi
se M
argi
n,
Rep
orte
d (
dB
)
Exp
ecte
d
Mea
sure
d
Pas
s/F
ail
Noi
se M
argi
n,
Rep
orte
d (
dB
)
Rep
orte
d U
PB
OK
LE
150 25450 8850450 22800 88001050 15700 47001200 12950 37501500 10050 750
Table 86: Performance tests with BA8c_D&UPBO_RA_I_150_150
BA8c_D&UPBO_RA_F_150_150
Downstream Upstream
Sync Rate (kbps) Sync Rate (kbps)
Loo
p L
engt
h
(m, T
P-1
00 lo
op)
Exp
ecte
d
Mea
sure
d
Pas
s/F
ail
Noi
se M
argi
n,
Rep
orte
d (
dB
)
Exp
ecte
d
Mea
sure
d
Pas
s/F
ail
Noi
se M
argi
n,
Rep
orte
d (
dB
)
Rep
orte
d U
PB
OK
LE
150 23600 8200450 21100 82501050 14650 47001200 12400 37501500 9150 700
B.11 VDSL2oPOTS and VDSL2oISDN test cases for CRC error reporting verification test
CRC verification testing for Region B SHALL be performed in rate adaptive mode according to section 8.1. Testing consists of two test conditions randomly selected from the 3 described in the

VDSL2 Performance Test Plan TR-114 Issue 1
November 2009 © The Broadband Forum. All rights reserved. 86 of 144
tables for any given profile-line combination. Test loops and noise impairment for CRC error reporting verification test defined in section 8.1 are listed in Table 87 and Table 88.
Table 87: VDSL2oPOTS test cases for CRC error reporting verification testProfile-line
combinationLoop length and type Noise impairment SES
CountCRC Count
Pass/Fail
150 m750 mBA8b_RA_F_150_150
1800 m0.4mm PE n_BA8b
150 m750 mBA8b_RA_I_150_150
1800 m0.4mm PE n_BA8b
150 m1050 m
BA8c_D&UPBO_RA_F_150_150
1500 mTP-100 n_BA8c_D&UPBO
150 m1050 m
BA8c_D&UPBO_RA_I_150_150
1500 mTP-100 n_BA8c_D&UPBO
150 m1050 mBA12a_RA_F_150_1501500 m
0.4mm PE n_BA12a
150 m1050 mBA12a_RA_I_150_1501500 m
0.4mm PE n_BA12a
150 m450 mBA17a_RA_F_150_150900 m
0.4mm PE n_BA17a
150 m450 mBA17a_RA_I_150_150900 m
0.4mm PE n_BA17a
150 m450 m
BA17a_D&UPBO_RA_F_150_150
900 m0.4mm PE n_BA17a_D&UPBO
150 m450 m
BA17a_D&UPBO_RA_I_150_150
900 m0.4mm PE n_BA17a_D&UPBO
Table 88: VDSL2oISDN test cases for CRC error reporting verification test
Profile-line combinationLoop length and
typeNoise impairment
SESCount
CRCCount
Pass/Fail
150 m750 mBB8b_RA_F_150_150
1800 m
0.4mm PE
n_BB8b
150 m750 mBB8b_RA_I_150_150
1800 m
0.4mm PE
n_BB8b
150 m1050 mBB12a_RA_F_150_1501500 m
0.4mm PE
n_BB12a
150 mBB12a_RA_I_150_1501050 m
0.4mm PE
n_BB12a

VDSL2 Performance Test Plan TR-114 Issue 1
November 2009 © The Broadband Forum. All rights reserved. 87 of 144
1500 m150 m
1050 mBB17a_RA_F_150_1501500 m
0.4mm PE
n_BB17a
150 m1050 mBB17a_RA_I_150_1501500 m
0.4mm PE
n_BB17a
150 m1050 mBB17a_D&UPBO_RA_F_150_1501500 m
0.4mm PE
n_BB17a_D&UPBO
150 m1050 mBB17a_D&UPBO_RA_I_150_1501500 m
0.4mm PE
n_BB17a_D&UPBO
B.12 VDSL2oPOTS and VDSL2oISDN test cases for downstream margin verification test
Downstream margin verification testing for Region B SHALL be performed in rate adaptive mode according to section 8.2 and Table 89, Table 90 and Table 91. Testing consists of two test conditions randomly selected from the 3 described in the tables for any given profile-line combination.
Table 89: Downstream Margin verification for VDSL2oPOTS (0.4mm PE)
DS net data rate (kbps)
Profile-line combination
Len
gth
(m
)
Crosstalk
Anticipated
Achieved(test start)
(test end)
Tes
t T
ime
(min
ute
s)
SE
S C
ou
nt
CR
C C
ou
nt
Est
imat
ed B
ER
Pas
s/F
ail
300 ≥ 40712 5
1200 ≥ 17880 5BA8b_RA_F_150_150
1800
n_BA8b
≥ 8380 5
300 ≥ 37928 5
1200 ≥ 16828 5BA8b_RA_I_150_150
1800
n_BA8b
≥ 7792 10
150 ≥ 44728 5
1050 ≥ 20172 5BA12a_RA_F_150_150
1500
n_BA12a
≥ 13552 5
150 ≥ 42696 5
1050 ≥ 19956 5BA12a_RA_I_150_150
1500
n_BA12a
≥ 12584 10
150 ≥ 54892 5
450 ≥ 38712 5BA17a_RA_F_150_150
900
n_BA17a
≥ 23960 5

VDSL2 Performance Test Plan TR-114 Issue 1
November 2009 © The Broadband Forum. All rights reserved. 88 of 144
150 ≥ 53256 5
450 ≥ 39144 5BA17a_RA_I_150_150
900
n_BA17a
≥ 23360 5
150 ≥ 51336 5
450 ≥ 39348 5BA17a_D&UPBO_RA_F_150_150
900
n_BA17a_D&UPBO
≥ 19700 5
150 ≥ 51728 5
450 ≥ 37924 5BA17a_D&UPBO_RA_I_150_150
900
n_BA17a_D&UPBO
≥ 18828 5
Table 90: Downstream margin verification for VDSL2oPOTS (TP-100)
DS net data rate (kbps)
Profile-line combination Length (m) Crosstalk
AnticipatedAchieved
(test start)(test end)
Tes
t T
ime
(min
ute
s)
SE
S C
oun
t
CR
C C
oun
t
Est
imat
ed B
ER
Pas
s/F
ail
150 ≥ 25450 51050 ≥ 15700 5BA8c_D&UPBO_RA_F_150_1501500
n_BA8c≥ 10050 5
150 ≥ 23600 51050 ≥ 14650 5BA8c_D&UPBO _RA_I_150_1501500
n_BA8c≥ 9150 10
Table 91: Downstream margin verification (0.4mm PE)
DS net data rate (kbps)
Profile-line combination
Len
gth
(m
)
Crosstalk
Anticipated
Achieved(test start)
(test end)
Tes
t T
ime
(min
ute
s)
SE
S C
oun
t
CR
C C
oun
t
Est
imat
ed B
ER
Pas
s/F
ail
300 ≥ 38368 5
1200 ≥ 13040 5
BB8b_RA_F_150_150
1800
n_BB8b
≥ 4576 10
300 ≥ 36812 5
1200 ≥ 13976 5
BB8b_RA_I_150_150
1800
n_BB8b
≥ 5320 15
450 ≥ 33704 5
1050 ≥ 17080 5
BB12a_RA_F_150_150
1500
n_BB12a
≥ 10008 5
BB12a_RA_I_150_150 450 n_BB12a ≥ 32828 5

VDSL2 Performance Test Plan TR-114 Issue 1
November 2009 © The Broadband Forum. All rights reserved. 89 of 144
1050 ≥ 17184 5
1500 ≥ 10384 10
450 ≥ 35616 5
1050 ≥ 15968 5
BB17a_RA_F_150_150
1500
n_BB17a
≥ 8544 5
450 ≥ 38276 5
1050 ≥ 15628 5
BB17a_RA_I_150_150
1500
n_BB17a
≥ 9164 10
150 ≥ 54716 5
1050 ≥ 11304 5
BB17a_D&UPBO_RA_F_150_150
1500
n_BB17a_D&UPBO
≥ 2648 10
150 ≥ 53036 5
1050 ≥ 10920 10
BB17a_D&UPBO_RA_I_150_150
1500
n_BB17a_D&UPBO
≥ 2952 25
B.13 VDSL2oPOTS and VDSL2oISDN test cases for upstream margin verification test (optional)
Upstream margin verification testing for Region B SHALL be performed in rate adaptive mode according to section 8.2 with parameters provided in Table 92, Table 93 and Table 94. Testing consists of two test conditions randomly selected from the 3 described in the tables for any given profile-line combination. Note: The upstream rate reach performance numbers assume that margin verification can be passed.
Table 92: Upstream margin verification for VDSL2oPOTS (0.4mm PE)
US net data rate (kbps)
Profile-line combination
Len
gth
(m
)
Crosstalk
Anticipated
Achieved(test start)(test end)
Tes
t T
ime
(min
ute
s)
SE
S C
oun
t
CR
C C
oun
t
Est
imat
ed B
ER
Pas
s/F
ail
300 ≥ 8292 5750 ≥ 5760 5
BA8b_RA_F_150_1501200
n_BA8b≥ 328
40 (note
3)300 ≥ 7888 10750 ≥ 5792 15
BA8b_RA_I_150_1501200
n_BA8b≥ 368
55 (note
2)150 ≥ 23056 51050 ≥ 2412 15BA12a_RA_F_150_1501500
n_BA12a≥ 640 40

VDSL2 Performance Test Plan TR-114 Issue 1
November 2009 © The Broadband Forum. All rights reserved. 90 of 144
150 ≥ 21112 51050 ≥ 2216 35
BA12a_RA_I_150_1501500
n_BA12a≥ 632
55 (note
3)150 ≥ 28728 5450 ≥ 19536 5BA17a_RA_F_150_150900
n_BA17a≥ 3560 10
150 ≥ 26724 5450 ≥ 19020 5BA17a_RA_I_150_150900
n_BA17a≥ 3688 20
150 ≥ 19596 5450 ≥ 16172 5
BA17a_D&UPBO_RA_F_150_150
900n_BA17a_D&UPBO
≥ 3968 10150 ≥ 20080 5450
≥ 15748 5BA17a_D&UPBO_RA_I_150_1
50900
n_BA17a_D&UPBO
≥ 4184 20
Note 2: Due to the low data rates under this loop and noise condition, the observation of 10 error events takes a very long time (at BER ~ 1e-7). To accelerate testing, the desired number of observed error events is reduced to 3. To remain consistent with previous confidence levels of estimated BER, the range of allowed estimated BER is increased from 1.5e-7 to 2e-7. Note 3: Due to the low data rates under this loop and noise condition, the observation of 10 error events takes a very long time To accelerate testing, the desired number of observed error events is reduced to 5. To remain consistent with previous confidence levels of estimated BER, the range of allowed estimated BER is increased from 1.5e-7 to 1.75e-7.
Table 93: Upstream Margin verification for VDSL2oPOTS (TP-100)
US net data rate (kbps)
Profile-line combination Length (m) Crosstalk
Anticipated
Achieved(test start)(test end)
Tes
t T
ime
(min
ute
s)
SE
S C
oun
t
CR
C C
oun
t
Est
imat
ed B
ER
Pas
s/F
ail
150 ≥ 8850 51050 ≥ 4700 10BA8c_D&UPBO_RA_F_150_1501500
n_BA8c≥ 750 35
150 ≥ 8200 101050 ≥ 4700 15
BA8c_D&UPBO_RA_I_150_1501500
n_BA8c≥ 700
50 (note
4)
Note 4: Due to the low data rates under this loop and noise condition, the observation of 10 error events takes a very long time (at BER ~ 1e-7). To accelerate testing, the desired number of observed error events is reduced to 5. To remain consistent with previous confidence levels of estimated BER, the range of allowed estimated BER is increased from 1.5e-7 to 1.75e-7.

VDSL2 Performance Test Plan TR-114 Issue 1
November 2009 © The Broadband Forum. All rights reserved. 91 of 144
Table 94: Upstream Margin Verification for VDSL2oISDN(0.4mm PE)
US net data rate (kbps)
Profile-line combination
Len
gth
(m
)
CrosstalkAnticipated Achieved
(test start)(test end)
Tes
t T
ime
(min
ute
s)
SE
S C
oun
t
CR
C C
oun
t
Est
imat
ed B
ER
Pas
s/F
ail
300 ≥ 8832 5
750 ≥ 6208 5
BB8b_RA_F_150_150
1200
n_BB8b
≥ 616 45
300 ≥ 8284 10
750 ≥ 6128 15
BB8b_RA_I_150_150
1200
n_BB8b
≥ 600 60 (note
5)
450 ≥ 15804 5
1050 ≥ 2320 15
BB12a_RA_F_150_150
1500
n_BB12a
≥ 652 40
450 ≥ 15316 5
1050 ≥ 2600 30
BB12a_RA_I_150_150
1500
n_BB12a
≥ 680 50 (note
5)
450 ≥ 14644 5
1050 ≥ 2264 15
BB17a_RA_F_150_150
1500
n_BB17a
≥ 648 40
450 ≥ 14228 5
1050 ≥ 2536 30
BB17a_RA_I_150_150
1500
n_BB17a
≥ 684 50 (note
5)
150 ≥ 16668 5
1050 ≥ 2800 10
BB17a_D&UPBO_RA_F_150_150
1500
n_BB17a_D&UPBO
≥ 772 35
150 ≥ 16152 5
1050 ≥ 3016 25
BB17a_D&UPBO_RA_I_150_150
1500
n_BB17a_D&UPBO
≥ 756 45 (note
5)
Note 5: Due to the low data rates under this loop and noise condition, the observation of 10 error events takes a very long time (at BER ~ 1e-7). To accelerate testing, the desired number of
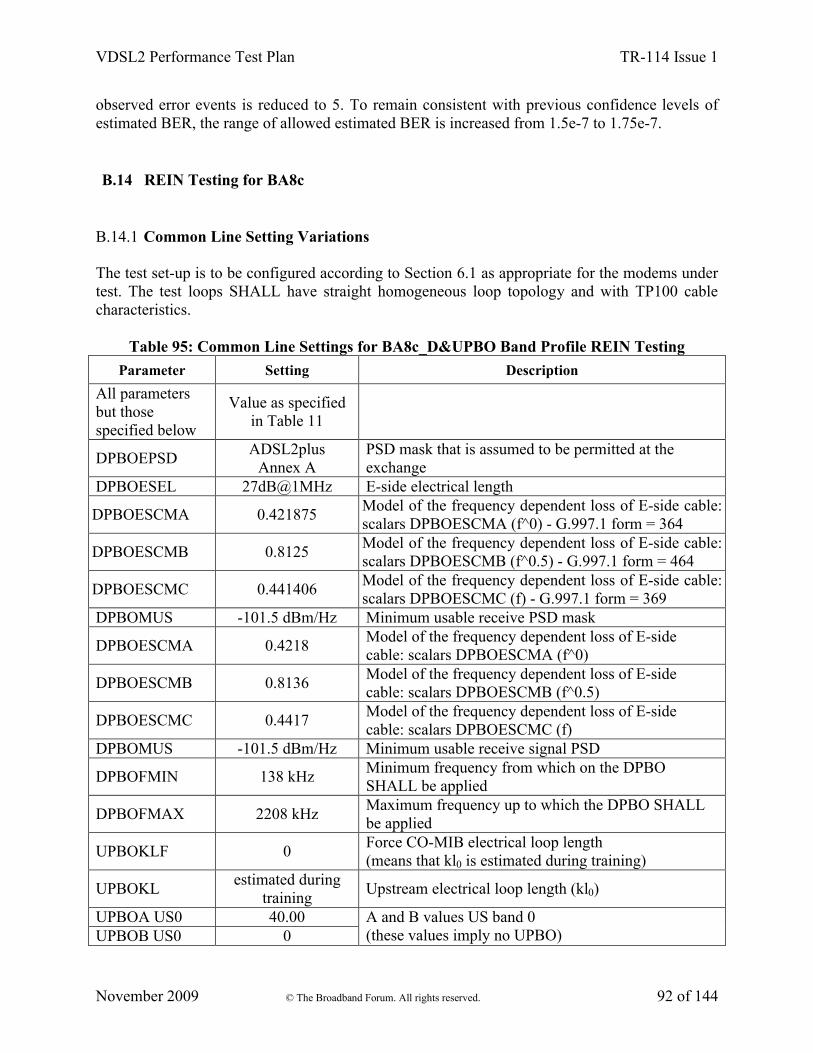
VDSL2 Performance Test Plan TR-114 Issue 1
November 2009 © The Broadband Forum. All rights reserved. 92 of 144
observed error events is reduced to 5. To remain consistent with previous confidence levels of estimated BER, the range of allowed estimated BER is increased from 1.5e-7 to 1.75e-7.
B.14 REIN Testing for BA8c
B.14.1 Common Line Setting Variations
The test set-up is to be configured according to Section 6.1 as appropriate for the modems under test. The test loops SHALL have straight homogeneous loop topology and with TP100 cable characteristics.
Table 95: Common Line Settings for BA8c_D&UPBO Band Profile REIN Testing
Parameter Setting Description
All parameters but those specified below
Value as specified in Table 11
DPBOEPSDADSL2plus
Annex APSD mask that is assumed to be permitted at the exchange
DPBOESEL 27dB@1MHz E-side electrical length
DPBOESCMA 0.421875Model of the frequency dependent loss of E-side cable: scalars DPBOESCMA (f^0) - G.997.1 form = 364
DPBOESCMB 0.8125Model of the frequency dependent loss of E-side cable: scalars DPBOESCMB (f^0.5) - G.997.1 form = 464
DPBOESCMC 0.441406Model of the frequency dependent loss of E-side cable: scalars DPBOESCMC (f) - G.997.1 form = 369
DPBOMUS -101.5 dBm/Hz Minimum usable receive PSD mask
DPBOESCMA 0.4218Model of the frequency dependent loss of E-side cable: scalars DPBOESCMA (f^0)
DPBOESCMB 0.8136Model of the frequency dependent loss of E-side cable: scalars DPBOESCMB (f^0.5)
DPBOESCMC 0.4417Model of the frequency dependent loss of E-side cable: scalars DPBOESCMC (f)
DPBOMUS -101.5 dBm/Hz Minimum usable receive signal PSD
DPBOFMIN 138 kHzMinimum frequency from which on the DPBO SHALL be applied
DPBOFMAX 2208 kHzMaximum frequency up to which the DPBO SHALL be applied
UPBOKLF 0Force CO-MIB electrical loop length(means that kl0 is estimated during training)
UPBOKLestimated during
trainingUpstream electrical loop length (kl0)
UPBOA US0 40.00UPBOB US0 0
A and B values US band 0 (these values imply no UPBO)

VDSL2 Performance Test Plan TR-114 Issue 1
November 2009 © The Broadband Forum. All rights reserved. 93 of 144
UPBOA US1 60 A value US band 1UPBOB US1 17 B value US band 1NOTE: the values of DPBOESCMA, B and C are referred to a PE 0.4mm loop @ 300kHz. Values that are configured according to G.997.1 SHALL be rounded to the nearest scalar value.
The following profile-line combinations SHALL be configures on the SUT.
Table 96: Modified BA8c D&UPBO Profile-line-combinations for REIN testingProfile-line combination Band-profile Specific line-setting
BA8c_D&UPBO_RA_I_150_150 BA8c_D&UPBO RA_I_150_150BA8c_D&UPBO_FX_I_027_009 BA8c_D&UPBO FX_I_027_009BA8c_D&UPBO_FX_I_024_008 BA8c_D&UPBO FX_I_024_008BA8c_D&UPBO_FX_I_014_005 BA8c_D&UPBO FX_I_014_005BA8c_D&UPBO_FX_I_010_003 BA8c_D&UPBO FX_I_010_003
B.14.2 REIN Noise Models
The noise model n_BA8c_D&UPBO defined in Table 97 SHALL be used.
Table 97: REIN noise model n_BA8c_D&UPBO
Noise modelAssociated
band-profileSelf noise disturbers Alien noise disturbers
n_BA8c_D&UPBO BA8c_D&UPBO 19self_BA8c none
The REIN test SHALL use a burst of pseudo random noise of 100μs duration whose differential signal power spectral density is described by Formula B- 2
Formula B- 2 REIN Impulse PSD for BA8c
6610
66
66610
6
102.2)(:150,102.2/log20116max
102.2)(1075.0:/116
1075.0)(10316.0:116,10316.0/log8086max
10316.0)(:/86
Hzff
HzfHzdBm
Hzff
HzfHzdBm
fNoise REIN
The REIN noise is injected with a repetition frequency of 100Hz.
B.14.3 REIN testing in rate adaptive mode

VDSL2 Performance Test Plan TR-114 Issue 1
November 2009 © The Broadband Forum. All rights reserved. 94 of 144
The test procedure is described in Table 98.
Table 98: REIN test procedure – rate adaptive modeTest Configuration 1. The test set-up is to be configured according to Section 6.1 as
appropriate for the modems under test. The test loops SHALL have straight homogeneous loop topology and with TP100 cable characteristics.
2. Configure the SUT in the Rate Adaptive profile-line combination, as defined in BA8c_D&UPBO_RA_I_150_150. Target noise margin shall be set to 6 dB, unless otherwise specified.
3. The DSLAM and VTU-R are connected in turn through each loop specified in Table 99 and Table 100.
4. The crosstalk noise impairment n_BA8c_D&UPBO shall be applied at both DSLAM and CPE.
5. Additive Gaussian White noise at -140 dBm/Hz is injected at both DSLAM and CPE.
6. The REIN noise impairment shall be applied at both DSLAM and CPE in addition to the crosstalk noise and the additive Gaussian White Noise.
Method of Procedure
1. The target margin is set according to Table 99 and Table 100.
2. The link is trained in the presence of the crosstalk noise, additive Gaussian White Noise and REIN impairments.
3. Wait for 3 minutes after initialization for bit-swaps to settle.
4. Record the net data rate R (kbps) and count the number of ES that occur during the following 2 minutes.
Expected Result 1. The broadband link shall operate in the presence of the REIN.
2. If the link fails to train within 2 minutes or the connection is dropped before the end of the test, the result shall be declared a fail.
3. The number of reported ES shall be ≤ 1
4. A test pass requires that the expected results in Table 99 and Table 100 are achieved.
The two tables Table 99 and Table 100 together define a set of eight separate tests. The SUT SHALL pass a minimum of seven of these separate tests.
If the modem fails one of these separate tests, the test MAY be repeated. One of the separate tests MAY be repeated several times, but the total number of test attempts required to pass the seven separate tests SHALL NOT exceed 16.

VDSL2 Performance Test Plan TR-114 Issue 1
November 2009 © The Broadband Forum. All rights reserved. 95 of 144
Table 99: REIN testing in rate adaptive mode - downstream
VDSL2 band-profile BA8c_D&UPBO_RA_I_150_150
loop
len
gth
(m, T
P10
0)
Tar
get
Mar
gin
(dB
)
Mod
em t
rain
ed a
nd
d
id n
ot lo
se s
ync?
(Y
/N)
Min
imum
DS
syn
c ra
te (
kb
ps)
Mea
sure
d D
S s
ync
rate
(k
bp
s)
Dow
nst
ream
Noi
se
Mar
gin
, Rep
orte
d
(dB
)
Mea
sure
d D
/S E
rror
ed S
econ
ds
Pas
s / F
ail
100 6 26350
300 9 20350
500 9 18350
1000 9 12850
Table 100: REIN testing in rate adaptive mode - upstream
VDSL2 band-profile BA8c_D&UPBO_RA_I_150_150
loop
len
gth
(m, T
P10
0)
Tar
get
Mar
gin
dB
Mod
em t
rain
ed a
nd
d
id n
ot lo
se s
ync?
(Y
/N)
Min
imum
US
syn
c ra
te (
kb
ps)
Mea
sure
d U
S s
ync
rate
(k
bp
s)
Up
stre
am N
oise
M
argi
n, R
epor
ted
(d
B)
Mea
sure
d U
/S E
rror
ed S
econ
ds
Pas
s / F
ail
100 6 8950
300 9 7250
500 9 6750
1000 9 3600
B.14.4 REIN testing in fixed rate mode
The test procedure is described in Table 101.

VDSL2 Performance Test Plan TR-114 Issue 1
November 2009 © The Broadband Forum. All rights reserved. 96 of 144
Table 101: REIN test procedure – fixed rate modeTest Configuration 1. The test set-up is to be configured according to Section 6.1 as
appropriate for the modems under test. The test loops SHALL have straight homogeneous loop topology and with TP100 cable characteristics.
2. Configure the SUT in the required BA8c Fixed-Rate profile-line combination from Table 96. Target noise margin shall be set to 6 dB.
3. The DSLAM and CPE are connected in turn through each loop specified in Table 110 and Table 111.
4. The crosstalk noise impairment n_BA8c_D&UPBO and shall be applied at both DSLAM and CPE.
5. Additive Gaussian White noise at -140 dBm/Hz is injected at both DSLAM and CPE.
6. The REIN noise impairment shall be applied at both DSLAM and CPE in addition to the crosstalk noise and the additive Gaussian White Noise.
Method of Procedure
1. The link is trained in the presence of the crosstalk noise, additive Gaussian White Noise and REIN impairments.
2. Wait for 3 minutes after initialization for bit-swaps to settle.
3. Record the net data rate R (kbps) and count the number of Errored Seconds that occur during the following 2 minutes.
Expected Result 1. The broadband link shall operate in the presence of the REIN.
2. If the link fails to train within 2 minutes or the connection is dropped before the end of the test, the result shall be declared a fail.
3. The number of reported ES shall be ≤ 1
The two tables Table 102 and Table 103 define a set of 10 separate tests. The modem SHALLpass a minimum of 9 of these separate tests.
If the modem fails one of these separate tests, the test MAY be repeated. One of the separate tests MAY be repeated several times, but the total number of test attempts required to pass the seven separate tests SHALL NOT exceed 16.

VDSL2 Performance Test Plan TR-114 Issue 1
November 2009 © The Broadband Forum. All rights reserved. 97 of 144
Table 102: DS Target REIN Reach impairment, Fixed Rate Profile
Loo
p L
engt
h
(m, T
P10
0)
Tes
t p
rofi
le, w
ith
d
elay
set
to
8 m
s.
Mod
em T
rain
ed
and
did
not
loos
e sy
nc?
(Y
/N)
Dow
nst
ream
N
oise
Mar
gin
, R
epor
ted
(d
B)
Mea
sure
dD
/S B
it R
ate
Mea
sure
d D
/S E
rror
ed S
econ
ds
Pas
s / F
ail
100 FX_I_027_009
400 FX_I_024_008
900 FX_I_014_005
1300 FX_I_010_003
1500 FX_I_005_001
Table 103: US Target REIN Reach impairment, Fixed Rate Profile
Loo
p L
engt
h
(m, T
P10
0)
Tes
t p
rofi
le, w
ith
d
elay
set
to
8 m
s.
Mod
em T
rain
ed
and
did
not
loos
e sy
nc?
(Y
/N)
Up
stre
am N
oise
M
argi
n,
Rep
orte
d (
dB
)
Mea
sure
dU
/S B
it R
ate
Mea
sure
d U
/S E
rror
ed S
econ
ds
Pas
s / F
ail
100 FX_I_027_009
400 FX_I_024_008
900 FX_I_014_005
1300 FX_I_010_003
1500 FX_I_005_001
B.15 Single High Impulse Noise (SHINE) Testing for BA8c
B.15.1 Common Line Setting Variations
The basic BA8c Band Profile SHALL be applied with the following modifications in Table 104to the “Common Line Settings” specified in Table 11 to define the new shaped-PSD Band Profile BA8c_D&UPBO:

VDSL2 Performance Test Plan TR-114 Issue 1
November 2009 © The Broadband Forum. All rights reserved. 98 of 144
Table 104: Common line settings for BA8c_D&UPBO band-profile SHINE testing
Parameter Setting Description
All parameters but those specified below
Value as specified in Table 11
DPBOEPSDADSL2plus
Annex APSD mask that is assumed to be permitted at the exchange
DPBOESEL 27dB@1MHz E-side electrical length
DPBOESCMA 0.421875Model of the frequency dependent loss of E-side cable: scalars DPBOESCMA (f^0) - G.997.1 form = 364
DPBOESCMB 0.8125Model of the frequency dependent loss of E-side cable: scalars DPBOESCMB (f^0.5) - G.997.1 form = 464
DPBOESCMC 0.441406Model of the frequency dependent loss of E-side cable: scalars DPBOESCMC (f) - G.997.1 form = 369
DPBOMUS -101.5 dBm/Hz Minimum usable receive PSD mask
DPBOESCMA 0.4218Model of the frequency dependent loss of E-side cable: scalars DPBOESCMA (f^0)
DPBOESCMB 0.8136Model of the frequency dependent loss of E-side cable: scalars DPBOESCMB (f^0.5)
DPBOESCMC 0.4417Model of the frequency dependent loss of E-side cable: scalars DPBOESCMC (f)
DPBOMUS -101.5 dBm/Hz Minimum usable receive signal PSD
DPBOFMIN 138 kHzMinimum frequency from which on the DPBO SHALL be applied
DPBOFMAX 2208 kHzMaximum frequency up to which the DPBO SHALL be applied
UPBOKLF 0Force CO-MIB electrical loop length(means that kl0 is estimated during training)
UPBOKLestimated during
trainingUpstream electrical loop length (kl0)
UPBOA US0 40.00UPBOB US0 0
A and B values US band 0 (these values imply no UPBO)
UPBOA US1 60 A value US band 1UPBOB US1 17 B value US band 1NOTE: the values of DPBOESCMA, B and C are referred to a PE 0.4mm loop @ 300kHz. Values that are configured according to G.997.1 SHALL be rounded to the nearest scalar value.
The SUT profile-line combinations SHALL be configured as in Table 105.
Table 105: BA8c D&UPBO profile-line combinations – SHINE testingProfile-line combination Band-profile Specific line-setting
BA8c_D&UPBO_RA_I_150_150 BA8c_D&UPBO RA_I_150_150

VDSL2 Performance Test Plan TR-114 Issue 1
November 2009 © The Broadband Forum. All rights reserved. 99 of 144
B.15.2 SHINE Noise Models
The noise model n_BA8c_D&UPBO defined in Table 106 SHALL be used.
Table 106: Noise model n_BA8c_D&UPBO SHINE testing
Noise modelAssociated
band-profileSelf noise disturbers Alien noise disturbers
n_BA8c_D&UPBO BA8c_D&UPBO 19self_BA8c none
The SHINE test noise burst shall use an AWGN noise burst with amplitude of -86 dBm/Hz from 138 kHz up to 7.0 MHz. The out-of-band noise SHALL NOT be higher than -86 dBm/Hz. The SHINE noise shall be applied at the CPE side, in showtime after the 60 seconds settling time.
At the end under test, the SHINE test noise is coupled to the line using a high-impedancecoupler. These test noise levels are as measured into a 100 Ω measuring set with another 100 Ω in parallel.
B.15.3 SHINE testing in rate adaptive modeThe test procedure is described in Table 107.
Table 107: SHINE rate adaptive test procedureTest Configuration 1. The test set-up is to be configured according to Section 6.1 as
appropriate for the modems under test. The test loops SHALL have straight homogeneous loop topology and with TP100 cable characteristics.
2. Configure the SUT in the Rate Adaptive profile-line combination, as defined in BA8c_D&UPBO_RA_I_150_150. Target noise margin shall be set to 6 dB.
3. The DSLAM and CPE are connected in turn through each loop specified in Table 108.
4. The crosstalk noise impairment n_BA8c_D&UPBO shall be applied at both DSLAM and CPE.
5. Additive Gaussian White noise at -140 dBm/Hz is injected at both DSLAM and CPE.
6. The SHINE noise impairment shall be applied at the CPE in addition to the crosstalk noise and the additive Gaussian White Noise.
Method of Procedure
1. The link is trained in the presence of the crosstalk noise and the additive Gaussian White Noise impairments.
2. Wait for 60 s after initialization for bit-swaps to settle.
3. The SHINE is applied at the CPE. The duration of the SHINE is as specified in Table 108.
4. Wait for 10 s after the end of the SHINE.
5. Record the ES count that occurs during the following 60 s.

VDSL2 Performance Test Plan TR-114 Issue 1
November 2009 © The Broadband Forum. All rights reserved. 100 of 144
Expected Result 1. The modem SHALL NOT retrain during the application of the SHINE event and for 70 s after the end of the SHINE event;
2. The number of reported ES that occur between 10 s and 70 s after the SHINE event shall be ≤ 1
Table 108 defines a set of two tests. Each test SHALL be repeated 3 times. The CPE SHALL pass all 3 tests for each burst length.
Table 108: SHINE test loop and burst lengthsLoop Length(m, TP100)
Burst length1
(ms)1500 10001500 100
Note 1: The burst length SHOULD be controllable with a resolution of ten milliseconds.
B.16 Combined Noise Impairment for BA8c
The purpose of these tests is to verify that VDSL2 links can be parameterized to be stable and operate essentially error free when victim to several fluctuating noise sources at the same time. These tests are based on combined noise models that are more representative of the real network than a single noise test.Two tests are defined. Type 1 includes repetitive high level impulse noise (REIN), prolonged electrical impulsive noise (PEIN) and fluctuating crosstalk due to modems being switched on and off over time. Type 2 includes prolonged electrical impulsive noise (PEIN), fluctuating RFI ingress from a large number of radio signals, and fluctuating crosstalk.NOTE: These tests are defined for VDSL2 without the availability of retransmission functionality. Consequently the longest PEIN pulse represented is 3.6 ms. In future versions of this specification the PEIN test MAY be modified to increase the maximum impulse length to of the order 10 ms.
Annex D.3 includes details of the individual noise models and some help in setting up the tests. Type 1 test procedure is defined in section B.16.1. Type 2 test procedure is defined in section B.16.2.
B.16.1 Type 1 combined threat noise test including high level REINThis combined threat noise test uses a combination of REIN, PEIN and fluctuating cross talk. The test duration is 4 hours during which the crosstalk cycles twice and there SHOULD be about 76 PEIN pulses. The REIN SHALL be on during training and for at least 2 minutes afterwards.
The system under test SHALL be tested for Interleaved rate adaptive and Interleaved fixed rate profiles.
The test procedures are described in Table 109 and Table 110.

VDSL2 Performance Test Plan TR-114 Issue 1
November 2009 © The Broadband Forum. All rights reserved. 101 of 144
Table 109: Combined noise test procedure Type 1 – Rate Adaptive modeTest Configuration 1. Configure the SUT in the profile-line combinations as defined in
section 6.2. Target noise margin shall be set to 6dB, unless otherwise specified.2. The DSLAM and CPE are connected in turn through each loop specified in Table 115.3. The fluctuating crosstalk noise impairment shall be applied at the CPE. Constant crosstalk shall be injected at the DSLAM. The condition during training shall be 1 disturber at the CPE side and 19 disturbers at the DSLAM side. In showtime, number of disturbers at the VTU-R side shall fluctuate between 0 and 19, as described in D.3.4.4. The REIN and PEIN noise impairment shall be applied at the CPE in addition to the fluctuating crosstalk noise.
Method of Procedure
1. The link is trained in the presence of REIN impairment.2. The fluctuating crosstalk noise and PEIN impairment shall be applied.3. Record the net data rate, reported noise margin, reported number of ES, SES and retrains over the 4 hours of test duration.Note: Reported noise margin and SES SHALL NOT be considered in the pass/fail criteria.
Expected Result 1. The link shall operate in the presence of REIN impairment.2. If the link fails to train within 2 min or the connection is dropped before the end of the test, the result shall be declared a fail.3. The number of reported downstream ES shall be ≤ 5.4. The expected results in Table 116 shall be met.

VDSL2 Performance Test Plan TR-114 Issue 1
November 2009 © The Broadband Forum. All rights reserved. 102 of 144
Table 110: Combined noise test procedure Type 1 – Fixed Rate modeTest Configuration 1. Configure the SUT in the profile-line combinations as defined in
section 6.2. 2. The DSLAM and CPE are connected in turn through each loop specified in Table 115.3. The fluctuating crosstalk noise impairment shall be applied at the CPE. Constant crosstalk shall be injected at the DSLAM. The condition during training shall be 1 disturber at the CPE side and 19 disturbers at the DSLAM side. In showtime, number of disturbers at the CPE side shall fluctuate between 0 and 19, as described in Appendix D.3.4.4. The REIN and PEIN noise impairment shall be applied at the CPE in addition to the fluctuating crosstalk noise.
Method of Procedure
1. The link is trained in the presence of REIN impairment.2. The fluctuating crosstalk noise and PEIN impairment shall be applied.3. Record the net data rate, reported noise margin, reported number of ES, SES and retrains over the 4 hours of test duration.Note: Reported noise margin and SES SHALL NOT be considered in the pass/fail criteria.
Expected Result 1. The link shall operate in the presence of REIN impairment.2. If the link fails to train within 2 min or the connection is dropped before the end of the test, the result shall be declared a fail.3. The number of reported DS ES shall be ≤ 5.4. The expected results in Table 117 shall be met.
B.16.2 Type 2 Combined Threat Noise Test including fluctuating RFI
The combined threat noise test uses a combination of fluctuating RFI, PEIN and fluctuating cross talk. The test duration is 4 hours during which the crosstalk cycles twice and there SHOULD be about 76 PEIN pulses.The system under test SHALL be tested for Interleaved rate adaptive and Interleaved fixed rate profiles with an INP=16 and a delay=32ms.
The test procedures are described in Table 111 and Table 112

VDSL2 Performance Test Plan TR-114 Issue 1
November 2009 © The Broadband Forum. All rights reserved. 103 of 144
Table 111: Combined noise test procedure Type 2 – Rate Adaptive modeTest Configuration 1. Configure the SUT in the profile-line combinations as defined in
section 6.2. Target noise margin shall be set to 6dB, unless otherwise specified.2. The DSLAM and CPE are connected in turn through each loop specified in Table 115.3. The fluctuating crosstalk noise impairment shall be applied at the CPE. Constant crosstalk shall be injected at the DSLAM. The condition during training shall be 1 disturber at the CPE side and 19 disturbers at the DSLAM side. In showtime, number of disturbers at the CPE side shall fluctuate between 0 and 19, as described in Appendix D.3.4.4. The fluctuating RFI and PEIN noise impairment shall be applied at the CPE in addition to the fluctuating crosstalk noise.
Method of Procedure
1. The link is trained.2. The fluctuating crosstalk noise, fluctuating RFI and PEIN impairment shall be applied.3. Record the net data rate, reported noise margin, reported number of ES, SES and retrains over the 4 hours of test duration.Note: Reported noise margin and SES SHALL NOT be considered in the pass/fail criteria.
Expected Result 1. If the link fails to train within 2 min or the connection is dropped before the end of the test, the result shall be declared a fail.2. The number of reported downstream ES shall be ≤ 5.3. The expected results in Table 118 shall be met.

VDSL2 Performance Test Plan TR-114 Issue 1
November 2009 © The Broadband Forum. All rights reserved. 104 of 144
Table 112: Combined noise test procedure Type 2 – Fixed Rate modeTest Configuration 1. Configure the SUT in the profile-line combinations as defined in
section 6.2. 2. The DSLAM and CPE are connected in turn through each loop specified in Table 115.3. The fluctuating crosstalk noise impairment shall be applied at the CPE. Constant crosstalk shall be injected at the DSLAM. The condition during training shall be 1 disturber at the CPE side and 19 disturbers at the DSLAM side. In showtime, number of disturbers at the CPE side shall fluctuate between 0 and 19, as described in Appendix D.3.4.4. The fluctuating RFI and PEIN noise impairment shall be applied at the CPE in addition to the fluctuating crosstalk noise.
Method of Procedure
1. The link is trained.2. The fluctuating crosstalk noise, fluctuating RFI and PEIN impairment shall be applied.3. Record the net data rate, reported noise margin, reported number of ES, SES and retrains over the 4 hours of test duration.Note: Reported noise margin and SES SHALL NOT be considered in the pass/fail criteria.
Expected Result 1. If the link fails to train within 2 min or the connection is dropped before the end of the test, the result shall be declared a fail.2. The number of reported downstream ES shall be ≤ 5.3. The expected results in Table 119 shall be met.
B.16.3 Common Settings for Combined Threat Noise Tests
The basic BA8c Band Profile SHALL be applied with the modifications defined in Table 113 to the “Common Line Settings” specified in Table 11 to define the new shaped-PSD Band Profile BA8c_D&UPBO:
Table 113: Common line setting for BA8c_D&UPBO band-profile combined threat testing
Parameter Setting Description
All parameters but those specified below
Value as specified in Table 11
DPBOEPSD ADSL2plus Annex APSD mask that is assumed to be permitted at the exchange
DPBOESEL 24dB@300kHz E-side electrical length
DPBOESCMA 0.421875Model of the frequency dependent loss of E-side cable: scalars DPBOESCMA (f^0) - G.997.1 form = 364
DPBOESCMB 0.8125Model of the frequency dependent loss of E-side cable: scalars DPBOESCMB (f^0.5) - G.997.1 form = 464
DPBOESCMC 0.441406Model of the frequency dependent loss of E-side cable: scalars DPBOESCMC (f) - G.997.1 form = 369
DPBOMUS -101.5 dBm/Hz Minimum usable receive PSD mask
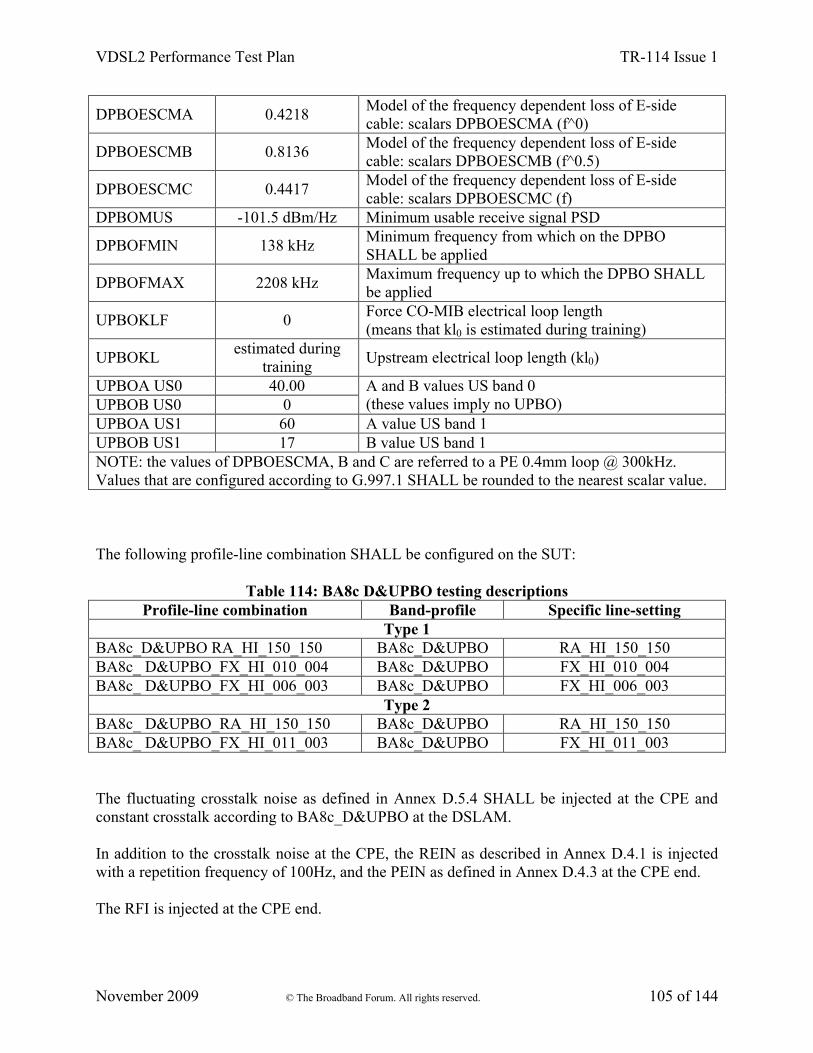
VDSL2 Performance Test Plan TR-114 Issue 1
November 2009 © The Broadband Forum. All rights reserved. 105 of 144
DPBOESCMA 0.4218Model of the frequency dependent loss of E-side cable: scalars DPBOESCMA (f^0)
DPBOESCMB 0.8136Model of the frequency dependent loss of E-side cable: scalars DPBOESCMB (f^0.5)
DPBOESCMC 0.4417Model of the frequency dependent loss of E-side cable: scalars DPBOESCMC (f)
DPBOMUS -101.5 dBm/Hz Minimum usable receive signal PSD
DPBOFMIN 138 kHzMinimum frequency from which on the DPBO SHALL be applied
DPBOFMAX 2208 kHzMaximum frequency up to which the DPBO SHALL be applied
UPBOKLF 0Force CO-MIB electrical loop length(means that kl0 is estimated during training)
UPBOKLestimated during
trainingUpstream electrical loop length (kl0)
UPBOA US0 40.00UPBOB US0 0
A and B values US band 0 (these values imply no UPBO)
UPBOA US1 60 A value US band 1UPBOB US1 17 B value US band 1NOTE: the values of DPBOESCMA, B and C are referred to a PE 0.4mm loop @ 300kHz. Values that are configured according to G.997.1 SHALL be rounded to the nearest scalar value.
The following profile-line combination SHALL be configured on the SUT:
Table 114: BA8c D&UPBO testing descriptionsProfile-line combination Band-profile Specific line-setting
Type 1BA8c_D&UPBO RA_HI_150_150 BA8c_D&UPBO RA_HI_150_150BA8c_ D&UPBO_FX_HI_010_004 BA8c_D&UPBO FX_HI_010_004BA8c_ D&UPBO_FX_HI_006_003 BA8c_D&UPBO FX_HI_006_003
Type 2BA8c_ D&UPBO_RA_HI_150_150 BA8c_D&UPBO RA_HI_150_150BA8c_ D&UPBO_FX_HI_011_003 BA8c_D&UPBO FX_HI_011_003
The fluctuating crosstalk noise as defined in Annex D.5.4 SHALL be injected at the CPE and constant crosstalk according to BA8c_D&UPBO at the DSLAM.
In addition to the crosstalk noise at the CPE, the REIN as described in Annex D.4.1 is injected with a repetition frequency of 100Hz, and the PEIN as defined in Annex D.4.3 at the CPE end.
The RFI is injected at the CPE end.
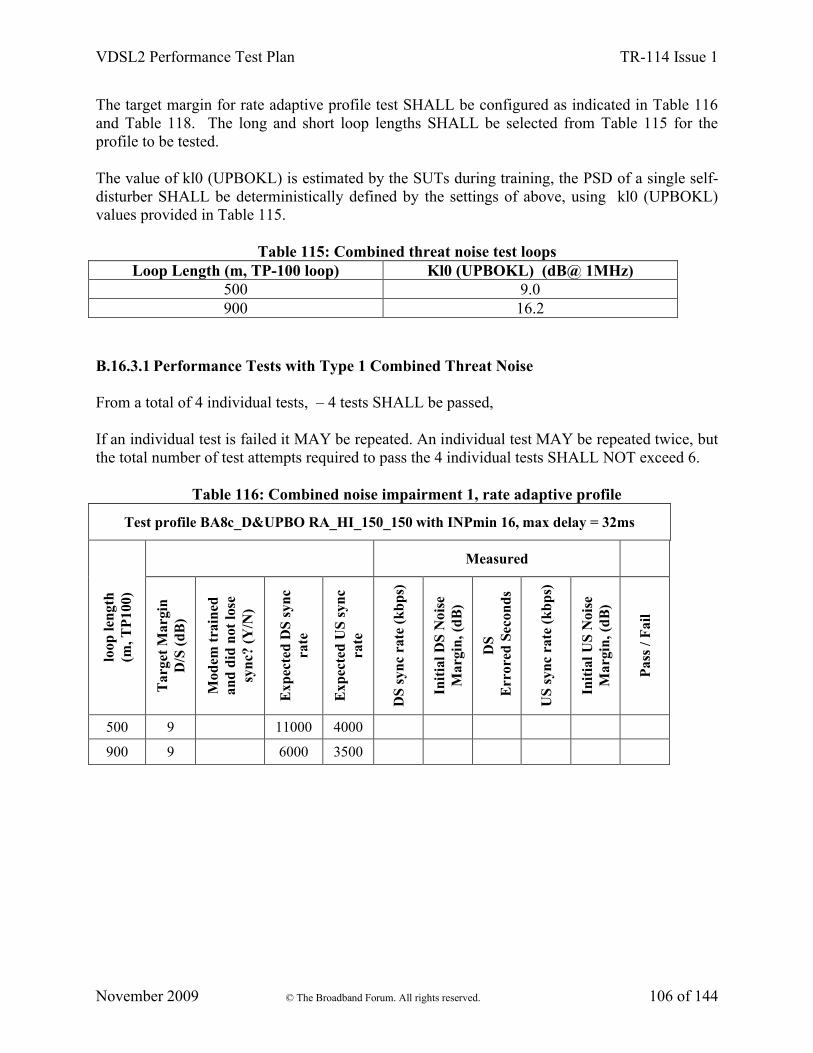
VDSL2 Performance Test Plan TR-114 Issue 1
November 2009 © The Broadband Forum. All rights reserved. 106 of 144
The target margin for rate adaptive profile test SHALL be configured as indicated in Table 116and Table 118. The long and short loop lengths SHALL be selected from Table 115 for the profile to be tested.
The value of kl0 (UPBOKL) is estimated by the SUTs during training, the PSD of a single self-disturber SHALL be deterministically defined by the settings of above, using kl0 (UPBOKL) values provided in Table 115.
Table 115: Combined threat noise test loopsLoop Length (m, TP-100 loop) Kl0 (UPBOKL) (dB@ 1MHz)
500 9.0900 16.2
B.16.3.1 Performance Tests with Type 1 Combined Threat Noise
From a total of 4 individual tests, – 4 tests SHALL be passed,
If an individual test is failed it MAY be repeated. An individual test MAY be repeated twice, but the total number of test attempts required to pass the 4 individual tests SHALL NOT exceed 6.
Table 116: Combined noise impairment 1, rate adaptive profile
Test profile BA8c_D&UPBO RA_HI_150_150 with INPmin 16, max delay = 32ms
Measured
loop
len
gth
(m, T
P10
0)
Tar
get
Mar
gin
D/S
(d
B)
Mod
em t
rain
ed
and
did
not
lose
sy
nc?
(Y
/N)
Exp
ecte
d D
S s
ync
rate
Exp
ecte
d U
S s
ync
rate
DS
syn
c ra
te (
kb
ps)
Init
ial D
S N
oise
M
argi
n, (
dB
)
DS
Err
ored
Sec
onds
US
syn
c ra
te (
kb
ps)
Init
ial U
S N
oise
M
argi
n, (
dB
)
Pas
s / F
ail
500 9 11000 4000
900 9 6000 3500
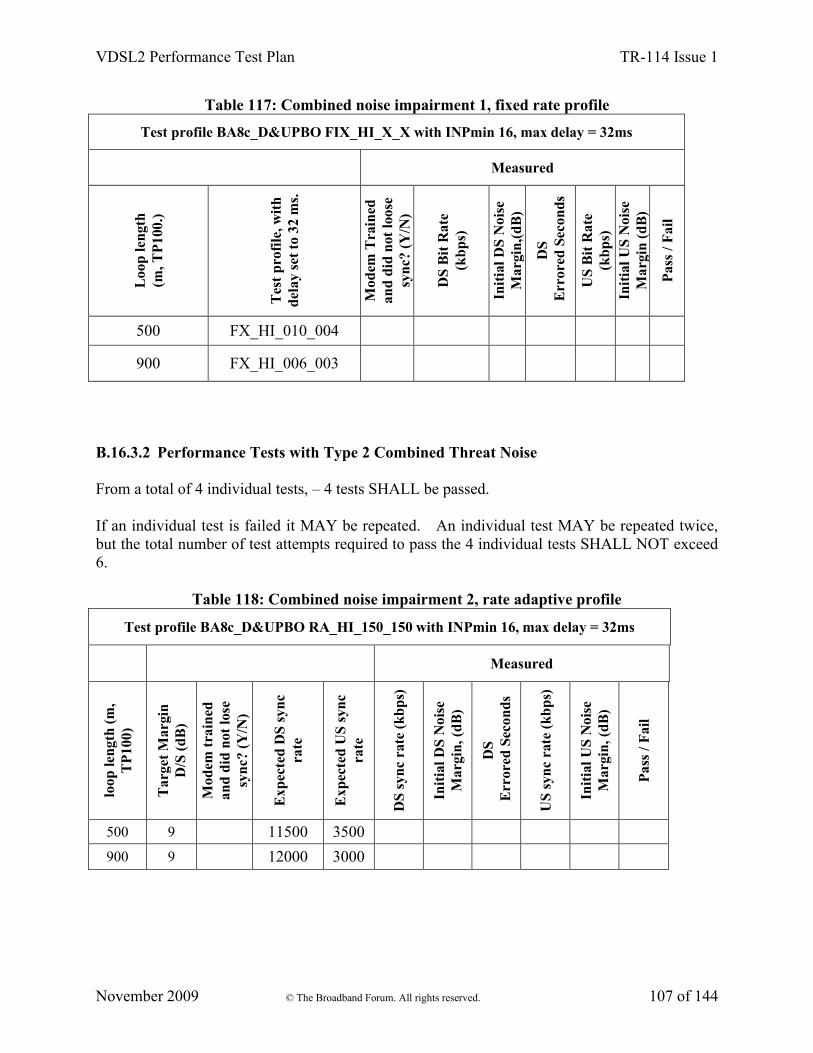
VDSL2 Performance Test Plan TR-114 Issue 1
November 2009 © The Broadband Forum. All rights reserved. 107 of 144
Table 117: Combined noise impairment 1, fixed rate profile
Test profile BA8c_D&UPBO FIX_HI_X_X with INPmin 16, max delay = 32ms
Measured
Loo
p le
ngt
h
(m, T
P10
0.)
Tes
t p
rofi
le, w
ith
d
elay
set
to
32 m
s.
Mod
em T
rain
ed
and
did
not
loos
e sy
nc?
(Y
/N)
DS
Bit
Rat
e (k
bp
s)
Init
ial D
S N
oise
M
argi
n,(
dB
)
DS
Err
ored
Sec
onds
US
Bit
Rat
e (k
bp
s)In
itia
l US
Noi
se
Mar
gin
(d
B)
Pas
s / F
ail
500 FX_HI_010_004
900 FX_HI_006_003
B.16.3.2 Performance Tests with Type 2 Combined Threat Noise
From a total of 4 individual tests, – 4 tests SHALL be passed.
If an individual test is failed it MAY be repeated. An individual test MAY be repeated twice, but the total number of test attempts required to pass the 4 individual tests SHALL NOT exceed 6.
Table 118: Combined noise impairment 2, rate adaptive profile
Test profile BA8c_D&UPBO RA_HI_150_150 with INPmin 16, max delay = 32ms
Measured
loop
len
gth
(m,
TP
100)
Tar
get
Mar
gin
D/S
(d
B)
Mod
em t
rain
ed
and
did
not
lose
sy
nc?
(Y
/N)
Exp
ecte
d D
S s
ync
rate
Exp
ecte
d U
S s
ync
rate
DS
syn
c ra
te (
kb
ps)
Init
ial D
S N
oise
M
argi
n, (
dB
)
DS
Err
ored
Sec
onds
US
syn
c ra
te (
kb
ps)
Init
ial U
S N
oise
M
argi
n, (
dB
)
Pas
s / F
ail
500 9 11500 3500
900 9 12000 3000

VDSL2 Performance Test Plan TR-114 Issue 1
November 2009 © The Broadband Forum. All rights reserved. 108 of 144
Table 119: Combined noise impairment 2, fixed rate profile
Test profile BA8c_D&UPBO FIX_HI_X_X with INPmin 16, max delay = 32ms
Measured
Loo
p le
ngt
h (
m,
TP
100.
)
Tes
t p
rofi
le, w
ith
d
elay
set
to
32 m
s.
Mod
em T
rain
ed
and
did
not
loos
e sy
nc?
(Y
/N)
DS
Bit
Rat
e (k
bp
s)
Init
ial D
S N
oise
M
argi
n,(
dB
)
DS
Err
ored
Sec
onds
US
Bit
Rat
e (k
bp
s)In
itia
l US
Noi
se
Mar
gin
(d
B)
Pas
s / F
ail
500 FX_HI_011_003
900 FX_HI_011_003
B.17 Performance Tests with mixed impedance loop for BB8b with UPBO
For further study.
B.18 Performance Tests with mixed impedance loop for BB17a with D&UPBO
For further study.

VDSL2 Performance Test Plan TR-114 Issue 1
November 2009 © The Broadband Forum. All rights reserved. 109 of 144
C Annex C Physical Layer Test Cases for G.993.2 Region C (Japan)
C.1 Annex C-Specific Test Setup Information
With reference to section 6.2, the following table indicates which test configurations SHALL be applied for tests related to specific band-profiles associated to VDSL2-over-TCM-ISDN deployments.
Table 120: Annex C Test ConfigurationType of VDSL2
deployment
Band-
profileTest
configurationLine setting Noise impairment
CG8dCG12aCG17a
VDSL2 over TCM-ISDN
CG30a
Refer to Figure 3(configuration
with ISDN splitters)
UPBO activeRA_I_105_105
I-1/0
AWGNrAWGNc
XTr+AWGNrXTc+AWGNc
(Refer to section 6.3.3.3.)Note-1: For definition of test loops see 6.3.2.3.Note-2: UPBO PSD mask SHALL be as defined G.993.2 Amd.1 Annex C Section C.4.
The following profile-line combinations shall be configured on the SUT. The specific SUT settings as defined in 6.2 shall be used.
Table 121: Profile-line combinations for Annex C testingBand-profile Specific line-setting Profile-line combination
CG8d RA_I_105_105 CG8d_RA_I_105_105CG12a RA_I_105_105 CG12a_RA_I_105_105CG17a RA_I_105_105 CG17a_RA_I_105_105CG30a RA_I_105_105 CG30a_RA_I_105_105
Pass/fail criteria for Annex C:If the following conditions are met, the DSLAM/CPE pair passes the performance objectives of the test point. All values SHALL be read out at the DSLAM.
If the measured sync-rate is greater than or equal to the expected sync-rate, then the DSLAM/CPE pair passes the sync-rate requirements of the test point.
If the CRC error counts in a 2-minute period are less than or equal to 1, then the DSLAM/CPE pair passes the bit-error requirements of the test point.
Table 122: Noise margin chart outlines the pass/fail criteria on the reported noise margin.

VDSL2 Performance Test Plan TR-114 Issue 1
November 2009 © The Broadband Forum. All rights reserved. 110 of 144
Table 122: Noise margin chartReported Noise Margin (dB) Requirement
< 5 On no test point≥ 5 and < 6 On at most 10% of the test points
≥ 6 On at least 90% of the test points
Violation of any of the requirements in the Noise Margin Chart SHALL constitute a test section failure.Overall pass/fail criteria for each adaptive rate test are then as follows:
If any reported noise margin is less than 5 dB, then the DSLAM/CPE pair fails the noise margin requirements of that section.
If more than 10% of the reported noise margins are less than 6dB in a section, then the DSLAM/CPE pair fails the noise margin requirements of that section.
If the DSLAM/CPE pair passes the data rate, CRC error count and noise margin requirements, it passes the section; otherwise, it fails the section.
Table 123 lists the number of test points per section corresponding to the overall pass/fail criteria (10% limit).
Table 123: Reported margin requirementsSection number Number of test cases 10% limit (applies to noise margin only)
C.2.1 7 1
C.2.2 7 1
C.2.3 7 1C.2.4 6 1
C.3.1 7 1
C.3.2 7 1
C.3.3 7 1C.3.4 6 1
C.4.1 6 1
C.4.2 6 1
C.4.3 6 1C.4.4 5 1
C.5.1 6 1
C.5.2 6 1
C.5.3 6 1C.5.4 5 1

VDSL2 Performance Test Plan TR-114 Issue 1
November 2009 © The Broadband Forum. All rights reserved. 111 of 144
C.2 Performance tests with AWGNr noise impairment
C.2.1 Performance tests for CG8d – downstream
7 individual tests – 7 tests SHALL be passed
Table 124: Noise AWGNr CG8d impairment, profile-line combination CG8d_ RA_I_105_105CG8d_RA_I_105_105
Downstream UpstreamSync Rate
(kbps)Sync Rate
(kbps)
Loo
p L
engt
h(m
, PE
0.4m
m lo
op)
Exp
ecte
d
Mea
sure
d
CR
C e
rror
cou
nt
Pas
s/F
ail
Noi
se M
argi
n,
Rep
orte
d(d
B)
Exp
ecte
d
Mea
sure
d
CR
C e
rror
cou
nt
Pas
s/F
ail
Noi
se M
argi
n,
Rep
orte
d(d
B)
100 65000 N/A ---- ---- ---- ----
200 62000 N/A ---- ---- ---- ----
300 59000 N/A ---- ---- ---- ----
500 41000 N/A ---- ---- ---- ----
700 26000 N/A ---- ---- ---- ----
900 13000 N/A ---- ---- ---- ----
1000 Link up N/A ---- ---- ---- ----
C.2.2 Performance tests for CG12a - downstream
7 individual tests – 7 tests SHALL be passed

VDSL2 Performance Test Plan TR-114 Issue 1
November 2009 © The Broadband Forum. All rights reserved. 112 of 144
Table 125: Noise AWGNr CG12a impairment, profile-line combination CG12a_ RA_I_105_105
CG12a_RA_I_105_105Downstream Upstream
Sync Rate (kbps)
Sync Rate (kbps)
Loo
p L
engt
h(m
, PE
0.4m
m lo
op)
Exp
ecte
d
Mea
sure
d
CR
C e
rror
cou
nt
Pas
s/F
ail
Noi
se M
argi
n,
Rep
orte
d(d
B)
Exp
ecte
d
Mea
sure
d
CR
C e
rror
cou
nt
Pas
s/F
ail
Noi
se M
argi
n,
Rep
orte
d(d
B)
100 65000 N/A ---- ---- ---- ----
200 62000 N/A ---- ---- ---- ----
300 60000 N/A ---- ---- ---- ----
500 41000 N/A ---- ---- ---- ----
700 26000 N/A ---- ---- ---- ----
900 13000 N/A ---- ---- ---- ----
1000 Link up N/A ---- ---- ---- ----
C.2.3 Performance tests for CG17a - downstream
7 individual tests – 7 tests SHALL be passed
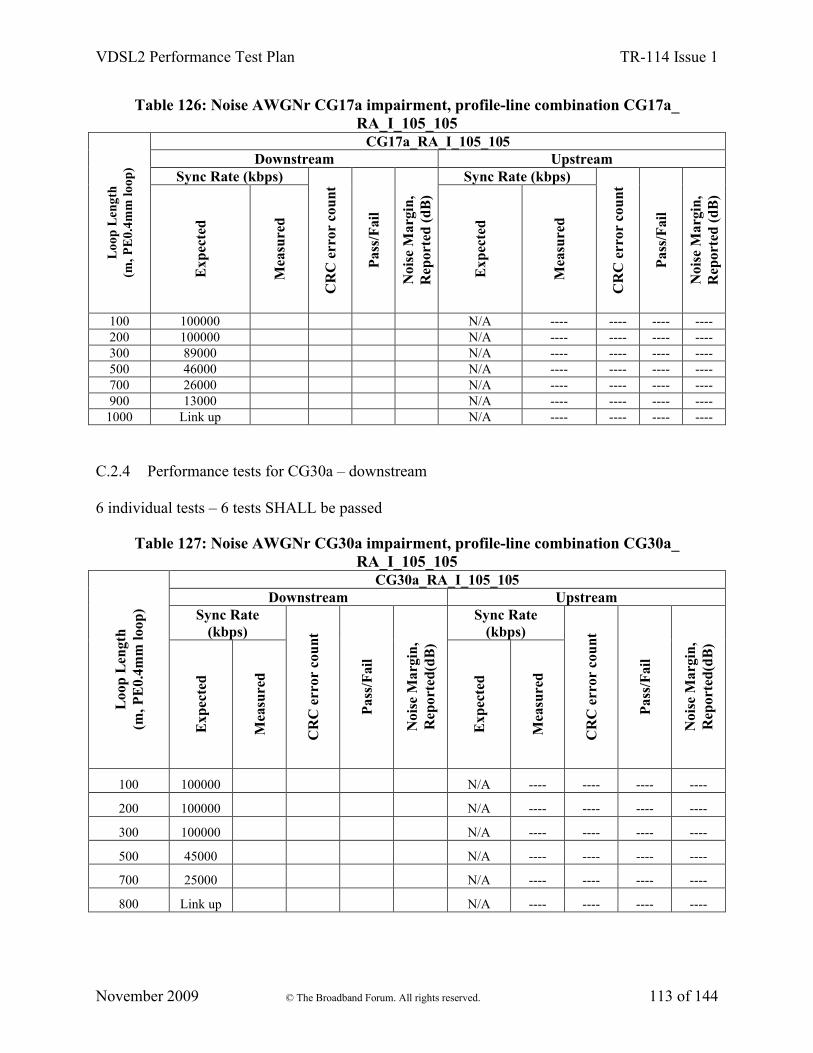
VDSL2 Performance Test Plan TR-114 Issue 1
November 2009 © The Broadband Forum. All rights reserved. 113 of 144
Table 126: Noise AWGNr CG17a impairment, profile-line combination CG17a_ RA_I_105_105
CG17a_RA_I_105_105Downstream Upstream
Sync Rate (kbps) Sync Rate (kbps)
Loo
p L
engt
h(m
, PE
0.4m
m lo
op)
Exp
ecte
d
Mea
sure
d
CR
C e
rror
cou
nt
Pas
s/F
ail
Noi
se M
argi
n,
Rep
orte
d (
dB
)
Exp
ecte
d
Mea
sure
d
CR
C e
rror
cou
nt
Pas
s/F
ail
Noi
se M
argi
n,
Rep
orte
d (
dB
)
100 100000 N/A ---- ---- ---- ----200 100000 N/A ---- ---- ---- ----300 89000 N/A ---- ---- ---- ----500 46000 N/A ---- ---- ---- ----700 26000 N/A ---- ---- ---- ----900 13000 N/A ---- ---- ---- ----
1000 Link up N/A ---- ---- ---- ----
C.2.4 Performance tests for CG30a – downstream
6 individual tests – 6 tests SHALL be passed
Table 127: Noise AWGNr CG30a impairment, profile-line combination CG30a_ RA_I_105_105
CG30a_RA_I_105_105Downstream Upstream
Sync Rate (kbps)
Sync Rate (kbps)
Loo
p L
engt
h(m
, PE
0.4m
m lo
op)
Exp
ecte
d
Mea
sure
d
CR
C e
rror
cou
nt
Pas
s/F
ail
Noi
se M
argi
n,
Rep
orte
d(d
B)
Exp
ecte
d
Mea
sure
d
CR
C e
rror
cou
nt
Pas
s/F
ail
Noi
se M
argi
n,
Rep
orte
d(d
B)
100 100000 N/A ---- ---- ---- ----
200 100000 N/A ---- ---- ---- ----
300 100000 N/A ---- ---- ---- ----
500 45000 N/A ---- ---- ---- ----
700 25000 N/A ---- ---- ---- ----
800 Link up N/A ---- ---- ---- ----

VDSL2 Performance Test Plan TR-114 Issue 1
November 2009 © The Broadband Forum. All rights reserved. 114 of 144
C.3 Performance tests with AWGNc noise impairment
C.3.1 Performance tests for CG8d – upstream
7 individual tests – 7 tests SHALL be passed
Table 128: Noise AWGNc CG8d impairment, profile-line combination CG8d_ RA_I_105_105
CG8d_RA_I_105_105Downstream Upstream
Sync Rate (kbps)
Sync Rate (kbps)
Loo
p L
engt
h(m
, PE
0.4m
m lo
op)
Exp
ecte
d
Mea
sure
d
CR
C e
rror
cou
nt
Pas
s/F
ail
Noi
se M
argi
n,
Rep
orte
d(d
B)
Exp
ecte
d
Mea
sure
d
CR
C e
rror
cou
nt
Pas
s/F
ail
Noi
se M
argi
n,
Rep
orte
d(d
B)
100 N/A ---- ---- ---- ---- 11000
200 N/A ---- ---- ---- ---- 11000
300 N/A ---- ---- ---- ---- 11000
500 N/A ---- ---- ---- ---- 10000
700 N/A ---- ---- ---- ---- 6000
900 N/A ---- ---- ---- ---- 2000
1000 N/A ---- ---- ---- ---- Link up
C.3.2 Performance tests for CG12a - upstream
7 individual tests – 7 tests SHALL be passed

VDSL2 Performance Test Plan TR-114 Issue 1
November 2009 © The Broadband Forum. All rights reserved. 115 of 144
Table 129: Noise AWGNc CG12a impairment, profile-line combination CG12a_ RA_I_105_105
CG12a_RA_I_105_105Downstream Upstream
Sync Rate (kbps) Sync Rate (kbps)
Loo
p L
engt
h(m
, PE
0.4m
m lo
op)
Exp
ecte
d
Mea
sure
d
CR
C e
rror
cou
nt
Pas
s/F
ail
Noi
se M
argi
n,
Rep
orte
d(d
B)
Exp
ecte
d
Mea
sure
d
CR
C e
rror
cou
nt
Pas
s/F
ail
Noi
se M
argi
n,
Rep
orte
d(d
B)
100 N/A ---- ---- ---- ---- 45000
200 N/A ---- ---- ---- ---- 45000
300 N/A ---- ---- ---- ---- 45000
500 N/A ---- ---- ---- ---- 24000
700 N/A ---- ---- ---- ---- 7000
900 N/A ---- ---- ---- ---- 2000
1000 N/A ---- ---- ---- ---- Link up
C.3.3 Performance tests for CG17a – upstream
7 individual tests – 7 tests SHALL be passed

VDSL2 Performance Test Plan TR-114 Issue 1
November 2009 © The Broadband Forum. All rights reserved. 116 of 144
Table 130: Noise AWGNc CG17a impairment, profile-line combination CG17a_ RA_I_105_105CG17a_RA_I_105_105
Downstream UpstreamSync Rate (kbps) Sync Rate (kbps)
Loo
p L
engt
h(m
, PE
0.4m
m l
oop
)
Exp
ecte
d
Mea
sure
d
CR
C e
rror
cou
nt
Pas
s/F
ail
Noi
se M
argi
n,
Rep
orte
d(d
B)
Exp
ecte
d
Mea
sure
d
CR
C e
rror
cou
nt
Pas
s/F
ail
Noi
se M
argi
n,
Rep
orte
d(d
B)
100 N/A ---- ---- ---- ---- 45000
200 N/A ---- ---- ---- ---- 45000
300 N/A ---- ---- ---- ---- 45000
500 N/A ---- ---- ---- ---- 24000
700 N/A ---- ---- ---- ---- 7000
900 N/A ---- ---- ---- ---- 2000
1000 N/A ---- ---- ---- ---- Link up
C.3.4 Performance tests for CG30a – upstream
6 individual tests – 6 tests SHALL be passed

VDSL2 Performance Test Plan TR-114 Issue 1
November 2009 © The Broadband Forum. All rights reserved. 117 of 144
Table 131:Noise AWGNc CG30a impairment, profile-line combination CG30a_ RA_I_105_105
CG30a_RA_I_105_105Downstream Upstream
Sync Rate (kbps) Sync Rate (kbps)
Loo
p L
engt
h(m
, PE
0.4m
m lo
op)
Exp
ecte
d
Mea
sure
d
CR
C e
rror
cou
nt
Pas
s/F
ail
Noi
se M
argi
n,
Rep
orte
d(d
B)
Exp
ecte
d
Mea
sure
d
CR
C e
rror
cou
nt
Pas
s/F
ail
Noi
se M
argi
n,
Rep
orte
d(d
B)
100 N/A ---- ---- ---- ---- 100000
200 N/A ---- ---- ---- ---- 100000
300 N/A ---- ---- ---- ---- 90000
500 N/A ---- ---- ---- ---- 20000
700 N/A ---- ---- ---- ---- 2800
800 N/A ---- ---- ---- ---- Link up

VDSL2 Performance Test Plan TR-114 Issue 1
November 2009 © The Broadband Forum. All rights reserved. 118 of 144
C.4 Performance tests with (XTr+AWGNr) noise impairment
C.4.1 Performance tests for CG8d - downstream
6 individual tests – 6 tests SHALL be passed
Table 132: Noise (XTr+AWGNr) CG8d impairment, profile-line combination CG8d_ RA_I_105_105
CG8d_RA_I_105_105Downstream Upstream
Sync Rate (kbps) Sync Rate (kbps)
Loo
p L
engt
h(m
, PE
0.4m
m lo
op)
Exp
ecte
d
Mea
sure
d
CR
C e
rror
cou
nt
Pas
s/F
ail
Noi
se M
argi
n,
Rep
orte
d(d
B)
Exp
ecte
d
Mea
sure
d
CR
C e
rror
cou
nt
Pas
s/F
ail
Noi
se M
argi
n,
Rep
orte
d(d
B)
100 28000 N/A ---- ---- ---- ----
200 24000 N/A ---- ---- ---- ----
300 21000 N/A ---- ---- ---- ----
500 12000 N/A ---- ---- ---- ----
700 8400 N/A ---- ---- ---- ----
800 Link up N/A ---- ---- ---- ----
C.4.2 Performance tests for CG12a - downstream
6 individual tests – 6 tests SHALL be passed

VDSL2 Performance Test Plan TR-114 Issue 1
November 2009 © The Broadband Forum. All rights reserved. 119 of 144
Table 133: Noise (XTr+AWGNr) CG12a impairment, profile-line combination CG12a_ RA_I_105_105
CG12a_RA_I_105_105Downstream Upstream
Sync Rate (kbps) Sync Rate (kbps)
Loo
p L
engt
h(m
, PE
0.4m
m lo
op)
Exp
ecte
d
Mea
sure
d
CR
C e
rror
cou
nt
Pas
s/F
ail
Noi
se M
argi
n,
Rep
orte
d(d
B)
Exp
ecte
d
Mea
sure
d
CR
C e
rror
cou
nt
Pas
s/F
ail
Noi
se M
argi
n,
Rep
orte
d(d
B)
100 28000 N/A ---- ---- ---- ----
200 24000 N/A ---- ---- ---- ----
300 21000 N/A ---- ---- ---- ----
500 12000 N/A ---- ---- ---- ----
700 8400 N/A ---- ---- ---- ----
800 Link up N/A ---- ---- ---- ----
C.4.3 Performance tests for CG17a - downstream
6 individual tests – 6 tests SHALL be passed

VDSL2 Performance Test Plan TR-114 Issue 1
November 2009 © The Broadband Forum. All rights reserved. 120 of 144
Table 134: Noise (XTr+AWGNr) CG17a impairment, profile-line combination CG17a_ RA_I_105_105
CG17a_RA_I_105_105Downstream Upstream
Sync Rate (kbps) Sync Rate (kbps)
Loo
p L
engt
h(m
, PE
0.4m
m lo
op)
Exp
ecte
d
Mea
sure
d
CR
C e
rror
cou
nt
Pas
s/F
ail
Noi
se M
argi
n,
Rep
orte
d(d
B)
Exp
ecte
d
Mea
sure
d
CR
C e
rror
cou
nt
Pas
s/F
ail
Noi
se M
argi
n,
Rep
orte
d(d
B)
100 36000 N/A ---- ---- ---- ----
200 26000 N/A ---- ---- ---- ----
300 21000 N/A ---- ---- ---- ----
500 12000 N/A ---- ---- ---- ----
700 8400 N/A ---- ---- ---- ----
800 Link up N/A ---- ---- ---- ----
C.4.4 Performance tests for CG30a - downstream
5 individual tests – 5 tests SHALL be passed
Table 135: Noise (XTr+AWGNr) CG30a impairment, profile-line combination CG30a_ RA_I_105_105
CG30a_RA_I_105_105Downstream Upstream
Sync Rate (kbps) Sync Rate (kbps)
Loo
p L
engt
h(m
, PE
0.4m
m lo
op)
Exp
ecte
d
Mea
sure
d
CR
C e
rror
cou
nt
Pas
s/F
ail
Noi
se M
argi
n,
Rep
orte
d(d
B)
Exp
ecte
d
Mea
sure
d
CR
C e
rror
cou
nt
Pas
s/F
ail
Noi
se M
argi
n,
Rep
orte
d(d
B)
100 50000 N/A ---- ---- ---- ----
200 41000 N/A ---- ---- ---- ----
300 30000 N/A ---- ---- ---- ----
500 17000 N/A ---- ---- ---- ----
700 Link up N/A ---- ---- ---- ----

VDSL2 Performance Test Plan TR-114 Issue 1
November 2009 © The Broadband Forum. All rights reserved. 121 of 144

VDSL2 Performance Test Plan TR-114 Issue 1
November 2009 © The Broadband Forum. All rights reserved. 122 of 144
C.5 Performance tests with (XTc+AWGNc) noise impairment
C.5.1 Performance tests for CG8d - upstream
6 individual tests – 6 tests SHALL be passed
Table 136: Noise (XTc+AWGNc) CG8d impairment, profile-line combination CG8d_ RA_I_105_105
CG8d_RA_I_105_105Downstream Upstream
Sync Rate (kbps) Sync Rate (kbps)
Loo
p L
engt
h(m
, PE
0.4m
m lo
op)
Exp
ecte
d
Mea
sure
d
CR
C e
rror
cou
nt
Pas
s/F
ail
Noi
se M
argi
n,
Rep
orte
d (
dB
)
Exp
ecte
d
Mea
sure
d
CR
C e
rror
cou
nt
Pas
s/F
ail
Noi
se M
argi
n,
Rep
orte
d (
dB
)
100 N/A ---- ---- ---- ---- 5000
200 N/A ---- ---- ---- ---- 4000
300 N/A ---- ---- ---- ---- 4000
500 N/A ---- ---- ---- ---- 4000
700 N/A ---- ---- ---- ---- 2000
800 N/A ---- ---- ---- ---- Link up
C.5.2 Performance tests for CG12a - upstream
6 individual tests – 6 tests SHALL be passed

VDSL2 Performance Test Plan TR-114 Issue 1
November 2009 © The Broadband Forum. All rights reserved. 123 of 144
Table 137: Noise (XTc+AWGNc) CG12a impairment, profile-line combination CG12a_ RA_I_105_105
CG12a_RA_I_105_105Downstream Upstream
Sync Rate (kbps) Sync Rate (kbps)
Loo
p L
engt
h(m
, PE
0.4m
m lo
op)
Exp
ecte
d
Mea
sure
d
CR
C e
rror
cou
nt
Pas
s/F
ail
Noi
se M
argi
n,
Rep
orte
d(d
B)
Exp
ecte
d
Mea
sure
d
CR
C e
rror
cou
nt
Pas
s/F
ail
Noi
se M
argi
n,
Rep
orte
d(d
B)
100 N/A ---- ---- ---- ---- 17000
200 N/A ---- ---- ---- ---- 15000
300 N/A ---- ---- ---- ---- 12000
500 N/A ---- ---- ---- ---- 6000
700 N/A ---- ---- ---- ---- 2000
800 N/A ---- ---- ---- ---- Link up
C.5.3 Performance tests for CG17a - upstream
6 individual tests – 6 tests SHALL be passed

VDSL2 Performance Test Plan TR-114 Issue 1
November 2009 © The Broadband Forum. All rights reserved. 124 of 144
Table 138: Noise (XTc+AWGNc) CG17a impairment, profile-line combination CG17a_ RA_I_105_105
CG17a_RA_I_105_105Downstream Upstream
Sync Rate (kbps) Sync Rate (kbps)
Loo
p L
engt
h(m
, PE
0.4m
m lo
op)
Exp
ecte
d
Mea
sure
d
CR
C e
rror
cou
nt
Pas
s/F
ail
Noi
se M
argi
n,
Rep
orte
d (
dB
)
Exp
ecte
d
Mea
sure
d
CR
C e
rror
cou
nt
Pas
s/F
ail
Noi
se M
argi
n,
Rep
orte
d (
dB
)
100 N/A ---- ---- ---- ---- 17000
200 N/A ---- ---- ---- ---- 15000
300 N/A ---- ---- ---- ---- 12000
500 N/A ---- ---- ---- ---- 6000
700 N/A ---- ---- ---- ---- 2000
800 N/A ---- ---- ---- ---- Link up
C.5.4 Performance tests for CG30a - upstream
5 individual tests – 5 tests SHALL be passed
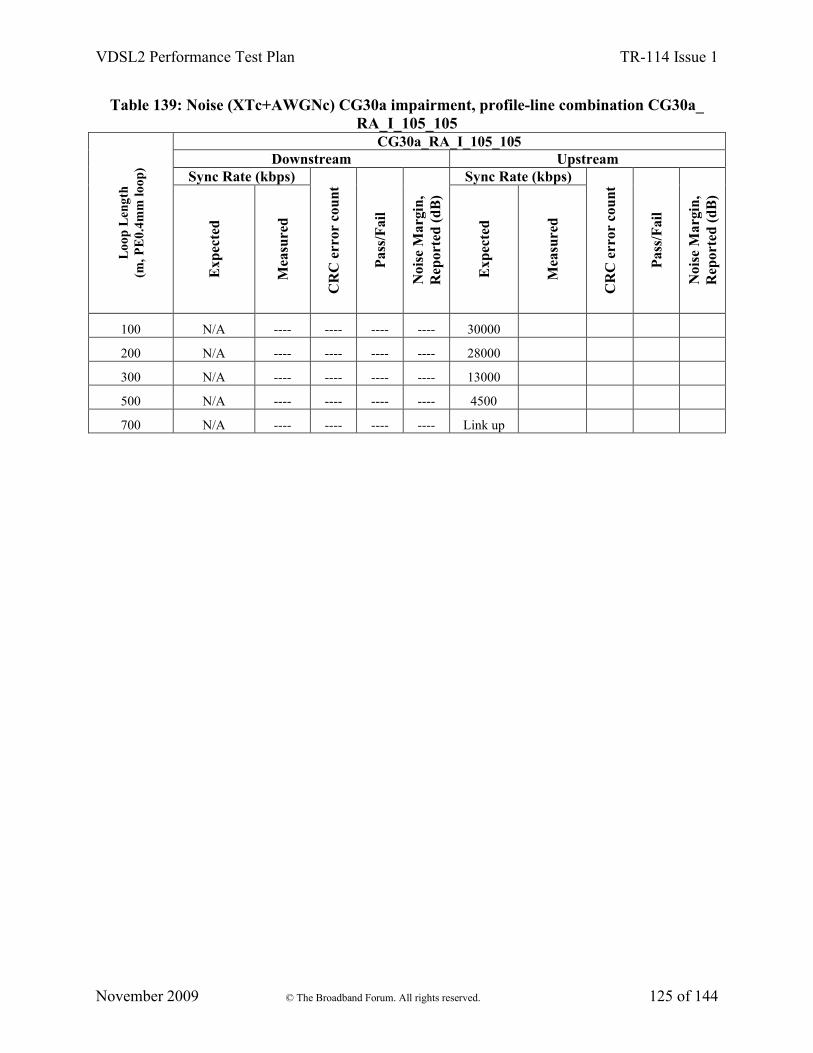
VDSL2 Performance Test Plan TR-114 Issue 1
November 2009 © The Broadband Forum. All rights reserved. 125 of 144
Table 139: Noise (XTc+AWGNc) CG30a impairment, profile-line combination CG30a_ RA_I_105_105
CG30a_RA_I_105_105Downstream Upstream
Sync Rate (kbps) Sync Rate (kbps)
Loo
p L
engt
h(m
, PE
0.4m
m lo
op)
Exp
ecte
d
Mea
sure
d
CR
C e
rror
cou
nt
Pas
s/F
ail
Noi
se M
argi
n,
Rep
orte
d (
dB
)
Exp
ecte
d
Mea
sure
d
CR
C e
rror
cou
nt
Pas
s/F
ail
Noi
se M
argi
n,
Rep
orte
d (
dB
)
100 N/A ---- ---- ---- ---- 30000
200 N/A ---- ---- ---- ---- 28000
300 N/A ---- ---- ---- ---- 13000
500 N/A ---- ---- ---- ---- 4500
700 N/A ---- ---- ---- ---- Link up
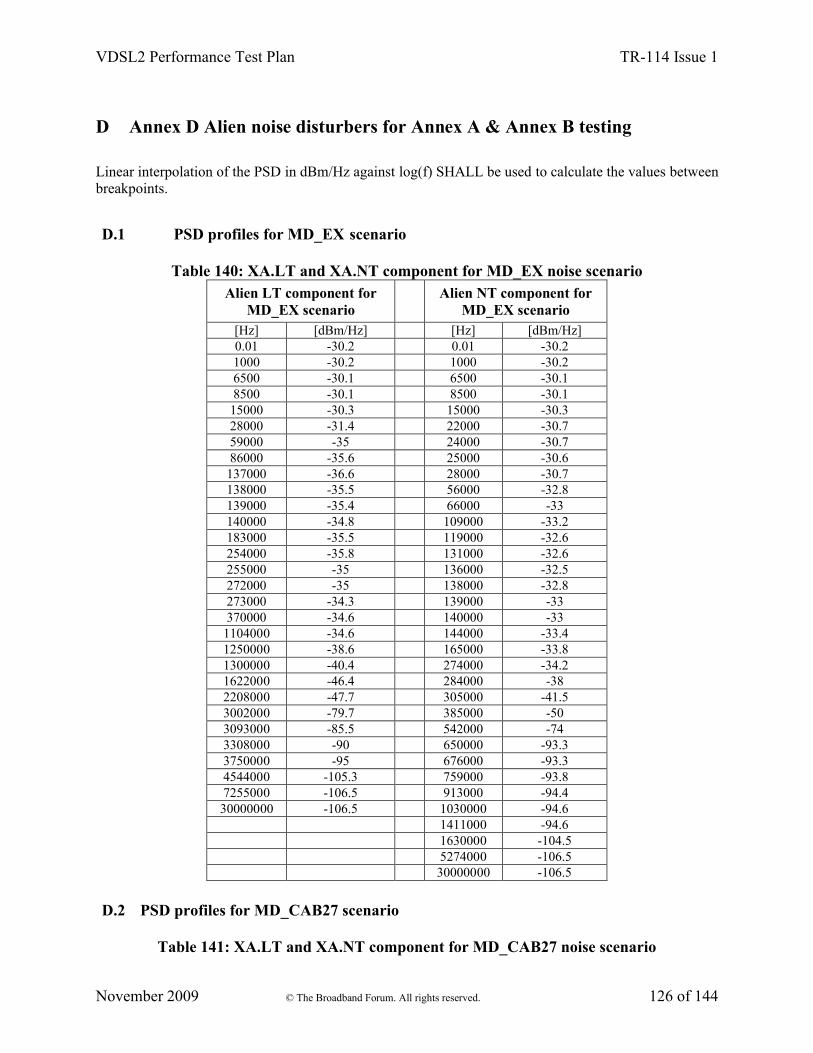
VDSL2 Performance Test Plan TR-114 Issue 1
November 2009 © The Broadband Forum. All rights reserved. 126 of 144
D Annex D Alien noise disturbers for Annex A & Annex B testing
Linear interpolation of the PSD in dBm/Hz against log(f) SHALL be used to calculate the values between breakpoints.
D.1 PSD profiles for MD_EX scenario
Table 140: XA.LT and XA.NT component for MD_EX noise scenarioAlien LT component for
MD_EX scenario Alien NT component for
MD_EX scenario[Hz] [dBm/Hz] [Hz] [dBm/Hz]0.01 -30.2 0.01 -30.21000 -30.2 1000 -30.26500 -30.1 6500 -30.18500 -30.1 8500 -30.1
15000 -30.3 15000 -30.328000 -31.4 22000 -30.759000 -35 24000 -30.786000 -35.6 25000 -30.6
137000 -36.6 28000 -30.7138000 -35.5 56000 -32.8139000 -35.4 66000 -33140000 -34.8 109000 -33.2183000 -35.5 119000 -32.6254000 -35.8 131000 -32.6255000 -35 136000 -32.5272000 -35 138000 -32.8273000 -34.3 139000 -33370000 -34.6 140000 -33
1104000 -34.6 144000 -33.41250000 -38.6 165000 -33.81300000 -40.4 274000 -34.21622000 -46.4 284000 -382208000 -47.7 305000 -41.53002000 -79.7 385000 -503093000 -85.5 542000 -743308000 -90 650000 -93.33750000 -95 676000 -93.34544000 -105.3 759000 -93.87255000 -106.5 913000 -94.430000000 -106.5 1030000 -94.6
1411000 -94.61630000 -104.55274000 -106.530000000 -106.5
D.2 PSD profiles for MD_CAB27 scenario
Table 141: XA.LT and XA.NT component for MD_CAB27 noise scenario

VDSL2 Performance Test Plan TR-114 Issue 1
November 2009 © The Broadband Forum. All rights reserved. 127 of 144
Alien LT component for MD_CAB27 scenario
Alien NT component for MD_CAB27 scenario
[Hz] [dBm/Hz] [Hz] [dBm/Hz]
0.01 -30.2 0.01 -30.2
6900 -30.3 7000 -30.2
15000 -30.5 15000 -30.5
29000 -32 22000 -31
45000 -35.5 24000 -31
74000 -47.4 25000 -30.9
86000 -48 28000 -30.9
102000 -47.5 55000 -33.3
137000 -49.8 69000 -33.6
138000 -48.2 112000 -33.7
139000 -48 119000 -32.9
140000 -47.2 129000 -33
254000 -50.3 136000 -32.8
255000 -49.3 139000 -33.3
272000 -49.7 140000 -33.3
273000 -49 148000 -33.9
560000 -54.7 168000 -34.1
1104000 -63 274000 -34.3
1250000 -68.9 283000 -38.1
1622000 -81.2 301000 -42.4
2208000 -88.8 362000 -48.8
2696000 -113.1 512000 -71
2830000 -117.2 644000 -93.3
3040000 -118.2 676000 -93.3
30000000 -118.2 759000 -94
918000 -94.5
1030000 -94.6
1411000 -94.6
1630000 -104.6
5274000 -106.5
30000000 -106.5
D.3 Noise Sources for Combined Noise Tests
D.3.1 Repetitive Electrical Impulse Noise (REIN) Model
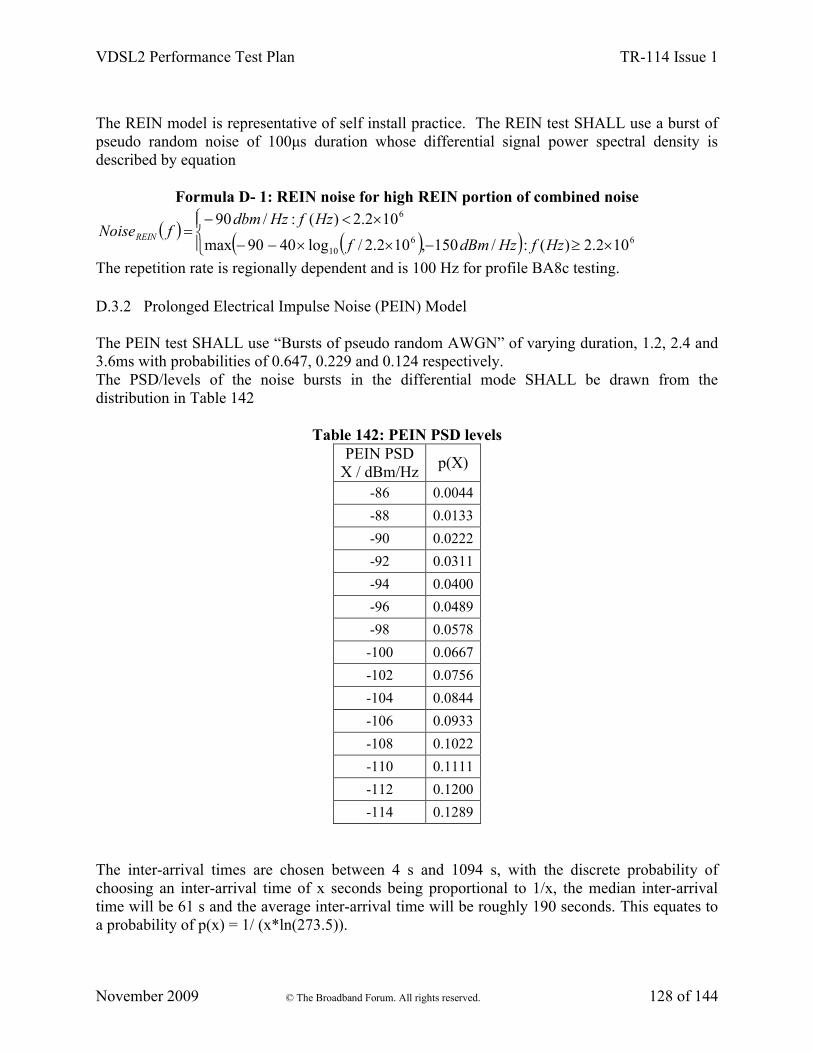
VDSL2 Performance Test Plan TR-114 Issue 1
November 2009 © The Broadband Forum. All rights reserved. 128 of 144
The REIN model is representative of self install practice. The REIN test SHALL use a burst of pseudo random noise of 100μs duration whose differential signal power spectral density is described by equation
Formula D- 1: REIN noise for high REIN portion of combined noise
6610
6
102.2)(:/150,102.2/log4090max
102.2)(:/90
HzfHzdBmf
HzfHzdbmfNoiseREIN
The repetition rate is regionally dependent and is 100 Hz for profile BA8c testing.
D.3.2 Prolonged Electrical Impulse Noise (PEIN) Model
The PEIN test SHALL use “Bursts of pseudo random AWGN” of varying duration, 1.2, 2.4 and 3.6ms with probabilities of 0.647, 0.229 and 0.124 respectively.The PSD/levels of the noise bursts in the differential mode SHALL be drawn from the distribution in Table 142
Table 142: PEIN PSD levelsPEIN PSD
X / dBm/Hzp(X)
-86 0.0044
-88 0.0133
-90 0.0222
-92 0.0311
-94 0.0400
-96 0.0489
-98 0.0578
-100 0.0667
-102 0.0756
-104 0.0844
-106 0.0933
-108 0.1022
-110 0.1111
-112 0.1200
-114 0.1289
The inter-arrival times are chosen between 4 s and 1094 s, with the discrete probability of choosing an inter-arrival time of x seconds being proportional to 1/x, the median inter-arrival time will be 61 s and the average inter-arrival time will be roughly 190 seconds. This equates to a probability of p(x) = 1/ (x*ln(273.5)).

VDSL2 Performance Test Plan TR-114 Issue 1
November 2009 © The Broadband Forum. All rights reserved. 129 of 144
D.3.3 Repeatable test pattern definition – (PEIN)
The PEIN test pattern contains a list of powers and time for each power. Between the PEIN pulses the background noise level is -140 dBm/Hz. The start of a possible test pattern is shown inTable 143.
Table 143: PEIN test pattern definitionPSD
(dBm/Hz)Length
(s)-114 0.0012
-140 239.6863
-102 0.0036
-140 356.9171
-108 0.0012
-140 563.6294
-106 0.0024
-140 65.7596
-108 0.0012
-140 338.3679
-106 0.0012
-140 6.7483
-112 0.0024
-140 430.9218
-90 0.0012
-140 4.0486
-110 0.0012
-140 55.2019
D.3.4 Fluctuating Crosstalk Model
The Fluctuating Crosstalk Noise Model simulates a two day cycle, and starts from a quiet condition when all disturbers are assumed to be turned off. The number of active disturbers in a 20 pair cable ranges from zero to 19 twice during the test. The simulated crosstalk noise is made up of between 0 and 19 self-Next and FEXT noise sources.
The condition during training SHALL be 1 active disturber at the CPE, and 19 active disturbers at the DSLAM. The DSLAM noise remains constant at 19 active disturbers and the noise injected at the CPE fluctuates between 1 and 19 disturbers. With all 19 disturbers active the crosstalk level SHALL be at the 99% worst case level for 19 disturbers.

VDSL2 Performance Test Plan TR-114 Issue 1
November 2009 © The Broadband Forum. All rights reserved. 130 of 144
The fluctuating noise model is based on a hypothetical 20 pair cable. In this model the pairs are ordered according to reducing crosstalk coupling factor with respect to a wire pair that is subject to the test. The coupling factors are such that if the cable is progressively filled with active systems in this order, from the highest coupling factor to the lowest coupling factor, then the crosstalk noise will vary according to the classical 0.6 x log(n) multi-pair crosstalk model. The maximum fill of 19 disturbers leads to a crosstalk power that is 7.67 dB greater than the largest single disturber model. A key feature of the model is that the crosstalk noise when there are n disturbers is variable depending on which pairs are active. So we define noise generator PSDs as follows:
Crosstalk coupling functions are defined in section 5.3.2 table 5 of TS101388[8],
Formula D- 1
1pair toreferenceddBinnpair for iationfactor varcouplingcrosstalk The)(
10)oncontributicrosstalk line-Per
,Activation
19..1number Pair
8
8
10/)(UPBO&BA8c_DUPBO&BA8c_D
19
18
19
18
nCCFV
(n)P(nP
FalseTruea
n
(n) Pac_FLX() XS.LT.n_BA
(n) Pac_FLX() XS.NT.n_BA
nCCFV, NT-SingleSelf_FLX, NT-SingleSelf
n
c_FLX, LT-BASingleSelfn
c_FLX, NT-BASingleSelfn
Table 144: Crosstalk coupling factor for the nth pair in the set
Pair-number 1 2 3 4 5 6 7 8 9 10 11 12 13 14 15 16 17 18 19CCF dB
Referred to the section 5.3.2 table 5 of ETSI TS
101 388[8]
0
-2.8
8
-3.7
9
-4.3
9
-4.8
3
-5.1
8
-5.4
7
-5.7
2
-5.9
3
-6.1
3
-6.3
-6.4
6
-6.6
1
-6.7
4
-6.8
6
-6.9
8
-7.0
9
-7.1
9
-7.2
9
At the start of the test, no other disturbers SHALL be active. One-by-one, additional disturbers SHALL be enabled at a pseudo-random time (random order is implied) , in the first simulated ½ day, until at the time corresponding to noon, all disturbers are active. During the second half of the first simulated day, each disturber SHALL be disabled at a pseudo random time, until at the end of the first day all the disturbers are disabled. The second simulated day follows the same model as the first but with different times and order of disturbers.
D.3.5 Repeatable test pattern definition – (Fluctuating Crosstalk)

VDSL2 Performance Test Plan TR-114 Issue 1
November 2009 © The Broadband Forum. All rights reserved. 131 of 144
The lists the start of a possible test pattern for fluctuating crosstalk. The power rises much more rapidly than would be expected in an actual test.
Table 145: Fluctuating crosstalk power test pattern
Time (s) Power
0 -93.5
1 -93.5
2 -37.5
3 -37.5
4 -28.0
5
D.3.6 Fluctuating Broadband RFI Model
This model includes 100 AM broadcast and 10 radio amateur signals of interferers at different levels, each carrier modulated with noise fluctuating at the syllabic rate and subject to independent fading at a rate and with a time profile representative of night time reception conditions.
This could be achieved using two AWGs, clocked at slightly different frequencies or two deep memory AWGs with a small difference in pattern length. Whichever method is chosen, it is important that the sequences loaded into memory SHALL be different, in order to ensure that the fading occurs independently between carriers. This could be done by ensuring that the phase of each carrier and associated side band group is given an arbitrary phase offset with respect to the waveform in the other generator and the other carriers.
If the dual AWG method is used, in order to achieve a fade of approximately 1000 seconds duration for carriers in the region of 1 MHz, one of the generators SHALL produce a carrier at 1.000_000_001 MHz. This can be achieved using reference clocks of 10 MHz and 10.00000001 MHz for the two AWGs as shown in Figure 5. The absolute accuracy of the reference clock is not significant, 50 parts per million accuracy is sufficient for repeatability. It is important that the resolution of frequency setting of the synthesizers is better than 1 part in 109.

VDSL2 Performance Test Plan TR-114 Issue 1
November 2009 © The Broadband Forum. All rights reserved. 132 of 144
AWG1Synth 1
Synth 2
Ref
ere
nce
Clo
ck
AWG2
10 MHz
10.000 000 01 MHz
+
S()
S((1+10-9)) . ()
(w) = arbitrary phase function
Figure 5: Example of creation of fluctuating noise
Table 146 below defines the carrier amplitudes and phases for one of the two AWGs. It also indicates those frequencies which have been carried forwards from the RF interferer list defined in ETSI TS101388 and those frequencies which lie in the radio amateur bands. The frequencies have been chosen to allow testing of VDSL2 systems using frequencies up to 30 MHz.
The 100 radio broadcast carriers are amplitude modulated with double side bands and the 10 radio amateur signals with single side band suppressed carrier modulation (SSB). Each carrier SHOULD be independently modulated with speech weighted noise, each noise source being independently modulated at the syllabic rate.
Speech weighted noise shall be as defined in ITU G.227 Conventional Telephone signal and is limited to 4.2 kHz. The target modulation index for each carrier is 50% and the fade depth 100%.
Syllabic modulation shall be performed by periodically interrupting a continuous speech weighted noise source for a period of 150ms every 200 ms. In the case of amateur band SSB signals the carrier power column data should be interpreted as the power of the SSB signal during the on period of the syllabic rate modulation.

VDSL2 Performance Test Plan TR-114 Issue 1
November 2009 © The Broadband Forum. All rights reserved. 133 of 144
Table 146: AM radio channel model
RFFrom ADSL plan
Band Frequency (kHz)
Diff (Carrier)
PowerdBm
Phase Offset (rad)
Amateur Band
1 Yes 99 -58 3.463
2 Yes LW 207 -43 2.906
3 LW 270 -93 4.292
4 LW 279 -87 5.538
5 Yes 333 -50 2.098
6 Yes 387 -54 5.083
7 Yes MW 531 -59 2.522
8 Yes MW 603 -60 0.709
9 MW 630 -82 2.914
10 MW 693 -53 4.61
11 Yes MW 711 -57 4.239
12 MW 792 -84 1.167
13 Yes MW 801 -62 5.793
14 MW 855 -80 3.738
15 Yes MW 909 -52 2.317
16 Yes MW 981 -63 0.63
17 MW 999 -63 6.102
18 MW 1080 -76 1.94
19 MW 1269 -83 0.56
20 SW 3235 -83 1.156
21 SW 3250 -56 5.164
22 SW 3300 -61 5.097
23 SW 3330 -71 3.493
24 SW 3355 -74 6.011
25 SW 3365 -59 1.922
26 SW 3390 -70 4.95
27 3695 -75 3.353 Y
28 3720 -56 5.75 Y
29 3730 -56 3.738 Y
30 3770 -90 0.393 Y
31 SW 4810 -55 4.996
32 SW 4845 -80 5.656
33 SW 5015 -55 5.013
34 SW 5035 -93 4.841
35 SW 5970 -54 5.68
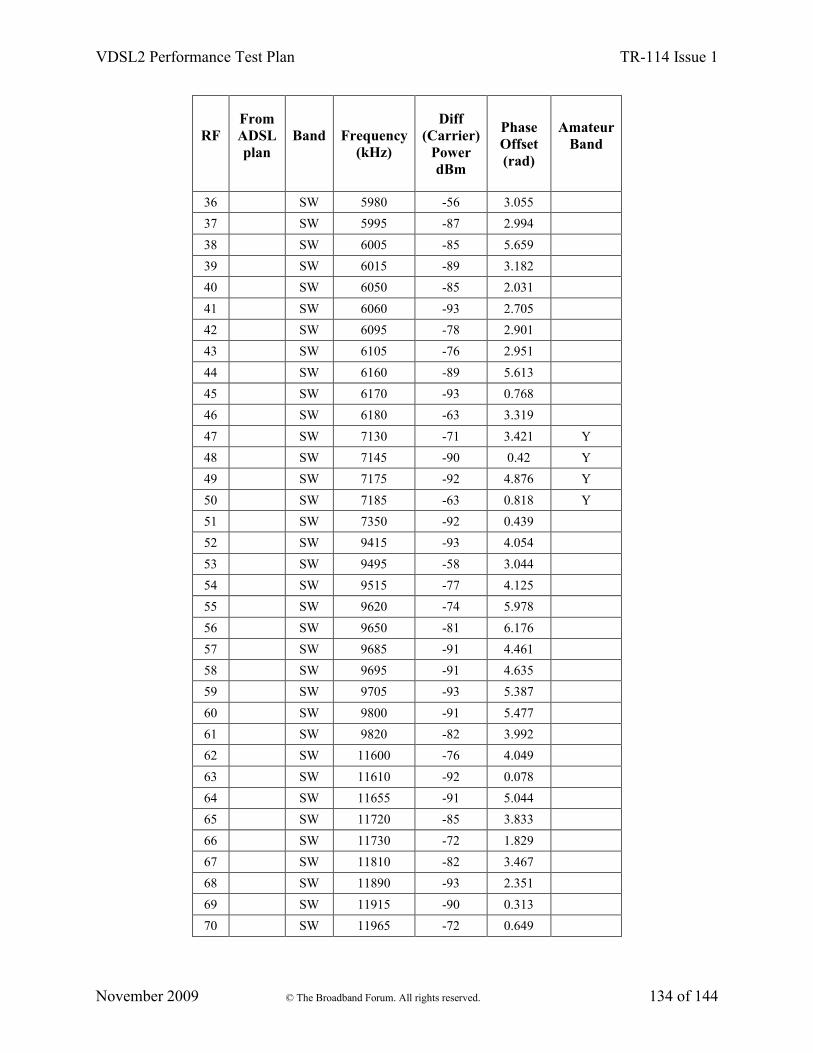
VDSL2 Performance Test Plan TR-114 Issue 1
November 2009 © The Broadband Forum. All rights reserved. 134 of 144
RFFrom ADSL plan
Band Frequency (kHz)
Diff (Carrier)
PowerdBm
Phase Offset (rad)
Amateur Band
36 SW 5980 -56 3.055
37 SW 5995 -87 2.994
38 SW 6005 -85 5.659
39 SW 6015 -89 3.182
40 SW 6050 -85 2.031
41 SW 6060 -93 2.705
42 SW 6095 -78 2.901
43 SW 6105 -76 2.951
44 SW 6160 -89 5.613
45 SW 6170 -93 0.768
46 SW 6180 -63 3.319
47 SW 7130 -71 3.421 Y
48 SW 7145 -90 0.42 Y
49 SW 7175 -92 4.876 Y
50 SW 7185 -63 0.818 Y
51 SW 7350 -92 0.439
52 SW 9415 -93 4.054
53 SW 9495 -58 3.044
54 SW 9515 -77 4.125
55 SW 9620 -74 5.978
56 SW 9650 -81 6.176
57 SW 9685 -91 4.461
58 SW 9695 -91 4.635
59 SW 9705 -93 5.387
60 SW 9800 -91 5.477
61 SW 9820 -82 3.992
62 SW 11600 -76 4.049
63 SW 11610 -92 0.078
64 SW 11655 -91 5.044
65 SW 11720 -85 3.833
66 SW 11730 -72 1.829
67 SW 11810 -82 3.467
68 SW 11890 -93 2.351
69 SW 11915 -90 0.313
70 SW 11965 -72 0.649

VDSL2 Performance Test Plan TR-114 Issue 1
November 2009 © The Broadband Forum. All rights reserved. 135 of 144
RFFrom ADSL plan
Band Frequency (kHz)
Diff (Carrier)
PowerdBm
Phase Offset (rad)
Amateur Band
71 SW 12050 -90 6.006
72 SW 12060 -70 2.648
73 SW 12185 -59 0.385
74 SW 13620 -86 3.852
75 SW 13675 -84 4.685
76 SW 13710 -74 0.995
77 SW 13790 -70 3.553
78 SW 13830 -79 1.205
79 14115 -60 3.316 Y
80 SW 15130 -93 0.34
81 SW 15140 -87 6.108
82 SW 15150 -77 0.79
83 SW 15385 -87 3.954
84 SW 15490 -91 4.853
85 SW 15535 -93 5.685
86 SW 15735 -68 4.193
87 SW 15760 -77 5.347
88 SW 17500 -91 3.477
89 SW 17560 -93 1.664
90 SW 17585 -65 0.468
91 SW 17595 -59 3.72
92 SW 17625 -77 4.62
93 SW 17685 -93 2.864
94 SW 17780 -78 0.826
95 SW 18905 -60 3.551
96 SW 18915 -91 2.09
97 SW 18995 -93 0.823
98 21040 -93 1.601 Y
99 SW 21485 -89 4.111
100 SW 21550 -91 4.507
101 SW 21660 -93 2.196
102 SW 21670 -68 2.135
103 SW 21680 -74 0.743
104 SW 21690 -92 0.092
105 SW 21705 -85 0.138
VDSL2 Performance Test Plan TR-114 Issue 1
November 2009 © The Broadband Forum. All rights reserved. 136 of 144
RFFrom ADSL plan
Band Frequency (kHz)
Diff (Carrier)
PowerdBm
Phase Offset (rad)
Amateur Band
106 SW 21710 -93 2.839
107 SW 21745 -93 5.946
108 SW 21755 -75 0.846
109 SW 23945 -90 4.689
110 SW 23960 -86 4.349
Note: Although the above table includes suggested carrier powers, with a bias towards lower powered signals, this item remains the subject of further study.
D.3.7 Synchronization of the multiple noise models
REIN is not synchronized with any other source. PEIN and fluctuating crosstalk noise sources SHOULD start simultaneously, but SHALL be aligned to start within 1 second.
The same PEIN and fluctuating crosstalk test patterns SHOULD be used for each of the four tests described.

VDSL2 Performance Test Plan TR-114 Issue 1
November 2009 © The Broadband Forum. All rights reserved. 137 of 144
Appendix A Amateur Radio Bands (informative)
Amateur radio bands MAY interfere with some regions of the VDSL2 spectrum. Table 1 belowprovides the frequency ranges of these amateur radio bands as related to frequencies relevant to VDSL2.
Table 147:Amateur Radio Band Frequency Ranges (MHz)
ITU-R Region 1(Europe)
ITU-R Region 2
(Americas)
ITU-R Region 3
(Asia-Pacific)
1.81-1.85 1.80-2.00 1.80-2.00
3.50-3.80 3.50-4.00 3.50-3.90
7.00-7.20 7.00-7.30 7.00-7.20
10.1-10.15
14-14.35
18.068-18.168
21-21.45
24.89-24.99
28-29.7

VDSL2 Performance Test Plan TR-114 Issue 1
November 2009 © The Broadband Forum. All rights reserved. 138 of 144
Appendix B Inside Wiring Topologies (informative)
Testing with inside wiring topologies are for further study.
The segment of twisted pair outside wire has been addressed by previous contributions to the DSL Forum (DSLF2005-560). The splitter is normally located at the NID (network interface device). While the DSL Forum VDSL2 testing specification MAY make reference to the applicable industry requirement for splitters, we recommend that the specific make and model of the splitter, balun, splitter/balun, and diplexer be chosen by the testing laboratory. An integrated splitter and balun is preferred, but alternatively a separate splitter and balun could be used.
VTU-O
Low-pass-SPLITTER High-pass-
Balun
Coax diplexerused to connect to existingcoax wire runs(0.5 dB)
Coax diplexerused to back-feed RF toanother room or a stand-alone data adapter. (0.5dB)
VTU-R
6 feet of RG-6 coax
35 feet ofRG-6 coax
Twisted pair outside wire
Twisted pair inside wire
(0.3 dB)(0.3 dB) 75 ohm 75 ohm
Figure 6:VDSL2 inside wire configuration 1
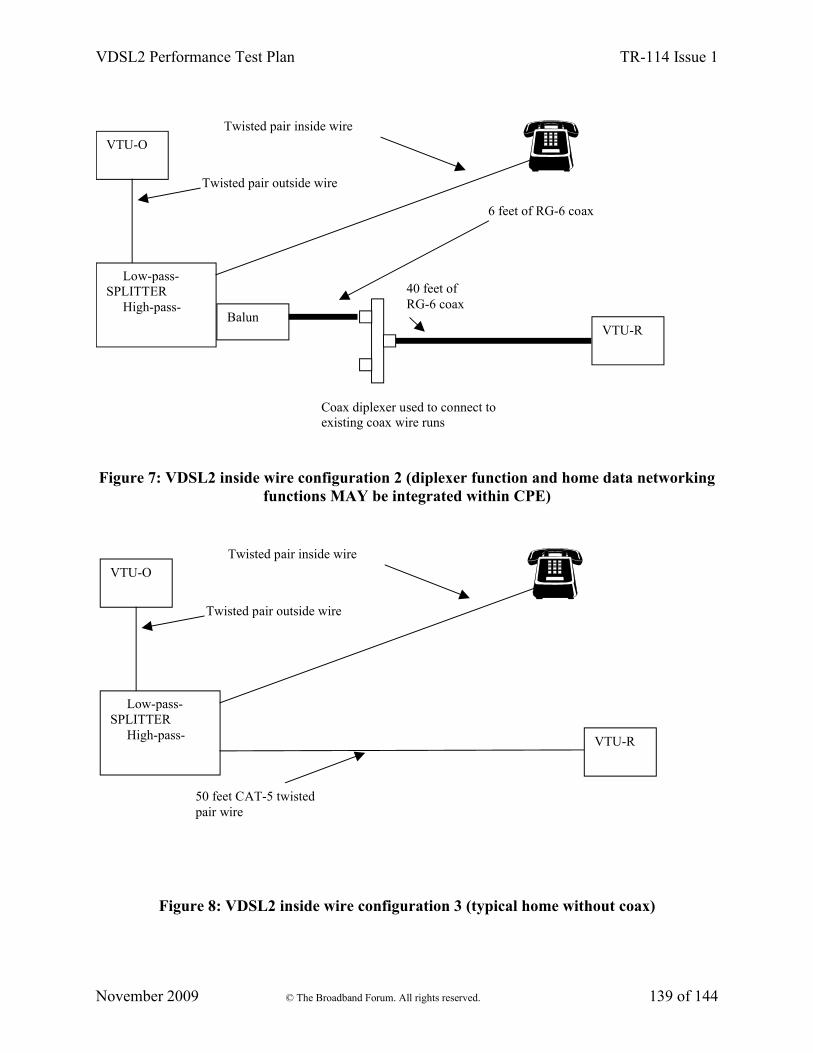
VDSL2 Performance Test Plan TR-114 Issue 1
November 2009 © The Broadband Forum. All rights reserved. 139 of 144
VTU-O
Low-pass-SPLITTER High-pass-
Balun
Coax diplexer used to connect toexisting coax wire runs
VTU-R
6 feet of RG-6 coax
40 feet ofRG-6 coax
Twisted pair outside wire
Twisted pair inside wire
Figure 7: VDSL2 inside wire configuration 2 (diplexer function and home data networking functions MAY be integrated within CPE)
VTU-O
Low-pass-SPLITTER High-pass- VTU-R
Twisted pair outside wire
Twisted pair inside wire
50 feet CAT-5 twistedpair wire
Figure 8: VDSL2 inside wire configuration 3 (typical home without coax)

VDSL2 Performance Test Plan TR-114 Issue 1
November 2009 © The Broadband Forum. All rights reserved. 140 of 144
VTU-O
Low-pass-SPLITTER High-pass- VTU-R
Twisted pair outside wire
Twisted pair inside wire
200 feet CAT-3 twistedpair wire
Figure 9: VDSL2 inside wire configuration 4 (typical MDU without coax)

VDSL2 Performance Test Plan TR-114 Issue 1
November 2009 © The Broadband Forum. All rights reserved. 141 of 144
Appendix C Summary of Profile and Line Combinations (informative)
Table 148: Summary of profile-line combinations used in TR-114
VDSL2 Band-profile
Specific line-setting Profile-line combination
AA8d RA_I_096_056 AA8d_RA_I_096_056
AA8d FX_I_027_002 AA8d_ FX_I_027_002
AA8d FX_I_014_001 AA8d_ FX_I_014_001
AA8d FX_I_040_006 AA8d_ FX_I_040_006
BA8b RA_F_150_150 BA8b_RA_F_150_150
BA8b RA_I_150_150 BA8b_RA_I_150_150
BB8b RA_F_150_150 BB8b_RA_F_150_150
BB8b RA_I_150_150 BB8b_RA_I_150_150
BA8c_D&UPBO RA_F_150_150 BA8c_D&UPBO_RA_F_150_150
BA8c_D&UPBO RA_I_150_150 BA8c_ D&UPBO_RA_I_150_150
BA8c_D&UPBO RA_HI_150_150 BA8c_ D&UPBO_RA_HI_150_150
BA8c_D&UPBO FX_HI_010_004 BA8c_ D&UPBO_FX_HI_010_004
BA8c_D&UPBO FX_HI_006_003 BA8c_ D&UPBO_FX_HI_006_003
BA8c_D&UPBO FX_HI_011_003 BA8c_ D&UPBO_FX_HI_011_003
BA8c_D&UPBO FX_I_027_009 BA8c_ D&UPBO_FX_I_027_009
BA8c_D&UPBO FX_I_024_008 BA8c_ D&UPBO_FX_I_024_008
BA8c_D&UPBO FX_I_014_005 BA8c_ D&UPBO_FX_I_014_005
BA8c_D&UPBO FX_I_010_003 BA8c_ D&UPBO_FX_I_010_003
BA8c_D&UPBO FX_I_005_001 BA8c_ D&UPBO_FX_I_005_001
CG8d RA_I_105_105 CG8d_RA_ I_105_105
BA12a RA_F_150_150 BA12a_RA_F_150_150
BA12a RA_I_150_150 BA12a_RA_I_150_150
BB12a RA_F_150_150 BB12a_RA_F_150_150
BB12a RA_I_150_150 BB12a_RA_I_150_150
CG12a RA_ I_105_105 CG12a_RA_ I_105_105

VDSL2 Performance Test Plan TR-114 Issue 1
November 2009 © The Broadband Forum. All rights reserved. 142 of 144
BA17a RA_F_150_150 BA17a_RA_F_150_150
BA17a RA_I_150_150 BA17a_RA_I_150_150
BA17a_D&UPBO RA_F_150_150 BA17a_ D&UPBO_RA_F_150_150
BA17a_D&UPBO RA_I_150_150 BA17a_ D&UPBO_RA_I_150_150
BB17a RA_F_150_150 BB17a_RA_F_150_150
BB17a RA_I_150_150 BB17a_RA_I_150_150
BB17a_D&UPBO RA_F_150_150 BB17a_ D&UPBO_RA_F_150_150
BB17a_D&UPBO RA_I_150_150 BB17a_ D&UPBO_RA_I_150_150
CG17a RA_ I_105_105 CG17a_RA_ I_105_105
CG30a RA_ I_105_105 CG30a_RA_ I_105_105

VDSL2 Performance Test Plan TR-114 Issue 1
November 2009 © The Broadband Forum. All rights reserved. 143 of 144
Appendix D Crosstalk impairment for AA8d performance testing (informative)
Table 149: Annex A testing CPE NoiseFreq(kHz)
0.3(kft)
0.6(kft)
0.9(kft)
1.2(kft)
1.6(kft)
2.0(kft)
2.4(kft)
2.8(kft)
3.2(kft)
3.6(kft)
4.0(kft)
4.5(kft)
5.5(kft)
6.5(kft)
.1 −140.0 −140.0 −140.0 −140.0 −140.0 −140.0 −140.0 −140.0 −140.0 −140.0 −140.0 −140.0 −140.0 −140.04 −140.0 −140.0 −140.0 −140.0 −140.0 −140.0 −140.0 −140.0 −140.0 -140.0 −140.0 −140.0 −140.0 −140.0
16 −125.7 −123.8 −123.0 −122.6 −122.2 −122.0 −121.9 −121.9 −121.8 -121.8 −121.8 −121.4 −121.4 −121.424 −110.5 −108.5 −107.7 −107.2 −106.9 −106.7 −106.6 −106.5 −106.5 -106.4 −106.4 −106.0 −105.9 −105.936 −105.4 −103.5 −102.7 −102.2 −101.9 −101.7 −101.6 −101.5 −101.5 -101.4 −101.4 −100.9 −100.9 −100.952 −103.0 −101.1 −100.3 −99.8 −99.5 −99.3 −99.2 −99.1 −99.0 -99.0 −99.0 −98.5 −98.5 −98.578 −100.3 −98.4 −97.6 −97.2 −96.8 −96.6 −96.5 −96.4 −96.4 -96.3 −96.9 −95.8 −96.4 −96.4112 −97.9 −96.0 −95.2 −94.7 −94.4 −94.2 −94.1 −94.0 −94.0 -94 −94.0 −93.5 −93.5 −93.5134 −96.6 −94.8 −94.0 −93.5 −93.2 −93.0 −92.9 −92.8 −92.8 -92.8 −92.8 −92.3 −92.3 −92.3138 −96.4 −94.6 −93.8 −93.3 −92.9 −92.8 −92.7 −92.6 −92.6 -92.6 −92.6 −92.1 −92.1 −92.1142 −99.0 −97.2 −95.1 −94.6 −95.6 −95.4 −95.3 −95.3 −95.3 -95.2 −95.2 −94.7 −94.8 −94.8512 −108.6 −107.3 −107.2 −107.6 −108.6 −109.8 −111.2 −112.8 −114.4 -116.1 −116.1 −108.8 −113.5 −118.3
1104 −103.4 −102.2 −102.9 −104.1 −106.1 −108.4 −110.8 −113.4 −116.1 -118.8 −118.8 −113.9 −121.1 −128.31516 −100.4 −100.3 −101.5 −103.1 −105.7 −108.6 −111.6 −114.8 −118.1 -121.4 −121.4 −125.0 −132.9 −138.02208 −97.8 −98.3 −100.1 −102.4 −105.8 −109.6 −113.5 −117.5 −121.6 -125.7 −125.7 -132.6 −138.4 −139.53748 −94.7 −96.4 −99.2 −102.4 −106.8 −110.5 −112.7 −113.6 −113.9 -114 −114.0 −138.9 −139.2 −139.23750 −119.3 −117.4 −114.0 −113.7 −113.7 −113.8 −113.8 −113.8 −113.8 -113.8 −113.8 −139.2 −139.2 −139.23752 −119.5 −117.5 −114.1 −109.8 −103.9 −97.9 −91.9 −86.8 −86.8 -86.8 −86.8 −139.2 −139.2 −139.23880 −123.9 −119.1 −114.6 −110.0 −103.9 −97.8 −91.7 −86.6 −86.6 -86.6 −86.6 −139.2 −139.2 −139.24300 −125.3 −120.2 −115.4 −110.6 −104.2 −97.8 −91.3 −85.9 −85.9 -85.9 −85.9 −139.0 −139.0 −139.05000 −127.2 −121.9 −116.7 −111.5 −104.6 −97.7 −90.8 −84.9 −84.9 -84.9 −84.9 −138.8 −138.8 −138.85176 −121.3 −120.4 −116.8 −111.8 −104.7 −97.7 −90.7 −84.7 −84.7 -84.7 −84.7 −138.8 −138.8 −138.85198 −118.9 −119.2 −116.6 −111.8 −104.8 −97.7 −90.6 −84.7 −84.7 -84.7 −84.7 −138.7 −138.7 −138.75200 −118.7 −119.1 −116.5 −111.8 −111.6 −111.7 −111.7 −111.7 −111.7 -111.7 −111.7 −138.7 −138.7 −138.75202 −94.3 −96.8 −100.5 −104.1 −108.5 −110.8 −111.6 −111.8 −111.9 -138.5 −111.9 −138.7 −138.7 −138.76000 −93.5 −96.4 −100.7 −105.4 −112.1 −119.1 −126.1 −132.5 −136.9 -138.6 −138.5 −138.5 −138.5 −138.57000 −92.6 −96.1 −100.8 −106.1 −113.4 −121.1 −128.6 −134.8 −137.8 -138.4 −138.6 −138.2 −138.2 −138.28498 −91.6 −95.8 −101.2 −107.1 −115.4 −123.9 −131.7 −136.7 −138.1 -138.4 −138.4 −137.7 −137.7 −137.78500 −116.6 −120.7 −126.0 −131.2 −136.3 −138.0 −138.3 −138.4 −138.4 -138.4 −138.4 −137.7 −137.7 −137.78502 −116.9 −121.0 −126.2 −131.5 −136.4 −138.1 −138.3 −138.4 −138.4 -138.3 −138.4 −137.7 −137.7 −137.78752 −137.2 −137.9 −138.2 −138.3 −138.3 −138.3 −138.3 −138.3 −138.3 −138.3 −138.3 −137.6 −137.6 −137.69300 −137.2 −137.9 −138.2 −138.2 −138.3 −138.3 −138.3 −138.3 −138.3 −138.3 −138.3 −138.3 −138.3 −138.3
12000 −137.2 −137.9 −138.2 −138.2 −138.3 −138.3 −138.3 −138.3 −138.3 −138.3 −138.3 −138.3 −138.3 −138.316000 −137.2 −137.9 −138.2 −138.2 −138.3 −138.3 −138.3 −138.3 −138.3 −138.3 −138.3 −138.3 −138.3 −138.3

VDSL2 Performance Test Plan TR-114 Issue 1
November 2009 © The Broadband Forum. All rights reserved. 144 of 144
Table 150: Annex A testing DSLAM noise (at DSLAM)Freq(kHz)
0.3(kft)
0.6(kft)
0.9(kft)
1.2(kft)
1.6(kft)
2.0(kft)
2.4(kft)
2.8(kft)
3.2(kft)
3.6(kft)
4.0(kft)
4.5(kft)
5.5(kft)
6.5(kft)
0.001 -140 -140 -140 -140 -140 -140 -140 -140 -140 -140 -140 -140 -140 -140
4 -140 -140 -140 -140 -140 -140 -140 -140 -140 -140 -140 -140 -140 -140
16 -135.5 -134.1 -133.4 -133 -132.8 -132.7 -132.7 -132.8 -132.9 -133.1 -133.3 133.3 -134 -134.9
24 -121.1 -119.1 -118.2 -117.7 -117.5 -117.4 -117.4 -117.6 -117.8 -118.1 -118.5 -118.6 -120 -121.5
36 -115.3 -113.2 -112.4 -111.9 -111.6 -111.6 -111.7 -112 -112.4 -112.8 -113.4 -113.7 -115.5 -117.4
52 -112.1 -110.1 -109.2 -108.7 -108.5 -108.6 -108.8 -109.2 -109.8 -110.4 -111.1 -111.6 -113.6 -115.8
78 -108.6 -106.6 -105.7 -105.3 -105.2 -105.4 -105.8 -106.4 -107.1 -107.9 -108.7 -109.3 -111.5 -113.9
112 -105.4 -103.4 -102.6 -102.2 -102.2 -102.6 -103.2 -103.9 -104.6 -105.4 -106.1 -106.6 -108.7 -110.6
134 -103.5 -101.6 -100.7 -100.4 -100.5 -100.9 -101.5 -102.1 -102.7 -103.4 -103.3 -102.6 -103.6 -104.2
138 -103.2 -101.2 -100.4 -100.1 -100.2 -100.5 -101.1 -101.6 -102.2 -102.9 -102.5 -101.5 -102.3 -102.8
142 -105.3 -103.3 -102.5 -102.2 -102.3 -102.6 -103 -103.5 -104 -104.6 -103.6 -96.6 -96.7 -96.8
512 -102.6 -100.9 -100.3 -100.1 -99.9 -99.9 -99.9 -99.9 -99.9 -99.9 -97.2 -88.5 -88.5 -88.5
1104 -96.6 -95.3 -95 -94.9 -94.9 -94.9 -94.9 -94.9 -94.9 -94.9 -92.2 -83.5 -83.5 -83.5
1516 -94.1 -93.1 -92.9 -92.8 -92.8 -92.8 -92.8 -92.8 -92.8 -92.8 -90.1 -88.8 -88.8 -88.8
2208 -91.3 -90.5 -90.4 -90.4 -90.3 -90.3 -90.3 -90.3 -90.3 -90.3 -88.2 -88.4 -88.4 -88.4
3748 -87.8 -87.4 -87.3 -87.3 -87.3 -87.3 -87.3 -87.3 -87.3 -87.3 -87.3 -89.1 -89.1 -89.1
3750 -114.2 -113.7 -113.6 -113.7 -113.7 -113.8 -113.8 -113.8 -113.8 -113.8 -113.8 -115.6 -115.6 -115.6
3752 -114.4 -113.9 -113.8 -113.7 -113.6 -113.6 -113.5 -113.5 -113.9 -114.0 -114.0 -115.8 -115.8 -115.8
3880 -126.7 -125.3 -124.4 -123.8 -123.1 -122.6 -122.2 -122.6 -125.9 -127.4 -127.9 -129.8 -129.8 -129.8
4300 -131.4 -129.1 -127.7 -126.8 -125.9 -125.2 -124.7 -125.3 -130.6 -134.6 -136.5 -137.8 -137.8 -137.8
5000 -131.5 -129.9 -128.9 -128.2 -127.4 -126.9 -126.6 -127.1 -131.4 -133.4 -138.1 -138.7 -138.7 -138.7
5176 -115.1 -114.8 -114.7 -114.7 -114.7 -114.7 -114.6 -114.7 -114.8 -114.8 -138.1 -138.6 -138.6 -138.6
5198 -112.3 -111.9 -111.9 -111.9 -111.8 -111.8 -111.8 -111.8 -111.9 -111.9 -138.1 -138.6 -138.6 -138.6
5200 -112 -111.7 -111.6 -111.6 -111.6 -111.7 -111.7 -111.7 -111.7 -111.7 -138.4 -138.6 -138.6 -138.6
5202 -87 -86.7 -86.7 -86.7 -86.7 -86.7 -86.7 -86.7 -86.7 -86.7 -138.4 -138.6 -138.6 -138.6
6000 -86 -85.8 -85.7 -85.7 -85.7 -85.7 -85.7 -85.7 -85.7 -85.7 -138.1 -138.4 -138.4 -138.4
7000 -85 -84.7 -84.7 -84.7 -84.7 -84.7 -84.7 -84.7 -84.7 -84.7 -137.8 -138.0 -138.0 -138.0
8498 -83.6 -83.5 -83.5 -83.5 -83.5 -83.5 -83.5 -83.5 -83.5 -83.5 -137.2 -137.5 -137.5 -137.5
8500 -108.6 -108.5 -108.5 -108.5 -108.5 -108.5 -108.5 -108.5 -108.5 -108.5 -137.2 -137.5 -137.5 -137.5
8502 -108.9 -108.8 -108.8 -108.8 -108.8 -108.8 -108.8 -108.8 -108.8 -108.8 -137.2 -137.5 -137.5 -137.5
8752 -134.1 -134.1 -134.1 -134.1 -134.1 -134.1 -134.1 -134.1 -134.1 -134.1 -137.1 -137.4 -137.4 -137.4
9300 -134.3 -134.2 -134.2 -134.2 -134.2 -134.2 -134.2 -134.2 -134.2 -134.2 -137 -137.3 -137.3 -137.3
12000 -134.3 -134.2 -134.2 -134.2 -134.2 -134.2 -134.2 -134.2 -134.2 -134.2 -137 -137.3 -137.3 -137.3
16000 -134.3 -134.2 -134.2 -134.2 -134.2 -134.2 -134.2 -134.2 -134.2 -134.2 -137 -137.3 -137.3 -137.3
End of Broadband Forum Technical Report TR-114