ve n tas , i n c . f o r m 10-q s e c u r i t i e s a n d
TRANSCRIPT

UNITED STATESSECURITIES AND EXCHANGE COMMISSION
Washington, D.C. 20549
FORM 10-Q(Mark One)
☒ QUARTERLY REPORT PURSUANT TO SECTION 13 OR 15(d) OF THE SECURITIESEXCHANGE ACT OF 1934 FOR THE QUARTERLY PERIOD ENDED JUNE 30, 2020
OR
☐ TRANSITION REPORT PURSUANT TO SECTION 13 OR 15(d) OF THE SECURITIES EXCHANGEACT OF 1934 FOR THE TRANSITION PERIOD FROM TO
Commission file number: 1-10989
Ventas, Inc.(Exact Name of Registrant as Specified in Its Charter)
Delaware 61-1055020(State or Other Jurisdiction of Incorporation or Organization) (I.R.S. Employer Identification No.)
353 N. Clark Street, Suite 3300Chicago, Illinois
United States(Address of Principal Executive Offices)
60654 (Zip Code)
Not Applicable (877) 483-6827
(Former Name, Former Address and Former Fiscal Year, if Changed SinceLast Report)
(Registrant’s Telephone Number, Including Area Code)
Indicate by check mark whether the registrant (1) has filed all reports required to be filed by Section 13 or 15(d) of the Securities Exchange Act of1934 during the preceding 12 months (or for such shorter period that the registrant was required to file such reports), and (2) has been subject to such filingrequirements for the past 90 days. Yes x No ☐
Indicate by check mark whether the registrant has submitted electronically every Interactive Data File required to be submitted pursuant to Rule 405 ofRegulation S-T (§232.405 of this chapter) during the preceding 12 months (or for such shorter period that the registrant was required to submit suchfiles). Yes x No ☐
Indicate by check mark whether the registrant is a large accelerated filer, an accelerated filer, a non-accelerated filer, a smaller reporting company, oran emerging growth company. See the definitions of “large accelerated filer,” “accelerated filer,” “smaller reporting company,” and “emerging growthcompany” in Rule 12b-2 of the Exchange Act.
Large accelerated filer x Accelerated filer ☐ Non-accelerated filer ☐
Smaller reporting company ☐ Emerging growth company ☐
Securities registered pursuant to Section 12(b) of the Act:
Trading symbol: Class of Common Stock: Name of exchange on which registered:
VTR Common Stock, $0.25 par value New York Stock Exchange
Indicate the number of shares outstanding of each of the issuer’s classes of common stock, as of the latest practicable date.
Outstanding at August 4, 2020:
373,087,555
If an emerging growth company, indicate by check mark if the registrant has elected not to use the extended transition period for complying with anynew or revised financial accounting standards provided pursuant to Section 13(a) of the Exchange Act. ☐ Indicate by check mark whether the registrant is a shell company (as defined in Rule 12b-2 of the Exchange Act). Yes ☐ No x
1

VENTAS, INC.FORM 10-Q
INDEX
PagePART I—FINANCIAL INFORMATION Item 1. Consolidated Financial Statements (Unaudited) 1
Consolidated Balance Sheets as of June 30, 2020 and December 31, 2019 1Consolidated Statements of Income for the Three and Six Months Ended June 30, 2020 and 2019 2Consolidated Statements of Comprehensive Income for the Three and Six Months Ended June 30, 2020 and 2019 3Consolidated Statements of Equity for the Three and Six Months Ended June 30, 2020 and 2019 4Consolidated Statements of Cash Flows for the Six Months Ended June 30, 2020 and 2019 6Notes to Consolidated Financial Statements 8
Item 2. Management’s Discussion and Analysis of Financial Condition and Results of Operations 34Item 3. Quantitative and Qualitative Disclosures About Market Risk 60Item 4. Controls and Procedures 62PART II—OTHER INFORMATIONItem 1. Legal Proceedings 63Item 2. Unregistered Sales of Equity Securities and Use of Proceeds 63Item 5. Other Information 63Item 6. Exhibits 64

PART I—FINANCIAL INFORMATION
ITEM 1. CONSOLIDATED FINANCIAL STATEMENTS
VENTAS, INC.CONSOLIDATED BALANCE SHEETS
(Unaudited)As of June 30, 2020 As of December 31, 2019
(In thousands, except per share amounts)
AssetsReal estate investments:
Land and improvements $ 2,256,981 $ 2,283,929 Buildings and improvements 23,959,070 24,380,440 Construction in progress 495,888 461,354 Acquired lease intangibles 1,240,488 1,306,152 Operating lease assets 389,302 385,225
28,341,729 28,817,100 Accumulated depreciation and amortization (7,448,987) (7,088,013) Net real estate property 20,892,742 21,729,087
Secured loans receivable and investments, net 681,831 704,612 Investments in unconsolidated real estate entities 166,039 45,022 Net real estate investments 21,740,612 22,478,721
Cash and cash equivalents 992,824 106,363 Escrow deposits and restricted cash 36,312 39,739 Goodwill 1,050,115 1,051,161 Assets held for sale 81,817 91,433 Deferred income tax assets, net 304 47,495 Other assets 687,404 877,296
Total assets $ 24,589,388 $ 24,692,208
Liabilities and equity Liabilities:
Senior notes payable and other debt $ 12,530,036 $ 12,158,773 Accrued interest 117,687 111,115 Operating lease liabilities 248,912 251,196 Accounts payable and other liabilities 998,186 1,145,700 Liabilities related to assets held for sale 5,773 5,463 Deferred income tax liabilities 56,964 200,831 Total liabilities 13,957,558 13,873,078
Redeemable OP unitholder and noncontrolling interests 231,920 273,678 Commitments and contingenciesEquity:
Ventas stockholders’ equity:
Preferred stock, $1.00 par value; 10,000 shares authorized, unissued — — Common stock, $0.25 par value; 600,000 shares authorized, 373,113 and 372,811 sharesissued at June 30, 2020 and December 31, 2019, respectively 93,261 93,185 Capital in excess of par value 14,118,119 14,056,453 Accumulated other comprehensive loss (82,761) (34,564) Retained earnings (deficit) (3,816,460) (3,669,050) Treasury stock, 24 and 2 shares at June 30, 2020 and December 31, 2019, respectively (947) (132)
Total Ventas stockholders’ equity 10,311,212 10,445,892 Noncontrolling interests 88,698 99,560
Total equity 10,399,910 10,545,452
Total liabilities and equity $ 24,589,388 $ 24,692,208
See accompanying notes.
1

VENTAS, INC.CONSOLIDATED STATEMENTS OF INCOME
(Unaudited)
For the Three Months Ended June 30, For the Six Months Ended June 30,
2020 2019 2020 2019(In thousands, except per share amounts)
Revenues Rental income:
Triple-net leased $ 176,240 $ 196,382 $ 371,102 $ 396,450 Office 192,925 202,188 401,320 403,616
369,165 398,570 772,422 800,066 Resident fees and services 549,329 520,725 1,126,099 1,042,172 Office building and other services revenue 3,673 2,691 6,801 5,209 Income from loans and investments 19,491 19,529 43,537 36,655 Interest and other income 1,540 9,202 6,393 9,489
Total revenues 943,198 950,717 1,955,252 1,893,591 Expenses Interest 123,132 110,369 239,828 220,988 Depreciation and amortization 349,594 226,187 598,431 462,107 Property-level operating expenses:
Senior living 432,578 366,837 842,709 727,823 Office 60,752 62,743 125,258 124,828 Triple-net leased 5,275 6,321 11,606 13,754
498,605 435,901 979,573 866,405 Office building services costs 543 515 1,270 1,148 General, administrative and professional fees 29,984 43,079 72,519 83,839 Loss on extinguishment of debt, net — 4,022 — 4,427 Merger-related expenses and deal costs 6,586 4,600 14,804 6,780
Allowance on loans receivable and investments 29,655 — 29,655 — Other 3,382 (11,481) 7,090 (11,458)
Total expenses 1,041,481 813,192 1,943,170 1,634,236 (Loss) income before unconsolidated entities, real estate dispositions, incometaxes and noncontrolling interests (98,283) 137,525 12,082 259,355
Loss from unconsolidated entities (5,850) (2,529) (16,726) (3,475) Gain on real estate dispositions 1,254 19,150 227,479 24,597 Income tax (expense) benefit (56,356) 57,752 92,660 59,009
(Loss) income from continuing operations (159,235) 211,898 315,495 339,486 Net (loss) income (159,235) 211,898 315,495 339,486
Net (loss) income attributable to noncontrolling interests (2,065) 1,369 (452) 3,172
Net (loss) income attributable to common stockholders $ (157,170) $ 210,529 $ 315,947 $ 336,314
Earnings per common share Basic:
(Loss) income from continuing operations $ (0.43) $ 0.59 $ 0.85 $ 0.94 Net (loss) income attributable to common stockholders (0.42) 0.58 0.85 0.94
Diluted: (Loss) income from continuing operations $ (0.43) $ 0.58 $ 0.84 $ 0.93 Net (loss) income attributable to common stockholders (0.42) 0.58 0.84 0.93
See accompanying notes.
2

VENTAS, INC.CONSOLIDATED STATEMENTS OF COMPREHENSIVE INCOME
(Unaudited)
For the Three Months Ended June 30, For the Six Months Ended June 30, 2020 2019 2020 2019
(In thousands)
Net (loss) income $ (159,235) $ 211,898 $ 315,495 $ 339,486 Other comprehensive income (loss):
Foreign currency translation (4,309) (8,586) (12,849) (4,759) Unrealized gain (loss) on available for sale securities 31,440 (2,395) (20,259) 6,896 Derivative instruments (2,788) (16,625) (21,375) (22,063) Total other comprehensive income (loss) 24,343 (27,606) (54,483) (19,926)
Comprehensive (loss) income (134,892) 184,292 261,012 319,560 Comprehensive income (loss) attributable to noncontrolling interests 1,630 1,369 (6,739) 3,172
Comprehensive (loss) income attributable to common stockholders $ (136,522) $ 182,923 $ 267,751 $ 316,388
See accompanying notes.
3

VENTAS, INC.CONSOLIDATED STATEMENTS OF EQUITY
For the Three Months Ended June 30, 2020 and 2019(Unaudited)
2019
CommonStock Par
Value
Capital inExcess ofPar Value
AccumulatedOther
ComprehensiveLoss
RetainedEarnings(Deficit)
TreasuryStock
Total VentasStockholders’
EquityNoncontrolling
Interests Total Equity
2019 (In thousands, except per share amounts)Balance at April 1, 2020 $ 93,256 $ 14,135,657 $ (103,408) $ (3,491,696) $ (867) $ 10,632,942 $ 83,455 $ 10,716,397 Net loss — — — (157,170) — (157,170) (2,065) (159,235) Other comprehensive loss — — 20,647 — — 20,647 3,696 24,343 Net change in noncontrolling interests — 252 — — — 252 3,612 3,864 Dividends to common stockholders—
$0.45 per share — — — (168,126) — (168,126) — (168,126) Issuance of common stock for stock plans,
restricted stock grants and other 5 1,999 — 532 (80) 2,456 — 2,456 Adjust redeemable OP unitholder interests
to current fair value — (19,789) — — — (19,789) — (19,789)
Balance at June 30, 2020 $ 93,261 $ 14,118,119 $ (82,761) $ (3,816,460) $ (947) $ 10,311,212 $ 88,698 $ 10,399,910
Balance at April 1, 2019 $ 89,579 $ 13,160,550 $ (12,065) $ (3,088,401) $ — $ 10,149,663 $ 56,350 $ 10,206,013 Net income — — — 210,529 — 210,529 1,369 211,898 Other comprehensive income — — (27,606) — — (27,606) — (27,606) Net change in noncontrolling interests — (408) — — — (408) (1,368) (1,776) Dividends to common stockholders—
$0.7925 per share — — — (295,415) — (295,415) — (295,415) Issuance of common stock 3,163 764,555 — — — 767,718 — 767,718 Issuance of common stock for stock plans,
restricted stock grants and other 110 31,361 — — — 31,471 — 31,471 Adjust redeemable OP unitholder interests
to current fair value — (15,941) — — — (15,941) — (15,941)
Balance at June 30, 2019 $ 92,852 $ 13,940,117 $ (39,671) $ (3,173,287) $ — $ 10,820,011 $ 56,351 $ 10,876,362
See accompanying notes.
4

VENTAS, INC.CONSOLIDATED STATEMENTS OF EQUITY
For the Six Months Ended June 30, 2020 and 2019(Unaudited)
2019
CommonStock Par
Value
Capital inExcess ofPar Value
AccumulatedOther
ComprehensiveLoss
RetainedEarnings(Deficit)
TreasuryStock
Total VentasStockholders’
EquityNoncontrolling
Interests Total Equity
2020 (In thousands, except per share amounts)Balance at January 1, 2020 $ 93,185 $ 14,056,453 $ (34,564) $ (3,669,050) $ (132) $ 10,445,892 $ 99,560 $ 10,545,452 Net income (loss) — — — 315,947 — 315,947 (452) $ 315,495 Other comprehensive loss — — (48,197) — — (48,197) (6,286) $ (54,483) Net change in noncontrolling interests — 1,013 — — — 1,013 (4,124) $ (3,111) Dividends to common stockholders—
$1.2425 per share — — — (464,608) — (464,608) — $ (464,608) Issuance of common stock for stock
plans, restricted stock grants andother 76 12,893 — 1,251 (815) 13,405 — $ 13,405
Adjust redeemable OP unitholderinterests to current fair value — 48,022 — — — 48,022 — $ 48,022
Redemption of OP Units — (262) — — — (262) — $ (262)
Balance at June 30, 2020 $ 93,261 $ 14,118,119 $ (82,761) $ (3,816,460) $ (947) $ 10,311,212 $ 88,698 $ 10,399,910
Balance at January 1, 2019 $ 89,125 $ 13,076,528 $ (19,582) $ (2,930,214) $ — $ 10,215,857 $ 55,737 $ 10,271,594 Net income — — — 336,314 — 336,314 3,172 339,486 Other comprehensive income — — (19,926) — — (19,926) — (19,926) Net change in noncontrolling interests — (2,098) — — — (2,098) (2,558) (4,656) Dividends to common stockholders—
$1.585 per share — — — (580,188) — (580,188) — (580,188) Issuance of common stock 3,553 862,603 — — — 866,156 — 866,156 Issuance of common stock for stock
plans, restricted stock grants andother 174 38,093 — — — 38,267 — 38,267
Adjust redeemable OP unitholderinterests to current fair value — (35,009) — — — (35,009) — (35,009)
Cumulative effect change inaccounting principles — — (163) 801 — 638 — 638
Balance at June 30, 2019 $ 92,852 $ 13,940,117 $ (39,671) $ (3,173,287) $ — $ 10,820,011 $ 56,351 $ 10,876,362
See accompanying notes.
5

VENTAS, INC.CONSOLIDATED STATEMENTS OF CASH FLOWS
(Unaudited)
For the Six Months Ended June 30,
2020 2019
(In thousands)Cash flows from operating activities:
Net income $ 315,495 $ 339,486 Adjustments to reconcile net income to net cash provided by operating activities:Depreciation and amortization 598,431 462,107 Amortization of deferred revenue and lease intangibles, net (6,334) (6,145) Other non-cash amortization 9,653 11,587
Allowance on loans receivable and investments 29,655 — Stock-based compensation 11,557 18,475 Straight-lining of rental income 91,499 (17,000) Loss on extinguishment of debt, net — 4,427 Gain on real estate dispositions (227,479) (24,597) Gain on real estate loan investments (167) — Income tax benefit (95,127) (61,195) Loss from unconsolidated entities 16,734 3,475 Distributions from unconsolidated entities 1,600 1,300 Other 12,756 5,091
Changes in operating assets and liabilities:Increase in other assets (12,463) (44,472) Increase in accrued interest 7,094 11,398 (Decrease) increase in accounts payable and other liabilities (32,893) 25,282
Net cash provided by operating activities 720,011 729,219 Cash flows from investing activities:
Net investment in real estate property (77,469) (208,039) Investment in loans receivable (67,290) (507,148) Proceeds from real estate disposals 627,804 74,405 Proceeds from loans receivable 106,775 289,657 Development project expenditures (180,398) (114,226) Capital expenditures (53,519) (58,381) Investment in unconsolidated entities (7,865) (934) Insurance proceeds for property damage claims 42 16,939
Net cash provided by (used in) investing activities 348,080 (507,727) Cash flows from financing activities:
Net change in borrowings under revolving credit facilities 465,416 (506,551) Net change in borrowings under commercial paper program (565,524) 269,810 Proceeds from debt 640,533 712,934 Repayment of debt (111,301) (997,061) Payment of deferred financing costs (7,549) (6,837) Issuance of common stock, net — 866,033 Cash distribution to common stockholders (592,285) (567,142) Cash distribution to redeemable OP unitholders (4,628) (4,551) Cash issued for redemption of OP Units (570) — Contributions from noncontrolling interests 346 3,594 Distributions to noncontrolling interests (6,293) (4,103) Proceeds from stock option exercises 3,518 25,738 Other (4,891) (6,732)
Net cash used in financing activities (183,228) (214,868)
Net increase in cash, cash equivalents and restricted cash 884,863 6,624 Effect of foreign currency translation (1,829) 208 Cash, cash equivalents and restricted cash at beginning of period 146,102 131,464
Cash, cash equivalents and restricted cash at end of period $ 1,029,136 $ 138,296
See accompanying notes.
6

VENTAS, INC.CONSOLIDATED STATEMENTS OF CASH FLOWS (Continued)
(Unaudited)
For the Six Months Ended June 30,
2020 2019
(In thousands)Supplemental schedule of non-cash activities:
Assets acquired and liabilities assumed from acquisitions and other: Real estate investments $ 77,111 $ 1,069 Other assets 614 183 Debt 55,368 — Other liabilities 2,097 1,252 Noncontrolling interests 20,259 —
See accompanying notes.
7

VENTAS, INC.NOTES TO CONSOLIDATED FINANCIAL STATEMENTS
(Unaudited)
NOTE 1—DESCRIPTION OF BUSINESS
Ventas, Inc. (together with its subsidiaries, unless otherwise indicated or except where the context otherwise requires, “we,” “us” or “our”), an S&P500 company, is a real estate investment trust (“REIT”) with a highly diversified portfolio of senior housing, research and innovation, and healthcareproperties located throughout the United States, Canada and the United Kingdom. As of June 30, 2020, we owned or managed through unconsolidated jointventures approximately 1,200 properties (including properties classified as held for sale), consisting of senior housing communities, medical officebuildings (“MOBs”), research and innovation centers, inpatient rehabilitation facilities (“IRFs”) and long-term acute care facilities (“LTACs”), and healthsystems. We also had 20 properties under development, including two properties that are owned by unconsolidated real estate entities. Our company wasoriginally founded in 1983 and is headquartered in Chicago, Illinois.
We primarily invest in senior housing, research and innovation, and healthcare properties through acquisitions and lease our properties to unaffiliatedtenants or operate them through independent third-party managers.
As of June 30, 2020, we leased a total of 385 properties (excluding properties within our office operations reportable business segment) to varioushealthcare operating companies under “triple-net” or “absolute-net” leases that obligate the tenants to pay all property-related expenses, includingmaintenance, utilities, repairs, taxes, insurance and capital expenditures. Our three largest tenants, Brookdale Senior Living Inc. (together with itssubsidiaries, “Brookdale Senior Living”), Ardent Health Partners, LLC (together with its subsidiaries, “Ardent”) and Kindred Healthcare, LLC (togetherwith its subsidiaries, “Kindred”) leased from us 122 properties (excluding two properties managed by Brookdale Senior Living pursuant to long-termmanagement agreements), 11 properties and 32 properties, respectively, as of June 30, 2020.
As of June 30, 2020, pursuant to long-term management agreements, we engaged independent operators, such as Atria Senior Living, Inc. (“Atria”)and Sunrise Senior Living, LLC (together with its subsidiaries, “Sunrise”), to manage 435 senior housing communities for us. Through our Lillibridge Healthcare Services, Inc. subsidiary and our ownership interest in PMB Real Estate Services LLC, we also provide MOBmanagement, leasing, marketing, facility development and advisory services to highly rated hospitals and health systems throughout the United States. Inaddition, from time to time, we make secured and non-mortgage loans and other investments relating to senior housing and healthcare operators orproperties.
COVID-19 Update
In December 2019, a novel strain of coronavirus (“COVID-19”) emerged in China. On March 11, 2020, the World Health Organization declared theoutbreak of COVID-19 a pandemic. The outbreak has spread around the world, including throughout the United States.
The COVID-19 pandemic and actions taken to prevent its spread continue to affect our business in a number of ways. In our senior living operatingportfolio, occupancy, revenue and net operating income decreased as resident move-ins decreased and operating costs increased as a result of the pandemic.
Our triple-net senior housing tenants experienced similar occupancy, revenue and cost pressure trends as our senior living operators. While we collectedsubstantially all triple-net senior housing rent we expected to receive in the first and second quarters, we have given and may continue to provide financialsupport to our triple-net tenants in the form of rent deferrals and application of portions of lease deposits to fulfill payment obligations. We also recentlymade material changes to our senior housing triple-net leases with Holiday Retirement and Brookdale Senior Living, respectively, which will decrease ournet operating income. Without financial support or other government assistance, certain of our triple-net senior housing tenants will likely experienceworsening financial conditions through the third quarter, which would pressure their rent coverage ratios and may affect their ability to pay us contractualrent in full on a timely basis.
In our healthcare triple-net leased properties portfolio, we collected substantially all rent due in the first and second quarters. This cohort of tenants hasbenefitted from significant government financial support to partially offset the direct financial impact of the COVID-19 pandemic on healthcare providers.Nationally, hospital inpatient admissions and surgeries have rebounded, although still below pre-COVID-19 levels, depending on the particular market.
8

NOTES TO CONSOLIDATED FINANCIAL STATEMENTS - Continued(Unaudited)
In our office operations segment, we received 99% of contractual rents in the second quarter. Substantially all of our medical office buildings arein states that have either reopened for elective procedures or announced the resumption of elective procedures, which are an important driver of financialperformance for many of our medical office tenants.
In March 2020, we took precautionary steps to increase liquidity and preserve financial flexibility in light of the uncertainty resulting from the COVID-19pandemic by drawing $2.75 billion under our $3.0 billion unsecured revolving credit facility. Due to improved capital market conditions and the decisiveactions described below, we have since repaid all borrowings under the facility. As of August 5, 2020, we had approximately $3.5 billion in liquidity,including availability under our revolving credit facility, cash and cash equivalents on hand, with no borrowings outstanding under our commercial paperprogram and negligible near-term debt maturing.
In June 2020, our Board of Directors declared a second quarter 2020 dividend of $0.45 per share, which was paid in July and represented a 43 percentreduction from the first quarter dividend of $0.7925 per share. This measure enabled us to conserve approximately $130 million of cash per quartercompared to the prior dividend level. In order to further conserve capital, we have reduced expected capital expenditures for 2020 by $0.3 billion to a newexpected total of $0.5 billion, mainly through pausing certain ground-up developments that were not yet substantially underway. Also, in June, weeliminated roles representing over 25% of our corporate positions, excluding onsite field personnel. For the second half of 2020, the base salaries of ourCEO and other executive officers was voluntarily reduced by 20% and 10%, respectively. As a result of these capital conservation actions, we expect thatour third quarter 2020 annualized general and administrative expenses will be approximately $25 million to $30 million lower than our reported generaland administrative expenses for full-year 2019.
The federal government, as well as state and local governments, have implemented or announced programs to provide financial and other support tobusinesses affected by the COVID-19 pandemic, some of which benefit or could benefit our company, tenants, operators, borrowers and managers. Forexample, the Department of Health and Human Services (“HHS”) Provider Relief Fund for COVID-19 is currently providing grants to licensed seniorliving providers that bill Medicaid. Eligible providers will receive payments of at least 2% of all annual gross patient care revenues. If HHS funding isultimately expanded to all licensed senior living providers, we expect most of our senior living communities to benefit.
The future impact of the COVID-19 pandemic is highly uncertain. Many of the trends highlighted above have continued into the third quarter. The extentof the COVID-19 pandemic’s continued and ultimate effect on our operational and financial performance will depend on future developments, includingthe duration, spread and intensity of the outbreak, the rate at which governments across the country lift restrictions and the extent and duration of anyrollback of restrictions and the availability of government financial support to our business, tenants and operators. Due to these uncertainties, we are notable at this time to estimate the ultimate impact of the COVID-19 pandemic on our business, results of operations, financial condition and cash flows but itcould be material.
We have not identified the COVID-19 pandemic, on its own, as a "triggering event" for purposes of evaluating impairment of real estate assets,goodwill and other intangibles, investments in unconsolidated entities and financial instruments. However, as of June 30, 2020, we considered the effect ofthe pandemic on certain of our assets (described below) and our ability to recover the respective carrying values of these assets. We applied ourconsiderations to existing critical accounting policies that require us to make estimates and assumptions regarding future events that affect the reportedamounts of assets and liabilities. We based our estimates on our experience and on assumptions we believe to be reasonable under the circumstances. As aresult, we have recognized the following charges for the quarter ended June 30, 2020:
• Adjustment to rental income: As of June 30, 2020, we concluded that it is probable we would not collect substantially all rents from certaintenants, primarily within our triple-net leased properties segment. As a result, we recognized an adjustment to rental income of $54.2 million.Subsequent to June 30, 2020, rental payments from these tenants will be recognized in rental income when received.
• Impairment of real estate assets: As of June 30, 2020, we concluded that our estimate of undiscounted cash flows, including a hypotheticalterminal value, for certain real estate assets did not exceed the assets' respective carrying values. As such, during the quarter ended June 30, 2020we recognized $108.8 million of impairments representing the difference between the assets' carrying value and estimated fair value of$192.8 million. The impaired assets, primarily senior housing communities, represent less than 1% of our consolidated net real estate property asof June 30, 2020. Impairments are recorded within depreciation and amortization in our Consolidated Statements of Income and are primarilyrelated to our senior living operations reportable business segment.
9

NOTES TO CONSOLIDATED FINANCIAL STATEMENTS - Continued(Unaudited)
• Loss on financial instruments and impairment of unconsolidated entities: As of June 30, 2020, we concluded that credit losses exist within certainof our non-mortgage loans receivables and government-sponsored pooled loan investments and impairments have occurred with respect tounconsolidated entities. As a result, (a) we established allowances of $20.8 million and $8.8 million, respectively, which reduces the amountspresented on our Consolidated Balance Sheets with a corresponding loss on financial instruments in our Consolidated Statements of Income, and(b) we recognized an impairment of $10.7 million in an equity investment in an unconsolidated entity. No allowances are recorded within ourportfolios of secured mortgage loans or marketable debt securities.
• Deferred tax asset valuation allowance: As of June 30, 2020, we concluded that it was not more likely than not that deferred tax assets (primarilyUS federal NOL carryforwards which begin to expire in 2032) would be realized based on our cumulative loss in recent years for certain of ourtaxable REIT subsidiaries. As a result, we recorded a valuation allowance of $56.4 million against these deferred tax assets on our ConsolidatedBalance Sheets with a corresponding charge to income tax (expense) benefit in our Consolidated Statements of Income.
10

NOTES TO CONSOLIDATED FINANCIAL STATEMENTS - Continued(Unaudited)
NOTE 2—ACCOUNTING POLICIES
The accompanying Consolidated Financial Statements have been prepared in accordance with U.S. generally accepted accounting principles(“GAAP”) for interim financial information set forth in the Accounting Standards Codification (“ASC”), as published by the Financial AccountingStandards Board (“FASB”), and with the Securities and Exchange Commission (“SEC”) instructions to Form 10-Q and Article 10 of Regulation S-X.Accordingly, they do not include all of the information and footnotes required by GAAP for complete financial statements. In the opinion of management,all adjustments (consisting of normal recurring accruals) considered necessary for a fair statement of results for the interim period have been included.Operating results for the three and six months ended June 30, 2020 are not necessarily indicative of the results that may be expected for the year endingDecember 31, 2020. The accompanying Consolidated Financial Statements and related notes should be read in conjunction with the audited ConsolidatedFinancial Statements and notes thereto included in our Annual Report on Form 10-K for the year ended December 31, 2019, filed with the SEC onFebruary 24, 2020. Certain prior period amounts have been reclassified to conform to the current period presentation.
Principles of Consolidation
The accompanying Consolidated Financial Statements include our accounts and the accounts of our wholly owned subsidiaries and the joint ventureentities over which we exercise control. All intercompany transactions and balances have been eliminated in consolidation, and our net earnings arereduced by the portion of net earnings attributable to noncontrolling interests.
GAAP requires us to identify entities for which control is achieved through means other than voting rights and to determine which business enterpriseis the primary beneficiary of variable interest entities (“VIEs”). A VIE is broadly defined as an entity with one or more of the following characteristics:(a) the total equity investment at risk is insufficient to finance the entity’s activities without additional subordinated financial support; (b) as a group, theholders of the equity investment at risk lack (i) the ability to make decisions about the entity’s activities through voting or similar rights, (ii) the obligationto absorb the expected losses of the entity, or (iii) the right to receive the expected residual returns of the entity; and (c) the equity investors have votingrights that are not proportional to their economic interests, and substantially all of the entity’s activities either involve, or are conducted on behalf of, aninvestor that has disproportionately few voting rights. We consolidate our investment in a VIE when we determine that we are its primary beneficiary. Wemay change our original assessment of a VIE upon subsequent events such as the modification of contractual arrangements that affects the characteristicsor adequacy of the entity’s equity investments at risk and the disposition of all or a portion of an interest held by the primary beneficiary.
We identify the primary beneficiary of a VIE as the enterprise that has both: (i) the power to direct the activities of the VIE that most significantlyimpact the entity’s economic performance; and (ii) the obligation to absorb losses or the right to receive benefits of the VIE that could be significant to theentity. We perform this analysis on an ongoing basis.
As it relates to investments in joint ventures, GAAP may preclude consolidation by the sole general partner in certain circumstances based on the typeof rights held by the limited partner or partners. We assess limited partners’ rights and their impact on our consolidation conclusions, and we reassess ifthere is a change to the terms or in the exercisability of the rights of the limited partners, the sole general partner increases or decreases its ownership oflimited partnership (“LP”) interests or there is an increase or decrease in the number of outstanding LP interests. We also apply this guidance to managingmember interests in limited liability companies (“LLCs”).
We consolidate several VIEs that share the following common characteristics:
• the VIE is in the legal form of an LP or LLC;• the VIE was designed to own and manage its underlying real estate investments;• we are the general partner or managing member of the VIE;• we own a majority of the voting interests in the VIE;• a minority of voting interests in the VIE are owned by external third parties, unrelated to us;• the minority owners do not have substantive kick-out or participating rights in the VIE; and• we are the primary beneficiary of the VIE.
We have separately identified certain special purpose entities that were established to allow investments in research and innovation projects by taxcredit investors (“TCIs”). We have determined that these special purpose entities are VIEs, we are a holder of variable interests and that we are the primarybeneficiary of the VIEs, and therefore we consolidate these special purpose entities. Our primary beneficiary determination is based upon several factors,including but not limited to the rights we
11

NOTES TO CONSOLIDATED FINANCIAL STATEMENTS - Continued(Unaudited)
have in directing the activities which most significantly impact the VIEs’ economic performance as well as certain guarantees which protect the TCIs fromlosses should a tax credit recapture event occur.
In general, the assets of consolidated VIEs are available only for the settlement of the obligations of the respective entities. Unless otherwise requiredby the LP or LLC agreement, any mortgage loans of the consolidated VIEs are non-recourse to us. The table below summarizes the total assets andliabilities of our consolidated VIEs as reported on our Consolidated Balance Sheets.
June 30, 2020 December 31, 2019
Total Assets Total Liabilities Total Assets Total Liabilities
(In thousands)
NHP/PMB L.P. $ 656,814 $ 238,045 $ 666,404 $ 244,934 Other identified VIEs 3,878,671 1,498,774 4,075,821 1,459,830 Tax credit VIEs 914,968 352,945 845,229 333,809
Investments in Unconsolidated Entities
We report investments in unconsolidated entities over whose operating and financial policies we have the ability to exercise significant influenceunder the equity method of accounting. We adjust our investment in unconsolidated entities for additional contributions made, distributions received as wellas our share of the investee's earnings or losses which is included in our Consolidated Statements of Income.
We base the initial carrying value of investments in unconsolidated entities on the fair value of the assets at the time we acquired the joint ventureinterest. We estimate fair values for our equity method investments based on discounted cash flow models that include all estimated cash inflows andoutflows over a specified holding period and, where applicable, any estimated debt premiums or discounts. The capitalization rates, discount rates andcredit spreads we use in these models are based upon assumptions that we believe to be within a reasonable range of current market rates for the respectiveinvestments.
We generally amortize any difference between our cost basis and the basis reflected at the joint venture level, if any, over the lives of the related assetsand liabilities and include that amortization in our share of income or loss from unconsolidated entities. For earnings of equity method investments with prorata distribution allocations, net income or loss is allocated between the partners in the joint venture based on their respective stated ownership percentages.In other instances, net income or loss is allocated between the partners in the joint venture based on the hypothetical liquidation at book value method (the“HLBV method”). Under the HLBV method, net income or loss is allocated between the partners based on the difference between each partner’s claim onthe net assets of the joint venture at the end and beginning of the period, after taking into account contributions and distributions. Each partner’s share ofthe net assets of the joint venture is calculated as the amount that the partner would receive if the joint venture were to liquidate all of its assets at net bookvalue and distribute the resulting cash to creditors and partners in accordance with their respective priorities. Under the HLBV method, in any given period,we could record more or less income than the joint venture has generated, than actual cash distributions we receive or than the amount we may receive inthe event of an actual liquidation.
Redeemable OP Unitholder and Noncontrolling Interests
We own a majority interest in NHP/PMB L.P. (“NHP/PMB”), a limited partnership formed in 2008 to acquire properties from entities affiliated withPacific Medical Buildings LLC (“PMB”). Given our wholly owned subsidiary is the general partner and the primary beneficiary of NHP/PMB, weconsolidate it as a VIE. As of June 30, 2020, third party investors owned 3.3 million Class A limited partnership units in NHP/PMB (“OP Units”), whichrepresented 31% of the total units then outstanding, and we owned 7.3 million Class B limited partnership units in NHP/PMB, representing the remaining69%. At any time following the first anniversary of the date of their issuance, the OP Units may be redeemed at the election of the holder for cash or, at ouroption, 0.9051 shares of our common stock per OP Unit, subject to further adjustment in certain circumstances. We are party by assumption to aregistration rights agreement with the holders of the OP Units that requires us, subject to the terms and conditions and certain exceptions set forth therein,to file and maintain a registration statement relating to the issuance of shares of our common stock upon redemption of OP Units.
As redemption rights are outside of our control, the redeemable OP Units are classified outside of permanent equity on our Consolidated BalanceSheets. We reflect the redeemable OP Units at the greater of cost or redemption value. As of June 30, 2020 and December 31, 2019, the fair value of theredeemable OP Units was $119.2 million and $171.2 million,
12

NOTES TO CONSOLIDATED FINANCIAL STATEMENTS - Continued(Unaudited)
respectively. We recognize changes in fair value through capital in excess of par value, net of cash distributions paid and purchases by us of any OP Units.Our diluted earnings per share includes the effect of any potential shares outstanding from redemption of the OP Units.
Certain noncontrolling interests of other consolidated joint ventures were also classified as redeemable at June 30, 2020 and December 31, 2019.Accordingly, we record the carrying amount of these noncontrolling interests at the greater of their initial carrying amount (increased or decreased for thenoncontrolling interests’ share of net income or loss and distributions) or the redemption value, which is primarily based on the fair value of the underlyingreal estate asset. Our joint venture partners have certain redemption rights with respect to their noncontrolling interests in these joint ventures that areoutside of our control, and the redeemable noncontrolling interests are classified outside of permanent equity on our Consolidated Balance Sheets. Werecognize changes in the carrying value of redeemable noncontrolling interests through capital in excess of par value.
Accounting for Historic and New Markets Tax Credits
For certain of our research and innovation centers, we are party to contractual arrangements with TCIs that were established to enable the TCIs toreceive benefits of historic tax credits (“HTCs”) and/or new markets tax credits (“NMTCs”). As of June 30, 2020, we owned 11 properties, including twoproperties in development, that had syndicated HTCs or NMTCs, or both, to TCIs.
In general, TCIs invest cash into special purpose entities that invest in entities that own the subject property and generate the tax credits. The TCIsreceive substantially all of the tax credits and hold only a nominal interest in the economic risk and benefits of the special purpose entities.
HTCs are delivered to the TCIs upon substantial completion of the project. NMTCs are allowed for up to 39% of a qualified investment and aredelivered to the TCIs after the investment has been funded and spent on a qualified business. HTCs are subject to 20% recapture per year beginning oneyear after the completion of the historic rehabilitation of the subject property. NMTCs are subject to 100% recapture until the end of the seventh yearfollowing the qualifying investment. We have provided the TCIs with certain guarantees which protect the TCIs from losses should a tax credit recaptureevent occur. The contractual arrangements with the TCIs include a put/call provision whereby we may be obligated or entitled to repurchase the interest ofthe TCIs in the special purpose entities at the end of the tax credit recapture period. We anticipate that either the TCIs will exercise their put rights or wewill exercise our call rights prior to the applicable tax credit recapture periods.
The portion of the TCI’s investment that is attributed to the put is recorded at fair value at inception in accounts payable and other liabilities on ourConsolidated Balance Sheets, and is accreted to the expected put price as interest expense in our Consolidated Statements of Income over the recaptureperiod. The remaining balance of the TCI’s investment is initially recorded in accounts payable and other liabilities on our Consolidated Balance Sheetsand will be relieved upon delivery of the tax credit to the TCI, as a reduction in the carrying value of the subject property, net of allocated expenses. Directand incremental costs incurred in structuring the transaction are deferred and will be recognized as an increase in the cost basis of the subject property uponthe recognition of the related tax credit as discussed above.
Fair Values of Financial Instruments
Fair value is a market-based measurement, not an entity-specific measurement, and we determine fair value based on the assumptions that we expectmarket participants would use in pricing the asset or liability. As a basis for considering market participant assumptions in fair value measurements, GAAPestablishes a fair value hierarchy that distinguishes between market participant assumptions based on market data obtained from sources independent of thereporting entity (observable inputs that are classified within levels one and two of the hierarchy) and the reporting entity’s own assumptions about marketparticipant assumptions (unobservable inputs classified within level three of the hierarchy).
Level one inputs utilize unadjusted quoted prices for identical assets or liabilities in active markets that we have the ability to access. Level two inputsare inputs other than quoted prices included in level one that are directly or indirectly observable for the asset or liability. Level two inputs may includequoted prices for similar assets and liabilities in active markets and other inputs for the asset or liability that are observable at commonly quoted intervals,such as interest rates, foreign exchange rates and yield curves. Level three inputs are unobservable inputs for the asset or liability, which typically are basedon our own assumptions, because there is little, if any, related market activity. If the determination of the fair value measurement is based on inputs fromdifferent levels of the hierarchy, the level within which the entire fair value measurement falls is the lowest level input that is significant to the fair valuemeasurement in its entirety. If the volume and level of market activity for an asset or liability has decreased significantly relative to the normal marketactivity for such asset or liability (or
13

NOTES TO CONSOLIDATED FINANCIAL STATEMENTS - Continued(Unaudited)
similar assets or liabilities), then transactions or quoted prices may not accurately reflect fair value. In addition, if there is evidence that a transaction for anasset or liability is not orderly, little, if any, weight is placed on that transaction price as an indicator of fair value. Our assessment of the significance of aparticular input to the fair value measurement in its entirety requires judgment and considers factors specific to the asset or liability.
We use the following methods and assumptions in estimating the fair value of our financial instruments.
• Cash and cash equivalents - The carrying amount of unrestricted cash and cash equivalents reported on our Consolidated Balance Sheetsapproximates fair value due to the short maturity of these instruments.
• Escrow deposits and restricted cash - The carrying amount of escrow deposits and restricted cash reported on our Consolidated BalanceSheets approximates fair value due to the short maturity of these instruments.
• Loans receivable - We estimate the fair value of loans receivable using level two and level three inputs, including underlying assetperformance and credit quality. We discount future cash flows using current interest rates at which similar loans with the same terms andlength to maturity would be made to borrowers with similar credit ratings.
• Available for sale securities - We estimate the fair value of marketable debt securities using level two inputs. We observe quoted prices forsimilar assets or liabilities in active markets that we have the ability to access. We estimate the fair value of certain government-sponsoredpooled loan investments using level three inputs. We consider credit spreads, underlying asset performance and credit quality, and defaultrates.
• Derivative instruments - With the assistance of a third party, we estimate the fair value of derivative instruments, including interest rate caps,interest rate swaps, and foreign currency forward contracts, using level two inputs.
◦ Interest rate caps - We observe forward yield curves and other relevant information.
◦ Interest rate swaps - We observe alternative financing rates derived from market-based financing rates, forward yield curves anddiscount rates.
◦ Foreign currency forward contracts - We estimate the future values of the two currency tranches using forward exchange rates thatare based on traded forward points and calculate a present value of the net amount using a discount factor based on observable tradedinterest rates.
• Senior notes payable and other debt - We estimate the fair value of senior notes payable and other debt using level two inputs. We discountthe future cash flows using current interest rates at which we could obtain similar borrowings. For mortgage debt, we may estimate fair valueusing level three inputs, similar to those used in determining fair value of loans receivable (above).
• Redeemable OP unitholder interests - We estimate the fair value of our redeemable OP unitholder interests using level one inputs. We basefair value on the closing price of our common stock, as OP Units may be redeemed at the election of the holder for cash or, at our option,shares of our common stock, subject to adjustment in certain circumstances.
Impairment of Long-Lived and Intangible Assets
We periodically evaluate our long-lived assets, primarily consisting of investments in real estate, for impairment indicators. If indicators of impairmentare present, we evaluate the carrying value of the related real estate investments in relation to the future undiscounted cash flows of the underlyingoperations. In performing this evaluation, we consider market conditions and our current intentions with respect to holding or disposing of the asset. Weadjust the net book value of leased properties and other long-lived assets to fair value if the sum of the expected future undiscounted cash flows, includingsales proceeds, is less than book value. We recognize an impairment loss at the time we make any such determination.
If impairment indicators arise with respect to intangible assets with finite useful lives, we evaluate impairment by comparing the carrying amount ofthe asset to the estimated future undiscounted net cash flows expected to be generated by the asset. If estimated future undiscounted net cash flows are lessthan the carrying amount of the asset, then we estimate the fair value of the asset and compare the estimated fair value to the intangible asset’s carryingvalue. We recognize any shortfall from carrying value as an impairment loss in the current period.
14

NOTES TO CONSOLIDATED FINANCIAL STATEMENTS - Continued(Unaudited)
We evaluate our investments in unconsolidated entities for impairment at least annually, and whenever events or changes in circumstances indicatethat the carrying value of our investment may exceed its fair value. If we determine that a decline in the fair value of our investment in an unconsolidatedentity is other-than-temporary, and if such reduced fair value is below the carrying value, we record an impairment.
We test goodwill for impairment at least annually, and more frequently if indicators arise. We first assess qualitative factors, such as currentmacroeconomic conditions, state of the equity and capital markets and our overall financial and operating performance, to determine the likelihood that thefair value of a reporting unit is less than its carrying amount. If we determine it is more likely than not that the fair value of a reporting unit is less than itscarrying amount, we proceed with estimating the fair value of the reporting unit. On January 1, 2020 we adopted ASU 2017-04, Simplifying the Test forGoodwill Impairment, which removes the traditional “Step 2” of the goodwill impairment test that required a hypothetical purchase price allocation. Agoodwill impairment, if any, will be recognized in the period it is determined and is now measured as the amount by which a reporting unit’s carrying valueexceeds its fair value.
Estimates of fair value used in our evaluation of goodwill (if necessary based on our qualitative assessment), investments in real estate, investments inunconsolidated entities and intangible assets are based upon discounted future cash flow projections or other acceptable valuation techniques that are based,in turn, upon all available evidence including level three inputs, such as revenue and expense growth rates, estimates of future cash flows, capitalizationrates, discount rates, general economic conditions and trends, or other available market data such as replacement cost or comparable sales. Our ability toaccurately predict future operating results and cash flows and to estimate and determine fair values impacts the timing and recognition of impairments.While we believe our assumptions are reasonable, changes in these assumptions may have a material impact on our financial results.
Revenue Recognition
Triple-Net Leased Properties and Office Operations
Certain of our triple-net leases and most of our MOB and research and innovation center (collectively, “office operations”) leases provide for periodicand determinable increases in base rent. We recognize base rental revenues under these leases on a straight-line basis over the applicable lease term whencollectability of substantially all rents is probable. Recognizing rental income on a straight-line basis generally results in recognized revenues during thefirst half of a lease term exceeding the cash amounts contractually due from our tenants, creating a straight-line rent receivable that is included in otherassets on our Consolidated Balance Sheets. At June 30, 2020 and December 31, 2019, this cumulative excess totaled $178.7 million and $278.8 million,respectively (excluding properties classified as held for sale).
Certain of our leases provide for periodic increases in base rent only if certain revenue parameters or other substantive contingencies are met. Werecognize the increased rental revenue under these leases as the related parameters or contingencies are met, rather than on a straight-line basis over theapplicable lease term.
We assess the probability of collecting substantially all rents under our leases based on several factors, including, among other things, paymenthistory, the financial strength of the tenant and any guarantors, the historical operations and operating trends of the property, the historical payment patternof the tenant, the type of property, the value of the underlying collateral, if any, expected future performance of the property and current economicconditions. If our evaluation of these factors indicates it is not probable that we will be able to collect substantially all rents, we recognize a charge to rentalincome. If we change our conclusions regarding the probability of collecting rent payments required by a lease, we may recognize adjustments to rentalincome in the period we make such change in our conclusions.
Senior Living Operations
Our resident agreements are accounted for as leases and we recognize resident fees and services, other than move-in fees, monthly as services areprovided. We recognize move-in fees on a straight-line basis over the average resident stay.
15

NOTES TO CONSOLIDATED FINANCIAL STATEMENTS - Continued(Unaudited)
Other
We recognize interest income from loans and investments, including discounts and premiums, using the effective interest method when collectabilityis reasonably assured. We apply the effective interest method on a loan-by-loan basis and recognize discounts and premiums as yield adjustments over therelated loan term. We evaluate collectability of accrued interest receivables separate from the amortized cost basis of our loans. As such, we recognizeinterest income on an impaired loan to the extent we believe accrued contractual interest payments are collectable. Otherwise interest income is recognizedon a cash basis.
On January 1, we adopted ASU 2016-13, Measurement of Credit Losses on Financial Instruments (“ASU 2016-13”). The amendments in ASU2016-13 require us to evaluate a current estimate of all expected credit losses over the life of a financial instrument, which may result in earlier recognitionof credit losses on loans and other financial instruments. Under prior guidance, we generally only considered past events and current conditions inmeasuring an incurred loss. We will establish a reserve for any estimated credit losses using this model with a corresponding charge to net income. Weadopted ASU 2016-13 using the modified retrospective method and we established no reserve upon adoption.
Lease Accounting
We lease real property, primarily land and corporate office space, and equipment, primarily vehicles at our senior housing communities. At leaseinception, we establish an operating lease asset and operating lease liability calculated as the present value of future minimum lease payments. As ourleases do not provide an implicit rate, we use a discount rate that approximates our incremental borrowing rate available at lease commencement todetermine the present value. Our lease expense primarily consists of ground and corporate office leases. Ground lease expense is included in interestexpense and corporate office lease expense is included in general, administrative and professional fees in the Company's Consolidated Statements ofIncome. NOTE 3—CONCENTRATION OF CREDIT RISK
As of June 30, 2020, Atria, Sunrise, Brookdale Senior Living, Ardent and Kindred managed or operated approximately 20.7%, 10.5%, 7.9%, 4.9% and1.0%, respectively, of our consolidated real estate investments based on gross book value (excluding properties classified as held for sale as of June 30,2020). Because Atria and Sunrise manage our properties in exchange for the receipt of a management fee from us, we are not directly exposed to the creditrisk of our managers in the same manner or to the same extent as our triple-net tenants.
Based on gross book value, approximately 47.0% and 16.5% of our consolidated real estate investments were senior housing communities included inthe senior living operations and triple-net leased properties reportable business segments, respectively (excluding properties classified as held for sale as ofJune 30, 2020). MOBs, research and innovation centers, IRFs and LTACs, health systems, skilled nursing facilities (“SNFs”) and secured loans receivableand investments collectively comprised the remaining 36.5%. Our consolidated properties were located in 45 states, the District of Columbia, sevenCanadian provinces and the United Kingdom as of June 30, 2020, with properties in one state (California) accounting for more than 10% of our totalconsolidated revenues and net operating income (“NOI,” which is defined as total revenues, excluding interest and other income, less property-leveloperating expenses and office building services costs) for the three months then ended.
16

NOTES TO CONSOLIDATED FINANCIAL STATEMENTS - Continued(Unaudited)
Triple-Net Leased Properties
The following table reflects the concentration risk related to our triple-net leased properties for the periods presented:
For the Three Months Ended June
30, 2020 2019
Revenues(1): Brookdale Senior Living 4.9 % 4.8 %Ardent 3.2 3.1 Kindred 3.5 3.4
NOI:Brookdale Senior Living 10.4 % 8.9 %Ardent 6.8 5.8 Kindred 7.4 6.4
(1) Total revenues include office building and other services revenue, income from loans and investments and interest and other income.
Each of our leases with Brookdale Senior Living, Ardent and Kindred is a triple-net lease that obligates the tenant to pay all property-related expenses,including maintenance, utilities, repairs, taxes, insurance and capital expenditures, and to comply with the terms of the mortgage financing documents, ifany, affecting the properties. In addition, each of our Brookdale Senior Living, Ardent and Kindred leases has a corporate guaranty.
The properties we lease to Brookdale Senior Living, Ardent and Kindred accounted for a significant portion of our triple-net leased properties segmentrevenues and NOI for the three months ended June 30, 2020 and 2019. If Brookdale Senior Living, Ardent or Kindred becomes unable or unwilling tosatisfy its obligations to us or to renew its leases with us upon expiration of the terms thereof, our financial condition and results of operations coulddecline, and our ability to service our indebtedness and to make distributions to our stockholders could be impaired. We cannot assure you that BrookdaleSenior Living, Ardent and Kindred will have sufficient assets, income and access to financing to enable them to satisfy their respective obligations to us,and any failure, inability or unwillingness by Brookdale Senior Living, Ardent or Kindred to do so could have a material adverse effect on our business,financial condition, results of operations and liquidity, our ability to service our indebtedness and other obligations and our ability to make distributions toour stockholders, as required for us to continue to qualify as a REIT (a “Material Adverse Effect”). We also cannot assure you that Brookdale SeniorLiving, Ardent and Kindred will elect to renew their respective leases with us upon expiration of the leases or that we will be able to reposition any non-renewed properties on a timely basis or on the same or better economic terms, if at all.
Brookdale Transaction
In July 2020, we entered into a revised master lease agreement (the “Brookdale Lease”) and certain other agreements (together with the BrookdaleLease, the “Agreements”) with Brookdale Senior Living. The Agreements modify our current arrangements with Brookdale Senior Living as follows:
We received up-front consideration approximating $235 million dollars, which will be amortized over the remaining lease term and consisted of:(a) $162 million in cash including $47 million from the transfer to Ventas of deposits under the Brookdale Lease; (b) a $45 million cash pay note (the“Note”) from Brookdale. The Note has an initial interest rate of nine percent, increasing 50 basis points per annum, and matures on December 31, 2025; (c)warrants exercisable for 16.3 million shares of Brookdale Senior Living common stock, which are exercisable at any time prior to December 31, 2025 andhave an exercise price of $3.00 per share.
Base cash rent under the Brookdale Lease is set at $100 million per annum starting in July 2020, with three percent annual escalators commencingon January 1, 2022. The Brookdale Lease is guaranteed by, and the Note is a direct obligation of, Brookdale Senior Living.
Brookdale Senior Living transferred fee ownership of five senior living communities to us, in full satisfaction and repayment of a $78 million loanto Brookdale Senior Living from us that was secured by the five communities. Brookdale Senior Living will now manage those communities for us under aterminable management agreement.
17

NOTES TO CONSOLIDATED FINANCIAL STATEMENTS - Continued(Unaudited)
Holiday Transaction
In April 2020, we completed a transaction with affiliates of Holiday Retirement (collectively,“Holiday”), including (a) entry into a new, terminable management agreement with Holiday Management Companyfor our 26 independent living assets previously subject to a triple-net lease (the “Holiday Lease”) with Holiday; (b)termination of the Holiday Lease; and (c) our receipt from Holiday of $33.8 million in cash from the transfer to us of deposits under the Holiday Lease and$66 million in principal amount of secured notes. As a result of the Holiday Lease termination, we recognized net income of $50.2 million, composed of$99.8 million of cash and notes received less $49.6 million from the write-off of accumulated straight-line receivable.
Senior Living Operations
As of June 30, 2020, Atria and Sunrise, collectively, provided comprehensive property management and accounting services with respect to 260 of our428 consolidated senior housing communities, for which we pay annual management fees pursuant to long-term management agreements.
We rely on our managers’ personnel, expertise, technical resources and information systems, proprietary information, good faith and judgment tomanage our senior living operations efficiently and effectively. We also rely on our managers to set appropriate resident fees and otherwise operate oursenior housing communities in compliance with the terms of our management agreements and all applicable laws and regulations. Although we havevarious rights as the property owner under our management agreements, including various rights to terminate and exercise remedies under the agreementsas provided therein, Atria’s or Sunrise’s failure, inability or unwillingness to satisfy its respective obligations under those agreements, to efficiently andeffectively manage our properties or to provide timely and accurate accounting information with respect thereto could have a Material Adverse Effect onus. In addition, significant changes in Atria’s or Sunrise’s senior management or equity ownership or any adverse developments in their businesses orfinancial condition could have a Material Adverse Effect on us. Brookdale Senior Living, Kindred, Atria, Sunrise and Ardent Information
Brookdale Senior Living is subject to the reporting requirements of the SEC and is required to file with the SEC annual reports containing auditedfinancial information and quarterly reports containing unaudited financial information. The information related to Brookdale Senior Living contained orreferred to in this Quarterly Report on Form 10-Q has been derived from SEC filings made by Brookdale Senior Living or other publicly availableinformation, or was provided to us by Brookdale Senior Living, and we have not verified this information through an independent investigation orotherwise. We have no reason to believe that this information is inaccurate in any material respect, but we cannot assure you of its accuracy. We areproviding this data for informational purposes only, and you are encouraged to obtain Brookdale Senior Living’s publicly available filings, which can befound at the SEC’s website at www.sec.gov.
Kindred, Atria, Sunrise and Ardent are not currently subject to the reporting requirements of the SEC. The information related to Kindred, Atria,Sunrise and Ardent contained or referred to in this Quarterly Report on Form 10-Q has been derived from publicly available information or was provided tous by Kindred, Atria, Sunrise or Ardent, as the case may be, and we have not verified this information through an independent investigation or otherwise.We have no reason to believe that this information is inaccurate in any material respect, but we cannot assure you of its accuracy.
NOTE 4—DISPOSITIONS AND IMPAIRMENTS
2020 Activity
In March 2020, we formed the Ventas Life Science and Healthcare Real Estate Fund, L.P. (the “Fund”), a perpetual life vehicle that focuses oninvestments in research and innovation centers, medical office buildings and senior housing communities in North America. To seed the Fund, wecontributed six (two of which are on the same campus) stabilized research and innovation and medical office properties. We received cash consideration of$620 million and a 21% interest in the Fund. We recognized a gain on the transactions of $224.6 million.
Also, during the six months ended June 30, 2020, we sold one MOB, one senior housing community and one triple-net leased property for aggregateconsideration of $11.5 million and we recognized a gain on the sale of these assets of $2.8 million.
18

NOTES TO CONSOLIDATED FINANCIAL STATEMENTS - Continued(Unaudited)
Real Estate Impairment
We recognized impairments of $121.5 million and $13.5 million, respectively, for the six months ended June 30, 2020 and 2019, which are recorded indepreciation and amortization in our Consolidated Statements of Income. Other than charges relating to properties directly impacted by COVID-19 (See“Note 1 - Description Of Business - COVID-19 Update”), our recorded impairments were primarily the result of a change in our intent to hold the impairedassets. In most cases, we recognize an impairment in the periods in which our change in intent is made.
Assets Held for Sale
The table below summarizes our real estate assets classified as held for sale, including the amounts reported on our Consolidated Balance Sheets,which may include anticipated post-closing settlements of working capital for disposed properties.
As of June 30, 2020 As of December 31, 2019
Number ofProperties Held
for SaleAssets Held for
Sale
LiabilitiesRelated to Assets
Held for Sale
Number ofProperties Held
for SaleAssets Held for
Sale
LiabilitiesRelated to Assets
Held for Sale(Dollars in thousands)
Triple-Net Leased Properties 8 $ 51,892 $ 1,656 8 $ 62,098 $ 1,623 Office Operations 1 8,520 1,935 1 5,177 499 Senior Living Operations 5 21,405 2,182 6 24,158 3,341
Total 14 $ 81,817 $ 5,773 15 $ 91,433 $ 5,463
19

NOTES TO CONSOLIDATED FINANCIAL STATEMENTS - Continued(Unaudited)
NOTE 5—LOANS RECEIVABLE AND INVESTMENTS
As of June 30, 2020 and December 31, 2019, we had $918.6 million and $1.0 billion, respectively, of net loans receivable and investments relating tosenior housing and healthcare operators or properties. The following is a summary of our loans receivable and investments, net, including amortized cost,fair value and unrealized gains or losses on available for sale investments:
CarryingAmount Amortized Cost Fair Value Unrealized Gain
(In thousands)As of June 30, 2020:Secured/mortgage loans and other, net $ 633,582 $ 633,582 $ 529,374 $ —
Government-sponsored pooled loan investments, net (1) (3) 48,249 53,603 48,249 3,492 Total investments reported as secured loans receivable and investments,
net 681,831 687,185 577,623 3,492
Non-mortgage loans receivable, net (3) 16,146 40,648 15,007 —
Marketable debt securities (2) 220,630 213,195 220,630 7,435
Total loans receivable and investments, net $ 918,607 $ 941,028 $ 813,260 $ 10,927
As of December 31, 2019:Secured/mortgage loans and other, net $ 645,546 $ 645,546 $ 646,925 $ —
Government-sponsored pooled loan investments, net (1) 59,066 52,178 59,066 6,888 Total investments reported as secured loans receivable and investments,
net 704,612 697,724 705,991 6,888 Non-mortgage loans receivable, net 63,724 63,724 63,538 —
Marketable debt securities (2) 237,360 213,062 237,360 24,298
Total loans receivable and investments, net $ 1,005,696 $ 974,510 $ 1,006,889 $ 31,186
(1) Investments in government-sponsored pool loans have contractual maturity dates in 2021 and 2023.(2) Investments in marketable debt securities have contractual maturity dates in 2024 and 2026.(3) As of June 30, 2020, the carrying amounts for government-sponsored pooled loan investments, net and non-mortgage loans receivable, net reflect
allowances of $8.8 million and $24.5 million, respectively.
2020 Activity
During the six months ended June 30, 2020, we received aggregate proceeds of $106.1 million for the full repayment of the principal balances ofvarious loans receivable with a weighted average interest rate of 8.3% that were due to mature between 2020 and 2025, resulting in total gains of $1.4million.
In April 2020, we received as consideration $66 million of notes secured by equity pledges on real estate assets with an effective interest rate of9.2% in connection with the termination of the Holiday Lease. See “Note 3 - Concentration Of Credit Risk”.
In June 2020, we recognized $29.7 million in expense in establishing allowances on our loan and investment portfolio (see “Note 1 - DescriptionOf Business - COVID-19 Update”).
NOTE 6—INVESTMENTS IN UNCONSOLIDATED ENTITIES
We report investments in unconsolidated entities over whose operating and financial policies we have the ability to exercise significant influenceunder the equity method of accounting. We are not required to consolidate these entities because our joint venture partners have significant participatingrights, nor are these entities considered VIEs, as they are controlled by equity holders with sufficient capital.
At June 30, 2020, we had a 25% interest in a real estate joint venture that has a majority ownership in eight properties and two properties underdevelopment.
20

NOTES TO CONSOLIDATED FINANCIAL STATEMENTS - Continued(Unaudited)
In March 2020, we formed the Fund in which we are manager, general partner and had a 21% ownership interest. See “Note 4 - Dispositions AndImpairments.”
We account for our interests in real estate joint ventures, including the Fund, as well as our 34% interest in Atria, 34% interest in Eclipse Senior Living(“ESL”) and 9.8% interest in Ardent, which are included within other assets on our Consolidated Balance Sheets, under the equity method of accounting.
Our 34% ownership interest in Atria entitles us to customary rights and minority protections, including the right to appoint two of six members to theAtria Board of Directors.
Our 34% ownership interest in ESL entitles us to customary rights and minority protections, including the right to appoint two of six members to theESL Board of Directors. ESL management owns the 66% controlling interest.
Our 9.8% ownership interest in Ardent entitles us to certain rights and minority protections, as well as the right to appoint one of 11 members on theArdent Board of Directors.
With the exception of our interests in Atria, ESL and Ardent, we provide various services to unconsolidated entities in exchange for fees andreimbursements. Total management fees earned in connection with these entities were $1.5 million and $0.8 million for the three months ended June 30,2020 and 2019, respectively, and $2.4 million and $1.6 million for the six months ended June 30, 2020 and 2019, respectively, which is included in officebuilding and other services revenue in our Consolidated Statements of Income. In June 2020, as a result of COVID-19, we recognized an impairmentcharge of $10.7 million related to our investment in an unconsolidated entity (see “Note 1 - Description Of Business - COVID-19 Update”).
NOTE 7—INTANGIBLES
The following is a summary of our intangibles:
As of June 30, 2020 As of December 31, 2019
Balance
RemainingWeighted Average
AmortizationPeriod in Years Balance
RemainingWeighted Average
AmortizationPeriod in Years
(Dollars in thousands)
Intangible assets: Above market lease intangibles $ 142,551 6.7 $ 145,891 6.9In-place and other lease intangibles 1,097,937 10.8 1,160,261 10.6Goodwill 1,050,115 N/A 1,051,161 N/AOther intangibles 35,766 10.5 35,837 10.9Accumulated amortization (924,862) N/A (920,742) N/A
Net intangible assets $ 1,401,507 10.3 $ 1,472,408 10.2
Intangible liabilities: Below market lease intangibles $ 339,173 14.4 $ 349,357 14.5Other lease intangibles 13,498 N/A 13,498 N/AAccumulated amortization (205,255) N/A (203,834) N/APurchase option intangibles 3,568 N/A 3,568 N/A
Net intangible liabilities $ 150,984 14.4 $ 162,589 14.5
N/A—Not Applicable.
Above market lease intangibles and in-place and other lease intangibles are included in acquired lease intangibles within real estate investments on ourConsolidated Balance Sheets. Other intangibles (including non-compete agreements, trade names and trademarks) are included in other assets on ourConsolidated Balance Sheets. Below market lease intangibles, other lease intangibles and purchase option intangibles are included in accounts payable andother liabilities on our Consolidated Balance Sheets.
21

NOTES TO CONSOLIDATED FINANCIAL STATEMENTS - Continued(Unaudited)
NOTE 8—OTHER ASSETS
The following is a summary of our other assets:
As of June 30, 2020 As of December 31, 2019 (In thousands)
Straight-line rent receivables $ 178,690 $ 278,833 Non-mortgage loans receivable, net 16,146 63,724 Marketable debt securities 220,630 237,360 Other intangibles, net 4,859 5,149 Investment in unconsolidated operating entities 40,332 59,301 Other 226,747 232,929
Total other assets $ 687,404 $ 877,296
22

NOTES TO CONSOLIDATED FINANCIAL STATEMENTS - Continued(Unaudited)
NOTE 9—SENIOR NOTES PAYABLE AND OTHER DEBT
The following is a summary of our senior notes payable and other debt:
As of June 30, 2020 As of December 31, 2019 (In thousands)
Unsecured revolving credit facility (1) $ 587,206 $ 120,787 Commercial paper notes — 567,450 Secured revolving construction credit facility due 2022 157,156 160,492
Floating Rate Senior Notes, Series F due 2021 (2) 221,027 231,018
3.25% Senior Notes due 2022 500,000 500,000
3.30% Senior Notes, Series C due 2022 (2) 184,189 192,515 Unsecured term loan due 2023 200,000 200,000
3.125% Senior Notes due 2023 400,000 400,000
3.10% Senior Notes due 2023 400,000 400,000
2.55% Senior Notes, Series D due 2023 (2) 202,608 211,767
3.50% Senior Notes due 2024 400,000 400,000
3.75% Senior Notes due 2024 400,000 400,000
4.125% Senior Notes, Series B due 2024 (2) 184,189 192,515
2.80% Senior Notes, Series E due 2024 (2) 442,054 462,036
Unsecured term loan due 2025 (2) 368,378 385,030
3.50% Senior Notes due 2025 600,000 600,000
2.65% Senior Notes due 2025 450,000 450,000
4.125% Senior Notes due 2026 500,000 500,000
3.25% Senior Notes due 2026 450,000 450,000
3.85% Senior Notes due 2027 400,000 400,000
4.00% Senior Notes due 2028 650,000 650,000
4.40% Senior Notes due 2029 750,000 750,000
3.00% Senior Notes due 2030 650,000 650,000
4.75% Senior Notes due 2030 500,000 —
6.90% Senior Notes due 2037 (3) 52,400 52,400
6.59% Senior Notes due 2038 (3) 22,823 22,823
5.70% Senior Notes due 2043 300,000 300,000
4.375% Senior Notes due 2045 300,000 300,000
4.875% Senior Notes due 2049 300,000 300,000 Mortgage loans and other 2,056,287 1,996,969
Total 12,628,317 12,245,802 Deferred financing costs, net (78,260) (79,939) Unamortized fair value adjustment 14,944 20,056 Unamortized discounts (34,965) (27,146)
Senior notes payable and other debt $ 12,530,036 $ 12,158,773
(1) As of June 30, 2020 and December 31, 2019, respectively, $12.5 million and $26.2 million of aggregate borrowings were denominated in Canadiandollars. Aggregate borrowings of $24.7 million and $27.6 million were denominated in British pounds as of June 30, 2020 and December 31, 2019,respectively.
(2) Canadian Dollar debt obligations shown in US Dollars.(3) Our 6.90% senior notes due 2037 are subject to repurchase at the option of the holders, at par, on October 1, 2027, and our 6.59% senior notes due
2038 are subject to repurchase at the option of the holders, at par, on July 7 in each of 2023 and 2028.
23

NOTES TO CONSOLIDATED FINANCIAL STATEMENTS - Continued(Unaudited)
As of June 30, 2020, our indebtedness had the following maturities:
Principal AmountDue at Maturity
UnsecuredRevolving Credit
Facility and CommercialPaper Notes (1)
Scheduled PeriodicAmortization Total Maturities
(In thousands)
2020 $ 136,671 $ — $ 22,568 $ 159,239 2021 418,035 587,206 42,469 1,047,710 2022 1,261,138 — 36,492 1,297,630 2023 1,586,472 — 23,287 1,609,759 2024 1,545,310 — 17,308 1,562,618 Thereafter 6,848,401 — 102,960 6,951,361
Total maturities $ 11,796,027 $ 587,206 $ 245,084 $ 12,628,317
(1) At June 30, 2020, we had unrestricted cash and cash equivalents of $1.0 billion, which exceeds the borrowings outstanding under our unsecuredrevolving credit facility and commercial paper program.
Credit Facilities, Commercial Paper and Unsecured Term Loans
Our unsecured credit facility is comprised of a $3.0 billion unsecured revolving credit facility priced at LIBOR plus 0.875% as of June 30, 2020. Theunsecured revolving credit facility matures in April 2021, but may be extended at our option subject to the satisfaction of certain conditions, including allrepresentations and warranties being correct in all material respects with no existing defaults, for two additional periods of six months each to April 2022.The unsecured revolving credit facility also includes an accordion feature that permits us to increase our aggregate borrowing capacity thereunder to up to$3.75 billion.
Our wholly-owned subsidiary, Ventas Realty, Limited Partnership (“Ventas Realty”), may issue from time to time unsecured commercial paper notesup to a maximum aggregate amount outstanding at any time of $1.0 billion. The notes are sold under customary terms in the United States commercialpaper note market and are ranked pari passu with all of Ventas Realty’s other unsecured senior indebtedness. The notes are fully and unconditionallyguaranteed by Ventas, Inc. As of June 30, 2020, we had no borrowings outstanding under our commercial paper program.
As of June 30, 2020, $587.2 million was outstanding under the unsecured revolving credit facility with an additional $23.9 million restricted tosupport outstanding letters of credit. In addition, we limit our utilization of the unsecured revolving credit facility, to the extent necessary, to support ourcommercial paper program when commercial paper notes are outstanding. We had $2.4 billion in available liquidity under the unsecured revolving creditfacility as of June 30, 2020.
As of June 30, 2020, we had a $200.0 million unsecured term loan priced at LIBOR plus 0.90% that matures in 2023. The term loan also includes anaccordion feature that effectively permits us to increase our aggregate borrowings thereunder to up to $800.0 million.
As of June 30, 2020, we had a C$500 million unsecured term loan facility priced at Canadian Dollar Offered Rate (“CDOR”) plus 0.90% that maturesin 2025.
As of June 30, 2020, we had a $400.0 million secured revolving construction credit facility with $157.2 million of borrowings outstanding. Thesecured revolving construction credit facility matures in 2022 and is primarily used to finance the development of research and innovation centers and otherconstruction projects.
Senior Notes
In March 2020, Ventas Realty issued $500.0 million aggregate principal amount of 4.75% senior notes due 2030 at a public offering price equal to97.86% of par. The notes were settled and proceeds were received in April 2020.
24

NOTES TO CONSOLIDATED FINANCIAL STATEMENTS - Continued(Unaudited)
NOTE 10—FAIR VALUES OF FINANCIAL INSTRUMENTS
The carrying amounts and fair values of our financial instruments were as follows:
As of June 30, 2020 As of December 31, 2019
CarryingAmount Fair Value
CarryingAmount Fair Value
(In thousands)
Assets: Cash and cash equivalents $ 992,824 $ 992,824 $ 106,363 $ 106,363 Escrow deposits and restricted cash 36,312 36,312 39,739 39,739 Secured mortgage loans and other, net 633,582 529,374 645,546 646,925 Non-mortgage loans receivable, net 16,146 15,007 63,724 63,538
Marketable debt securities 220,630 220,630 237,360 237,360
Government-sponsored pooled loan investments, net 48,249 48,249 59,066 59,066 Derivative instruments 707 707 738 738
Liabilities:Senior notes payable and other debt, gross 12,628,317 13,095,984 12,245,802 12,778,758 Derivative instruments 31,962 31,962 12,987 12,987
Redeemable OP Units 119,233 119,233 171,178 171,178
For a discussion of the assumptions considered, refer to “Note 2 - Accounting Policies.” The use of different market assumptions and estimationmethodologies may have a material effect on the reported estimated fair value amounts. Accordingly, the estimates presented above are not necessarilyindicative of the amounts we would realize in a current market exchange.
NOTE 11—LITIGATION
Proceedings Arising in Connection with Our Business
From time to time, we are party to various legal actions, regulatory proceedings and claims (some of which may not be fully insured and some ofwhich may allege large damage amounts) arising in connection with our business, including our senior living and office operations. These claims mayinclude, among other things, professional liability and general liability claims, unfair business practices claims, employment claims and regulatoryproceedings related to our senior living operations, the risks of which has increased as a result of the COVID-19 pandemic.
It is the opinion of management, except as otherwise set forth in this note, that the disposition of any such actions, investigations and claims that arecurrently pending will not, individually or in the aggregate, have a Material Adverse Effect on us. However, regardless of their merits, we may be forced toexpend significant financial resources to defend and resolve these matters. We are unable to predict the ultimate outcome of these actions, investigationsand claims, and if management’s assessment of our liability with respect thereto is incorrect, such actions, investigations and claims could have a MaterialAdverse Effect on us.
Proceedings against Tenants, Operators and Managers
From time to time, Atria, Sunrise, Brookdale Senior Living, Ardent, Kindred and our other tenants, operators and managers are parties to certain legalactions, regulatory proceedings and claims arising in the conduct of their business and operations, the risk of which has increased as a result of the COVID-19 pandemic. In other circumstances, regardless of whether we are a named party in the legal actions, regulatory proceedings or claims, we may becontractually obligated to indemnify, defend and hold harmless our tenants, operators and managers against such actions, proceedings or claims. Theunfavorable resolution of any such actions, proceedings or claims could, individually or in the aggregate, materially adversely affect our or such tenants’,operators’ or managers’ liquidity, financial condition or results of operations and their ability to satisfy their respective obligations to us, which, in turn,could have a Material Adverse Effect on us.
25

NOTES TO CONSOLIDATED FINANCIAL STATEMENTS - Continued(Unaudited)
Proceedings Indemnified and Defended by Third Parties
From time to time, we are party to certain legal actions, regulatory proceedings and claims for which our tenants, operators, managers and other thirdparties are contractually obligated to indemnify, defend and hold us harmless in whole or in part. For instance, managers of our senior living communitiesand tenants of our triple-net leased properties and, in some cases, their affiliates are required by the terms of their management agreements, leases or otheragreements with us to indemnify, defend and hold us harmless against certain actions, investigations and claims. In addition, third parties from whom weacquired certain of our assets and, in some cases, their affiliates are required by the terms of the related conveyance documents to indemnify, defend andhold us harmless against certain actions, investigations and claims related to the acquired assets and arising prior to our ownership or related to excludedassets and liabilities. In some cases, a portion of the purchase price consideration is held in escrow for a specified period of time as collateral for theseindemnification obligations.
We are presently being defended by certain third parties in these types of matters. We cannot assure you that these third parties will continue to defendus in these matters, that they will have sufficient assets, income and access to financing to enable them to satisfy their defense and indemnificationobligations to us or that any purchase price consideration held in escrow will be sufficient to satisfy claims for which we are entitled to indemnification.The unfavorable resolution of any such actions, investigations or claims could, individually or in the aggregate, materially adversely affect our tenants’ orother obligated third parties’ liquidity, financial condition or results of operations and their ability to satisfy their respective obligations to us, which, inturn, could have a Material Adverse Effect on us.
NOTE 12—INCOME TAXES
We have elected to be taxed as a REIT under the applicable provisions of the Internal Revenue Code of 1986, as amended, for every year beginningwith the year ended December 31, 1999. We have also elected for certain of our subsidiaries to be treated as taxable REIT subsidiaries (“TRS” or “TRSentities”), which are subject to federal, state and foreign income taxes. All entities other than the TRS entities are collectively referred to as the “REIT”within this note. Certain REIT entities are subject to foreign income tax.
Although the TRS entities and certain other foreign entities have paid minimal federal, state and foreign income taxes for the six months ended June30, 2020, their income tax liabilities may increase in future periods as we exhaust net operating loss (“NOL”) carryforwards and as our senior living andother operations grow. Such increases could be significant.
Our consolidated provisions for income taxes for the three months ended June 30, 2020 and 2019 were an expense of $56.4 million and a benefit of$57.8 million, respectively. Our consolidated provisions for income taxes for the six months ended June 30, 2020 and 2019 were a benefit of $92.7 millionand $59.0 million, respectively. The income tax expense for the three months ended June 30, 2020 was primarily due to a valuation allowance recordedagainst certain deferred tax assets. We have determined that these future tax benefits are not more likely than not to be realized. The income tax benefit forthe six months ended June 30, 2020 was primarily due to a $152.9 million net deferred tax benefit related to an internal restructuring of certain US taxableREIT subsidiaries completed in the first quarter. The benefit resulted from the transfer of assets subject to certain deferred tax liabilities from taxable REITsubsidiaries to the REIT in a tax-free transaction. The income tax benefit for the three and six months ended June 30, 2019 was primarily due to thereversal of valuation allowances recorded against the net deferred tax assets of certain of our TRS entities.
Each TRS is a tax paying component for purposes of classifying deferred tax assets and liabilities. Net deferred tax liabilities with respect to our TRSentities totaled $57.0 million and $200.8 million as of June 30, 2020 and December 31, 2019, respectively, and related primarily to differences between thefinancial reporting and tax bases of fixed and intangible assets, net of loss carryforwards. Net deferred tax assets with respect to our TRS entities totaled$0.3 million and $47.5 million as of June 30, 2020 and December 31, 2019, respectively, and related primarily to loss carryforwards. Generally, we are subject to audit under the statute of limitations by the Internal Revenue Service for the year ended December 31, 2016 andsubsequent years and are subject to audit by state taxing authorities for the year ended December 31, 2015 and subsequent years. We are subject to auditgenerally under the statutes of limitation by the Canada Revenue Agency and provincial authorities with respect to the Canadian entities for the year endedDecember 31, 2015 and subsequent years. We are subject to audit in the United Kingdom generally for periods ended in and subsequent to 2018.
26

NOTES TO CONSOLIDATED FINANCIAL STATEMENTS - Continued(Unaudited)
NOTE 13—STOCKHOLDERS' EQUITY
Capital Stock
From time to time, we may sell up to an aggregate of $1.0 billion of our common stock under an “at-the-market” equity offering program (“ATMprogram”). During the six months ended June 30, 2020, we sold no shares of common stock under our ATM program. As of June 30, 2020, $822.1 millionof our common stock remained available for sale under our ATM program.
Accumulated Other Comprehensive Loss
The following is a summary of our accumulated other comprehensive loss:
As of June 30, 2020 As of December 31, 2019 (In thousands)
Foreign currency translation $ (60,759) $ (51,743) Available for sale securities 7,121 27,380 Derivative instruments (29,123) (10,201)
Total accumulated other comprehensive loss $ (82,761) $ (34,564)
NOTE 14—EARNINGS PER SHARE
The following table shows the amounts used in computing our basic and diluted earnings per share:
For the Three Months Ended June
30, For the Six Months Ended June 30, 2020 2019 2020 2019 (In thousands, except per share amounts)
Numerator for basic and diluted earnings per share:
(Loss) income from continuing operations $ (159,235) $ 211,898 $ 315,495 $ 339,486 Net (loss) income (159,235) 211,898 315,495 339,486
Net (loss) income attributable to noncontrolling interests (2,065) 1,369 (452) 3,172
Net (loss) income attributable to common stockholders $ (157,170) $ 210,529 $ 315,947 $ 336,314
Denominator:
Denominator for basic earnings per share—weighted average shares 372,982 361,722 372,905 359,301 Effect of dilutive securities: Stock options — 365 — 347 Restricted stock awards 87 468 140 454 OP unitholder interests 2,955 2,998 2,975 2,998
Denominator for diluted earnings per share—adjusted weighted average shares 376,024 365,553 376,020 363,100
Basic earnings per share:
(Loss) income from continuing operations $ (0.43) $ 0.59 $ 0.85 $ 0.94 Net (loss) income attributable to common stockholders (0.42) 0.58 0.85 0.94
Diluted earnings per share:(1)
(Loss) income from continuing operations $ (0.43) $ 0.58 $ 0.84 $ 0.93 Net (loss) income attributable to common stockholders (0.42) 0.58 0.84 0.93
(1) Potential common shares are not included in the computation of diluted earnings per share when a loss from continuing operations exists as the effectwould be an antidilutive per share amount.
27

NOTES TO CONSOLIDATED FINANCIAL STATEMENTS - Continued(Unaudited)
NOTE 15—SEGMENT INFORMATION
As of June 30, 2020, we operated through three reportable business segments: triple-net leased properties, senior living operations and officeoperations. In our triple-net leased properties segment, we invest in and own senior housing and healthcare properties throughout the United States and theUnited Kingdom and lease those properties to healthcare operating companies under “triple-net” or “absolute-net” leases that obligate the tenants to pay allproperty-related expenses. In our senior living operations segment, we invest in senior housing communities throughout the United States and Canada andengage independent operators, such as Atria and Sunrise, to manage those communities. In our office operations segment, we primarily acquire, own,develop, lease and manage MOBs and research and innovation centers throughout the United States. Information provided for “all other” includes incomefrom loans and investments and other miscellaneous income and various corporate-level expenses not directly attributable to any of our three reportablebusiness segments. Assets included in “all other” consist primarily of corporate assets, including cash, restricted cash, loans receivable and investments,and miscellaneous accounts receivable.
Our chief operating decision makers evaluate performance of the combined properties in each reportable business segment and determine how toallocate resources to those segments, in significant part, based on segment NOI and related measures. We define segment NOI as total revenues, lessinterest and other income, property-level operating expenses and office building services costs. We consider segment NOI useful because it allowsinvestors, analysts and our management to measure unlevered property-level operating results and to compare our operating results to the operating resultsof other real estate companies between periods on a consistent basis. In order to facilitate a clear understanding of our historical consolidated operatingresults, segment NOI should be examined in conjunction with net income attributable to common stockholders as presented in our Consolidated FinancialStatements and other financial data included elsewhere in this Quarterly Report on Form 10-Q.
Interest expense, depreciation and amortization, general, administrative and professional fees, income tax expense and other non-property specificrevenues and expenses are not allocated to individual reportable business segments for purposes of assessing segment performance. There are nointersegment sales or transfers.
28

NOTES TO CONSOLIDATED FINANCIAL STATEMENTS - Continued(Unaudited)
Summary information by reportable business segment is as follows:
For the Three Months Ended June 30, 2020Triple-Net
LeasedProperties
SeniorLiving
OperationsOffice
OperationsAll
Other Total (In thousands)
Revenues: Rental income $ 176,240 $ — $ 192,925 $ — $ 369,165 Resident fees and services — 549,329 — — 549,329 Office building and other services revenue — — 2,257 1,416 3,673 Income from loans and investments — — — 19,491 19,491 Interest and other income — — — 1,540 1,540
Total revenues $ 176,240 $ 549,329 $ 195,182 $ 22,447 $ 943,198
Total revenues $ 176,240 $ 549,329 $ 195,182 $ 22,447 $ 943,198 Less:
Interest and other income — — — 1,540 1,540 Property-level operating expenses 5,275 432,578 60,752 — 498,605 Office building services costs — — 543 — 543
Segment NOI $ 170,965 $ 116,751 $ 133,887 $ 20,907 442,510
Interest and other income 1,540 Interest expense (123,132) Depreciation and amortization (349,594) General, administrative and professional fees (29,984) Merger-related expenses and deal costs (6,586) Allowance on loans receivable and investments (29,655) Other (3,382) Loss from unconsolidated entities (5,850) Gain on real estate dispositions 1,254 Income tax expense (56,356)
Loss from continuing operations (159,235) Net loss (159,235)
Net loss attributable to noncontrolling interests (2,065)
Net loss attributable to common stockholders $ (157,170)
29

NOTES TO CONSOLIDATED FINANCIAL STATEMENTS - Continued(Unaudited)
For the Three Months Ended June 30, 2019Triple-Net
LeasedProperties
SeniorLiving
OperationsOffice
OperationsAll
Other Total (In thousands)
Revenues: Rental income $ 196,382 $ — $ 202,188 $ — $ 398,570 Resident fees and services — 520,725 — — 520,725 Office building and other services revenue — — 1,850 841 2,691 Income from loans and investments — — — 19,529 19,529 Interest and other income — — — 9,202 9,202
Total revenues $ 196,382 $ 520,725 $ 204,038 $ 29,572 $ 950,717
Total revenues $ 196,382 $ 520,725 $ 204,038 $ 29,572 $ 950,717 Less:
Interest and other income — — — 9,202 9,202 Property-level operating expenses 6,321 366,837 62,743 — 435,901 Office building services costs — — 515 — 515
Segment NOI $ 190,061 $ 153,888 $ 140,780 $ 20,370 505,099
Interest and other income 9,202 Interest expense (110,369) Depreciation and amortization (226,187) General, administrative and professional fees (43,079) Loss on extinguishment of debt, net (4,022) Merger-related expenses and deal costs (4,600) Other 11,481 Loss from unconsolidated entities (2,529) Gain on real estate dispositions 19,150 Income tax benefit 57,752
Income from continuing operations 211,898 Net income 211,898
Net income attributable to noncontrolling interests 1,369
Net income attributable to common stockholders $ 210,529
30

NOTES TO CONSOLIDATED FINANCIAL STATEMENTS - Continued(Unaudited)
For the Six Months Ended June 30, 2020Triple-Net Leased
PropertiesSenior Living
Operations Office Operations All Other Total(In thousands)
Revenues:Rental income $ 371,102 $ — $ 401,320 $ — $ 772,422 Resident fees and services — 1,126,099 — — 1,126,099 Office building and other services revenue — — 4,432 2,369 6,801 Income from loans and investments — — — 43,537 43,537 Interest and other income — — — 6,393 6,393
Total revenues $ 371,102 $ 1,126,099 $ 405,752 $ 52,299 $ 1,955,252
Total revenues $ 371,102 $ 1,126,099 $ 405,752 $ 52,299 $ 1,955,252 Less:
Interest and other income — — — 6,393 6,393 Property-level operating expenses 11,606 842,709 125,258 — 979,573 Office building services costs — — 1,270 — 1,270
Segment NOI $ 359,496 $ 283,390 $ 279,224 $ 45,906 968,016 Interest and other income 6,393 Interest expense (239,828) Depreciation and amortization (598,431) General, administrative and professional fees (72,519) Merger-related expenses and deal costs (14,804) Allowance on loans receivable and investments (29,655) Other (7,090) Loss from unconsolidated entities (16,726) Gain on real estate dispositions 227,479 Income tax benefit 92,660
Income from continuing operations 315,495 Net income 315,495
Net loss attributable to noncontrolling interests (452)
Net income attributable to common stockholders $ 315,947
31

NOTES TO CONSOLIDATED FINANCIAL STATEMENTS - Continued(Unaudited)
For the Six Months Ended June 30, 2019Triple-Net Leased
PropertiesSenior Living
Operations Office Operations All Other Total(In thousands)
Revenues:Rental income $ 396,450 $ — $ 403,616 $ — $ 800,066 Resident fees and services — 1,042,172 — — 1,042,172 Office building and other services revenue — — 3,626 1,583 5,209 Income from loans and investments — — — 36,655 36,655 Interest and other income — — — 9,489 9,489
Total revenues $ 396,450 $ 1,042,172 $ 407,242 $ 47,727 $ 1,893,591
Total revenues $ 396,450 $ 1,042,172 $ 407,242 $ 47,727 $ 1,893,591 Less:
Interest and other income — — — 9,489 9,489 Property-level operating expenses 13,754 727,823 124,828 — 866,405 Office building services costs — — 1,148 — 1,148
Segment NOI $ 382,696 $ 314,349 $ 281,266 $ 38,238 1,016,549 Interest and other income 9,489 Interest expense (220,988) Depreciation and amortization (462,107) General, administrative and professional fees (83,839) Loss on extinguishment of debt, net (4,427) Merger-related expenses and deal costs (6,780) Other 11,458 Loss from unconsolidated entities (3,475) Gain on real estate dispositions 24,597 Income tax benefit 59,009
Income from continuing operations 339,486 Net income 339,486
Net income attributable to noncontrolling interests 3,172
Net income attributable to common stockholders $ 336,314
Capital expenditures, including investments in real estate property and development project expenditures, by reportable business segment are asfollows:
For the Three Months Ended June
30, For the Six Months Ended June 30, 2020 2019 2020 2019 (In thousands)
Capital expenditures: Triple-net leased properties $ 13,483 $ 5,656 $ 21,168 $ 14,247 Senior living operations 30,932 37,494 82,816 64,453 Office operations 66,415 252,792 207,402 301,946
Total capital expenditures $ 110,830 $ 295,942 $ 311,386 $ 380,646
32

NOTES TO CONSOLIDATED FINANCIAL STATEMENTS - Continued(Unaudited)
Our portfolio of properties and mortgage loan and other investments are located in the United States, Canada and the United Kingdom. Revenues areattributed to an individual country based on the location of each property. Geographic information regarding our operations is as follows:
For the Three Months Ended June
30, For the Six Months Ended June 30, 2020 2019 2020 2019 (In thousands)
Revenues: United States $ 843,324 $ 896,083 $ 1,751,518 $ 1,784,364 Canada 93,190 47,723 190,160 95,320 United Kingdom 6,684 6,911 13,574 13,907
Total revenues $ 943,198 $ 950,717 $ 1,955,252 $ 1,893,591
As of June 30, 2020 As of December 31, 2019 (In thousands)
Net real estate property: United States $ 17,852,855 $ 18,631,352 Canada 2,796,358 2,830,850 United Kingdom 243,529 266,885
Total net real estate property $ 20,892,742 $ 21,729,087
33

ITEM 2. MANAGEMENT’S DISCUSSION AND ANALYSIS OF FINANCIAL CONDITION AND RESULTS OF OPERATIONS
Unless otherwise indicated or except where the context otherwise requires, the terms “we,” “us” and “our” and other similar terms in Item 2 of thisQuarterly Report on Form 10-Q refer to Ventas, Inc. and its consolidated subsidiaries.
Cautionary Statements
Forward-Looking Statements
This Quarterly Report on Form 10-Q includes forward-looking statements within the meaning of Section 27A of the Securities Act of 1933, asamended (the “Securities Act”), and Section 21E of the Securities Exchange Act of 1934, as amended (the “Exchange Act”). All statements regarding ouror our tenants’, operators’, borrowers’ or managers’ expected future financial condition, results of operations, cash flows, funds from operations, dividendsand dividend plans, financing opportunities and plans, capital markets transactions, business strategy, budgets, projected costs, operating metrics, capitalexpenditures, competitive positions, acquisitions, investment opportunities, dispositions, merger integration, growth opportunities, expected lease income,continued qualification as a real estate investment trust (“REIT”), plans and objectives of management for future operations, and statements that includewords such as “anticipate,” “if,” “believe,” “plan,” “estimate,” “expect,” “intend,” “may,” “could,” “should,” “will,” and other similar expressions areforward-looking statements. These forward-looking statements are inherently uncertain, and actual results may differ from our expectations. We do notundertake a duty to update these forward-looking statements, which speak only as of the date on which they are made.
Our actual future results and trends may differ materially from expectations depending on a variety of factors discussed in our filings with theSecurities and Exchange Commission (“SEC”). These factors include without limitation:
• The severity, duration and geographical scope of the COVID-19 pandemic, the effects of the pandemic and measures intended to prevent its spreadon our business, results of operations, cash flows and financial condition, including declines in rental revenues and increases in operating costs inour senior housing operating portfolio; deterioration in the financial conditions of our tenants and their ability to satisfy their payment obligationsto us; constraints in our ability to access capital and other sources of funding; increased risk of claims, litigation and regulatory proceedings anduncertainty that may adversely affect us; and the ability of federal, state and local governments to respond to and manage the pandemiceffectively;
• The ability and willingness of our tenants, operators, borrowers, managers and other third parties to satisfy their obligations under their respectivecontractual arrangements with us, including, in some cases, their obligations to indemnify, defend and hold us harmless from and against variousclaims, litigation and liabilities;
• The ability of our tenants, operators, borrowers and managers to maintain the financial strength and liquidity necessary to satisfy their respectiveobligations and liabilities to third parties, including without limitation obligations under their existing credit facilities and other indebtedness;
• Our success in implementing our business strategy and our ability to identify, underwrite, finance, consummate and integrate diversifyingacquisitions and investments;
• Macroeconomic conditions such as a disruption of or lack of access to the capital markets, changes in the debt rating on U.S. governmentsecurities, default or delay in payment by the United States of its obligations, and changes in the federal or state budgets resulting in the reductionor nonpayment of Medicare or Medicaid reimbursement rates;
• The nature and extent of future competition, including new construction in the markets in which our senior housing communities and officebuildings are located;
• The extent and effect of future or pending healthcare reform and regulation, including cost containment measures and changes in reimbursementpolicies, procedures and rates;
• Increases in our borrowing costs as a result of changes in interest rates and other factors, including the potential phasing out of London Inter-bankOffered Rate (“LIBOR”) after 2021;
34

• The ability of our tenants, operators and managers, as applicable, to comply with laws, rules and regulations in the operation of our properties, todeliver high-quality services, to attract and retain qualified personnel and to attract residents and patients;
• Changes in general economic conditions or economic conditions in the markets in which we may, from time to time, compete, and the effect ofthose changes on our revenues, earnings and funding sources;
• Our ability to pay down, refinance, restructure or extend our indebtedness as it becomes due;
• Our ability and willingness to maintain our qualification as a REIT in light of economic, market, legal, tax and other considerations;
• Final determination of our taxable net income for the year ended December 31, 2019 and for the year ending December 31, 2020;
• The ability and willingness of our tenants to renew their leases with us upon expiration of the leases, our ability to reposition our properties on thesame or better terms in the event of nonrenewal or in the event we exercise our right to replace an existing tenant, and obligations, includingindemnification obligations, we may incur in connection with the replacement of an existing tenant;
• Risks associated with our senior housing operating portfolio, such as factors that can cause volatility in our operating income and earningsgenerated by those properties, including without limitation national and regional economic conditions, development of new competing properties,costs of food, materials, energy, labor and services, employee benefit costs, insurance costs and professional and general liability claims, and thetimely delivery of accurate property-level financial results for those properties;
• Changes in exchange rates for any foreign currency in which we may, from time to time, conduct business;
• Year-over-year changes in the Consumer Price Index or the U.K. Retail Price Index and the effect of those changes on the rent escalators containedin our leases and on our earnings;
• Our ability and the ability of our tenants, operators, borrowers and managers to obtain and maintain adequate property, liability and otherinsurance from reputable, financially stable providers;
• The impact of damage to our properties from catastrophic weather and other natural events and the physical effects of climate change;
• The impact of increased operating costs and uninsured professional liability claims on our liquidity, financial condition and results of operations orthat of our tenants, operators, borrowers and managers and our ability and the ability of our tenants, operators, borrowers and managers toaccurately estimate the magnitude of those claims;
• Risks associated with our office building portfolio and operations, including our ability to successfully design, develop and manage officebuildings and to retain key personnel;
• The ability of the hospitals on or near whose campuses our medical office buildings (“MOBs”) are located and their affiliated health systems toremain competitive and financially viable and to attract physicians and physician groups;
• Risks associated with our investments in joint ventures and unconsolidated entities, including our lack of sole decision-making authority and ourreliance on our joint venture partners’ financial condition;
• Our ability to obtain the financial results expected from our development and redevelopment projects, including projects undertaken through ourjoint ventures;
• The impact of market or issuer events on the liquidity or value of our investments in marketable securities;
• Consolidation in the senior housing and healthcare industries resulting in a change of control of, or a competitor’s investment in, one or more ofour tenants, operators, borrowers or managers or significant changes in the senior management of our tenants, operators, borrowers or managers;
35

• The impact of litigation or any financial, accounting, legal or regulatory issues that may affect us or our tenants, operators, borrowers or managers;and
• Changes in accounting principles, or their application or interpretation, and our ability to make estimates and the assumptions underlying theestimates, which could have an effect on our earnings.
Many of these factors are beyond our control and the control of our management.
Brookdale Senior Living, Kindred, Atria, Sunrise and Ardent Information
Brookdale Senior Living Inc. (together with its subsidiaries, “Brookdale Senior Living”) is subject to the reporting requirements of the SEC and isrequired to file with the SEC annual reports containing audited financial information and quarterly reports containing unaudited financial information. Theinformation related to Brookdale Senior Living contained or referred to in this Quarterly Report on Form 10-Q has been derived from SEC filings made byBrookdale Senior Living or other publicly available information, or was provided to us by Brookdale Senior Living, and we have not verified thisinformation through an independent investigation or otherwise. We have no reason to believe that this information is inaccurate in any material respect, butwe cannot assure you of its accuracy. We are providing this data for informational purposes only, and you are encouraged to obtain Brookdale SeniorLiving’s publicly available filings, which can be found on the SEC’s website at www.sec.gov.
Kindred Healthcare, LLC (together with its subsidiaries, “Kindred”), Atria Senior Living, Inc. (“Atria”), Sunrise Senior Living, LLC (together with itssubsidiaries, “Sunrise”) and Ardent Health Partners, LLC (together with its subsidiaries, “Ardent”) are not currently subject to the reporting requirementsof the SEC. The information related to Kindred, Atria, Sunrise and Ardent contained or referred to in this Quarterly Report on Form 10-Q has been derivedfrom publicly available information or was provided to us by Kindred, Atria, Sunrise or Ardent, as the case may be, and we have not verified thisinformation through an independent investigation or otherwise. We have no reason to believe that this information is inaccurate in any material respect, butwe cannot assure you of its accuracy.
Company Overview
We are a REIT with a highly diversified portfolio of senior housing, research and innovation, and healthcare properties located throughout the UnitedStates, Canada and the United Kingdom. As of June 30, 2020, we owned or managed through unconsolidated joint ventures approximately 1,200 properties(including properties classified as held for sale), consisting of senior housing communities, MOBs, research and innovation centers, inpatient rehabilitationfacilities (“IRFs”) and long-term acute care facilities (“LTACs”), and health systems. We also had 20 properties under development, including twoproperties that are owned by unconsolidated real estate entities. We are an S&P 500 company headquartered in Chicago, Illinois.
We primarily invest in senior housing, research and innovation, and healthcare properties through acquisitions and lease our properties to unaffiliatedtenants or operate them through independent third-party managers.
As of June 30, 2020, we leased a total of 385 properties (excluding properties within our office operations reportable business segment) to varioushealthcare operating companies under “triple-net” or “absolute-net” leases that obligate the tenants to pay all property-related expenses, includingmaintenance, utilities, repairs, taxes, insurance and capital expenditures. Our three largest tenants, Brookdale Senior Living, Ardent and Kindred leasedfrom us 122 properties (excluding two properties managed by Brookdale Senior Living pursuant to long-term management agreements), 11 properties and32 properties, respectively, as of June 30, 2020.
As of June 30, 2020, pursuant to long-term management agreements, we engaged independent operators, such as Atria and Sunrise, to manage 435senior housing communities for us.
Through our Lillibridge Healthcare Services, Inc. subsidiary and our ownership interest in PMB Real Estate Services LLC, we also provide MOBmanagement, leasing, marketing, facility development and advisory services to highly rated hospitals and health systems throughout the United States. Inaddition, from time to time, we make secured and non-mortgage loans and other investments relating to senior housing and healthcare operators orproperties.
We aim to enhance shareholder value by delivering consistent, superior total returns through a strategy of: (1) generating reliable and growing cashflows; (2) maintaining a balanced, diversified portfolio of high-quality assets; and (3) preserving our financial strength, flexibility and liquidity.
36

Our ability to access capital in a timely and cost effective manner is critical to the success of our business strategy because it affects our ability tosatisfy existing obligations, including the repayment of maturing indebtedness, and to make future investments. Factors such as general market conditions,interest rates, credit ratings on our securities, expectations of our potential future earnings and cash distributions, and the trading price of our common stockthat are beyond our control and fluctuate over time all impact our access to and cost of external capital. For that reason, we generally attempt to match thelong-term duration of our investments in real property with long-term financing through the issuance of shares of our common stock or the incurrence oflong-term fixed rate debt.
COVID-19 Update
In December 2019, a novel strain of coronavirus (“COVID-19”) emerged in China. On March 11, 2020, the World Health Organization declared theoutbreak of COVID-19 a pandemic. The outbreak has spread around the world, including throughout the United States.
The COVID-19 pandemic and actions taken to prevent its spread continue to affect our business in a number of ways. In our senior living operatingportfolio, occupancy, revenue and net operating income decreased as resident move-ins decreased and operating costs increased as a result of the pandemic.
Our triple-net senior housing tenants experienced similar occupancy, revenue and cost pressure trends as our senior living operators. While we collectedsubstantially all triple-net senior housing rent we expected to receive in the first and second quarters, we have given and may continue to provide financialsupport to our triple-net tenants in the form of rent deferrals and application of portions of lease deposits to fulfill payment obligations. We also recentlymade material changes to our senior housing triple-net leases with Holiday Retirement and Brookdale Senior Living, respectively, which will decrease ournet operating income. Without financial support or other government assistance, certain of our triple-net senior housing tenants will likely experienceworsening financial conditions through the third quarter, which would pressure their rent coverage ratios and may affect their ability to pay us contractualrent in full on a timely basis.
In our healthcare triple-net leased properties portfolio, we collected substantially all rent due in the first and second quarters. This cohort of tenants hasbenefitted from significant government financial support to partially offset the direct financial impact of the COVID-19 pandemic on healthcare providers.Nationally, hospital inpatient admissions and surgeries have rebounded, although still below pre-COVID-19 levels, depending on the particular market.
In our office operations segment, we received 99% of contractual rents in the second quarter. Substantially all of our medical office buildings arein states that have either reopened for elective procedures or announced the resumption of elective procedures, which are an important driver of financialperformance for many of our medical office tenants.
In March 2020, we took precautionary steps to increase liquidity and preserve financial flexibility in light of the uncertainty resulting from theCOVID-19 pandemic by drawing $2.75 billion under our $3.0 billion unsecured revolving credit facility. Due to improved capital market conditions andthe decisive actions described below, we have since repaid all borrowings under the facility. As of August 5, 2020, we had approximately $3.5 billionbillion in liquidity, including availability under our revolving credit facility, cash and cash equivalents on hand, with no borrowings outstanding under ourcommercial paper program and negligible near-term debt maturing.
In June 2020, our Board of Directors declared a second quarter 2020 dividend of $0.45 per share, which was paid in July and represented a 43 percentreduction from the first quarter dividend of $0.7925 per share. This measure enabled us to conserve approximately $130 million of cash per quartercompared to the prior dividend level. In order to further conserve capital, we have reduced expected capital expenditures for 2020 by $0.3 billion to a newexpected total of $0.5 billion, mainly through pausing certain ground-up developments that were not yet substantially underway. Also, in June, weeliminated roles representing over 25% of our corporate positions, excluding onsite field personnel. For the second half of 2020, the base salaries of ourCEO and other executive officers was voluntarily reduced by 20% and 10%, respectively. As a result of these capital conservation actions, we expect thatour third quarter 2020 annualized general and administrative expenses will be approximately $25 to $30 million lower than our reported general andadministrative expenses for full-year 2019.
The federal government, as well as state and local governments, have implemented or announced programs to provide financial and other support tobusinesses affected by the COVID-19 pandemic, some of which benefit or could benefit our company, tenants, operators, borrowers and managers. Forexample, the Department of Health and Human Services (“HHS”) Provider Relief Fund for COVID-19 is currently providing grants to licensed seniorliving providers that bill Medicaid. Eligible providers will receive payments of at least 2% of all annual gross patient care revenues. If HHS funding isultimately expanded to all licensed senior living providers, we expect most of our senior living communities to benefit.
37

The future impact of the COVID-19 pandemic is highly uncertain. Many of the trends highlighted above have continued into the third quarter. The extentof the COVID-19 pandemic’s continued and ultimate effect on our operational and financial performance will depend on future developments, includingthe duration, spread and intensity of the outbreak, the rate at which governments across the country lift restrictions and the extent and duration of anyrollback of restrictions and the availability of government financial support to our business, tenants and operators. Due to these uncertainties, we are notable at this time to estimate the ultimate impact of the COVID-19 pandemic on our business, results of operations, financial condition and cash flows but itcould be material.
We have not identified the COVID-19 pandemic, on its own, as a "triggering event" for purposes of evaluating impairment of real estate assets,goodwill and other intangibles, investments in unconsolidated entities and financial instruments. However, as of June 30, 2020, we considered the effect ofthe pandemic on certain of our assets (described below) and our ability to recover the respective carrying values of these assets. We applied ourconsiderations to existing critical accounting policies that require us to make estimates and assumptions regarding future events that affect the reportedamounts of assets and liabilities. We based our estimates on our experience and on assumptions we believe to be reasonable under the circumstances. As aresult, we have recognized the following charges for the quarter ended June 30, 2020:
• Adjustment to rental income: As of June 30, 2020, we concluded that it is probable we would not collect substantially all rents from certaintenants, primarily within our triple-net leased properties segment. As a result, we recognized an adjustment to rental income of $54.2 million.Subsequent to June 30, 2020, rental payments from these tenants will be recognized in rental income when received.
• Impairment of real estate assets: As of June 30, 2020, we concluded that our estimate of undiscounted cash flows, including a hypotheticalterminal value, for certain real estate assets did not exceed the assets' respective carrying values. As such, during the quarter ended June 30, 2020we recognized $108.8 million of impairments representing the difference between the assets' carrying value and estimated fair value of $192.8million. The impaired assets, primarily senior housing communities, represent less than 1% of our consolidated net real estate property as of June30, 2020. Impairments are recorded within depreciation and amortization in our Consolidated Statements of Income and are primarily related toour senior living operations reportable business segment.
• Loss on financial instruments and impairment of unconsolidated entities: As of June 30, 2020, we concluded that credit losses exist within certainof our non-mortgage loans receivables and government-sponsored pooled loan investments and impairments have occurred with respect tounconsolidated entities. As a result, (a) we established allowances of $20.8 million and $8.8 million, respectively, which reduces the amountspresented on our Consolidated Balance Sheets with a corresponding loss on financial instruments in our Consolidated Statements of Income, and(b) we recognized an impairment of $10.7 million in an equity investment in an unconsolidated entity. No allowances are recorded within ourportfolios of secured mortgage loans or marketable debt securities.
• Deferred tax asset valuation allowance: As of June 30, 2020, we concluded that it was not more likely than not that deferred tax assets (primarilyUS federal NOL carryforwards which begin to expire in 2032) would be realized based on our cumulative loss in recent years for certain of ourtaxable REIT subsidiaries. As a result, we recorded a valuation allowance of $56.4 million against these deferred tax assets on our ConsolidatedBalance Sheets with a corresponding charge to income tax (expense) benefit in our Consolidated Statements of Income.
2020 Highlights
Investments and Dispositions
• In March 2020, we formed and sponsored the Ventas Life Science and Healthcare Real Estate Fund, L.P. (the “Fund”), a perpetual life vehicle thatfocuses on investments in life science, medical office and senior housing real estate. We are the manager and general partner of the Fund and haveretained a 21% interest in the Fund. To seed the Fund, we contributed six (two of which are on the same campus) stabilized research andinnovation and medical office properties comprising 1.2 million square feet of space. We received cash consideration of $620 million andrecognized a gain on the transactions of $224.6 million. The Fund had approximately $0.8 billion in assets under management and third-partyequity commitments of approximately $0.65 billion from globally respected institutional investors as of June 30, 2020.
38

• During the six months ended June 30, 2020, we received aggregate proceeds of $106.1 million for the full repayment of the principal balances ofvarious loans receivable with a weighted average interest rate of 8.3% that were due to mature between 2020 and 2025, resulting in total gains of$1.4 million.
• During the six months ended June 30, 2020, we sold three properties for aggregate consideration of $11.5 million and we recognized a gain on thesale of these assets of $2.8 million.
Liquidity
• In March 2020, we issued $500.0 million aggregate principal amount of 4.75% senior notes due 2030. The notes were settled and proceeds werereceived in April 2020.
Portfolio
• In July 2020, we entered into a revised master lease agreement (the “Brookdale Lease”) and certain other agreements (together with the BrookdaleLease, the “Agreements”) with Brookdale Senior Living. The Agreements modify our current arrangements with Brookdale Senior Living asfollows:
We received up-front consideration approximating $235 million dollars, which will be amortized over the remaining lease term and consisted of:(a) $162 million in cash including $47 million from the transfer to Ventas of deposits under the Brookdale Lease; (b) a $45 million cash pay note(the “Note”) from Brookdale. The Note has an initial interest rate of nine percent, increasing 50 basis points per annum, and matures on December31, 2025; (c) warrants exercisable for 16.3 million shares of Brookdale Senior Living common stock, which are exercisable at any time prior toDecember 31, 2025 and have an exercise price of $3.00 per share.
Base cash rent under the Brookdale Lease is set at $100 million per annum starting in July 2020, with three percent annual escalators commencingon January 1, 2022. The Brookdale Lease is guaranteed by, and the Note is a direct obligation of, Brookdale Senior Living.
Brookdale Senior Living transferred fee ownership of five senior living communities to us, in full satisfaction and repayment of a $78 million loanto Brookdale Senior Living from us that was secured by the five communities. Brookdale Senior Living will now manage those communities forus under a terminable management agreement.
• In April 2020, we completed a transaction with affiliates of Holiday Retirement (collectively, “Holiday”), including (a) entry into a new,terminable management agreement with Holiday Management Company for our 26 independent living assets previously subject to a triple-netlease (the “Holiday Lease”) with Holiday; (b) termination of the Holiday Lease; and (c) our receipt from Holiday of $33.8 million in cash from thetransfer to us of deposits under the Holiday Lease and $66 million in principal amount of secured notes. As a result of the Holiday Leasetermination, we recognized net income of $50.2 million, composed of $99.8 million of cash and notes received less $49.6 million from the write-off of accumulated straight-line receivable.
39

Concentration Risk
We use concentration ratios to identify, understand and evaluate the potential impact of economic downturns and other adverse events that may affectour asset types, geographic locations, business models, and tenants, operators and managers. We evaluate concentration risk in terms of investment mix andoperations mix. Investment mix measures the percentage of our investments that is concentrated in a specific asset type or that is operated or managed by aparticular tenant, operator or manager. Operations mix measures the percentage of our operating results that is attributed to a particular tenant, operator ormanager, geographic location or business model. The following tables reflect our concentration risk as of the dates and for the periods presented:
As of June 30, 2020 As of December 31, 2019
Investment mix by asset type(1): Senior housing communities 63.5 % 62.2 %MOBs 19.0 19.3 Research and innovation centers 7.4 8.7 Health systems 5.3 5.1 IRFs and LTACs 1.7 1.6 Skilled nursing facilities (“SNFs”) 0.7 0.7 Secured loans receivable and investments, net 2.4 2.4
Investment mix by tenant, operator and manager(1): Atria 20.7 % 20.4 %Sunrise 10.5 10.3 Brookdale Senior Living 7.9 7.7 Ardent 4.9 4.7 Kindred 1.0 1.0 All other 55.0 55.9
(1) Ratios are based on the gross book value of consolidated real estate investments (excluding properties classified as held for sale) as of eachreporting date.
40

For the Three Months Ended June 30, For the Six Months Ended June 30, 2020 2019 2020 2019
Operations mix by tenant and operator and business model:
Revenues(1): Senior living operations 58.4 % 54.8 % 57.7 % 55.0 %
Brookdale Senior Living(2) 4.9 4.8 4.7 5.5 Ardent 3.2 3.1 3.1 3.1 Kindred 3.5 3.4 3.3 3.5 All others 30.0 33.9 31.2 32.9
Adjusted EBITDA: Senior living operations 27.5 % 31.4 % 30.5 % 32.2 %
Brookdale Senior Living(2) 10.8 8.3 10.0 8.0 Ardent 7.1 5.5 6.6 5.2 Kindred 7.7 6.0 7.1 5.7 All others 46.9 48.8 45.8 48.9
Net operating income (“NOI”) Senior living operations 26.7 % 30.5 % 29.4 % 30.9 %
Brookdale Senior Living(2) 10.4 8.9 9.5 8.9 Ardent 6.8 5.8 6.2 5.8 Kindred 7.4 6.4 6.7 6.3 All others 48.7 48.4 48.2 48.1
Operations mix by geographic location(3): California 16.2 % 16.3 % 15.7 % 16.3 %New York 8.1 8.9 8.3 9.0 Texas 6.7 6.1 6.2 6.2 Pennsylvania 4.7 4.6 4.7 4.7 Illinois 4.2 4.3 4.1 4.3 All others 60.1 59.8 61.0 59.5
(1) Total revenues include office building and other services revenue, revenue from loans and investments and interest and other income (excludingamounts in discontinued operations and including amounts related to assets classified as held for sale).
(2) Excludes two senior housing communities which are included in the senior living operations reportable business segment.(3) Ratios are based on total revenues (including amounts related to assets classified as held for sale) for each period presented.
See “Non-GAAP Financial Measures” included elsewhere in this Quarterly Report on Form 10-Q for additional disclosure and reconciliations of netincome attributable to common stockholders, as computed in accordance with GAAP, to Adjusted EBITDA and NOI, respectively.
Triple-Net Lease Expirations
If our tenants are not able or willing to renew our triple-net leases upon expiration, we may be unable to reposition the applicable properties on atimely basis or on the same or better economic terms, if at all. Although our lease expirations are staggered, the non-renewal of some or all of our triple-netleases that expire in any given year could have a material adverse effect on our business, financial condition, results of operations and liquidity, our abilityto service our indebtedness and other obligations and our ability to make distributions to our stockholders, as required for us to continue to qualify as aREIT (a “Material Adverse Effect”). During the six months ended June 30, 2020, we had no triple-net lease renewals or expirations without renewal that, inthe aggregate, had a material impact on our financial condition or results of operations for that period.
41

Critical Accounting Policies and Estimates
Our Consolidated Financial Statements included in Part I, Item 1 of this Quarterly Report on Form 10-Q have been prepared in accordance with U.S.generally accepted accounting principles (“GAAP”) for interim financial information set forth in the Accounting Standards Codification (“ASC”), aspublished by the Financial Accounting Standards Board (“FASB”), and with the SEC instructions to Form 10-Q and Article 10 of Regulation S-X. GAAPrequires us to make estimates and assumptions regarding future events that affect the reported amounts of assets and liabilities, the disclosure of contingentassets and liabilities at the date of the financial statements and the reported amounts of revenues and expenses during the reporting periods. We base theseestimates on our experience and assumptions we believe to be reasonable under the circumstances. However, if our judgment or interpretation of the factsand circumstances relating to various transactions or other matters had been different, we may have applied a different accounting treatment, resulting in adifferent presentation of our financial statements. We periodically reevaluate our estimates and assumptions, and in the event they prove to be differentfrom actual results, we make adjustments in subsequent periods to reflect more current estimates and assumptions about matters that are inherentlyuncertain.
Our Annual Report on Form 10-K for the year ended December 31, 2019, filed with the SEC on February 24, 2020, contains further informationregarding the critical accounting policies that affect our more significant estimates and judgments used in the preparation of our Consolidated FinancialStatements included in Part I, Item 1 of this Quarterly Report on Form 10-Q. There have been no material changes to these policies in 2020. Please refer to“Note 2 - Accounting Policies” of the Notes to Consolidated Financial Statements included in Part I, Item 1 of this Quarterly Report on Form 10-Q forinformation regarding recently adopted accounting standards. Results of Operations
As of June 30, 2020, we operated through three reportable business segments: triple-net leased properties, senior living operations and officeoperations. In our triple-net leased properties segment, we invest in and own senior housing and healthcare properties throughout the United States and theUnited Kingdom and lease those properties to healthcare operating companies under “triple-net” or “absolute-net” leases that obligate the tenants to pay allproperty-related expenses. In our senior living operations segment, we invest in senior housing communities throughout the United States and Canada andengage independent operators, such as Atria and Sunrise, to manage those communities. In our office operations segment, we primarily acquire, own,develop, lease and manage MOBs and research and innovation centers throughout the United States. Information provided for “all other” includes incomefrom loans and investments and other miscellaneous income and various corporate-level expenses not directly attributable to any of our three reportablebusiness segments. Assets included in “all other” consist primarily of corporate assets, including cash, restricted cash, loans receivable and investments,and miscellaneous accounts receivable.
Our chief operating decision makers evaluate performance of the combined properties in each reportable business segment and determine how toallocate resources to those segments, in significant part, based on segment NOI and related measures. For further information regarding our reportablebusiness segments and a discussion of our definition of segment NOI, see “Note 15 - Segment Information” of the Notes to Consolidated FinancialStatements included in Part I, Item 1 of this Quarterly Report on Form 10-Q. See “Non-GAAP Financial Measures” included elsewhere in this QuarterlyReport on Form 10-Q for additional disclosure and reconciliations of net income attributable to common stockholders, as computed in accordance withGAAP, to NOI.
42

Three Months Ended June 30, 2020 and 2019
The table below shows our results of operations for the three months ended June 30, 2020 and 2019 and the effect of changes in those results fromperiod to period on our net income attributable to common stockholders.
For the Three Months Ended June 30,(Decrease) Increase
to Net Income 2020 2019 $ % (Dollars in thousands)
Segment NOI: Triple-net leased properties $ 170,965 $ 190,061 $ (19,096) (10.0)%Senior living operations 116,751 153,888 (37,137) (24.1) Office operations 133,887 140,780 (6,893) (4.9) All other 20,907 20,370 537 2.6 Total segment NOI 442,510 505,099 (62,589) (12.4)
Interest and other income 1,540 9,202 (7,662) (83.3) Interest expense (123,132) (110,369) (12,763) (11.6) Depreciation and amortization (349,594) (226,187) (123,407) (54.6) General, administrative and professional fees (29,984) (43,079) 13,095 30.4 Loss on extinguishment of debt, net — (4,022) 4,022 nmMerger-related expenses and deal costs (6,586) (4,600) (1,986) (43.2) Allowance on loans receivable and investments (29,655) — (29,655) nmOther (3,382) 11,481 (14,863) nm
(Loss) income before unconsolidated entities, real estate dispositions,income taxes and noncontrolling interests (98,283) 137,525 (235,808) nm
Loss from unconsolidated entities (5,850) (2,529) (3,321) nmGain on real estate dispositions 1,254 19,150 (17,896) (93.5) Income tax (expense) benefit (56,356) 57,752 (114,108) nm
(Loss) income from continuing operations (159,235) 211,898 (371,133) nmNet (loss) income (159,235) 211,898 (371,133) nm
Net (loss) income attributable to noncontrolling interests (2,065) 1,369 3,434 nm
Net (loss) income attributable to common stockholders $ (157,170) $ 210,529 (367,699) nm
nm - not meaningful
Segment NOI—Triple-Net Leased Properties
The following table summarizes results of operations in our triple-net leased properties reportable business segment, including assets sold or classifiedas held for sale as of June 30, 2020.
For the Three Months Ended June 30,(Decrease) Increase
to Segment NOI 2020 2019 $ % (Dollars in thousands)
Segment NOI—Triple-Net Leased Properties: Rental income $ 176,240 $ 196,382 $ (20,142) (10.3)%Less: Property-level operating expenses (5,275) (6,321) 1,046 16.5
Segment NOI $ 170,965 $ 190,061 (19,096) (10.0)
In our triple-net leased properties reportable business segment, our revenues generally consist of fixed rental amounts (subject to annual contractualescalations) received from our tenants in accordance with the applicable lease terms. We report revenues and property-level operating expenses within ourtriple-net leased properties reportable business segment for real estate tax and insurance expenses that are paid from escrows collected from our tenants.
43

The segment NOI decrease in our triple-net leased portfolio was primarily driven by the write-off of previously accrued straight-line rental incomeduring the second quarter of 2020 of $53.3 million (non-Holiday assets) and the removal of 26 Holiday communities at the start of the second quarter 2020from our triple-net portfolio, partially offset by the $50.2 million net impact of terminating the Holiday Lease. We will continue to try to collect rent on acontractual basis for the tenants where straight-line rent has been written off, but we have determined that collectability is not probable due to COVID-19.
Occupancy rates may affect the profitability of our tenants’ operations. For senior housing communities and post-acute properties in our triple-netleased properties reportable business segment, occupancy generally reflects average operator-reported unit and bed occupancy, respectively, for thereporting period. Because triple-net financials are delivered to us following the reporting period, occupancy is reported in arrears. The following table setsforth average continuing occupancy rates related to the triple-net leased properties we owned at June 30, 2020 and 2019 for the first quarter of 2020 and2019, respectively. The table excludes non-stabilized properties, properties owned through investments in unconsolidated entities, certain properties forwhich we do not receive occupancy information and properties acquired or properties that transitioned operators for which we do not have a full quarter ofoccupancy results.
Number of PropertiesOwned at June 30,
2020
Average Occupancy for theThree Months Ended March
31, 2020
Number of PropertiesOwned at June 30,
2019
Average Occupancy for theThree Months Ended March
31, 2019
Senior housing communities 302 84.8% 342 84.2%SNFs 16 88.7 16 88.0
IRFs and LTACs36 54.7 36 55.8
The following table compares results of operations for our 375 same-store triple-net leased properties. See “Non-GAAP Financial Measures—NOI”included elsewhere in this Quarterly Report on Form 10-Q for additional disclosure regarding same-store NOI.
For the Three Months Ended June 30, Increase to Segment NOI 2020 2019 $ % (Dollars in thousands)
Same-Store Segment NOI—Triple-Net Leased Properties: Rental income $ 122,412 $ 172,865 $ (50,453) (29.2)%Less: Property-level operating expenses (5,187) (4,774) (413) (8.7)
Segment NOI $ 117,225 $ 168,091 (50,866) (30.3)
The segment NOI decrease in our same-store triple net leased portfolio was primarily driven by the write-off of previously accrued straight-line rentalincome during the second quarter of 2020. We will continue to try to collect rent on a contractual basis for the tenants where straight-line rent has beenwritten off, but we have determined that collectability is not probable due to COVID-19.
Segment NOI—Senior Living Operations
The following table summarizes results of operations in our senior living operations reportable business segment, including assets sold or classified asheld for sale as of June 30, 2020. For senior housing communities in our senior living operations reportable business segment, occupancy generally reflectsaverage operator-reported unit occupancy for the reporting period.
For the Three Months Ended June 30,Increase (Decrease)
to Segment NOI 2020 2019 $ % (Dollars in thousands)
Segment NOI—Senior Living Operations: Resident fees and services $ 549,329 $ 520,725 $ 28,604 5.5 %Less: Property-level operating expenses (432,578) (366,837) (65,741) (17.9)
Segment NOI $ 116,751 $ 153,888 (37,137) (24.1)
44

Number of Properties at June 30,Average Unit Occupancy for theThree Months Ended June 30,
Average Monthly Revenue PerOccupied Room For the Three Months
Ended June 30, 2020 2019 2020 2019 2020 2019
Total communities 428 367 82.2 % 85.8 % $ 4,674 $ 5,772
Resident fees and services include all amounts earned from residents at our senior housing communities, such as rental fees related to resident leases,extended health care fees and other ancillary service income. Property-level operating expenses related to our senior living operations segment includelabor, food, utilities, marketing, management and other costs of operating the properties.
The segment NOI decrease in our senior housing operating portfolio was primarily driven by lower occupancy rates and increased operating costsresulting from the COVID-19 pandemic. This is offset by the transition of 26 independent living assets at the start of the second quarter 2020, operated byHoliday from our triple-net portfolio to our senior housing operating portfolio and the third quarter 2019 acquisition of 34 Canadian senior housingcommunities via an equity partnership with Le Groupe Maurice.
The following table compares results of operations for our 340 same-store senior living operating communities.
For the Three Months Ended June 30,Decrease
to Segment NOI 2020 2019 $ % (Dollars in thousands)
Same-Store Segment NOI—Senior Living Operations: Resident fees and services $ 456,275 $ 496,496 $ (40,221) (8.1)%Less: Property-level operating expenses (369,813) (345,544) (24,269) (7.0)
Segment NOI $ 86,462 $ 150,952 (64,490) (42.7)
Number of Properties at June 30,Average Unit Occupancy for theThree Months Ended June 30,
Average Monthly Revenue PerOccupied Room For the Three Months
Ended June 30, 2020 2019 2020 2019 2020 2019
Same-store communities 340 340 79.7 % 86.4 % $ 5,751 $ 5,782
The segment NOI decrease in our same-store senior housing operating portfolio was primarily driven by lower occupancy and increased operatingcosts resulting from the COVID-19 pandemic.
45

Segment NOI—Office Operations
The following table summarizes results of operations in our office operations reportable business segment, including assets sold or classified as heldfor sale as of June 30, 2020. For properties in our office operations reportable business segment, occupancy generally reflects occupied square footagedivided by net rentable square footage as of the end of the reporting period.
For the Three Months Ended June 30,Increase (Decrease)
to Segment NOI 2020 2019 $ % (Dollars in thousands)
Segment NOI—Office Operations: Rental income $ 192,925 $ 202,188 $ (9,263) (4.6)%Office building services costs 2,257 1,850 407 22.0
Total revenues 195,182 204,038 (8,856) (4.3) Less:
Property-level operating expenses (60,752) (62,743) 1,991 3.2 Office building services costs (543) (515) (28) (5.4)
Segment NOI $ 133,887 $ 140,780 (6,893) (4.9)
Number of Properties at June 30, Occupancy at June 30,
Annualized Average Rent PerOccupied Square Foot for the Three
Months Ended June 30, 2020 2019 2020 2019 2020 2019
Total office buildings 377 385 90.4 % 89.8 % $ 33 $ 33
The office segment NOI decrease was primarily driven by assets sold to the Fund in the first quarter of 2020 and COVID-impacted reduced parkingrevenues offset by active leasing at recently developed properties, increasing tenant retention and contractual rent increases.
The following table compares results of operations for our 359 same-store office buildings.
For the Three Months Ended June 30,Increase (Decrease)
to Segment NOI 2020 2019 $ % (Dollars in thousands)
Same-Store Segment NOI—Office Operations: Rental income $ 183,150 $ 182,215 $ 935 0.5 %Less: Property-level operating expenses (56,828) (57,325) 497 0.9
Segment NOI $ 126,322 $ 124,890 1,432 1.1
Number of Properties at June 30, Occupancy at June 30,
Annualized Average Rent PerOccupied Square Foot for the Three
Months Ended June 30, 2020 2019 2020 2019 2020 2019
Same-store office buildings 359 359 91.7 % 90.7 % $ 33 $ 33
46

Same-store operations increases in the first quarter of 2020 over the same period in 2019 were driven by strong tenant retention, contractual rentescalators and increased occupancy primarily in our Research and Innovation centers.
All Other
Information provided for all other segment NOI includes income from loans and investments and other miscellaneous income not directly attributableto any of our three reportable business segments. The $0.5 million increase in all other segment NOI for the three months ended June 30, 2020 over thesame period in 2019 is primarily due to increased management fee revenues from investments in unconsolidated real estate entities.
Interest and Other Income
The $7.7 million decrease in interest and other income for the three months ended June 30, 2020 over the same period in 2019 is primarily due to 2019income from the exercise of warrants in 2019 related to our research and innovation properties.
Interest Expense
The $12.8 million increase in total interest expense for the three months ended June 30, 2020 compared to the same period in 2019 is attributable to anincrease of $31.9 million due to higher debt balances, partially offset by a decrease of $19.2 million due to a lower effective interest rate and increasedcapitalized interest. Our weighted average effective interest rate was 3.3% and 4.0% for the three months ended June 30, 2020 and 2019, respectively.Capitalized interest for the three months ended June 30, 2020 and 2019 was $2.7 million and $2.0 million, respectively.
Depreciation and Amortization
Depreciation and amortization expense increased $123.4 million during the three months ended June 30, 2020 compared to the same period in 2019primarily due to real estate impairments recognized in 2020, asset acquisitions, net of dispositions. See “COVID-19 Update” for information regarding2020 impairment charges.
Merger-Related Expenses and Deal Costs
The $2.0 million increase in merger-related expenses and deal costs is primarily attributable to 2020 severance related costs offset by 2019 expensesrelated to operator transitions.
Other
The $14.9 million change in other expenses is primarily attributable to property insurance recoveries received during the second quarter of 2019.
Loss from Unconsolidated Entities
The $3.3 million increase in loss from unconsolidated entities during the three months ended June 30, 2020 compared to the same period in 2019 isprimarily due to an impairment of our investment in an unconsolidated operating entity offset by an increase in income from one of our unconsolidatedentities. See “COVID-19 Update” for information regarding 2020 impairment charges.
Gain on Real Estate Dispositions
The $17.9 million decrease in gain on real estate dispositions is due to fewer dispositions in the second quarter of 2020.
Income Tax (Expense) Benefit
The $114.1 million increase in income tax expense related to continuing operations for the three months ended June 30, 2020 compared to the sameperiod in 2019 is primarily due to establishing a $56.4 million valuation allowance against deferred tax assets of certain of our TRS entities in 2020.
47

Six Months Ended June 30, 2020 and 2019
The table below shows our results of operations for the six months ended June 30, 2020 and 2019 and the effect of changes in those results fromperiod to period on our net income attributable to common stockholders.
For the Six Months Ended June 30,(Decrease) Increase
to Net Income 2020 2019 $ % (Dollars in thousands)
Segment NOI: Triple-net leased properties $ 359,496 $ 382,696 $ (23,200) (6.1)%Senior living operations 283,390 314,349 (30,959) (9.8) Office operations 279,224 281,266 (2,042) (0.7) All other 45,906 38,238 7,668 20.1 Total segment NOI 968,016 1,016,549 (48,533) (4.8)
Interest and other income 6,393 9,489 (3,096) (32.6) Interest expense (239,828) (220,988) (18,840) (8.5) Depreciation and amortization (598,431) (462,107) (136,324) (29.5) General, administrative and professional fees (72,519) (83,839) 11,320 13.5 Loss on extinguishment of debt, net — (4,427) 4,427 nmMerger-related expenses and deal costs (14,804) (6,780) (8,024) nmAllowance on loans receivable and investments (29,655) — (29,655) nmOther (7,090) 11,458 (18,548) nm
Income before unconsolidated entities, real estate dispositions, incometaxes and noncontrolling interests 12,082 259,355 (247,273) (95.3)
Loss from unconsolidated entities (16,726) (3,475) (13,251) nmGain on real estate dispositions 227,479 24,597 202,882 nmIncome tax benefit 92,660 59,009 33,651 57.0
Income from continuing operations 315,495 339,486 (23,991) (7.1) Net income 315,495 339,486 (23,991) (7.1)
Net (loss) income attributable to noncontrolling interests (452) 3,172 3,624 nm
Net income attributable to common stockholders $ 315,947 $ 336,314 (20,367) (6.1)
nm - not meaningful
Segment NOI—Triple-Net Leased Properties
The following table summarizes results of operations in our triple-net leased properties reportable business segment, including assets sold or classifiedas held for sale as of June 30, 2020.
For the Six Months Ended June 30,(Decrease) Increase
to Segment NOI 2020 2019 $ % (Dollars in thousands)
Segment NOI—Triple-Net Leased Properties: Rental income $ 371,102 $ 396,450 $ (25,348) (6.4)%Less: Property-level operating expenses (11,606) (13,754) 2,148 15.6
Segment NOI $ 359,496 $ 382,696 (23,200) (6.1)
nm - not meaningful
The decrease in our triple-net leased properties segment NOI for the six months ended June 30, 2020 over the same period in 2019 is attributableprimarily to the the write-off of previously accrued straight-line rental income during the second quarter of 2020 of $53.3 million (non-Holiday assets) andthe transition of 26 independent living assets at the start of the second
48

quarter 2020 operated by Holiday from our triple-net portfolio to our senior housing operating portfolio, partially offset by the $50.2 million impact ofterminating the Holiday Lease. We will continue to try to collect rent on a contractual basis for the tenants where straight-line rent has been written off, butwe have determined that collectability as not probable due to COVID-19.
The following table compares results of operations for our 373 same-store triple-net leased properties.
For the Six Months Ended June 30,Increase (Decrease)
to Segment NOI 2020 2019 $ % (Dollars in thousands)
Same-Store Segment NOI—Triple-Net Leased Properties: Rental income $ 298,501 $ 346,357 $ (47,856) (13.8)%Less: Property-level operating expenses (10,018) (10,494) 476 (4.5)
Segment NOI $ 288,483 $ 335,863 (47,380) (14.1)
nm - not meaningful
The decrease in our same-store triple-net leased properties rental income for the six months ended June 30, 2020 over the same period in 2019 isattributable primarily to the write-off of previously accrued straight-line rental income of $53.3 million during the second quarter of 2020 offset by rentincreases due to contractual escalations pursuant to the terms of our leases. We will continue to try to collect rent on a contractual basis for the tenantswhere straight-line rent has been written off, but we have determined that collectability is not probable due to COVID-19.
Segment NOI—Senior Living Operations
The following table summarizes results of operations in our senior living operations reportable business segment, including assets sold or classified asheld for sale as of June 30, 2020.
For the Six Months Ended June 30,Increase (Decrease)
to Segment NOI 2020 2019 $ % (Dollars in thousands)
Segment NOI—Senior Living Operations: Resident fees and services $ 1,126,099 $ 1,042,172 $ 83,927 8.1 %Less: Property-level operating expenses (842,709) (727,823) (114,886) (15.8)
Segment NOI $ 283,390 $ 314,349 (30,959) (9.8)
Number of Properties at June 30,Average Unit Occupancy For the Six
Months Ended June 30,
Average Monthly Revenue PerOccupied Room For the Six Months
Ended June 30, 2020 2019 2020 2019 2020 2019
Total communities 428 367 84.3 % 86.1 % $ 4,862 $ 5,785
The decrease in our senior living operations segment NOI was primarily attributable to lower occupancy and increased operating costs resulting fromthe COVID-19 pandemic. This is offset by the transition of 26 independent living assets at the start of the second quarter 2020 operated by Holiday fromour triple-net portfolio to our senior housing operating portfolio and the third quarter 2019 acquisition of 34 Canadian senior housing communities via anequity partnership with Le Groupe Maurice.
49

The following table compares results of operations for our 335 same-store senior living operating communities.
For the Six Months Ended June 30,Decrease
to Segment NOI 2020 2019 $ % (Dollars in thousands)
Same-Store Segment NOI—Senior Living Operations: Resident fees and services $ 945,802 $ 987,465 $ (41,663) (4.2)%Less: Property-level operating expenses (718,070) (678,824) (39,246) (5.8)
Segment NOI $ 227,732 $ 308,641 (80,909) (26.2)
Number of Properties at June 30,Average Unit Occupancy For the Six
Months Ended June 30,
Average Monthly Revenue PerOccupied Room For the Six Months
Ended June 30, 2020 2019 2020 2019 2020 2019
Same-store communities 335 335 82.7 % 87.2 % $ 6,382 $ 6,724
The decrease in our same-store senior living operations segment NOI was primarily attributable to lower occupancy rates and increased operatingcosts resulting from the COVID-19 pandemic.
Segment NOI—Office Operations
The following table summarizes results of operations in our office operations reportable business segment, including assets sold or classified as heldfor sale as of June 30, 2020.
For the Six Months Ended June 30,(Decrease) Increase
to Segment NOI 2020 2019 $ % (Dollars in thousands)
Segment NOI—Office Operations: Rental income $ 401,320 $ 403,616 $ (2,296) (0.6)%Office building services revenue 4,432 3,626 806 22.2
Total revenues 405,752 407,242 (1,490) (0.4) Less:
Property-level operating expenses (125,258) (124,828) (430) (0.3) Office building services costs (1,270) (1,148) (122) (10.6)
Segment NOI $ 279,224 $ 281,266 (2,042) (0.7)
Number of Properties at June 30, Occupancy at June 30,
Annualized Average Rent PerOccupied Square Foot For the Six
Months Ended June 30, 2020 2019 2020 2019 2020 2019
Total office buildings 377 385 90.4 % 89.8 % $ 33 $ 33
The decrease in our office operations segment NOI for the six months ended June 30, 2020 over the same period in 2019 is attributable primarily to
first quarter 2020 assets sold to the Fund, COVID-impacted reduced parking revenues partially offset by active leasing at recently developed properties,increased tenant retention, contractual rent escalators, acquisitions and business interruption insurance proceeds.
50

The following table compares results of operations for our 359 same-store office buildings.
For the Six Months Ended June 30,Increase (Decrease)
to Segment NOI 2020 2019 $ % (Dollars in thousands)
Same-Store Segment NOI—Office Operations: Rental income $ 371,107 $ 364,315 $ 6,792 1.9 %Less: Property-level operating expenses (115,456) (114,522) (934) (0.8)
Segment NOI $ 255,651 $ 249,793 5,858 2.3
Number of Properties at June 30, OccupancyJune 30,
Annualized Average Rent PerOccupied Square Foot For the Six
Months Ended June 30, 2020 2019 2020 2019 2020 2019
Same-store office buildings 359 359 91.7 % 90.7 % $ 33 $ 33
The increase in our same-store office operations segment NOI for the six months ended June 30, 2020 over the same period in 2019 is primarilydue to strong tenant retention, contractual rent escalators and increasing occupancy.
All Other
The $7.7 million increase in all other segment NOI for the six months ended June 30, 2020 over the same period in 2019 is primarily due to increasedinterest income from our secured mortgage loan portfolio as well as increased management fee revenues from investments in unconsolidated real estateentities.
Interest and Other Income
The $3.1 million decrease in interest and other income for the six months ended June 30, 2020 over the same period in 2019 is primarily due to2019 income from the exercise of warrants related to our research and innovation properties offset by a 2020 reduction of a liability related to anacquisition and interest income on short term investments.
Interest Expense
The $18.8 million increase in total interest expense for the six months ended June 30, 2020 over the same period in 2019 is attributable to anincrease of $44.8 million due to higher debt balances, offset by a decrease of $26.6 million due to a lower effective interest rate and increased capitalizedinterest. Our weighted average effective interest rate was 3.5% and 3.9% for the six months ended June 30, 2020 and 2019, respectively. Capitalizedinterest for the six months ended June 30, 2020 and 2019 was $5.6 million and $4.0 million, respectively.
Depreciation and Amortization
The $136.3 million increase in depreciation and amortization expense during the six months ended June 30, 2020 compared to the same period in2019, is primarily due to an increase in real estate impairments during 2020 and asset acquisitions, net of dispositions. See “COVID-19 Update” forinformation regarding 2020 impairment charges.
Merger-Related Expenses and Deal Costs
The $8.0 million decrease in merger-related expenses and deal costs for the six months ended June 30, 2020 over the same period in 2019 was dueprimarily due to 2020 expenses related to severance and operator transitions offset by 2019 expenses relating to operator transitions.
51

Other
The $18.5 million change in other for the six months ended June 30, 2020 over the same period in 2019 is primarily due to insurance recoveriesreceived in 2019 related to natural disasters and increased corporate-level insurance costs in 2020.
Loss from Unconsolidated Entities
The $13.3 million increase in loss from unconsolidated entities for the six months ended June 30, 2020 over the same period in 2019 is due to animpairment of our investment in an unconsolidated operating entity and our share of operating results from our unconsolidated entities. See “COVID-19Update” for information regarding 2020 impairment charges.
Gain on Real Estate Dispositions
The $202.9 million increase in gain on real estate dispositions to $227.5 million for the six months ended June 30, 2020 over the same period in 2019is due primarily to our contribution of six properties to the Fund.
Income Tax Benefit
The $33.7 million increase in income tax benefit related to continuing operations for the six months ended June 30, 2020 compared to the same periodin 2019 is primarily due to a $152.9 million deferred tax benefit related to the internal restructuring of certain US taxable REIT subsidiaries completedwithin the first quarter of 2020, offset by changes in the valuation allowance against deferred tax assets of certain of our TRS entities. The benefit resultedfrom the transfer of assets subject to certain deferred tax liabilities from taxable REIT subsidiaries to the entities other than the TRS entities in this tax-freetransaction.
Non-GAAP Financial Measures
We consider certain non-GAAP financial measures to be useful supplemental measures of our operating performance. A non-GAAP financial measureis a measure of historical or future financial performance, financial position or cash flows that excludes or includes amounts that are not so excluded fromor included in the most directly comparable measure calculated and presented in accordance with GAAP. Described below are the non-GAAP financialmeasures used by management to evaluate our operating performance and that we consider most useful to investors, together with reconciliations of thesemeasures to the most directly comparable GAAP measures.
The non-GAAP financial measures we present in this Quarterly Report on Form 10-Q may not be comparable to those presented by other real estatecompanies due to the fact that not all real estate companies use the same definitions. You should not consider these measures as alternatives to net incomeattributable to common stockholders (determined in accordance with GAAP) as indicators of our financial performance or as alternatives to cash flow fromoperating activities (determined in accordance with GAAP) as measures of our liquidity, nor are these measures necessarily indicative of sufficient cashflow to fund all of our needs. In order to facilitate a clear understanding of our consolidated historical operating results, you should examine these measuresin conjunction with net income attributable to common stockholders as presented in our Consolidated Financial Statements and other financial dataincluded elsewhere in this Quarterly Report on Form 10-Q.
Funds From Operations and Normalized Funds From Operations
Historical cost accounting for real estate assets implicitly assumes that the value of real estate assets diminishes predictably over time. However, sincereal estate values historically have risen or fallen with market conditions, many industry investors deem presentations of operating results for real estatecompanies that use historical cost accounting to be insufficient by themselves. For that reason, we consider Funds From Operations (“FFO”) andnormalized FFO to be appropriate supplemental measures of operating performance of an equity REIT. In particular, we believe that normalized FFO isuseful because it allows investors, analysts and our management to compare our operating performance to the operating performance of other real estatecompanies and between periods on a consistent basis without having to account for differences caused by non-recurring items and other non-operationalevents such as transactions and litigation. In some cases, we provide information about identified non-cash components of FFO and normalized FFObecause it allows investors, analysts and our management to assess the impact of those items on our financial results.
We use the National Association of Real Estate Investment Trusts (“Nareit”) definition of FFO. Nareit defines FFO as net income attributable tocommon stockholders (computed in accordance with GAAP), excluding gains or losses from sales of real estate property, including gains or losses on re-measurement of equity method investments, and impairment write-downs of depreciable real estate, plus real estate depreciation and amortization, and afteradjustments for unconsolidated partnerships and joint ventures. Adjustments for unconsolidated partnerships and joint ventures will be calculated to reflectFFO on the same
52

basis. We define normalized FFO as FFO excluding the following income and expense items (which may be recurring in nature): (a) merger-related costsand expenses, including amortization of intangibles, transition and integration expenses, and deal costs and expenses, including expenses and recoveriesrelating to acquisition lawsuits; (b) the impact of any expenses related to asset impairment and valuation allowances, the write-off of unamortized deferredfinancing fees, or additional costs, expenses, discounts, make-whole payments, penalties or premiums incurred as a result of early retirement or payment ofour debt; (c) the non-cash effect of income tax benefits or expenses, the non-cash impact of changes to our executive equity compensation plan, derivativetransactions that have non-cash mark-to-market impacts on our Consolidated Statements of Income and non-cash charges related to leases; (d) the financialimpact of contingent consideration, severance-related costs and charitable donations made to the Ventas Charitable Foundation; (e) gains and losses fornon-operational foreign currency hedge agreements and changes in the fair value of financial instruments; (f) gains and losses on non-real estatedispositions and other unusual items related to unconsolidated entities; (g) expenses related to the re-audit and re-review in 2014 of our historical financialstatements and related matters; (h) net expenses or recoveries related to natural disasters and (i) any other incremental items set forth in the normalized FFOreconciliation included herein.
The following table summarizes our FFO and normalized FFO for the three and six months ended June 30, 2020 and 2019. The decrease innormalized FFO for the six months ended June 30, 2020 over the same period in 2019 is principally due to the impact of COVID-19 on our senior housingbusiness and increases in interest expense from incremental borrowings arising as a consequence of the impact of COVID-19, partially offset by thepositive impact of our third quarter 2019 acquisition of an interest in 34 Canadian senior housing communities via an equity partnership with Le GroupeMaurice. See “COVID-19 Update”.
For the Three Months Ended June
30, For the Six Months Ended June 30, 2020 2019 2020 2019
(In thousands)
Net (loss) income attributable to common stockholders $ (157,170) $ 210,529 $ 315,947 $ 336,314 Adjustments:
Real estate depreciation and amortization 348,110 224,630 595,440 459,101 Real estate depreciation related to noncontrolling interests (4,068) (1,750) (7,911) (3,584) Real estate depreciation related to unconsolidated entities 1,307 167 1,868 332 Gain on real estate dispositions related to unconsolidated entities — (2) — (801) (Loss) gain on real estate dispositions related to noncontrolling interests (3) — (9) 354 Gain on real estate dispositions (1,254) (19,150) (227,479) (24,597)
FFO attributable to common stockholders 186,922 414,424 677,856 767,119 Adjustments:
Change in fair value of financial instruments (13) (11) (23) (49) Non-cash income tax benefit (expense) 55,505 (59,480) (85,391) (61,194)
Loss on extinguishment of debt, net — 4,022 — 4,427 (Gain) loss on non-real estate dispositions related to unconsolidated entities — (3) 239 (3) Merger-related expenses, deal costs and re-audit costs 6,605 5,564 15,378 8,393 Amortization of other intangibles 118 121 236 242 Other items related to unconsolidated entities (263) 1,377 (1,138) 2,415 Non-cash impact of changes to equity plan (3,337) 2,584 3,558 4,918 Natural disaster expenses (recoveries), net 252 (13,339) 1,193 (14,878) Impact of Holiday lease termination (50,184) — (50,184) — Write-off of straightline rental income, net of noncontrolling interests 52,368 — 52,368 —
Allowance on loan investments and impairment of unconsolidated entities 40,320 — 40,320 —
Normalized FFO attributable to common stockholders $ 288,293 $ 355,259 $ 654,412 $ 711,390
53

Adjusted EBITDA
We consider Adjusted EBITDA an important supplemental measure because it provides another manner in which to evaluate our operatingperformance and serves as another indicator of our credit strength and our ability to service our debt obligations. We define Adjusted EBITDA asconsolidated earnings before interest, taxes, depreciation and amortization (including non-cash stock-based compensation expense, asset impairment andvaluation allowances), excluding gains or losses on extinguishment of debt, our consolidated joint venture partners’ share of EBITDA, merger-relatedexpenses and deal costs, expenses related to the re-audit and re-review in 2014 of our historical financial statements, net gains or losses on real estateactivity, gains or losses on re-measurement of equity interest upon acquisition, changes in the fair value of financial instruments, unrealized foreigncurrency gains or losses, net expenses or recoveries related to natural disasters and non-cash charges related to leases, and including our share of EBITDAfrom unconsolidated entities and adjustments for other immaterial or identified items. The following table sets forth a reconciliation of net (loss) incomeattributable to common stockholders to Adjusted EBITDA:
For the Three Months Ended June 30, For the Six Months Ended June 30,
2020 2019 2020 2019
(In thousands)
Net (loss) income attributable to common stockholders $ (157,170) $ 210,529 $ 315,947 $ 336,314 Adjustments:
Interest 123,132 110,369 239,828 220,988 Loss on extinguishment of debt, net — 4,022 — 4,427
Taxes (including tax amounts in general, administrative and professional fees) 57,500 (57,412) (90,207) (57,298)
Depreciation and amortization 349,594 226,187 598,431 462,107 Non-cash stock-based compensation expense 1,043 10,070 11,557 18,475 Merger-related expenses, deal costs and re-audit costs 6,586 4,600 14,804 6,791 Net income attributable to noncontrolling interests, adjusted for consolidated joint
venture partners’ share of EBITDA (5,639) (3,199) (11,737) (6,073) Loss from unconsolidated entities, adjusted for Ventas share of EBITDA from
unconsolidated entities 10,439 9,009 28,173 16,767 Gain on real estate dispositions (1,254) (19,150) (227,478) (24,597) Unrealized foreign currency gains (37) (265) (6) (692) Change in fair value of financial instruments (13) (14) (22) (67) Natural disaster expenses (recoveries), net 198 (13,308) 981 (14,957) Impact of Holiday lease termination (50,184) — (50,184) — Write-off of straightline rental income, net of noncontrolling interests 52,368 — 52,368 — Allowance on loan investments and impairment of unconsolidated entities 40,320 — 40,320 —
Adjusted EBITDA $ 426,883 $ 481,438 $ 922,775 $ 962,185
54

NOI
We also consider NOI an important supplemental measure because it allows investors, analysts and our management to assess our unlevered property-level operating results and to compare our operating results with those of other real estate companies and between periods on a consistent basis. We defineNOI as total revenues, less interest and other income, property-level operating expenses and office building services costs. Cash receipts may differ due tostraight-line recognition of certain rental income and the application of other GAAP policies. The following table sets forth a reconciliation of net (loss)income attributable to common stockholders to NOI:
For the Three Months Ended June 30, For the Six Months Ended June 30, 2020 2019 2020 2019 (In thousands)
Net (loss) income attributable to common stockholders $ (157,170) $ 210,529 $ 315,947 $ 336,314 Adjustments:
Interest and other income (1,540) (9,202) (6,393) (9,489) Interest 123,132 110,369 239,828 220,988 Depreciation and amortization 349,594 226,187 598,431 462,107 General, administrative and professional fees 29,984 43,079 72,519 83,839 Loss on extinguishment of debt, net — 4,022 — 4,427 Merger-related expenses and deal costs 6,586 4,600 14,804 6,780 Allowance on loans receivable and investments 29,655 — 29,655 — Other 3,382 (11,481) 7,090 (11,458) Net (loss) income attributable to noncontrolling interests (2,065) 1,369 (452) 3,172 Loss from unconsolidated entities 5,850 2,529 16,726 3,475 Income tax expense (benefit) 56,356 (57,752) (92,660) (59,009) Gain on real estate dispositions (1,254) (19,150) (227,479) (24,597)
NOI $ 442,510 $ 505,099 $ 968,016 $ 1,016,549
See “Results of Operations” for discussions regarding both segment NOI and same-store segment NOI. We define same-store as properties owned,consolidated and operational for the full period in both comparison periods and are not otherwise excluded; provided, however, that we may includeselected properties that otherwise meet the same-store criteria if they are included in substantially all of, but not a full, period for one or both of thecomparison periods, and in our judgment such inclusion provides a more meaningful presentation of our portfolio performance. Newly acquired or recentlydeveloped or redeveloped properties in our senior living operations segment will be included in same-store once they are stabilized for the full period inboth periods presented. These properties are considered stabilized upon the earlier of (a) the achievement of 80% sustained occupancy or (b) 24 monthsfrom the date of acquisition or substantial completion of work. Recently developed or redeveloped properties in our office operations and triple-net leasedproperties segments will be included in same-store once substantial completion of work has occurred for the full period in both periods presented. Oursenior living operations and triple-net leased properties that have undergone operator or business model transitions will be included in same-store onceoperating under consistent operating structures for the full period in both periods presented.
Properties are excluded from same-store if they are: (i) sold, classified as held for sale or properties whose operations were classified as discontinuedoperations in accordance with GAAP; (ii) impacted by materially disruptive events such as flood or fire; (iii) those properties that are currently undergoinga materially disruptive redevelopment; (iv) for our office operations, those properties for which management has an intention to institute a redevelopmentplan because the properties may require major property-level expenditures to maximize value, increase NOI, or maintain a market-competitive positionand/or achieve property stabilization; or (v) for the senior living operations and triple-net leased segments, those properties that are scheduled to undergooperator or business model transitions, or have transitioned operators or business models after the start of the prior comparison period.
To eliminate the impact of exchange rate movements, all same-store NOI measures assume constant exchange rates across comparable periods, usingthe following methodology: the current period’s results are shown in actual reported USD, while prior comparison period’s results are adjusted andconverted to USD based on the average exchange rate for the current period.
55

Liquidity and Capital Resources During the six months ended June 30, 2020, our principal sources of liquidity were cash flows from operations, proceeds from the issuance of debtsecurities, borrowings under our unsecured revolving credit facility, proceeds from asset sales and cash on hand.
For the next 12 months, our principal liquidity needs are to: (i) fund operating expenses; (ii) meet our debt service requirements; (iii) repay maturingmortgage and other debt; (iv) fund acquisitions, investments and commitments and any development and redevelopment activities; (v) fund capitalexpenditures; and (vi) make distributions to our stockholders and unitholders, as required for us to continue to qualify as a REIT. We expect that theseliquidity needs generally will be satisfied by a combination of the following: cash flows from operations, cash on hand, debt assumptions and financings(including secured financings), issuances of debt and equity securities, dispositions of assets (in whole or in part through joint venture arrangements withthird parties) and borrowings under our revolving credit facilities and commercial paper program. However, an inability to access liquidity through multiplecapital sources concurrently could have a Material Adverse Effect on us. In addition, while continuing decreased revenue and net operating income as aresult of the COVID-19 pandemic could lead to downgrades of our long-term credit rating and therefore adversely impact our cost of borrowing, wecurrently believe we will continue to have access to one or more debt markets during the duration of the pandemic and could seek to enter into secured debtfinancings or issue debt and equity securities to satisfy our liquidity needs, although no assurances can be made in this regard. See “COVID-19 Update.”
Recent Capital Conservation Actions
In June 2020, our Board of Directors declared a second quarter 2020 dividend of $0.45 per share, which was paid in July and represented a 43percent reduction from the first quarter dividend of $0.7925 per share. This measure enabled us to conserve approximately $130 million of cash per quartercompared to the prior dividend level. In order to further conserve capital, we have reduced expected capital expenditures for 2020 by $0.3 billion to a newexpected total of $0.5 billion, mainly through pausing certain ground-up developments that were not yet substantially underway. Also, in June, weeliminated roles representing over 25% of our corporate positions, excluding onsite field personnel. For the second half of 2020, the base salaries of ourCEO and other executive officers was voluntarily reduced by 20% and 10%, respectively. As a result of these capital conservation actions, we expect thatour third quarter 2020 annualized general and administrative expenses will be approximately $25 to $30 million lower than our reported general andadministrative expenses for full-year 2019.
See “Note 9 - Senior Notes Payable And Other Debt” of the Notes to Consolidated Financial Statements included in Part I, Item 1 of this QuarterlyReport on Form 10-Q for further information regarding our significant financing activities.
Credit Facilities, Commercial Paper and Unsecured Term Loans
Our unsecured credit facility is comprised of a $3.0 billion unsecured revolving credit facility priced at LIBOR plus 0.875% as of June 30, 2020. Theunsecured revolving credit facility matures in April 2021, but may be extended at our option subject to the satisfaction of certain conditions, including allrepresentations and warranties being correct in all material respects with no existing defaults, for two additional periods of six months each to April 2022.The unsecured revolving credit facility also includes an accordion feature that permits us to increase our aggregate borrowing capacity thereunder to up to$3.75 billion.
Our wholly-owned subsidiary, Ventas Realty, may issue from time to time unsecured commercial paper notes up to a maximum aggregate amountoutstanding at any time of $1.0 billion. The notes are sold under customary terms in the United States commercial paper note market and are ranked paripassu with all of Ventas Realty’s other unsecured senior indebtedness. The notes are fully and unconditionally guaranteed by Ventas, Inc. As of June 30,2020, we had no borrowings outstanding under our commercial paper program.
As of June 30, 2020, $587.2 million was outstanding under the unsecured revolving credit facility with an additional $23.9 million restricted tosupport outstanding letters of credit. In addition, we limit our utilization of the unsecured revolving credit facility, to the extent necessary, to support ourcommercial paper program when commercial paper notes are outstanding. We had $2.4 billion in available liquidity under the unsecured revolving creditfacility as of June 30, 2020.
As of June 30, 2020, we had a $200.0 million unsecured term loan priced at LIBOR plus 0.90% that matures in 2023. The term loan also includes anaccordion feature that effectively permits us to increase our aggregate borrowings thereunder to up to $800.0 million.
56
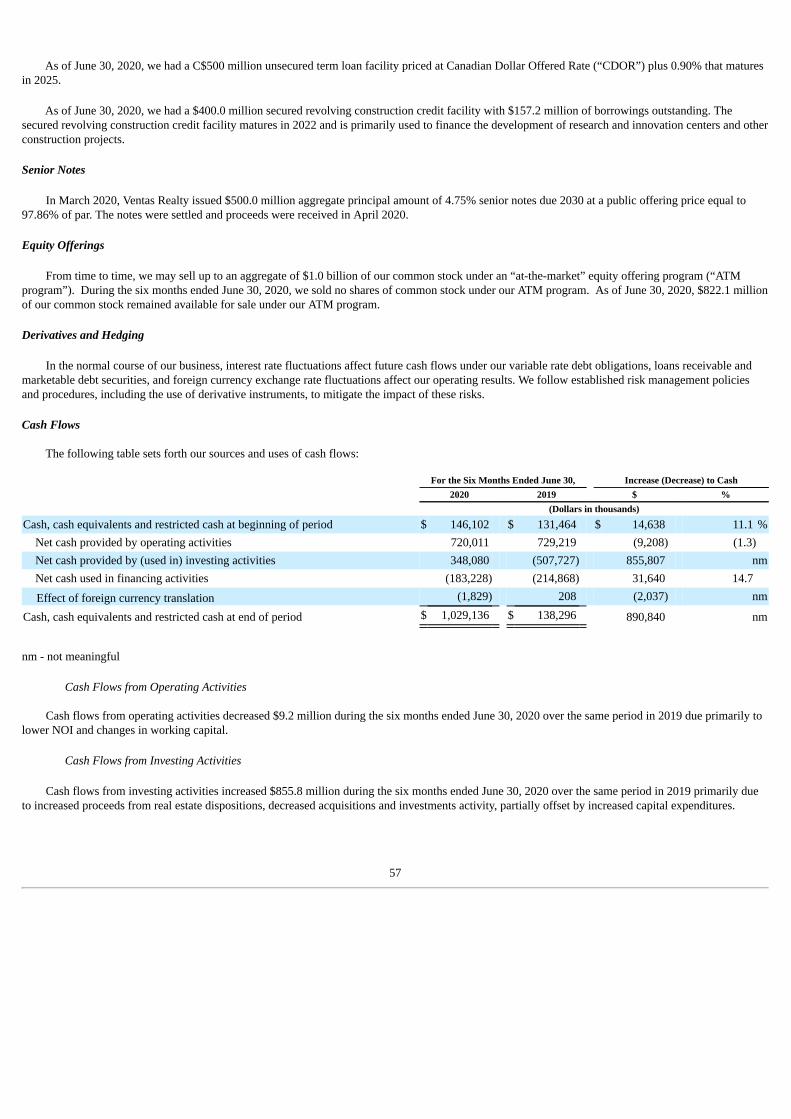
As of June 30, 2020, we had a C$500 million unsecured term loan facility priced at Canadian Dollar Offered Rate (“CDOR”) plus 0.90% that maturesin 2025.
As of June 30, 2020, we had a $400.0 million secured revolving construction credit facility with $157.2 million of borrowings outstanding. Thesecured revolving construction credit facility matures in 2022 and is primarily used to finance the development of research and innovation centers and otherconstruction projects.
Senior Notes
In March 2020, Ventas Realty issued $500.0 million aggregate principal amount of 4.75% senior notes due 2030 at a public offering price equal to97.86% of par. The notes were settled and proceeds were received in April 2020.
Equity Offerings
From time to time, we may sell up to an aggregate of $1.0 billion of our common stock under an “at-the-market” equity offering program (“ATMprogram”). During the six months ended June 30, 2020, we sold no shares of common stock under our ATM program. As of June 30, 2020, $822.1 millionof our common stock remained available for sale under our ATM program.
Derivatives and Hedging
In the normal course of our business, interest rate fluctuations affect future cash flows under our variable rate debt obligations, loans receivable andmarketable debt securities, and foreign currency exchange rate fluctuations affect our operating results. We follow established risk management policiesand procedures, including the use of derivative instruments, to mitigate the impact of these risks.
Cash Flows The following table sets forth our sources and uses of cash flows:
For the Six Months Ended June 30, Increase (Decrease) to Cash 2020 2019 $ % (Dollars in thousands)
Cash, cash equivalents and restricted cash at beginning of period $ 146,102 $ 131,464 $ 14,638 11.1 %Net cash provided by operating activities 720,011 729,219 (9,208) (1.3) Net cash provided by (used in) investing activities 348,080 (507,727) 855,807 nmNet cash used in financing activities (183,228) (214,868) 31,640 14.7
Effect of foreign currency translation (1,829) 208 (2,037) nm
Cash, cash equivalents and restricted cash at end of period $ 1,029,136 $ 138,296 890,840 nm
nm - not meaningful
Cash Flows from Operating Activities
Cash flows from operating activities decreased $9.2 million during the six months ended June 30, 2020 over the same period in 2019 due primarily tolower NOI and changes in working capital.
Cash Flows from Investing Activities
Cash flows from investing activities increased $855.8 million during the six months ended June 30, 2020 over the same period in 2019 primarily dueto increased proceeds from real estate dispositions, decreased acquisitions and investments activity, partially offset by increased capital expenditures.
57

Cash Flows from Financing Activities
Cash flows used in financing activities increased $31.6 million during the six months ended June 30, 2020 over the same period in 2019 primarily dueto lower debt repayments during 2020 offset by the issuance of common stock in 2019.
Capital Expenditures
The terms of our triple-net leases generally obligate our tenants to pay all capital expenditures necessary to maintain and improve our triple-net leasedproperties. However, from time to time, we may fund the capital expenditures for our triple-net leased properties through loans or advances to the tenants,which may increase the amount of rent payable with respect to the properties in certain cases. We may also fund capital expenditures for which we maybecome responsible upon expiration of our triple-net leases or in the event that our tenants are unable or unwilling to meet their obligations under thoseleases. We also expect to fund capital expenditures related to our senior living operations and office operations reportable business segments with the cashflows from the properties or through additional borrowings. We expect that these liquidity needs generally will be satisfied by a combination of thefollowing: cash flows from operations, cash on hand, debt assumptions and financings (including secured financings), issuances of debt and equitysecurities, dispositions of assets (in whole or in part through joint venture arrangements with third parties) and borrowings under our revolving creditfacilities.
To the extent that unanticipated capital expenditure needs arise or significant borrowings are required, our liquidity may be affected adversely. Ourability to borrow additional funds may be restricted in certain circumstances by the terms of the instruments governing our outstanding indebtedness.
We are party to certain agreements that obligate us to develop senior housing or healthcare properties funded through capital that we and, in certaincircumstances, our joint venture partners provide. As of June 30, 2020, we had 20 properties under development pursuant to these agreements, includingtwo properties that are owned by unconsolidated real estate entities. In addition, from time to time, we engage in redevelopment projects with respect to ourexisting senior housing communities to maximize the value, increase NOI, maintain a market-competitive position, achieve property stabilization or changethe primary use of the property.
Guarantor and Issuer Financial Information
Ventas, Inc. has fully and unconditionally guaranteed the obligation to pay principal and interest with respect to the outstanding senior notes issued byour 100% owned subsidiary, Ventas Realty, including the senior notes that were jointly issued with Ventas Capital Corporation. Ventas Capital Corporationis a direct 100% owned subsidiary of Ventas Realty that has no assets or operations, but was formed in 2002 solely to facilitate offerings of senior notes bya limited partnership. None of our other subsidiaries (excluding Ventas Realty and Ventas Capital Corporation) is obligated with respect to Ventas Realty’soutstanding senior notes.
Ventas, Inc. has also fully and unconditionally guaranteed the obligation to pay principal and interest with respect to the outstanding senior notesissued by our 100% owned subsidiary, Ventas Canada Finance Limited (“Ventas Canada”). None of our other subsidiaries is obligated with respect toVentas Canada’s outstanding senior notes, all of which were issued on a private placement basis in Canada.
In connection with the acquisition of Nationwide Health Properties, Inc. (“NHP”), our 100% owned subsidiary, Nationwide Health Properties, LLC(“NHP LLC”), as successor to NHP, assumed the obligation to pay principal and interest with respect to the outstanding senior notes issued by NHP.Neither we nor any of our subsidiaries (other than NHP LLC) is obligated with respect to any of NHP LLC’s outstanding senior notes.
Under certain circumstances, contractual and legal restrictions, including those contained in the instruments governing our subsidiaries’ outstandingmortgage indebtedness, may restrict our ability to obtain cash from our subsidiaries for the purpose of meeting our debt service obligations, including ourpayment guarantees with respect to Ventas Realty’s and Ventas Canada’s senior notes.
58

The following summarizes our guarantor and issuer balance sheet and statement of income information as of June 30, 2020 and December 31, 2019and for the three and six months ended June 30, 2020 and the year ended December 31, 2019.
Balance Sheet Information
As of June 30, 2020Guarantor Issuer
(In thousands)Assets Investment in and advances to affiliates $ 16,095,449 $ 2,728,110 Total assets 17,005,493 2,835,587 Liabilities and equity Intercompany loans 10,509,659 (5,414,735) Total liabilities 10,773,108 3,472,417 Redeemable OP unitholder and noncontrolling interests 112,843 — Total equity (deficit) 6,159,542 (636,831) Total liabilities and equity 17,005,493 2,835,587
Balance Sheet Information
As of December 31, 2019Guarantor Issuer
(In thousands)Assets Investment in and advances to affiliates $ 15,774,897 $ 2,728,110 Total assets 15,875,910 2,838,270 Liabilities and equity Intercompany loans 8,789,600 (5,105,070) Total liabilities 9,133,733 3,363,067
Redeemable OP unitholder and noncontrolling interests 102,657 — Total equity (deficit) 6,639,520 (524,797) Total liabilities and equity 15,875,910 2,838,270
Statement of Income Information
For the Six Months Ended June 30, 2020Guarantor Issuer
(In thousands)Equity earnings in affiliates $ 357,163 $ — Total revenues 360,712 71,847
Income (loss) before unconsolidated entities, real estate dispositions, income taxes andnoncontrolling interests 316,674 (105,994)
Net income (loss) 315,947 (105,994) Net income (loss) attributable to common stockholders 315,947 (105,994)
59

Statement of Income Information
For the Year Ended December 31, 2019Guarantor Issuer
(In thousands)Equity earnings in affiliates $ 362,143 $ — Total revenues 366,243 142,754
Income (loss) before unconsolidated entities, real estate dispositions, income taxes andnoncontrolling interests 432,020 (246,929)
Net income (loss) 433,016 (246,841) Net income (loss) attributable to common stockholders 433,016 (246,841)
ITEM 3. QUANTITATIVE AND QUALITATIVE DISCLOSURES ABOUT MARKET RISK
The following discussion of our exposure to various market risks contains forward-looking statements that involve risks and uncertainties. Theseprojected results have been prepared utilizing certain assumptions considered reasonable in light of information currently available to us. Nevertheless,because of the inherent unpredictability of interest rates and other factors, actual results could differ materially from those projected in such forward-looking information.
We are exposed to market risk related to changes in interest rates with respect to borrowings under our unsecured revolving credit facility and ourunsecured term loans, certain of our mortgage loans that are floating rate obligations, mortgage loans receivable that bear interest at floating rates andavailable for sale securities. These market risks result primarily from changes in LIBOR rates or prime rates. To manage these risks, we continuouslymonitor our level of floating rate debt with respect to total debt and other factors, including our assessment of current and future economic conditions.
As of June 30, 2020 and December 31, 2019, the fair value of our secured and non-mortgage loans receivable, based on our estimates of currentlyprevailing rates for comparable loans, was $544.4 million and $710.5 million, respectively.
The fair value of our fixed and variable rate debt is based on current interest rates at which we could obtain similar borrowings. For fixed rate debt,interest rate fluctuations generally affect the fair value, but not our earnings or cash flows. Therefore, interest rate risk does not have a significant impact onour fixed rate debt obligations until their maturity or earlier prepayment and refinancing. If interest rates have risen at the time we seek to refinance ourfixed rate debt, whether at maturity or otherwise, our future earnings and cash flows could be adversely affected by additional borrowing costs. Conversely,lower interest rates at the time of refinancing may reduce our overall borrowing costs.
To highlight the sensitivity of our fixed rate debt to changes in interest rates, the following summary shows the effects of a hypothetical instantaneouschange of 100 basis points in interest rates:
As of June 30, 2020 As of December 31, 2019 (In thousands)
Gross book value $ 10,838,551 $ 10,270,402 Fair value 11,314,953 10,784,441 Fair value reflecting change in interest rates: -100 basis points 11,974,871 11,438,507 +100 basis points 10,726,942 10,196,943
The change in our fixed rate debt from December 31, 2019 to June 30, 2020 was due primarily to the issuance of senior notes in 2020.
60

The table below sets forth certain information with respect to our debt, excluding premiums and discounts.
As of June 30, 2020 As of December 31, 2019 As of June 30, 2019 (Dollars in thousands)
Balance: Fixed rate:
Senior notes $ 9,038,264 $ 8,584,056 $ 8,422,854 Unsecured term loans 200,000 200,000 200,000 Secured revolving construction credit facility 157,156 160,492 123,223 Mortgage loans and other 1,443,131 1,325,854 744,665
Variable rate:Senior notes 221,027 231,018 — Unsecured revolving credit facility 587,206 120,787 227,323 Unsecured term loans 368,378 385,030 — Commercial paper notes — 567,450 270,000 Mortgage loans and other 613,155 671,115 358,838
Total $ 12,628,317 $ 12,245,802 $ 10,346,903
Percentage of total debt: Fixed rate:
Senior notes 71.6 % 70.1 % 81.4 %Unsecured term loans 1.6 1.6 1.9 Secured revolving construction credit facility 1.2 1.3 1.2 Mortgage loans and other 11.4 10.8 7.2
Variable rate:Senior notes 1.8 1.9 — Unsecured revolving credit facility 4.6 1.0 2.2 Unsecured term loans 2.9 3.1 — Commercial paper notes — 4.7 2.6 Mortgage loans and other 4.9 5.5 3.5
Total 100.0 % 100.0 % 100.0 %
Weighted average interest rate at end of period: Fixed rate:
Senior notes 3.7 % 3.7 % 3.8 %Unsecured term loans 2.0 2.0 2.0 Secured revolving construction credit facility 4.5 4.5 4.5 Mortgage loans and other 3.7 3.7 4.4
Variable rate:Senior notes 1.2 2.5 — Unsecured revolving credit facility 1.0 2.4 3.0 Unsecured term loans 1.4 2.9 — Commercial paper notes — 2.0 2.6 Mortgage loans and other 2.0 3.4 3.4 Total 3.4 3.5 3.7
The variable rate debt in the table above reflects, in part, the effect of $147.5 million notional amount of interest rate swaps with maturities rangingfrom March 2022 to May 2022, in each case that effectively convert fixed rate debt to variable rate debt. In addition, the fixed rate debt in the table abovereflects, in part, the effect of $507.3 million and C$147.3 million notional amount of interest rate swaps with maturities ranging from August 2020 toDecember 2029 in each case that effectively convert variable rate debt to fixed rate debt.
61

The decrease in our outstanding variable rate debt at June 30, 2020 compared to December 31, 2019 is primarily attributable to by repayments of ourcommercial paper program, partially offset by borrowings under our unsecured revolving credit facility.
Assuming a 100 basis point increase in the weighted average interest rate related to our variable rate debt and assuming no change in our variable ratedebt outstanding as of June 30, 2020, interest expense on an annualized basis would increase by approximately $17.0 million, or $0.05 per diluted commonshare.
As of June 30, 2020 and December 31, 2019, our joint venture partners’ aggregate share of total debt was $257.0 million and $228.2 million,respectively, with respect to certain properties we owned through consolidated joint ventures. Total debt does not include our portion of debt related toinvestments in unconsolidated entities, which was $116.7 million and $60.6 million as of June 30, 2020 and December 31, 2019, respectively. As a result of our Canadian and United Kingdom operations, we are subject to fluctuations in certain foreign currency exchange rates that may, fromtime to time, affect our financial condition and operating performance. Based solely on our results for the six months ended June 30, 2020 (including theimpact of existing hedging arrangements), if the value of the U.S. dollar relative to the British pound and Canadian dollar were to increase or decrease byone standard deviation compared to the average exchange rate during the year, our normalized FFO per share for the three and six months ended June 30,2020 would decrease or increase, as applicable, by less than $0.01 per share or 1%. We will continue to mitigate these risks through a layered approach tohedging looking out for the next year and continual assessment of our foreign operational capital structure. Nevertheless, we cannot assure you that anysuch fluctuations will not have an effect on our earnings.
ITEM 4. CONTROLS AND PROCEDURES
Evaluation of Disclosure Controls and Procedures
As required by Rules 13a-15(b) and 15d-15(b) of the Securities Exchange Act of 1934, as amended (the “Exchange Act”), our management, with theparticipation of our Chief Executive Officer and Chief Financial Officer, has evaluated the effectiveness of our disclosure controls and procedures as ofJune 30, 2020. Based on that evaluation, our Chief Executive Officer and Chief Financial Officer concluded that our disclosure controls and procedures (asdefined in Rules 13a-15(e) and 15d-15(e) under the Exchange Act) were effective as of June 30, 2020, at the reasonable assurance level.
Internal Control Over Financial Reporting There have been no changes in our internal controls over financial reporting during the second quarter of 2020 (as defined in Rules 13a-15(f) and 15d-15(f) under the Exchange Act) that have materially affected, or are reasonably likely to materially affect, our internal control over financial reporting.
62

PART II—OTHER INFORMATION
ITEM 1. LEGAL PROCEEDINGS
The information contained in “Note 11 - Litigation” of the Notes to Consolidated Financial Statements included in Part I, Item 1 of this QuarterlyReport on Form 10-Q is incorporated by reference into this Item 1. Except as set forth therein, there have been no new material legal proceedings and nomaterial developments in the legal proceedings reported in our Annual Report on Form 10-K for the year ended December 31, 2019.
ITEM 2. UNREGISTERED SALES OF EQUITY SECURITIES AND USE OF PROCEEDS
Issuer Purchases of Equity Securities
We do not have a publicly announced repurchase plan or program in effect. The table below summarizes other repurchases of our common stock madeduring the quarter ended June 30, 2020.
Number of SharesRepurchased (1)
Average PricePer Share
April 1 through April 30 1,803 $ 31.97 May 1 through May 31 — — June 1 through June 30 4,517 35.51
(1) Repurchases represent shares withheld to pay taxes on the vesting of restricted stock granted to employees under our 2006 Incentive Plan or 2012Incentive Plan or restricted stock units granted to employees under the Nationwide Health Properties, Inc. (“NHP”) 2005 Performance IncentivePlan and assumed by us in connection with our acquisition of NHP. The value of the shares withheld is the closing price of our common stock onthe date the vesting or exercise occurred (or, if not a trading day, the immediately preceding trading day) or the fair market value of our commonstock at the time of exercise, as the case may be.
ITEM 5. OTHER INFORMATION
Not applicable.
63

ITEM 6. EXHIBITS
The exhibits required by Item 601 of Regulation S-K which are filed with this report are listed below.
ExhibitNumber Description of Document Location of Document
4.1 Description of Securities Filed herewith.22 List of Guarantors and Issuers of Guaranteed Securities Filed herewith.
31.1 Certification of Debra A. Cafaro, Chairman and Chief Executive Officer, pursuant to Rule 13a-14(a) under the Securities Exchange Act of 1934, as amended.
Filed herewith.
31.2 Certification of Robert F. Probst, Executive Vice President and Chief Financial Officer, pursuant toRule 13a-14(a) under the Securities Exchange Act of 1934, as amended.
Filed herewith.
32.1 Certification of Debra A. Cafaro, Chairman and Chief Executive Officer, pursuant to Rule 13a-14(b) under the Securities Exchange Act of 1934, as amended, and 18 U.S.C. § 1350.
Filed herewith.
32.2 Certification of Robert F. Probst, Executive Vice President and Chief Financial Officer, pursuant toRule 13a-14(b) under the Securities Exchange Act of 1934, as amended, and 18 U.S.C. § 1350.
Filed herewith.
101.INS XBRL Instance Document - the instance document does not appear in the Interactive Data Filebecause its XBRL tags are embedded within the Inline XBRL document.
Filed herewith.
101.SCH Inline XBRL Taxonomy Extension Schema Document Filed herewith.101.CAL Inline XBRL Taxonomy Extension Calculation Linkbase Document Filed herewith.101.LAB Inline XBRL Taxonomy Extension Label Linkbase Document Filed herewith.101.PRE Inline XBRL Taxonomy Extension Presentation Linkbase Document Filed herewith.101.DEF Inline XBRL Taxonomy Extension Definition Linkbase Document Filed herewith.
64

SIGNATURES
Pursuant to the requirements of the Securities Exchange Act of 1934, as amended, the Registrant has duly caused this Report to be signed on its behalfby the undersigned, thereunto duly authorized.
Date: August 7, 2020
VENTAS, INC.
By: /s/ DEBRA A. CAFARODebra A. CafaroChairman and
Chief Executive Officer
By: /s/ ROBERT F. PROBSTRobert F. Probst
Executive Vice President andChief Financial Officer
65

Exhibit 4.1
DESCRIPTION OF THE REGISTRANT’S SECURITIESREGISTERED PURSUANT TO SECTION 12 OF THE
SECURITIES EXCHANGE ACT OF 1934
The following is a summary of the rights of Ventas, Inc.’s common stock, and of certain provisions of Ventas, Inc.'s Amended and RestatedCertificate of Incorporation, as amended (the "Certificate of Incorporation"), and Ventas, Inc.'s Fifth Amended and Restated Bylaws, asamended (the "Bylaws"), and certain provisions of applicable law. The following description is only a summary and does not purport to becomplete and is qualified by reference to the Certificate of Incorporation and the Bylaws, which are filed as exhibits to our Annual Report onForm 10-K for the year ended December 31, 2019. Unless the context requires otherwise, all references to “we”, “us” and “our” in thissection refer to Ventas, Inc.
GeneralThe Certificate of Incorporation authorizes Ventas, Inc. to issue up to 600,000,000 shares of its common stock, par value $0.25 per share.
As of August 4, 2020, 373,087,555 shares of Ventas, Inc. common stock were issued and outstanding.
All shares of common stock offered hereby, when issued, will be duly authorized, fully paid and nonassessable. Subject to thepreferential rights of any other shares of capital stock and to certain provisions of the Certificate of Incorporation, holders of shares ofVentas, Inc. common stock are entitled to receive distributions if, as and when authorized and declared by Ventas, Inc.'s Board of Directorsout of assets legally available therefor and to share ratably in our assets legally available for distribution to stockholders in the event of ourliquidation, dissolution or winding-up after payment of, or adequate provision for, all of our known debts and liabilities. We currently expectto continue to make quarterly distributions, and from time to time we may make additional distributions.
Holders of shares of Ventas, Inc. common stock are entitled to one vote per share on all matters on which the holders of common stockare entitled to vote. Holders of shares of Ventas, Inc. common stock have no conversion, sinking fund, redemption or preemptive rights.Subject to certain provisions of the Certificate of Incorporation, shares of Ventas, Inc. common stock have equal distribution, liquidation andother rights.Restrictions on Ownership and Transfer
In order to preserve its ability to maintain its REIT status, Ventas, Inc.'s Certificate of Incorporation provides that if a person acquiresbeneficial ownership of more than 9%, in number or value, of the outstanding shares of Ventas, Inc. common stock, the shares that arebeneficially owned in excess of such 9% limit are considered to be "excess shares." Excess shares are automatically deemed transferred to atrust for the benefit of a charitable institution or other qualifying organization selected by Ventas, Inc.'s Board of Directors. The trust isentitled to all dividends with respect to the excess shares and the trustee may exercise all voting power over the excess shares. Ventas, Inc.has the right to buy the excess shares for a purchase price equal to the lesser of (1) the price per share in the transaction that created theexcess shares, or (2) the market price on the date Ventas, Inc. buys the shares, and Ventas, Inc. may defer payment of the purchase price forup to five years. If Ventas, Inc. does not purchase the excess shares, the trustee of the trust is required to transfer the excess shares at thedirection of Ventas, Inc.'s Board of Directors. The owner of the excess shares is entitled to receive the lesser of the proceeds from the sale ofthe excess shares or the original purchase price for such excess shares, and any additional amounts are payable to the beneficiary of the trust.Ventas, Inc.'s Board of Directors may grant waivers from the excess share limitations.

Exhibit 22
List of Guarantors and Issuers of Guaranteed Securities
As of June 30, 2020, Ventas, Inc. is the guarantor of the outstanding guaranteed debt securities of its subsidiaries, as listed below.
Debt Instrument Issuer
Floating Rate Senior Notes, Series F due 2021 Ventas Canada Finance Limited3.25% Senior Notes due 2022 Ventas Realty, Limited Partnership and Ventas Capital Corporation3.30% Senior Notes, Series C due 2022 Ventas Canada Finance Limited3.125% Senior Notes due 2023 Ventas Realty, Limited Partnership3.10% Senior Notes due 2023 Ventas Realty, Limited Partnership2.55% Senior Notes, Series D due 2023 Ventas Canada Finance Limited3.50% Senior Notes due 2024 Ventas Realty, Limited Partnership3.75% Senior Notes due 2024 Ventas Realty, Limited Partnership4.125% Senior Notes, Series B due 2024 Ventas Canada Finance Limited2.80% Senior Notes, Series E due 2024 Ventas Canada Finance Limited3.50% Senior Notes due 2025 Ventas Realty, Limited Partnership2.65% Senior Notes due 2025 Ventas Realty, Limited Partnership4.125% Senior Notes due 2026 Ventas Realty, Limited Partnership3.25% Senior Notes due 2026 Ventas Realty, Limited Partnership3.85% Senior Notes due 2027 Ventas Realty, Limited Partnership4.00% Senior Notes due 2028 Ventas Realty, Limited Partnership4.40% Senior Notes due 2029 Ventas Realty, Limited Partnership3.00% Senior Notes due 2030 Ventas Realty, Limited Partnership
4.75% Senior Notes due 2030 Ventas Realty, Limited Partnership5.70% Senior Notes due 2043 Ventas Realty, Limited Partnership4.375% Senior Notes due 2045 Ventas Realty, Limited Partnership4.875% Senior Notes due 2049 Ventas Realty, Limited Partnership

Exhibit 31.1
I, Debra A. Cafaro, certify that:
1. I have reviewed this Quarterly Report on Form 10-Q of Ventas, Inc.;
2. Based on my knowledge, this report does not contain any untrue statement of a material fact or omit to state a material fact necessary to make thestatements made, in light of the circumstances under which such statements were made, not misleading with respect to the period covered by this report;
3. Based on my knowledge, the financial statements, and other financial information included in this report, fairly present in all material respects thefinancial condition, results of operations and cash flows of the registrant as of, and for, the periods presented in this report;
4. The registrant's other certifying officer(s) and I are responsible for establishing and maintaining disclosure controls and procedures (as defined inExchange Act Rules 13a-15(e) and 15d-15(e)) and internal control over financial reporting (as defined in Exchange Act Rules 13a-15(f) and 15d-15(f)) forthe registrant and have:
(a) Designed such disclosure controls and procedures, or caused such disclosure controls and procedures to be designed under our supervision, toensure that material information relating to the registrant, including its consolidated subsidiaries, is made known to us by others within thoseentities, particularly during the period in which this report is being prepared;
(b) Designed such internal control over financial reporting, or caused such internal control over financial reporting to be designed under oursupervision, to provide reasonable assurance regarding the reliability of financial reporting and the preparation of financial statements for externalpurposes in accordance with generally accepted accounting principles;
(c) Evaluated the effectiveness of the registrant's disclosure controls and procedures and presented in this report our conclusions about theeffectiveness of the disclosure controls and procedures, as of the end of the period covered by this report based on such evaluation; and
(d) Disclosed in this report, any change in the registrant's internal control over financial reporting that occurred during the registrant's most recentfiscal quarter (the registrant's fourth fiscal quarter in the case of an annual report) that has materially affected, or is reasonably likely to materiallyaffect, the registrant's internal control over financial reporting; and
5. The registrant's other certifying officer(s) and I have disclosed, based on our most recent evaluation of internal control over financial reporting, to theregistrant's auditors and the audit committee of the registrant's board of directors (or persons performing the equivalent functions):
(a) All significant deficiencies and material weaknesses in the design or operation of internal control over financial reporting, which are reasonablylikely to adversely affect the registrant's ability to record, process, summarize and report financial information; and
(b) Any fraud, whether or not material, that involves management or other employees who have a significant role in the registrant's internal controlover financial reporting.
Date: August 7, 2020
/s/ DEBRA A. CAFARODebra A. Cafaro Chairman and Chief Executive Officer

Exhibit 31.2
I, Robert F. Probst, certify that:
1. I have reviewed this Quarterly Report on Form 10-Q of Ventas, Inc.;
2. Based on my knowledge, this report does not contain any untrue statement of a material fact or omit to state a material fact necessary to make thestatements made, in light of the circumstances under which such statements were made, not misleading with respect to the period covered by this report;
3. Based on my knowledge, the financial statements, and other financial information included in this report, fairly present in all material respects thefinancial condition, results of operations and cash flows of the registrant as of, and for, the periods presented in this report;
4. The registrant's other certifying officer(s) and I are responsible for establishing and maintaining disclosure controls and procedures (as defined inExchange Act Rules 13a-15(e) and 15d-15(e)) and internal control over financial reporting (as defined in Exchange Act Rules 13a-15(f) and 15d-15(f)) forthe registrant and have:
(a) Designed such disclosure controls and procedures, or caused such disclosure controls and procedures to be designed under our supervision, toensure that material information relating to the registrant, including its consolidated subsidiaries, is made known to us by others within thoseentities, particularly during the period in which this report is being prepared;
(b) Designed such internal control over financial reporting, or caused such internal control over financial reporting to be designed under oursupervision, to provide reasonable assurance regarding the reliability of financial reporting and the preparation of financial statements for externalpurposes in accordance with generally accepted accounting principles;
(c) Evaluated the effectiveness of the registrant's disclosure controls and procedures and presented in this report our conclusions about theeffectiveness of the disclosure controls and procedures, as of the end of the period covered by this report based on such evaluation; and
(d) Disclosed in this report, any change in the registrant's internal control over financial reporting that occurred during the registrant's most recentfiscal quarter (the registrant's fourth fiscal quarter in the case of an annual report) that has materially affected, or is reasonably likely to materiallyaffect, the registrant's internal control over financial reporting; and
5. The registrant's other certifying officer(s) and I have disclosed, based on our most recent evaluation of internal control over financial reporting, to theregistrant's auditors and the audit committee of the registrant's board of directors (or persons performing the equivalent functions):
(a) All significant deficiencies and material weaknesses in the design or operation of internal control over financial reporting, which are reasonablylikely to adversely affect the registrant's ability to record, process, summarize and report financial information; and
(b) Any fraud, whether or not material, that involves management or other employees who have a significant role in the registrant's internal controlover financial reporting.
Date: August 7, 2020
/s/ ROBERT F. PROBSTRobert F. Probst Executive Vice President and Chief Financial Officer

Exhibit 32.1
CERTIFICATION PURSUANT TO
18 U.S.C. SECTION 1350,
AS ADOPTED PURSUANT TO
SECTION 906 OF THE SARBANES-OXLEY ACT OF 2002
In connection with the Quarterly Report on Form 10-Q of Ventas, Inc. (the "Company") for the period ended June 30, 2020, as filed with theSecurities and Exchange Commission on the date hereof (the "Report"), I, Debra A. Cafaro, Chairman and Chief Executive Officer of the Company, certify,pursuant to 18 U.S.C. § 1350, as adopted pursuant to § 906 of the Sarbanes-Oxley Act of 2002, that:
(1) The Report fully complies with the requirements of section 13(a) or 15(d) of the Securities Exchange Act of 1934; and
(2) The information contained in the Report fairly presents, in all material respects, the financial condition and results of operations of theCompany.
Date: August 7, 2020
/s/ DEBRA A. CAFARODebra A. Cafaro Chairman and Chief Executive Officer
A signed original of this written statement required by Section 906 has been provided to the Company and will be retained by the Company andfurnished to the Securities and Exchange Commission or its staff upon request.

Exhibit 32.2
CERTIFICATION PURSUANT TO
18 U.S.C. SECTION 1350,
AS ADOPTED PURSUANT TO
SECTION 906 OF THE SARBANES-OXLEY ACT OF 2002
In connection with the Quarterly Report on Form 10-Q of Ventas, Inc. (the "Company") for the period ended June 30, 2020, as filed with theSecurities and Exchange Commission on the date hereof (the "Report"), I, Robert F. Probst, Executive Vice President and Chief Financial Officer of theCompany, certify, pursuant to 18 U.S.C. § 1350, as adopted pursuant to § 906 of the Sarbanes-Oxley Act of 2002, that:
(1) The Report fully complies with the requirements of section 13(a) or 15(d) of the Securities Exchange Act of 1934; and
(2) The information contained in the Report fairly presents, in all material respects, the financial condition and results of operations of theCompany.
Date: August 7, 2020
/s/ ROBERT F. PROBSTRobert F. Probst Executive Vice President and Chief Financial Officer
A signed original of this written statement required by Section 906 has been provided to the Company and will be retained by the Company andfurnished to the Securities and Exchange Commission or its staff upon request.