vectra da: a better measure for predicting radiographic ... 2014... · vectra® da: a better...
TRANSCRIPT

1 ML-A
CR
2014IT
Slid
es-0
1 1
1/1
4 u
nauth
orized c
hanges n
ot
perm
itte
d
Vectra® DA: A Better Measure for
Predicting Radiographic Progression in
Rheumatoid Arthritis?
Ronald F. van Vollenhoven, MD, PhD
Jonathan Kay, MD
Andrew Laster MD, FACR
Eric Sasso, MD
Crescendo Bioscience® is the sponsor of the presentation.

2 ML-A
CR
2014IT
Slid
es-0
1 1
1/1
4 u
nauth
orized c
hanges n
ot
perm
itte
d
2
Agenda • Introduction:
- Eric Sasso, MD, Crescendo Bioscience
• The Role of CRP and ESR in Assessing RA Disease Activity:
- Jonathan Kay, MD, UMass Medical School
• Vectra® DA and Radiographic Progression:
- Eric Sasso, MD, Crescendo Bioscience
- Ronald van Vollenhoven, MD, PhD, Karolinska Institute
• Clinical Applications of Vectra DA:
- Andrew Laster, MD, FACR, Arthritis & Osteoporosis Consultants of the
Carolinas
• Q&A

3 ML-A
CR
2014IT
Slid
es-0
1 1
1/1
4 u
nauth
orized c
hanges n
ot
perm
itte
d
3
Vectra® DA Intended Use
• Vectra DA, a multi-biomarker blood test, was validated to
measure disease activity in adults diagnosed with
rheumatoid arthritis
• Test results are intended to
– Aid in the assessment of disease activity in RA patients
– Help inform patient management decisions when used in
conjunction with standard clinical assessment
• This test is not intended or validated to:
– Diagnose RA
– Guide therapy selection
• Interpretation of individual biomarker results has not
been validated

4 ML-A
CR
2014IT
Slid
es-0
1 1
1/1
4 u
nauth
orized c
hanges n
ot
perm
itte
d
4
Vectra® DA Biomarkers: Twelve biomarkers reflect the
heterogeneity of RA
Biomarker Biomarker Category Primary Role
VCAM-1 Adhesion Molecules Cellular influx and tissue expansion
EGF
VEGF-A
Growth Factors
IL-6
TNF-RI
Cytokine-related Proteins Local inflammation and destruction
MMP-1
MMP-3
Matrix Metalloproteinases Cartilage degradation and joint
damage
YKL-40 Skeletal-related Proteins Stromal activity & regulation
(fibroblasts, chondrocytes, vascular
cells)
Leptin
Resistin
Hormones
Systemic Inflammatory Response
SAA
CRP
Acute Phase Proteins

5 ML-A
CR
2014IT
Slid
es-0
1 1
1/1
4 u
nauth
orized c
hanges n
ot
perm
itte
d
5
An algorithm is applied to the concentrations of individual
biomarkers to calculate a Vectra® DA score from 1 to 100
* The range reflects the precision of the score based on repeat measurements.

6 ML-A
CR
2014IT
Slid
es-0
1 1
1/1
4 u
nauth
orized c
hanges n
ot
perm
itte
d
The Role of CRP and ESR in Assessing
RA Disease Activity
Jonathan Kay, MD
UMass Medical School
Crescendo Bioscience® is the sponsor of the presentation.

7 ML-A
CR
2014IT
Slid
es-0
1 1
1/1
4 u
nauth
orized c
hanges n
ot
perm
itte
d
7
Disclosures
Research Support: AbbVie Inc.; Ardea Biosciences, Inc.; Eli Lilly and
Company; Fidia Farmaceutici, SpA; Roche Laboratories, Inc.
Consultant: AbbVie Inc.; Amgen, Inc.; AstraZeneca; Bristol-Myers
Squibb Company; Celgene Corp.; Crescendo Bioscience, Inc.; Eli Lilly
and Company; EPIRUS Biopharmaceuticals, Inc.; Genentech Inc.;
Hospira, Inc.; Janssen Biotech, Inc.; medac pharma Inc.; PanGenetics,
B.V.; Pfizer Inc.; Roche Laboratories, Inc.; Sun Pharmaceutical
Industries Ltd.; UCB, Inc.

8 ML-A
CR
2014IT
Slid
es-0
1 1
1/1
4 u
nauth
orized c
hanges n
ot
perm
itte
d
8

9 ML-A
CR
2014IT
Slid
es-0
1 1
1/1
4 u
nauth
orized c
hanges n
ot
perm
itte
d
9
Background
1Sokka T, Pincus T. Arthritis Rheum. 2003; 48: 313-318.
• Patients with active RA often have elevated tender &
swollen joint counts and patient & MD global assessment,
yet have normal ESR and/or CRP
• These discordances imply that when ESR and CRP are in
the normal range, they may be uninformative in clinical
practice, especially for patients with active RA
• These discordances also imply that patients may fail to
meet clinical trial APR entry criteria despite having active
disease.1

10 ML-A
CR
2014IT
Slid
es-0
1 1
1/1
4 u
nauth
orized c
hanges n
ot
perm
itte
d
10
Study Overview
• Observational study
• CORRONA database
• October 1, 2001 through February 27, 2011
• 9135 RA patients with active disease
– All had CDAI >2.8 at a visit
– ESR and CRP obtained at visit
– 4,031 (44.1%) were biologic-naïve
Kay J, Morgacheva O, Messing S, et al. Arthritis Research & Therapy 2014; 16(1)

11 ML-A
CR
2014IT
Slid
es-0
1 1
1/1
4 u
nauth
orized c
hanges n
ot
perm
itte
d
Baseline Characteristics by APR Levels
Neither APR
elevated
n=2520
APR levels
discordant
n=1058
Both APR
elevated
n=650
P-Value
Age (years) 59.29± 13.22 62.21±13.21 62.71± 13.34 <0.0001
Duration of RA (years) 11.01± 9.83 11.93± 10.68 10.91± 10.27 0.0406
CDAI 12.89 ± 10.15 15.18 ± 11.16 20.47 ± 14.68 <0.0001
Tender Joints 3.73 ± 5.24 4.29 ± 5.40 6.30 ± 7.21 <0.0001*
Swollen Joints 4.04 ± 5.13 4.80 ± 5.49 6.64 ± 6.42 <0.0001*
Patient Global Assessment 30.91 ± 23.82 36.35 ± 25.45 42.90 ± 27.56 <0.0001
MD Global Assessment 20.21 ± 16.61 24.67 ± 19.06 32.42 ± 22.50 <0.0001
Prednisone Use 680 (26.98%) 341 (32.23%) 275 (42.31%) <0.0001
Methotrexate Use 1668 (66.19%) 698 (65.97%) 417 (64.15%) 0.6166
Biologic Use 1263 (50.12%) 447 (42.25%) 224 (34.46%) <0.0001
* Log-linear model (Poisson) - χ² test
Kay J, Morgacheva O, Messing S, et al. Arthritis Research & Therapy 2014; 16(1)

12 ML-A
CR
2014IT
Slid
es-0
1 1
1/1
4 u
nauth
orized c
hanges n
ot
perm
itte
d
12
• Data from 9,135 patients with active RA (CDAI >2.8) from the
CORRONA registry
ESR and CRP were each low in ~70% of patients
* Units of CRP are mg/dL; Units of ESR are mm/hr
71% CRP ≤0.8*
n = 6,507
29% CRP >0.8*
n = 2,628
70% ESR ≤28*
n = 6,416
30% ESR >28*
n = 2,719
Kay J, Morgacheva O, Messing S, et al. Arthritis Research & Therapy 2014; 16(1)

13 ML-A
CR
2014IT
Slid
es-0
1 1
1/1
4 u
nauth
orized c
hanges n
ot
perm
itte
d
13
CRP and ESR were both low in 58% of patients with
active RA
• Data from 9,135 patients with active RA (CDAI >2.8) from the
CORRONA registry
58% ESR ≤28*
and
CRP ≤0.8* n = 5,295
42% ESR >28*
and/or
CRP >0.8* n = 3,840
* Units of CRP are mg/dL; Units of ESR are mm/hr
Kay J, Morgacheva O, Messing S, et al. Arthritis Research & Therapy 2014; 16(1)

14 ML-A
CR
2014IT
Slid
es-0
1 1
1/1
4 u
nauth
orized c
hanges n
ot
perm
itte
d
14
66% CRP ≤0.8*
n = 2,674
68% ESR ≤28*
n = 2,756
Similar levels of low CRP and ESR were seen among the
4,031 biologic-naïve patients with active RA (CDAI >2.8)
32% ESR >28*
n = 1,275
34% CRP >0.8*
n = 1,357
* Units of CRP are mg/dL; Units of ESR are mm/hr
Kay J, Morgacheva O, Messing S, et al. Arthritis Research & Therapy 2014; 16(1)

15 ML-A
CR
2014IT
Slid
es-0
1 1
1/1
4 u
nauth
orized c
hanges n
ot
perm
itte
d
15
Similar levels of low CRP and ESR were seen among the
4,031 biologic-naïve patients with active RA (CDAI >2.8)
54% CRP ≤0.8*
and
ESR ≤28* n = 2,164
46% ESR >28*
and/or
CRP >0.8* n = 1,867
* Units of CRP are mg/dL; Units of ESR are mm/hr
Kay J, Morgacheva O, Messing S, et al. Arthritis Research & Therapy 2014; 16(1)

16 ML-A
CR
2014IT
Slid
es-0
1 1
1/1
4 u
nauth
orized c
hanges n
ot
perm
itte
d
16
67% 57%
46%
23%
27%
28%
10% 16%
26%
0%
10%
20%
30%
40%
50%
60%
70%
80%
90%
100%
CDAI LDA CDAI MDA CDAI HAD
Both CRP andESR elevated
Either CRP orESR elevated
Neither CRP orESR elevated
In both moderate and high CDAI Disease Activity Levels,
both ESR and CRP were low in ~50% of patients
LDA = Low Disease Activity, MDA = Moderate Disease Activity, HDA = High Disease Activity
(>2.8 & ≤10) (>10 & ≤22) (>22)
LDA MDA HDA CDAI
Kay J, Morgacheva O, Messing S, et al. Arthritis Research & Therapy 2014; 16(1)

17 ML-A
CR
2014IT
Slid
es-0
1 1
1/1
4 u
nauth
orized c
hanges n
ot
perm
itte
d
17
Summary
• Patients with active RA often have elevated tender &
swollen joint counts and patient & MD global assessment,
yet have normal ESR and/or CRP
• These discordances imply that when ESR and CRP are in
the normal range, they may be uninformative in clinical
practice, especially for patients with active RA
• These discordances also imply that patients may fail to
meet clinical trial APR entry criteria despite having active
disease.1
1Sokka T, Pincus T. Arthritis Rheum. 2003; 48: 313-318.

18 ML-A
CR
2014IT
Slid
es-0
1 1
1/1
4 u
nauth
orized c
hanges n
ot
perm
itte
d
18
7%
33%
51% 34%
54%
36% 59%
13% 13%
0%
10%
20%
30%
40%
50%
60%
70%
80%
90%
100%
SWEFOT eRAPre-MTX
Leiden StableDMARDs
Stable TherapyBRASS
High (>44)
Mod (30-44)
Low (<30)
Perc
en
tag
e o
f A
ssessm
en
ts
Vectra DA
algorithm score
N = 71/235
30.2%
N = 158/235
67.2%
N = 184/235
78.3%
Multiple Cohorts
SWEFOT eRA Pre-MTX
BRASS Stable Therapy
Leiden Stable DMARDs
Vectra® DA algorithm scores were frequently moderate
or high when CRP was low (≤1 mg/dL)
Hambardzumyan K, Bolce R, Saevarsdottir S, et al. Annals of the Rheumatic Diseases 2014. doi:10.1136/annrheumdis-2013-204986;
Lee, YC. et al, ACR 2013, Arthritis Rheum 2013;65 Suppl 10:2683; Li W, et al, EULAR 2013, poster # FRI0098; Data on File
* The Vectra DA algorithm and biomarkers were used in a study performed in Crescendo’s R&D lab

19 ML-A
CR
2014IT
Slid
es-0
1 1
1/1
4 u
nauth
orized c
hanges n
ot
perm
itte
d
19
7% 7%
34% 26%
59% 68%
0%
10%
20%
30%
40%
50%
60%
70%
80%
90%
100%
SWEFOT eRAPre-MTX
Leiden StableDMARDs
BRASS StableTherapy
High (>44)
Mod (30-44)
Low (<30)
Perc
en
tag
e o
f A
ssessm
en
ts
Vectra DA
algorithm score
Hambardzumyan K, Bolce R, Saevarsdottir S, et al. Annals of the Rheumatic Diseases 2014. doi:10.1136/annrheumdis-2013-204986;
; Crescendo Data on File
SWEFOT: CRP groups are based on CRP values from clinical laboratory
N = 71/235
30.2%
SWEFOT
SWEFOT eRA Pre-MTX
Vectra® DA algorithm scores were also frequently
moderate or high when ESR was low (≤25)
N = 74/235
31.5%
SWEFOT eRA Pre-MTX
Low
CRP
Low
ESR

20 ML-A
CR
2014IT
Slid
es-0
1 1
1/1
4 u
nauth
orized c
hanges n
ot
perm
itte
d
Vectra® DA and Radiographic
Progression
Eric Sasso, MD
Crescendo Bioscience
Ronald F. van Vollenhoven, MD, PhD
Karolinska Institute
Crescendo Bioscience® is the sponsor of the presentation.

21 ML-A
CR
2014IT
Slid
es-0
1 1
1/1
4 u
nauth
orized c
hanges n
ot
perm
itte
d
21
Disclosures • Dr. Eric Sasso is an employee of Crescendo
Bioscience, a wholly-owned subsidiary of Myriad
Genetics, Inc.

22 ML-A
CR
2014IT
Slid
es-0
1 1
1/1
4 u
nauth
orized c
hanges n
ot
perm
itte
d
Leiden
Crescendo Bioscience® is the sponsor of the presentation.
Stable DMARDs

23 ML-A
CR
2014IT
Slid
es-0
1 1
1/1
4 u
nauth
orized c
hanges n
ot
perm
itte
d
23
Leiden study
Clinic visit
On DMARDs
Clinical data
Vectra® DA
1 year
X-ray #1 X-ray #2 Radiographic progression
N=271 visits for 163 patients
van der Helm-van Mil, et al. Rheumatology. 2013. 52 (5): 839-846.
Stable DMARDS / Leiden

24 ML-A
CR
2014IT
Slid
es-0
1 1
1/1
4 u
nauth
orized c
hanges n
ot
perm
itte
d
24
Vectra® DA algorithm score discriminated risk for
radiographic progression better than DAS28-CRP
van der Helm-van Mil, et al. Rheumatology. 2013. doi:10.1093/rheumatology/kes378
7%
20% 15%
27%
18%
24%
43%
37%
0%
10%
20%
30%
40%
50%
Vectra DA Algorithm Score (Remission ≤25; High >44)
DAS28CRP(Remission <2.32; High >4.1)
Δ S
HS
> 3
in
a
12
mo
nth
pe
rio
d
Remission Low Moderate High
3/43 47/110 17/83 23/63
RR = 1.8 RR = 6.1
P<0.05
2/13 19/105 8/30 23/95
Vectra DA Algorithm Score DAS28-CRP
n = n =
The Vectra DA algorithm and biomarkers were used in a study performed in Crescendo’s R&D lab
≤25 26-29 30-44 >44 <2.3 ≥2.3 to
≤2.7
>4.1 >2.7 to
≤4.1
Stable DMARDS / Leiden
N = 271 visits,
163 patients
Range =

25 ML-A
CR
2014IT
Slid
es-0
1 1
1/1
4 u
nauth
orized c
hanges n
ot
perm
itte
d
25
Definition of
Remission Remission
Non-
remission P-value PLR
DAS28-CRP
<2.32
80%
(66/83)
71%
(134/188) 0.18 1.38
ACR/EULA
R
83
(25/30)
73
(175/241) 0.27 1.78
Vectra® DA
≤25
93
(40/43)
70
(160/228) 0.001 4.73
Stable DMARDS / Leiden
Good radiographic outcome (ΔSHS ≤3) for
patients in remission versus non-remission
van der Helm-van Mil, et al. Rheumatology. 2013. 52 (5): 839-846.

26 ML-A
CR
2014IT
Slid
es-0
1 1
1/1
4 u
nauth
orized c
hanges n
ot
perm
itte
d
26
Definition of
Remission Remission
Non-
remission P-value PLR
DAS28-CRP
<2.32
80%
(66/83)
71%
(134/188) 0.18 1.38
ACR/
EULAR
83%
(25/30)
73%
(175/241) 0.27 1.78
Vectra® DA
≤25
93
(40/43)
70
(160/228) 0.001 4.73
Stable DMARDS / Leiden
Good radiographic outcome (ΔSHS ≤3) for
patients in remission versus non-remission
van der Helm-van Mil, et al. Rheumatology. 2013. 52 (5): 839-846.

27 ML-A
CR
2014IT
Slid
es-0
1 1
1/1
4 u
nauth
orized c
hanges n
ot
perm
itte
d
27
Definition of
Remission Remission
Non-
remission P-value PLR
DAS28-CRP
<2.32
80%
(66/83)
71%
(134/188) 0.18 1.38
ACR/
EULAR
83%
(25/30)
73%
(175/241) 0.27 1.78
Vectra® DA
≤25
93%
(40/43)
70%
(160/228) 0.001 4.73
Stable DMARDS / Leiden
Good radiographic outcome (ΔSHS ≤3) for
patients in remission versus non-remission
van der Helm-van Mil, et al. Rheumatology. 2013. 52 (5): 839-846.

28 ML-A
CR
2014IT
Slid
es-0
1 1
1/1
4 u
nauth
orized c
hanges n
ot
perm
itte
d
28
Definition of
Remission Remission
Non-
remission P-value PLR
DAS28-CRP
<2.32
80%
(66/83)
71%
(134/188) 0.18 1.38
ACR/
EULAR
83%
(25/30)
73%
(175/241) 0.27 1.78
Vectra® DA
≤25
93%
(40/43)
70%
(160/228) 0.001 4.73
Stable DMARDS / Leiden
Good radiographic outcome (ΔSHS ≤3) for
patients in remission versus non-remission
van der Helm-van Mil, et al. Rheumatology. 2013. 52 (5): 839-846.

29 ML-A
CR
2014IT
Slid
es-0
1 1
1/1
4 u
nauth
orized c
hanges n
ot
perm
itte
d
Vectra® DA and Radiographic
Progression
Ronald F. van Vollenhoven, MD, PhD
Karolinska Institute
Crescendo Bioscience® is the sponsor of the presentation.

30 ML-A
CR
2014IT
Slid
es-0
1 1
1/1
4 u
nauth
orized c
hanges n
ot
perm
itte
d
30
Disclosures
Research support, consultancy: AbbVie, Biotest, BMS, Crescendo,
GSK, Janssen, Lilly, Merck, Pfizer, Roche, UCB, Vertex
31 ML-A
CR
2014IT
Slid
es-0
1 1
1/1
4 u
nauth
orized c
hanges n
ot
perm
itte
d
31

32 ML-A
CR
2014IT
Slid
es-0
1 1
1/1
4 u
nauth
orized c
hanges n
ot
perm
itte
d
32
R = Responders
NR = Non Responders
MTX/H/S = Methotrexate with sulfasalazine and hydroxychloroquine
MTX/Inf = Methotrexate with infliximab
eRA / SWEFOT
SWEFOT Vectra® DA Analysis Overview
month 3
ΔSHS
R
NR
MTX
MTX/H/S
MTX/Inf
Start MTX
year 1 BL
X-ray #1
Clinical Data
Vectra DA
(N = 235) Assess
Response
X-ray #2
• Patients from 15 rheumatology units in Sweden
• Early rheumatoid arthritis (eRA) patients with disease duration <1 year, DMARD naive
Hambardzumyan K, Bolce R, Saevarsdottir S, et al. Annals of the Rheumatic Diseases 2014. doi:10.1136/annrheumdis-2013-204986;

33 ML-A
CR
2014IT
Slid
es-0
1 1
1/1
4 u
nauth
orized c
hanges n
ot
perm
itte
d
33
0%
3%
21%
0%
5%
10%
15%
20%
25%
30%
35%
0/5 1/29 42/201 n =
High
(>44)
Moderate
(30-44)
% R
ap
id R
ad
iog
rap
hic
Pro
gre
ss
ors
(Δ
SH
S >
5
BL
to
year
1)
Low
(<30)
Vectra® DA categories predicted risk of rapid radiographic
progression (ΔSHS >5) over 1 year
eRA / SWEFOT
Hambardzumyan K, Bolce R, Saevarsdottir S, et al. Annals of the Rheumatic Diseases 2014. doi:10.1136/annrheumdis-2013-204986;
_____________
Vectra DA Score at Baseline (Total N = 235)

34 ML-A
CR
2014IT
Slid
es-0
1 1
1/1
4 u
nauth
orized c
hanges n
ot
perm
itte
d
34
0%
3%
21%
0%
5%
10%
15%
20%
25%
30%
35%
0/5 1/29 42/201 n =
High
(>44)
Moderate
(30-44)
7x Relative Risk
Low
(<30)
Vectra DA Score at Baseline (Total N = 235)
p = 0.008
Vectra® DA categories predicted risk of rapid radiographic
progression (ΔSHS >5) over 1 year
eRA / SWEFOT
Hambardzumyan K, Bolce R, Saevarsdottir S, et al. Annals of the Rheumatic Diseases 2014. doi:10.1136/annrheumdis-2013-204986;
Data on File
The p value 0.008 represents low/moderate vs. high Vectra DA score. The p value for moderate vs. high Vectra DA score is 0.021 (figure 2D)
_____________
% R
ap
id R
ad
iog
rap
hic
Pro
gre
ss
ors
(Δ
SH
S >
5
BL
to
year
1)

35 ML-A
CR
2014IT
Slid
es-0
1 1
1/1
4 u
nauth
orized c
hanges n
ot
perm
itte
d
35
Baseline Vectra® DA score categories differentiated
radiographic progressors at 1 year
ΔSHS>5
21%
3%
0%
5
eRA / SWEFOT
Hambardzumyan K, Bolce R, Saevarsdottir S, et al. Annals of the Rheumatic Diseases 2014. doi:10.1136/annrheumdis-2013-204986;
BL Vectra DA Levels Δ
To
tal
Sh
arp
-va
n d
er
Heijd
e S
co
re
Cumulative % of Patients
Low (< 30), n = 5
High (> 44), n = 201
Moderate (30 – 44), n = 29
ΔSHS>5
N=235

36 ML-A
CR
2014IT
Slid
es-0
1 1
1/1
4 u
nauth
orized c
hanges n
ot
perm
itte
d
36
Baseline Vectra® DA score differentiated radiographic progressors
at year 1 better than baseline CRP, ESR, or DAS28-ESR
5
Hambardzumyan K, Bolce R, Saevarsdottir S, et al. Annals of the Rheumatic Diseases 2014. doi:10.1136/annrheumdis-2013-204986;
eRA / SWEFOT
Δ T
ota
l S
HS
Δ
To
tal
SH
S
Δ T
ota
l S
HS
Δ
To
tal
SH
S
SHS = Sharp-van der Heijde Score
High (> 44), n = 201
Moderate (30 – 44), n = 29
Low (< 30), n = 5 Low (≤ 1 mg/dL), n = 71
Moderate (> 1-3 mg/dL), n = 75
High (> 3 mg/dL), n = 89
N=235
Moderate (>3.2-5.1), n = 68
Low (≤ 3.2), n = 0
High (>5.1), n = 167 2nd Tertile (>25-45 mm/h), n = 81
1st Tertile (≤ 25 mm/h), n = 74
3rd Tertile (>44 mm/h), n = 80
Cumulative % of Patients
Cumulative % of Patients
Cumulative % of Patients
Cumulative % of Patients
ΔSHS>5
DAS28-ESR category ΔSHS>5
ΔSHS>5
ΔSHS>5
Vectra DA category CRP category
ESR category
High (> 44), n = 201
Moderate (30 – 44), n = 29
Low (< 30), n = 5
21%
3%
0%
High (> 3 mg/dL), n = 89
Moderate (> 1-3 mg/dL), n = 75
Low (≤ 1 mg/dL), n = 71
25%
15%
14%
High (>5.1), n = 167
Moderate (>3.2-5.1), n = 68
Low (≤ 3.2), n = 0
20%
15%
3rd Tertile (>44 mm/h), n = 80
2nd Tertile (>25-45 mm/h), n = 81
1st Tertile (≤ 25 mm/h), n = 74
26%
15%
14%
5 5
5 5

37 ML-A
CR
2014IT
Slid
es-0
1 1
1/1
4 u
nauth
orized c
hanges n
ot
perm
itte
d
37
Rapid radiographic progression at 1 year in patients with high
Vectra® DA (>44) was observed across CRP categories at baseline
Baseline CRP (mg/dL)
Baseline Vectra DA
Hambardzumyan K, Bolce R, Saevarsdottir S, et al. Annals of the Rheumatic Diseases 2014. doi:10.1136/annrheumdis-2013-204986;
n = 71 n = 75 n = 89
10
11
21
eRA Pre-MTX / SWEFOT
10
11
21
ΔSHS >5 (n = 43)
High (>44)
5 0 0
24
4 1
0
10
20
30
40
50
60
70
80
90
100
Low (≤1) Mod (>1 – 3) High (>3)
Low (<30)
Mod (30 – 44) 42
71
88
Nu
mb
er
of
Pa
tie
nts
ΔSHS >5 at 1 year
Baseline Vectra DA
Score

38 ML-A
CR
2014IT
Slid
es-0
1 1
1/1
4 u
nauth
orized c
hanges n
ot
perm
itte
d
38
4% 6%
35%
0%
10%
20%
30%
40%
DAS28CRP(Remission <2.32; High >4.1)
51 31 34 n =
Low Moderate High
eRA / SWEFOT
Ra
pid
Ra
dio
gra
ph
ic P
rog
res
so
rs
(Δ S
HS
> 5
) fr
om
Ye
ar
1 t
o 2
Patients had high Vectra DA score at BL and were MTX non-responders at
Month 3. Rapid radiographic progression is defined as ΔSHS >5 in one year. Hambardzumyan, K. Ann Rheum Dis 2014;73(Suppl2).
Persistence of a high Vectra® DA score at Year 1 was associated
with rapid progression from Year 1 to Year 2 (ΔSHS >5)
Vectra DA Score at Year 1
N=
Among Patients with High Vectra DA at Baseline

39 ML-A
CR
2014IT
Slid
es-0
1 1
1/1
4 u
nauth
orized c
hanges n
ot
perm
itte
d
39
Vectra DA is not validated to guide therapy selection.
The statements/conclusions provided herein are based
on a secondary analysis of the SWEFOT trial
data. Additional validation studies would be required to
support use of Vectra DA as a predictor of therapy
response.

40 ML-A
CR
2014IT
Slid
es-0
1 1
1/1
4 u
nauth
orized c
hanges n
ot
perm
itte
d
40
Vectra DA is not validated to guide therapy selection. The statements/conclusions provided herein are based on a secondary analysis of the
SWEFOT trial data. Additional validation studies would be required to support use of Vectra DA as a predictor of therapy response.
0%
10%
20%
30%
40%
50%
60%
70%
80%
67%
43%
37%
57%
Response to triple therapy was best following a large decrease in
Vectra® DA score (>20) on MTX monotherapy
Hambardzumyan, K. Ann Rheum Dis 2014;73(Suppl2).
eRA / SWEFOT
Pa
tie
nts
wit
h D
AS
28
≤ 3
.2 a
t ye
ar
1
Triple therapy Anti-TNF
Δ Vectra DA at month 3 of MTX
12/18 19/44 6/16 29/51 n =
Δ >20 Δ ≤20 Δ >20 Δ ≤20

41 ML-A
CR
2014IT
Slid
es-0
1 1
1/1
4 u
nauth
orized c
hanges n
ot
perm
itte
d
Clinical Applications of Vectra® DA
Andrew Laster MD, FACR
Arthritis & Osteoporosis Consultants of the
Carolinas
Charlotte, NC
Crescendo Bioscience® is the sponsor of the presentation.

42 ML-A
CR
2014IT
Slid
es-0
1 1
1/1
4 u
nauth
orized c
hanges n
ot
perm
itte
d
42
Disclosures • Advisory board: Amgen, Crescendo Bioscience,
Genentech/ Roche, Lilly, UCB
• Speakers Bureau: Abbvie, Amgen, Crescendo
Bioscience, Genentech/ Roche, GSK, Lilly, UCB
• Consultant: Augmedix, Hologic, Medimaps

43 ML-A
CR
2014IT
Slid
es-0
1 1
1/1
4 u
nauth
orized c
hanges n
ot
perm
itte
d
43
• Community based independent rheumatology practice in
Charlotte, NC (pop.1.5 x 106)
• 6 rheumatologists / 2 NPs / 41 total staff
• Single office
• Full capability with X ray and U/S
• MRI not available in office without CON in NC
Arthritis & Osteoporosis Consultants of the
Carolinas

44 ML-A
CR
2014IT
Slid
es-0
1 1
1/1
4 u
nauth
orized c
hanges n
ot
perm
itte
d
44
Use of Vectra® DA in My Practice
• Number of RA patients in practice: 456
• Tested with Vectra DA in Last 12 Months: 322 (71%)
– Single test 52%
– > 1 test 48%
Score Composite for Last
12 Months Score Distribution for
Last 12 Months
10 20 30 40 50 60 70 80 90 100 0%
5% 10%
15%
20% 25%
30%

45 ML-A
CR
2014IT
Slid
es-0
1 1
1/1
4 u
nauth
orized c
hanges n
ot
perm
itte
d
45
• 12-30% of patients with apparent clinical remission have
evidence of radiographic progression 1,2,3
– Advanced imaging with U/S or MRI:
• has superior sensitivity compared to clinical evaluation for
detecting synovitis
• correlates with subsequent X ray damage and functional
outcome
• ~ 60% of patients not in clinical remission do not progress
radiographically 2
1Brown et al Arthritis Rheum 2008; 58(10):2958-2967. 2Lillegraven et al Ann Rheum Dis 2012; 71(50):681-686. 3van der Helm-van Mil et al Rheumatology 2013; 52 (5):839-846.
Why Not Just Rely on the Clinical Exam?

46 ML-A
CR
2014IT
Slid
es-0
1 1
1/1
4 u
nauth
orized c
hanges n
ot
perm
itte
d
46
Clinical Exam Role of Vectra Comments
Normal joint exam
Rule out subclinical
synovitis
If ESR/CRP are normal,
an elevated Vectra DA
score may lead to U/S or
MRI to confirm active RA
Synovitis on exam and no
radiographic abnormalities
(erosions/JSN)
Assess likelihood of
radiographic progression
Low Vectra DA score
means lower risk of
progression.
High Vectra DA score
means higher risk of
progression.
Synovitis on exam +
erosions and/or JSN
Helps assess adequacy of
response to therapy
Clinical measures and
ESR/CRP may not be
sufficient in assessing
LDA or remission.
Tender joints without
obvious synovitis
Helps assess patients with
co-morbidities
(Fibromyalgia / OA)
Low Vectra DA means
active RA is less likely
Vectra® DA: How I incorporate into practice
47 ML-A
CR
2014IT
Slid
es-0
1 1
1/1
4 u
nauth
orized c
hanges n
ot
perm
itte
d
47
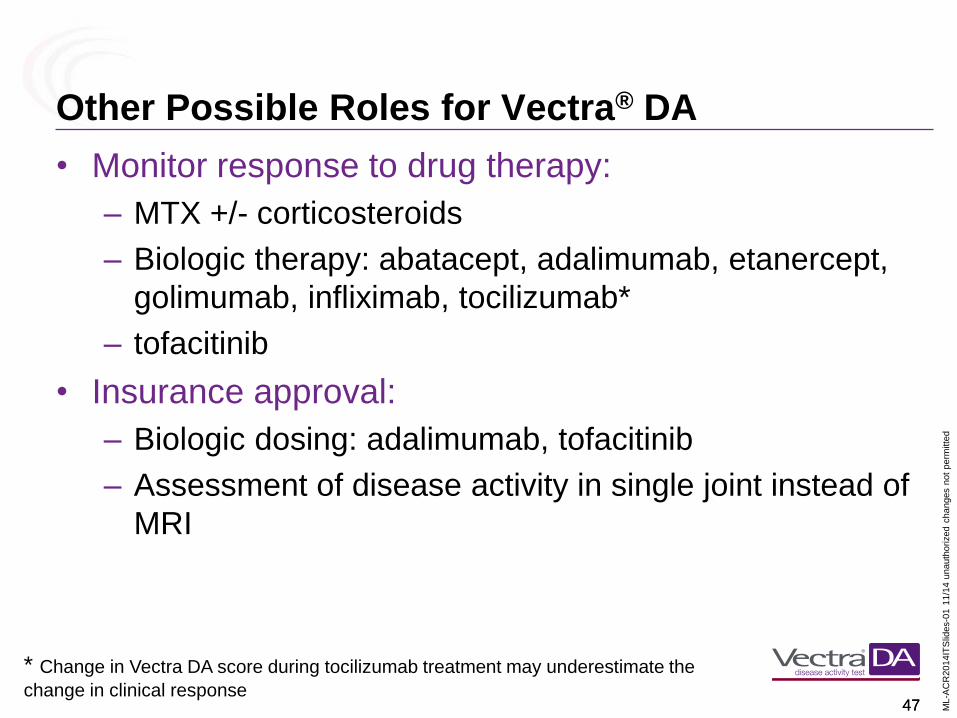
Other Possible Roles for Vectra® DA
• Monitor response to drug therapy:
– MTX +/- corticosteroids
– Biologic therapy: abatacept, adalimumab, etanercept,
golimumab, infliximab, tocilizumab*
– tofacitinib
• Insurance approval:
– Biologic dosing: adalimumab, tofacitinib
– Assessment of disease activity in single joint instead of
MRI
* Change in Vectra DA score during tocilizumab treatment may underestimate the
change in clinical response

49 ML-A
CR
2014IT
Slid
es-0
1 1
1/1
4 u
nauth
orized c
hanges n
ot
perm
itte
d
49
Summary: Clinical Utility of Vectra® DA in My Practice
• Vectra DA has had a significant impact on my ability to better
assess disease activity in RA patients with a variety of
presentations (there is not one ideal patient type where Vectra
DA is best suited):
– Identify patients with sub-clinical synovitis
– Exclude active RA in setting of co-morbidities
– Assess early in disease course, likelihood of progression with
radiographic damage
• Vectra DA has resulted in more selective utilization of advanced
diagnostic imaging in my practice
• Vectra DA has allowed me to more confidently manage drug
therapy in a treat-to-target approach

50 ML-A
CR
2014IT
Slid
es-0
1 1
1/1
4 u
nauth
orized c
hanges n
ot
perm
itte
d
Q&A
Crescendo Bioscience® is the sponsor of the presentation.

51 ML-A
CR
2014IT
Slid
es-0
1 1
1/1
4 u
nauth
orized c
hanges n
ot
perm
itte
d
51
Oral Presentations Wednesday, Nov. 19; Room 258B
9:30–9:45 AM
2973 The Multi-Biomarker Disease Activity Score as a Predictor of Radiographic Progression in a Registry of
Patients with Rheumatoid Arthritis; E.H. Sasso, G. Wu, C.C. Hwang, M.E. Weinblatt, N.A. Shadick,C. Alexander, O.G.
Segurado
9:45–10:00 AM
2974 Multi-Biomarker Disease Activity Score is Associated with Power Doppler Ultrasound in Patients with
Rheumatoid Arthritis in Low Disease Activity State; M.H. Ma, T. Garrood, W. Li, N.A. Defranoux, G.H. Kingsley, A.P.
Cope, D. Scott
Poster Presentations
Sunday, Nov 16, 9:00–11:00 AM; Exhibit Hall B
364 In Early Rheumatoid Arthritis, the Multi-Biomarker Disease Activity Score at Different Time-Points is
Predictive of Subsequent Radiographic Progression; K. Hambardzumyan R.J. Bolce, S. Saevarsdottir, K. Forslind,
I.F. Petersson, P. Geborek, E.H. Sasso, D. Chernoff, S. Cruickshank, R.F. van Vollenhoven
367 In Early Rheumatoid Arthritis Patients with Non-Response to Methotrexate Monotherapy the Change in Multi-
Biomarker Disease Activity Score is Differentially Associated with Subsequent Response to Non-Biological
Versus Biological Therapy; K. Hambardzumyan, R.J. Bolce, S. Saevarsdottir, K. Forslind, I.F. Petersson, P. Geborek,
E.H. Sasso, D. Chernoff, S. Cruickshank, R.F. van Vollenhoven
376 Using the Multi-Biomarker Disease Activity Score as a Complementary Inclusion Criterion for Clinical Trials
in Rheumatoid Arthritis May Enhance Recruitment; R.F. van Vollenhoven, R. Bolce, K. Hambardzumyan, S.
Saevarsdottir, K. Forslind, I.F. Petersson, E.H. Sasso, C.C Hwang, O.G. Segurado, P. Geborek
Tuesday, Nov. 18; 9:00–11:00 AM Exhibit Hall B
2615 Preliminary Assessment of a Multi-Biomarker Disease Activity Test for Axial Spondyloarthritis; W.P. Maksymowych, S. Wichuk, P.S. Eastman, E.H. Sasso
Vectra® DA Posters and Presentations at ACR