vegetation analysis of tree communities at some forest...
TRANSCRIPT

BIODIVERSITAS ISSN: 1412-033X
Volume 20, Number 3, March 2019 E-ISSN: 2085-4722
Pages: 643-655 DOI: 10.13057/biodiv/d200305
Vegetation analysis of tree communities at some forest patches
in North Sulawesi, Indonesia
MUSTAID SIREGAR, HENDRA HELMANTO, SRI ULIE RAKHMAWATI Research Center for Plant Conservation and Botanic Gardens (Bogor Botanic Gard ens), Indonesian Institute of Sciences. Jl. Ir. H. Juanda No. 13 Bogor
16122, West Java, Indonesia. Tel./fax.: +62-251-8322-187, ♥email: [email protected]
Manuscript received: 21 January 2018. Revision accepted: 11 February 2019.
Abstract. Siregar M, Helmanto H, Rakhmawati SU. 2019. Vegetation analysis of tree communities at some forest patches in North
Sulawesi, Indonesia. Biodiversitas 20: 643-655. Deforestation has caused a decline in forest area in Indonesia. Now natural forests is left
in the conservation areas while those outside conservation areas are narrow and fragmented. This study aims to analyze forest vegetation
and conservation status of the species of trees in some forest patches in North Sulawesi. Diversity, structure and type of tree
communities at five forest patches, namely in the villages of Bukaka, Garini and Lambak in East Bolaang Mongondow District, and
Soyowan and Basaan villages in Southeast Minahasa District, North Sulawesi Province were studied using a point center quarter
method. The total number of tree species (dbh ≥ 10 cm) across five patches is 84 species. The highest number of species is in Garini (37
species), followed by Lambak (25 species), Soyowan (19 species), Bukaka (10 species) and Basaan (7 species). The species diversity
index also shows the same pattern with such species richness, but the dominance index demonstrates opposite trend. The highest
evenness index (E) is found in Bukaka (E = 0.9524), followed by Soyowan (E = 0.9061), Garini (E = 0.7873), Basaan (E = 0.7809) and
Lambak (E = 0.7099). The most important tree species based on the Species Important Value (SIV) in Bukaka is Ficus sp. (SIV =
52.17), in Garini is Octomeles sumatrana (SIV = 25.73), in Lambak is Boehmeria cylindrica (SIV = 65.03), both in Basaan and
Soyowan is Dracontomelon dao with SIV of 96.87 and 46.46 respectively. The beta diversity analyzed based on species similarity index
of Jaccard and Whittaker 's index shows a relatively large change in species composition from one location to another. The family of
Moraceae, Malvaceae, Anacardiaceae, Annonaceae and Lauraceae are listed as the widest family with a relatively high population. The
highest tree density is found in Bukaka (721 trees ha-1), followed by Lambak (482 trees ha-1), Basaan (439 trees ha-1), Garini (292 trees
ha-1) and Soyowan (164 trees ha-1). The highest basal area is also found in Garini (53.59 m2 ha-1), followed by Basaan (51.62 m2 ha-1),
Lambak (30.74 m2 ha-1), Soyowan (25.13 m2 ha-1) and Bukaka (20.98 m2 ha-1). The results of Cluster analysis using data of species
abundance indicate that the five research locations tend to form two types of tree communities. The first community consists of Garini,
Soyowan, Lambak and Bukaka, while the second community is represented only by Basaan.
Keywords: East Bolaang Mongondow, forest patches, Southeast Minahasa, North Sulawesi, vegetation analysis
INTRODUCTION
Twenty years ago (April 20, 1999) at a meeting of the
World Commission on Forests and Sustainable Development,
it was realized that the world's forests had been exploited to
the point of crisis, and there were many changes in the
function of the area which had previously been closed to
mining, industrial, agriculture, plantations and settlements.
In Borneo, the industrial sector of oil palm and timber
plantations is the biggest cause of deforestation. In 2001-
2017, forest area fell by 14% (6.04 million ha), including
3.06 million ha of forest, which was eventually converted
to industrial plantations (Gaveau et al. 2018). In 1973-2015
period an estimated 18.7 million ha of Borneo’s old-growth
forest were cleared. Industrial plantations (oil-palm and
pulpwood) expanded by 9.1 million ha. Approximately
7.0 million ha (76.1 %) of the total plantation area in 2015
was old-growth forest in 1973, of which 4.5-4.8 million ha
(24-26% of Borneo-wide deforestation) were planted
within five years of forest clearance (Gaveau et al. 2016). It
is not surprising that the total forest area in Indonesia
continues to decline from year to year. Hansen et al. (2013)
released a figure of more than 20,000 km2 (2 million ha) of
Indonesian forests lost during the period 2011-2012, an
increase compared to the 2000-2003 period of less than
10,000 km2 (1 million ha). Other data was submitted by
Forest Watch Indonesia (2011) which states that Indonesia
lost 15.16 million hectares of forest with a deforestation
rate reaching 1.51 million hectares per year during the
period 2000-2009. The latest data based on the calculation
of the Directorate General of Planology, Indonesia's
deforestation rate for the 2014-2015 period amounted to
1.09 million hectares and decreased in the 2015-2016
period to 0.63 million hectares. But the definition of
deforestation is still a debate at the international level,
because it impacts on the calculation of deforestation
(Arumingtyas 2018). Now natural forests are left in the
conservation areas while those outside conservation areas
are narrow and fragmented. Patches of forest outside
conservation areas are generally found in other designation
areas that have not been utilized, in customary forests and
in areas that are intentionally conserved by communities as
source of water, and have sacred values and other
ecological benefits. Forest cover in Indonesia in 2016 was
89,848,200 hectares, consisting of primary forest
(46,020,600 ha) and secondary forest (43,827,600 ha). As

B IODIVERSITAS 20 (3): 643-655, March 2019
644
much as 92.7% are located in forest estate (Kawasan
Hutan) either as production forests, limited production
forests, watershed protection forests and conservation areas
(e.g. national park, wildlife reserve) while the rest (7.3%) is
located in nonforest estate land (Area Penggunaan
Lain/APL) (Ministry of Environment and Forestry 2016).
Sulawesi is one of the fastest growing islands, especially
in mining and agricultural sectors. Consequently, the island
ranks third after Kalimantan and Sumatra in terms of
deforestation rates. The latest data published by the
Ministry of Environment and Forestry (2016) shows that
deforestation in Sulawesi in 2015-2016 reached 85,414.6
ha, increasing 50% from 2014-2015 which was 56,940.3
ha. The largest deforestation occurred in conservation areas
which reached 64,406.4 ha (75.4%) while the rest (24.6%)
is in the other designation areas. Viewed from forest
condition, the largest deforestation occurred in secondary
forest which reached 67,497.5 ha (79.02%), while in
primary forest it was 17,917.1 ha (20.98%). Primary forest
cover in Sulawesi in 2016 was left with 3,892,900 ha,
while secondary forest was 5,328,300 ha.
North Sulawesi is the province in Sulawesi with the
least forest cover with only 555,300 ha, covering 243,000
ha of primary forest and 312,300 ha of secondary forest.
Among those forest cover, 507,800 ha is inside
conservation areas and the remaining of 47,500 in the other
designation areas. Nonetheless, the extent of deforestation
in this region is quite worrying. In 2015-2016 deforestation
in North Sulawesi was recorded at 2,352.5 ha, an increase
of 1,307.6 ha (125.1%) compared to deforestation in 2014-
2015. The largest deforestation occurred in conservation
areas which reached 1,838.5 ha (78.2%), while in the other
designation areas it was 514 ha (21.8%). Deforestation in
secondary forests reached 1,584.6 ha (67.4%), while in
primary forest 768 ha (32.6%).
Forest cover that tends to decrease does not only reduce
the biodiversity level, but also affects global climate and
other natural disasters. Forest patches outside conservation
areas are among those that are particularly vulnerable to
degradation and deforestation, especially in the other
designation areas and forests that are not protected by
customary/local laws. In North Sulawesi, forest patches in
a small area (<10ha) are common. Usually, it is located in
the middle of a stretch of people's gardens, the banks of
rivers and lakes, small hills and on the sidelines or valley of
hills as a gallery forest.
In order to determine the condition of stands including
species diversity, structure and type of community, an
analysis of tree vegetation in several forest patches found
in East Bolaang Mongondow and Southeast Minahasa
Districts, North Sulawesi Province was carried out. This
vegetation data is very important as a basis for the use and
conservation of biodiversity and other natural resources
(Kartawinata 2013).
MATERIALS AND METHODS
Study site
The study was conducted from July 26 to August 14,
2017 in natural forest areas including Kotabunan
Subdistrict, East Bolaang Mongondow District and
Ratatotok Subdistrict, Southeast Minahasa District, North
Sulawesi Province (Figure 1). Natural forests in these
regions have been transformed into plantations, secondary
forests and shrubs. Primary forests that are relatively
undisturbed are generally found in the form of forest
patches on small hills and in crevices of hills. The largest
extent of forest in East Bolaang Mongondow District is in
Linelean tropical forest area where there is Garini
waterfall. Five patches of forest that still have tree
vegetation with different environmental characteristics
were selected for research, namely: (i) Bukaka Forest (N
00o 51` 59.1``; E 124o 36` 43.5``) at an elevation of 400 m
asl. located in Bukaka Village, Kotabunan Subdistrict, East
Bolaang Mongondow District. (ii) Garini Forest (N 00o 52`
33.9``; E 124o 36` 31.4”) at an elevation of 500-625 m asl.
located in Bukaka Village, Kotabunan Subdistrict, East
Bolaang Mongondow District. (iii) Lambak Forest (N 00o
54` 15`3``; E 124o 39` 16.0``) at an elevation of 527 m asl.
located in Buyat I Village, Kotabunan Subdistrict, East
Bolaang Mongondow District. It is a patch of forest
surrounded by fields, mixed gardens and shrubs. (iv)
Soyowan Forest (N 00o 54` 57.8``; E 124o 42` 39. 3``) at an
elevation of 352 m asl. located in Soyowan Village,
Ratatotok Subdistrict, Southeast Minahasa District. It is a
gallery forest on hillside worship. (v) Basaan Forest (N 00o
53` 54.6``; E 124o 43` 18. 2``) at an elevation of 22 m asl.
located in Basaan Village, Ratatotok Subdistrict, Southeast
Minahasa District. Forests on small hills bordering
residential and mixed gardens.
Two closest climate stations namely Bukaka and
Soyowan were chosen to collect climatic data at the study
sites. Rainfall and temperature data in both locations are
presented in Figure 2. Based on the Köppen-Geiger climate
classification, both locations are classified as Af. The
annual rainfall in Bukaka is 2284 mm, while in Soyowan is
2226 mm. The average temperature are 22.8oC and, 24.3oC
in Bukaka and Soyowan, respectively (Climate-Data.Org.
2018). The topography is hilly to mountainous. The
geology in Bukaka, Garini and Lambak consist of
Bilungala volcanic rock formations which are dominated
by intermediate igneous rocks to acidic (bright), such as:
diorite, granodiorite and granite. Basaan consists of
Ratatotok limestone formations, while Soyowan is located
in the northern part of Ratatotok limestone formation which
borders the Bilungala volcanic rock formation (Kalangi et
al. 2009).
Vegetation sampling
The study was conducted using point center quarter
method (Mueller-Dombois and Ellenberg 1974). A total of
42 points were sampled from five locations, respectively:
Garini 20 points, Lambak 10 points, Soyowan 6 points,
Bukaka 3 points and Basaan 3 points. Sampling was
stopped if straight direction of the transect no longer found
individual trees or was only covered with shrubs or mixed
gardens. In Garini, sampling started from the edge of the
forest towards the Garini waterfall. The X axis at each site
pointed north-south (0o-180o) and Y-axis pointed east-west
direction (90o-270o) with distance between the center points

SIREGAR et al. – Forest patches in North Sulawesi
645
was 20 m. The closest tree in each quadrant was measured
trunk diameter at breast height (dbh), total height and
distance to the center of the quadrant. Leaf specimens were
taken for identification purposes.
Figure 1. Map of research location in East Bolaang Mongondow District (Bukaka, Garini, Lambak) and Southeast Minahasa District
(Soyowan, Basaan), North Sulawesi Province, Indonesia
Figure 2. Rainfall and temperature at the research locations. A Bukaka, East Bolaang Mongondow District, B. Soyowan, Bolaang
Mongondow District, North Sulawesi Province, Indonesia (source: climate-data.org. 2018)

B IODIVERSITAS 20 (3): 643-655, March 2019
646
A B C
Figure 3. A. Shannon-Wiener diversity index (H`), B. Dominance index (D), C. Species evenness index (expH/S) in each location of in
North Sulawesi, Indonesia
Data analysis
Density and dominance of tree species at each location
were calculated following the Mueller-Dombois and
Ellenberg (1974) method. The absolute density (Dab) in
each location was calculated using the formula: Dab =
100/(Dav)2, where Dab is absolute density or Density/100
m2, while Dav is the average distance of the entire tree to
the center of the quadrant. The dominance or basal area
absolute (Bab) was obtained from the multiplication of the
average value of the basal area of the entire tree with the
number of trees in one location.
Tree density level of each species (Di) in each location
was calculated using the formula: Di = (Di/q) x Dab, where
(Di/q) is the number of species i divided by the number of
quadrants in one location. The dominance or basal area of
each species (Bi) in each location is calculated by the
formula Bi = Davi x Dab, where Davi is the average
distance of species i to the center point of the quadrant.
Level of importance of species in each location was
calculated based on the species importance value (SIV)
which is the aggregation of relative values of frequency,
density and dominance. Frequency is the percentage of the
number of points where a species found. Level of
importance of family in each location was calculated using
the method by Mori et al. (1983) based on the family
importance value (FIV) which is aggregation of relative
values of the number of species, density and dominance of
each family.
Alpha diversity was analyzed based on Shannon-
Wiener diversity index (H`), evenness index (E) and
dominance index (D), while beta diversity was assessed
based on similarity index of Jaccard (ISj) and beta diversity
index (Whittaker's index). Community type was
determined based on the results of cluster analysis based on
species abundance in each location. All of these analyzes
used PAST software program (paleontological Statistics)
version 3:04 (Hammer 2014).
RESULTS AND DISCUSSION
Diversity
Results of sampling data in five research locations show
that there were 84 species of trees (dbh ≥ 10 cm) belong to
59 genera and 35 families. The highest number of species
was found in Garini (37 species), followed by Lambak (25
species), Soyowan (19 species), Bukaka (10 species) and
Basaan (7 species). The Shannon-Wiener diversity index
(H`) in each location also shows the same pattern. The
highest value is in Garini (H` = 3.3720) which belongs to
high category, followed by Lambak (H` = 2.8760),
Soyowan (H` = 2.8460), Bukaka (H` = 2.2540), and Basaan
(H` = 1.6990) which categorized as medium. On the
contrary, the highest dominance index is found in Basaan
(D = 0.2362), followed by Bukaka (D = 0.1111), Lambak
(D = 0.0875), Soyowan (D = 0.0660) and Garini (D =
0.0431). In term of species evenness index (E), the highest
value is found in Bukaka (E = 0.9524), followed by
Soyowan (E = 0.9061), Garini (E = 0.7873), Basaan (E =
0.7809) and Lambak (E = 0.7099) (Figure 3).
The high dominance index in Basaan is mainly due to
the abundance of Streblus ilicifolius with relative density of
41.7%. Together with Dracontomelon dao, they dominate
58.3% of tree population in Basaan. In Garini, two most
abundant species are Oreocnide integrifolia and Myristica
elliptica which dominate the population of 17.5%. Two
most abundant species in Lambak are Boehmeria
cylindrica and Cratoxylum sumatranum which control
35.0% of the tree population. Bukaka is dominated by
Syzygium leucocladum and Ficus sp. which controls 33.3%
of the tree population, while in Soyowan it is dominated by
D. dao and Pterospermum javanicum which controls
25.0% of the tree population.
The important species based on species importance
value (SIV) in each location can be seen in Table 1. The
important species in Bukaka is Ficus sp. (SIV = 52.17), in
Garini is Octomeles sumatrana (SIV = 25.73), in Lambak

SIREGAR et al. – Forest patches in North Sulawesi
647
is B. cylindrica (SIV = 65.03), in Basaan and Soyowan is
D. dao with SIV of 96.87 and 46.46, respectively.
Variations of the five most important species in across
locations are relatively high. Only two species are among
the five most important species in two different locations,
namely D. dao in Basaan and Soyowan, and Cananga
odorata in Bukaka and Garini.
Based on its basal area, the most dominant species in
Bukaka is Litsea dilleniifolia with basal area of 3.87 m2 ha-
1, in Garini is O. sumatrana (7.56 m2 ha-1), in Lambak is B.
cylindrica (7.41 m2 ha-1), and in Basaan and Soyowan is D.
dao (29.93 and 5.11 m2 ha-1, respectively). In term of
distribution of species based on frequency (RFi), the most
widespread species of distribution in Bukaka are Ficus sp.
and S. leucocladum who has an RFi of 16.67%. The most
extensive species of distribution in Garini is O. integrifolia
(RFi = 8.60%), in Lambak is B. cylindrica (RFi = 18.42%),
in Basaan are D. dao and S. ilicifolius with RFi = 22.22%
and in Soyowan is D. dao (RFi = 13.64%).
Beta diversity based on the species similarity index
across locations also has relatively low value. The highest
similarity index (IS Jaccard) is shown between Garini and
Soyowan (ISj = 0.1200), followed by Lambak-Soyowan
(ISj = 0.1000), Bukaka-Soyowan (ISj = 0.0741), Garini-
Lambak (ISj = 0.0690), Soyowan-Basaan (ISj = 0400),
Lambak-Basaan (ISj = 0.0323), Lambak-Bukaka (ISj =
0.0294), Garini-Basaan (ISj = 0.0233) and Garini-Bukaka
(ISj = 0.0217). Basaan and Bukaka have no similarities at
all (ISj = 0). To put into perspective, Mueller-Dombois and
Ellenberg (1974) state that Jaccard similarity index above
50% (0.50) are considered as very large.
The result of beta diversity index based on Whittaker's
index shows that changes in species composition from one
location to another are also relatively high, indicated by the
value of index that closes to one (Table 2). Locations that
are relatively similar is between Garini and Soyowan, yet
the index is still relatively large (0.7857). Beta diversity
index value ranges from 0 to 1. The value of 0 means the
minimum beta diversity, where there is no change in
species composition from location 1 to location 2. On the
contrary, the value of 1, or maximum beta diversity, means
that species composition from location 1 to location 2 is
totally different (Tothmeresz 2013).
Table 1. Relative density (RDi), relative dominance (RBi), relative frequency (RFi) and species importance value (SIV) of each species
in each study site of North Sulawesi, Indonesia
Species Family RDi RBi RFi SIV
Bukaka
Ficus sp. Moraceae 16.67 18.83 16.67 52.17 Syzygium leucocladum Merr. & L.M.Perry Myrtaceae 16.67 6.76 16.67 40.09 Litsea dilleniifolia P.Y. Pai & P.H. Huang Lauraceae 8.33 18.46 8.33 35.12 Ficus arfakensis King Moraceae 8.33 18.05 8.33 34.71 Cananga odorata (Lam.) Hook.f. & Thomson Annonaceae 8.33 15.32 8.33 31.99 Melodinus cochinchinensis (Lour.) Merr. Apocynaceae 8.33 7.66 8.33 24.33 Pterospermum javanicum Jungh. Malvaceae 8.33 5.03 8.33 21.70 Piper aduncum L. Piperaceae 8.33 3.65 8.33 20.31 Pandanus sp. Pandanaceae 8.33 3.29 8.33 19.96 Tetracera scandens (L.) Merr. Dilleniaceae 8.33 2.95 8.33 19.62
Garini
Octomeles sumatrana Miq. Datiscaceae 6.25 14.10 5.38 25.73 Oreocnide integrifolia (Gaudich.) Miq. Urticaceae 10.00 6.47 8.60 25.07 Barringtonia racemosa (L.) Spreng. Lecythidaceae 6.25 8.76 5.38 20.39 Myristica elliptica Wall. Myristicaceae 7.50 3.16 6.45 17.11 Cananga odorata (Lam.) Hook.f. & Thomson Annonaceae 5.00 6.82 4.30 16.12 Croton sp. Euphorbiaceae 2.50 11.08 2.15 15.73 Citronella moorei (F.Muell. ex Benth.) R.A.Howard Cardiopteridaceae 6.25 3.06 5.38 14.68 Horsfieldia costulata Warb. Myristicaceae 2.50 5.98 4.30 12.78 Ficus sp.1 Moraceae 2.50 7.12 2.15 11.77 Fontanesia sp. Oleaceae 3.75 3.63 3.23 10.60 Dracontomelon dao (Blanco) Merr. & Rolfe Anacardiaceae 2.50 4.43 2.15 9.08 Euhporbiaceae 3 Euphorbiaceae 2.50 4.33 2.15 8.98 Ziziphus borneensis Merr. Rhamnaceae 3.75 1.90 3.23 8.88 Neonauclea glabra (Roxb.) Bakh.f. & Ridsdale Rubiaceae 1.25 0.08 7.53 8.85 Talipariti tiliaceum (L.) Fryxell Malvaceae 3.75 0.52 3.23 7.50 Pometia pinnata J.R.Forst. & G.Forst. Sapindaceae 1.25 0.77 5.38 7.40 Alstonia scholaris (L.) R. Br. Apocynaceae 2.50 2.72 2.15 7.37 Dictyoneura acuminata Blume Sapindaceae 1.25 3.43 1.08 5.75 Diospyros pentamera (F.Muell.) Woods & F.Muell. Ebenaceae 1.25 3.09 1.08 5.42 Oreocnide rubescens (Blume) Miq. Urticaceae 2.50 0.72 2.15 5.37 Chionanthus ramiflorus Roxb. Oleaceae 2.50 0.70 2.15 5.35 Orophea sp. Annonaceae 2.50 0.51 2.15 5.16 Cryptocarya ferrea Blume Lauraceae 2.50 0.28 2.15 4.93

B IODIVERSITAS 20 (3): 643-655, March 2019
648
Ficus magnoliifolia Blume Moraceae 1.25 2.55 1.08 4.88 Uvaria chamae P.Beauv. Annonaceae 1.25 0.08 2.15 3.48 Euphorbiaceae 1 Euphorbiaceae 1.25 1.08 1.08 3.41 Euphorbiaceae 2 Euphorbiaceae 1.25 0.58 1.08 2.91 Parashorea malaanonan Merr. Dipterocarpaceae 1.25 0.48 1.08 2.81 Meliosma pinnata (Roxb.) Maxim. Sabiaceae 1.25 0.36 1.08 2.69 Baccaurea racemosa (Reinw. ex Blume) Müll.Arg. Phyllanthaceae 1.25 0.24 1.08 2.56 Gardenia sp. Rubiaceae 1.25 0.17 1.08 2.50 Magnolia vrieseana (Miq.) Baill. ex Pierre Magnoliaceae 1.25 0.15 1.08 2.48 Licania sp. Chrysobalanaceae 1.25 0.15 1.08 2.48 Kopsia pauciflora Hook.f. Apocynaceae 1.25 0.14 1.08 2.46 Mallotus cumingii Müll.Arg. Euphorbiaceae 1.25 0.14 1.08 2.46 Syzygium lineatum (DC.) Merr. & L.M.Perry Myrtaceae 1.25 0.12 1.08 2.45 Dendrocnide stimulans (L.f.) Chew Urticaceae 1.25 0.08 1.08 2.40
Lambak Boehmeria cylindrica (L.) Sw. Urticaceae 22.50 24.11 18.42 65.03 Cratoxylum sumatranum (Jack) Blume Hypericaceae 12.50 12.04 13.16 37.70 Falcataria moluccana (Miq.) Barneby & J.W.Grimes Leguminosae 2.50 14.23 2.63 19.37 Hibiscus tilliaceus L. Malvaceae 7.50 2.44 7.89 17.84 Artocarpus elasticus Reinw. ex Blume Moraceae 5.00 5.09 5.26 15.35 Cananga odorata (Lam.) Hook.f. & Thomson Annonaceae 2.50 5.43 2.63 10.56 Litsea machilifolia Gamble Lauraceae 2.50 5.17 2.63 10.31 Glochidion candolleanum (Wight & Arn.) Chakrab. & M.Gangop. Phyllanthaceae 2.50 3.77 2.63 8.90 Psychotria viridis Ruiz & Pav. Rubiaceae 2.50 3.77 2.63 8.90 Aglaia cumingiana Turcz. Meliaceae 2.50 2.41 2.63 7.55 Kibara coriacea (Blume) Hook. f. & A. Thomps. Monimiaceae 2.50 2.41 2.63 7.55 Dysoxylum gaudichaudianum (A.Juss.) Miq. Meliaceae 2.50 2.41 2.63 7.55 Unidentified 1 - 2.50 2.41 2.63 7.55 Ficus cumingii Miq. Moraceae 2.50 1.92 2.63 7.06 Horsfieldia costulata Warb. Myristicaceae 2.50 1.92 2.63 7.06 Oreocnide integrifolia (Gaudich.) Miq. Urticaceae 2.50 1.42 2.63 6.55 Moraceae Moraceae 2.50 1.36 2.63 6.49 Myristica iners Blume Myristicaceae 2.50 1.11 2.63 6.24 Saurauia pendula Blume Actinidiaceae 2.50 1.03 2.63 6.16 Saurauia leucocarpa Schltdl. Actinidiaceae 2.50 1.00 2.63 6.13 Litsea umbellata (Lour.) Merr. Lauraceae 2.50 1.00 2.63 6.13 Caryota no Becc. Arecaceae 2.50 1.00 2.63 6.13 Dracontomelon dao (Blanco) Merr. & Rolfe Anacardiaceae 2.50 0.89 2.63 6.02 Macaranga gigantea (Rchb.f. & Zoll.) Müll.Arg. Euphorbiaceae 2.50 0.84 2.63 5.97 Kayu rupa (nama lokal) - 2.50 0.79 2.63 5.92
Basaan Dracontomelon dao (Blanco) Merr. & Rolfe Anacardiaceae 16.67 57.98 22.22 96.87 Streblus ilicifolius (Vidal) Corner Moraceae 41.67 10.64 22.22 74.53 Ficus sp.3 Moraceae 8.33 18.07 11.11 37.51 Bixa orellana L. Bixaceae 8.33 6.06 11.11 25.50 Ficus tinctoria G.Forst. Moraceae 8.33 3.76 11.11 23.20 Ficus sp.2 Moraceae 8.33 2.69 11.11 22.14 Ficus trichopoda Baker Moraceae 8.33 0.80 11.11 20.25
Soyowan Dracontomelon dao (Blanco) Merr. & Rolfe Anacardiaceae 12.50 20.32 13.64 46.46 Pterospermum javanicum Jungh. Malvaceae 12.50 7.61 9.09 29.20 Neolamarckia cadamba (Roxb.) Bosser Rubiaceae 8.33 8.31 4.55 21.18 Dictyoneura acuminata Blume Sapindaceae 4.17 11.99 4.55 20.70 Thottea tomentosa (Blume) Ding Hou Aristolochiaceae 4.17 11.36 4.55 20.07 Endiandra sp. Lauraceae 4.17 9.85 4.55 18.57 Meliaceae Meliaceae 4.17 6.92 4.55 15.64 Cananga odorata (Lam.) Hook.f. & Thomson Annonaceae 4.17 5.76 4.55 14.48 Ardisia purpurea Reinw. ex Blume Primulaceae 4.17 3.58 4.55 12.29 Kayu bugis (nama lokal) - 4.17 3.00 4.55 11.71 Heritiera longipetiolata Kaneh. Malvaceae 4.17 2.46 4.55 11.18 Canarium asperum Benth. Euphorbiaceae 4.17 2.05 4.55 10.76 Diospyros cauliflora Blume Ebenaceae 4.17 1.79 4.55 10.50 Euphorbiaceae 4 Euphorbiaceae 4.17 1.55 4.55 10.27 Myristica elliptica Wall. Myristicaceae 4.17 1.18 4.55 9.89 Macaranga gigantea (Rchb.f. & Zoll) Mull.Arg. Euphorbiaceae 4.17 0.77 4.55 9.48 Oreocnide integrifolia (Gaudich.) Miq. Urticaceae 4.17 0.75 4.55 9.46 Oreocnide rubescens (Blume) Miq. Urticaceae 4.17 0.48 4.55 9.19 Mallotus floribundus (Blume) Müll.Arg. Euphorbiaceae 4.17 0.27 4.55 8.98

SIREGAR et al. – Forest patches in North Sulawesi
649
Table 2. Matrix of beta diversity of Whittaker’s index based on
species abundance in between two locations of North Sulawesi,
Indonesia
Location Bukaka Garini Lambak Basaan
Garini 0.9575 Lambak 0.9429 0.8710 Basaan 1.0000 0.9546 0.9375 Soyowan 0.8621 0.7857 0.8182 0.9231
Table 3. Thhree most important families based on Family
Important Values (FIV) in each location of North Sulawesi,
Indonesia
Location Family RDf RBf RSf FIV
Bukaka Moraceae 25.00 36.88 20.00 81.88
Lauraceae 8.33 18.46 10.00 36.79
Annonaceae 8.33 15.32 10.00 33.65
Garini Euphorbiaceae 8.75 17.21 13.51 39.48
Urticaceae 13.75 7.26 8.11 29.12
Myristicaceae 10.00 9.15 5.41 24.55
Lambak Urticaceae 22.50 24.11 4.00 50.61
Moraceae 10.00 8.37 12.00 30.37
Hypericaceae 12.50 12.04 4.00 28.54
Basaan Moraceae 75.00 35.96 71.43 182.39
Anacardiaceae 16.67 57.98 14.29 88.94
Bixaceae 8.33 6.06 14.29 28.67
Soyowan Euphorbiaceae 16.67 4.64 21.05 42.36
Anacardiaceae 12.50 20.32 5.26 38.09
Malvaceae 16.67 10.07 10.53 37.27
Note: RDf: Relatif Density, RBf: Relatif Dominansi, RSf: Relatif
number of species, FIV: Family importance value
Analysis at family level shows that Moraceae,
Malvaceae, Anacardiaceae, Annonaceae and Lauraceae are
the most widely distributed family, each of which is found
in four locations with a relatively high population. Other
families frequently found in abundance are Euphorbiaceae
and Urticaceae which is found in three different locations.
Family importance value (FIV) which is the sum of relative
density (RDf), relative dominance (RBf) and relative
number of species (RSf), shows that Moraceae appears as
the most important family in Bukaka and Basaan with FIV
of 81.8 and 182.39, respectively. Moraceae is also an
important family after Urticaceae in Lambak.
Euphorbiaceae is the most important family in Garini and
Soyowan with FIV of 39.48 and 42.36, respectively (Table
3). Based on basal area, the most dominant family in
Bukaka is Moraceae with basal area of 7.74 m2 ha-1, in
Garini is Euphorbiaceae (9.22 m2 ha-1), in Lambak is
Urticaceae (7.85 m2 ha-1) and in Basaan and Soyowan is
Anacardiaceae with basal area of 29.93 and 0.20 m2 ha-1,
respectively.
Forest structure
The highest tree density is found in Bukaka with 721
trees ha-1, followed by Lambak (482 trees ha-1), Basaan
(439 trees ha-1), Garini (292 trees ha-1) and Soyowan (164
trees ha-1). In term of basal area, the largest total basal area
is found in Garini (53.59 m2 ha-1), followed by Basaan
(51.62 m2 ha-1), Lambak (30.74 m2 ha-1), Soyowan (25.13
m2 ha-1) and Bukaka (20.98 m2 ha-1). The average basal
area per tree is also the largest in Garini (0.1833 m2), but
Soyowan ranks second (0.1535 m2), then Basaan (0.1177
m2), Lambak (0.0638 m2) and Bukaka (0.0291 m2). These
results suggest that tree density in Garini is relatively low,
but the trees in there have larger average dbh (40.6 cm).
Similar result is also found at Soyowan. In contrast, tree
density in Bukaka is high, but the average dbh is smaller
(18.1 cm). The average dbh in Basaan is 30.8 cm, whereas
in Lambak is 26.1 cm.
The distribution of dbh classes in five research
locations resembles a letter `J` inverted shape. Trees are
abundant in small dbh classes and the number of
individuals is reduced in larger dbh classes. The shape of
this curve is the characteristic of tropical forests (Hartshon
1980, Proctor et al. 1983, Whitmore 1986; Abdulhadi et al.
1991, Kartawinata et al. 2004, Aigbe and Omokhua 2014),
implying that tree regeneration going well (Priatna et al.
2006, Suwardi et al. 2013). Bukaka seems to only be
inhabited by small trees with dbh less than 30 cm. On the
other hand, Soyowan is dominated by large trees with trees
dbh above 40 cm comprise 46% of stands, while medium
trees (dbh 20-40 cm) slightly decrease comprising 33%,
and trees with dbh 10-20 cm only comprise 21% of stands.
A similar pattern is also found in Garini which shows
abundant number of trees in large dbh (dbh> 40 cm) and
medium (dbh 20-40 cm) which is 36% each, while trees
with small dbh (dbh 10-20 cm) comprise of 28%. Lambak
forest is generally dominated by medium-sized trees (dbh
20-40 cm), which is as much as 50%, whereas in Basaan
the trees dbh classes are in balance with medium (dbh 20-
40 cm) and small (dbh 10-20 cm) comprise 42% of stands
(Figure 4).
The biggest tree in Garini is Croton sp. with 108 cm in
dbh. Other species that have dbh of more than 90 cm are O.
sumatrana, Barringtonia racemosa, Horsfieldia costulata
and C. odorata. The largest tree in Soyowan is Dictyoneura
acuminata with dbh of 75.0 cm and Thottea tomentosa with
dbh of 73.0 cm. In Basaan, the largest tree is D. dao with
dbh of 98.0 cm. Other species generally have dbh no more
than 60 cm. The largest tree found in Lambak is even
smaller, only Falcataria moluccana which has 68.0 cm
dbh, even in Bukaka the largest is only 28.6 cm owned by
L. dilleniifolia.
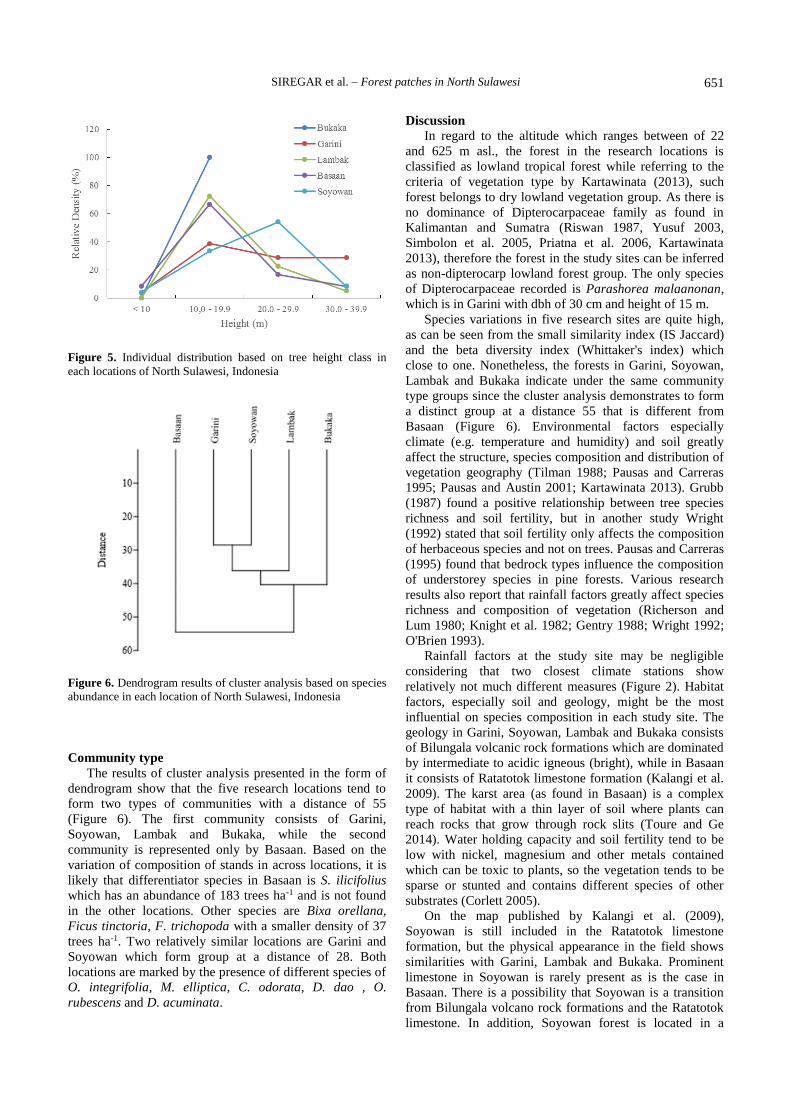
The vertical structure of the forest analyzed based on
tree height generally shows the highest density in canopy
height classes of 10.0-19.9 m. This pattern is found in
Bukaka, Garini, Lambak and Basaan, while in Soyowan the
highest density is found in the high canopy class 20.0-29.9
m (Figure 5).

B IODIVERSITAS 20 (3): 643-655, March 2019
650
A B C
D E
Figure 4. Distribution of individual trees based on dbh classes in each location of North Sulawesi, Indonesia. A. Bukaka, B. Garini, C.
Lambak, D. Basaan, E. Soyowan
The canopy layer in Garini tends to be evener. The
upper layers (30.0-39.9 m) are inhabited by Citronella
moorei, D. acuminata, Diospyros pentamera, Ficus
magnoliifolia, H. costulata, M. elliptica, O. sumatrana,
Oreocnide rubescens and Pometia pinnata with emergent
trees of Barringtonia racemose, C. odorata, D. dao and O.
sumatrana. In the middle layer (20.0-29.9 m), among
others, are inhabited by Alstonia scholaris, Magnolia
vrieseana, O. integrifolia, Ziziphus borneensis and species
that also inhabit the upper layers such as B. racemose, C.
odorata, C. moorei and M. elliptica. In the lower layer
(10.0-19.9 m) is mainly inhabited by O. integrifolia,
Talipariti tiliaceum, B. racemose, Chionanthus ramiflorus,
Cryptocarya ferrea, Dendrocnide stimulans and young
trees of the upper layers.
In Soyowan, the densest layer is at canopy heights 20.0-
29.9 m, being inhabited by Neolamarckia cadamba, D.
dao, Heritiera longipetiolata, Ardisia purpurea, P.
javanicum and T. tomentosa. Emergent species with height
above 30 m include D. acuminata and Endiandra sp.,
whereas in the lower layers of canopy are inhabited by O.
integrifolia, Diospyros cauliflora, Canarium asperum,
Mallotus floribundus, M. elliptica and secondary forest
species, Macaranga gigantea.
The density of tree canopies in Lambak and Basaan
drops dramatically as the tree height class rises. The
emergent trees comprise no more than 10% of existing
stands. Even in Bukaka, the tallest tree is only 18 m, which
is Ficus arfakensis. The vertical structure of the forest in
Lambak and Basaan is relatively similar. The top layer of
the canopy (30.0-39.9 m) in Lambak is occupied by
Psychotria viridis and C. odorata. In the middle layer
(20.0-29.9 m) is occupied by Aglaia cumingiana, B.
cylindrical, C. sumatranum, Dysoxylum gaudichaudianum,
F. moluccana, P. viridis and C. odorata. In the lower layer
(10.0-19.9 m), B. cylindrical and C. sumatranum are still
abundant and mixed with other species. As many as 76% of
the tree species found in Lambak inhabit the bottom layer.
Two species of the upper layers (P. viridis and C. odorata)
are not found in the lower layers.
In Basaan, the top layer of the canopy (30.0-39.9 m) is
inhabited by D. dao . This species is also prominent in the
middle layer (20.0-29.9 m) together with Ficus sp. Species
from Moraceae family appear to dominate the lower layers
such as S. ilicifolius, Ficus tinctoria and Ficus trichopoda.
Some young D. dao species are also found in the lower
layers.
SIREGAR et al. – Forest patches in North Sulawesi
651
Figure 5. Individual distribution based on tree height class in
each locations of North Sulawesi, Indonesia
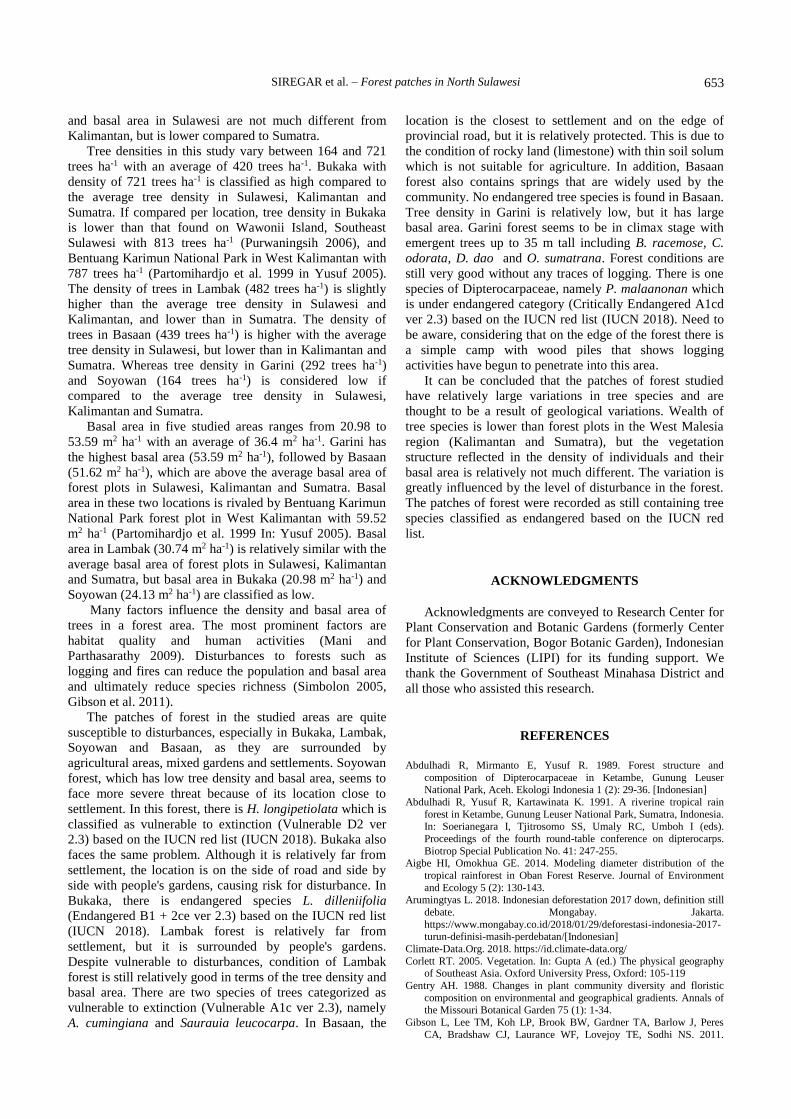
Figure 6. Dendrogram results of cluster analysis based on species
abundance in each location of North Sulawesi, Indonesia
Community type
The results of cluster analysis presented in the form of
dendrogram show that the five research locations tend to
form two types of communities with a distance of 55
(Figure 6). The first community consists of Garini,
Soyowan, Lambak and Bukaka, while the second
community is represented only by Basaan. Based on the
variation of composition of stands in across locations, it is
likely that differentiator species in Basaan is S. ilicifolius
which has an abundance of 183 trees ha-1 and is not found
in the other locations. Other species are Bixa orellana,
Ficus tinctoria, F. trichopoda with a smaller density of 37
trees ha-1. Two relatively similar locations are Garini and
Soyowan which form group at a distance of 28. Both
locations are marked by the presence of different species of
O. integrifolia, M. elliptica, C. odorata, D. dao , O.
rubescens and D. acuminata.
Discussion
In regard to the altitude which ranges between of 22
and 625 m asl., the forest in the research locations is
classified as lowland tropical forest while referring to the
criteria of vegetation type by Kartawinata (2013), such
forest belongs to dry lowland vegetation group. As there is
no dominance of Dipterocarpaceae family as found in
Kalimantan and Sumatra (Riswan 1987, Yusuf 2003,
Simbolon et al. 2005, Priatna et al. 2006, Kartawinata
2013), therefore the forest in the study sites can be inferred
as non-dipterocarp lowland forest group. The only species
of Dipterocarpaceae recorded is Parashorea malaanonan,
which is in Garini with dbh of 30 cm and height of 15 m.
Species variations in five research sites are quite high,
as can be seen from the small similarity index (IS Jaccard)
and the beta diversity index (Whittaker's index) which
close to one. Nonetheless, the forests in Garini, Soyowan,
Lambak and Bukaka indicate under the same community
type groups since the cluster analysis demonstrates to form
a distinct group at a distance 55 that is different from
Basaan (Figure 6). Environmental factors especially
climate (e.g. temperature and humidity) and soil greatly
affect the structure, species composition and distribution of
vegetation geography (Tilman 1988; Pausas and Carreras
1995; Pausas and Austin 2001; Kartawinata 2013). Grubb
(1987) found a positive relationship between tree species
richness and soil fertility, but in another study Wright
(1992) stated that soil fertility only affects the composition
of herbaceous species and not on trees. Pausas and Carreras
(1995) found that bedrock types influence the composition
of understorey species in pine forests. Various research
results also report that rainfall factors greatly affect species
richness and composition of vegetation (Richerson and
Lum 1980; Knight et al. 1982; Gentry 1988; Wright 1992;
O'Brien 1993).
Rainfall factors at the study site may be negligible
considering that two closest climate stations show
relatively not much different measures (Figure 2). Habitat
factors, especially soil and geology, might be the most
influential on species composition in each study site. The
geology in Garini, Soyowan, Lambak and Bukaka consists
of Bilungala volcanic rock formations which are dominated
by intermediate to acidic igneous (bright), while in Basaan
it consists of Ratatotok limestone formation (Kalangi et al.
2009). The karst area (as found in Basaan) is a complex
type of habitat with a thin layer of soil where plants can
reach rocks that grow through rock slits (Toure and Ge
2014). Water holding capacity and soil fertility tend to be
low with nickel, magnesium and other metals contained
which can be toxic to plants, so the vegetation tends to be
sparse or stunted and contains different species of other
substrates (Corlett 2005).
On the map published by Kalangi et al. (2009),
Soyowan is still included in the Ratatotok limestone
formation, but the physical appearance in the field shows
similarities with Garini, Lambak and Bukaka. Prominent
limestone in Soyowan is rarely present as is the case in
Basaan. There is a possibility that Soyowan is a transition
from Bilungala volcano rock formations and the Ratatotok
limestone. In addition, Soyowan forest is located in a

B IODIVERSITAS 20 (3): 643-655, March 2019
652
valley area flanked by two hills covered with vegetation of
shrubs and people's gardens. In parts of the valley
generally, sedimentation rate and water content in the soil
tend to be higher than in the slope (Siregar 2017). Basaan is
a small hill that consists of limestone appearing on the
surface of the ground and the edges of steep cliffs with thin
soil layer. This difference in habitat characteristics is likely
to have caused the composition of species in Basaan to be
very different from other locations (Pausas and Carreras
1995; Corlett 2005).
Results of cluster analysis show that at a distance of 40
Bukaka forests demonstrate different community types
with Garini, Soyowan and Lambak (Figure 6). It is not
known exactly what causes the species in Bukaka to be
different from other locations, even with nearby Garini.
The only species recorded in Bukaka forest which are also
found in Garini, Lambak and Soyowan is C. odorata. The
striking difference in Bukaka is likely the higher level of
interference. Presumably, this disturbance factor also plays
a role in influencing species composition due to the number
of tree species being cut. It’s location on the side of the
road and in vicinity of people's gardens and shrubs causes
Bukaka forest to be susceptible to human disturbances. The
trees appear to be in young stage as shown in stem
diameter distribution (Figure 4) and the tree height (Figure
5). The forest in Bukaka is recorded to have the highest
density (721 trees ha-1), but the total basal area is the lowest
(20.98 m2 ha-1) with the smallest average dbh (18.1 cm).
The presence of Piper aduncum as a pioneer species that
often grows in disturbed forests, on the edges of forests or
open spaces (Global Invasive Species Database 2018)
further strengthens this assumption.
Based on the phytogeographic zone, Indonesia, Brunei
Darussalam, Philippines, Malaysia, Papua New Guinea,
Singapore and Timor Leste including the Malesia region
which has a distinctive flora that is different from the
surrounding region. The Malesia region is divided into
three phytogeographic provinces, namely (i) West Malesia,
which includes the Malay Peninsula, Sumatra, Borneo and
Philippines, (ii) East Malesia which includes Sulawesi,
Maluku and Papua, and 3) Southern Malesia, which
includes Java, Madura, Bali, Nusa Tenggara and Timor
Leste. Sulawesi is also known as the Wallace region which
is the boundary between East Malesia and West Malesia
(Kartawinata 2013). Eastern Malesia zone generally
contains fewer species, and its structure is not as complex
as vegetation in the West Malesia region such as
Kalimantan and Sumatra. Lowland dipterocarp forests in
western Malesia have generally main canopy layer at a
height of 30-45m with emergent trees up to 60 m tall
(Kartawinata 2013). The more complex vegetation
structure has created an environment suitable for the
growth of various species of plants (Whitmore 1986,
Kartawinata 2013). In one hectare, hundreds of tree species
with dbh > 10cm can be found in various forest plots in
Kalimantan and Sumatra (Riswan 1987; Abdulhadi et al.
1989; Kartawinata et al. 2004; Sambas and Siregar 2004;
Simbolon et al. 2005; Yusuf 2005; Kartawinata 2013). The
highest tree species richness in Kalimantan was recorded in
lowland forest in Malinau, East Kalimantan which contains
205 tree species in one hectare (Sheil et al. 2010).In
Sumatra, the highest tree species richness was recorded in
Batang Gadis National Park, North Sumatra with 184 tree
species in one hectare (Kartawinata et al. 2004). Even in
the Batang Toru forest, North Sumatra, there were 155
species of trees found within only 0.28 ha plot (Sambas,
Siregar 2017). The richness of tree species increases when
the extent of sample plots is expanded. The dipterocarp
lowland forest plots in Samboja East Kalimantan contained
441 tree species in 5 ha plot and increased to 550 species
when the plot was expanded to 10.5 ha (Kartawinata 2010).
Various studies showed that in Sulawesi, the richness of
tree species in the 0.5 ha plot only ranges 40-60 species
(Mansur 2005; Purwaningsih 2006). Several other studies
used a separate plot method with a total area of less than 1
ha, the number of species recorded only 45-98 tree species
(Purwaningsih and Yusuf 2005; Irawan 2011; Suryawan et
al. 2013; Rukmi 2014). Another study in Bogani Nani
Wartabone National Park recorded 132 species of trees in
four separate plots with total area of 0.86 ha. However, if
each plots is sampled separately with an area of 0.20-0.26
ha, there were only 33-61 tree species found per plot
(Polosakan and Siregar 2001). The methodology and size
of the sample plot influence number of species recorded
(Sambas and Siregar 2017). Generally, separating plots
with a wider size of the sampled area can increase species
richness. This is because habitat variations in separate plots
tend to be larger than single plot since tropical forests are
known to vary greatly from place to place (Kartawinata
2013). The ability of species to occupy an area depends on
its ability to adapt optimally to abiotic and biotic factors
(Krebs 1994). Besides phenology, dispersal and mortality
also influence the structure and composition of vegetation
(Kimmins 1987).
The area of research plots in Kalimantan and Sumatra is
far greater than in Sulawesi. This bias will affect the
number of species obtained, yet comparing the structure of
vegetation is still beneficial. The results of previous studies
at 10 locations in Sulawesi (Mansur 2005; Purwaningsih
and Yusuf 2005; Purwaningsih 2006; Suryawan et al. 2013;
Wahyuni and Mokodompit 2016) may describe current
forest condition in Sulawesi. Tree densities in these ten
locations range from 244 to 813 ha-1 trees with an average
of 468 trees ha-1. Basal area ranges from 16.32 to34.80 m2
ha-1 with an average of 26.11 m2 ha-1. On the other hand,
previous studies at 16 locations in Kalimantan
(Kartawinata et al. 1981; Riswan 1987; Yusuf 2003; Yusuf
2005; Simbolon 2005; Simbolon et al. 2005; Sidiyasa
2009; Istomo and Afnani 2014) show that tree densities
range from 313 to 787 ha-1 trees with an average of 465 ha-
1 trees, while ranges of basal area are between 13.6 and
59.5 m2 ha-1 with an average of 27.65 m2 ha-1. In Sumatra,
research results from 7 locations (Abdulhadi et al. 1989;
Sambas and Siregar 1999; Kartawinata et al. 2004; Sambas
and Siregar 1999, 2004; Samsoedin and Heriyanto 2010)
show that tree densities range from 453 to687 ha-1 trees
with an average of 556 ha-1 trees, while the range of basal
area are 22.9-40.9 m2 ha-1 with an average of 30.74 m2 ha-1.
Based on those references, it can be seen that tree density
SIREGAR et al. – Forest patches in North Sulawesi
653
and basal area in Sulawesi are not much different from
Kalimantan, but is lower compared to Sumatra.
Tree densities in this study vary between 164 and 721
trees ha-1 with an average of 420 trees ha-1. Bukaka with
density of 721 trees ha-1 is classified as high compared to
the average tree density in Sulawesi, Kalimantan and
Sumatra. If compared per location, tree density in Bukaka
is lower than that found on Wawonii Island, Southeast
Sulawesi with 813 trees ha-1 (Purwaningsih 2006), and
Bentuang Karimun National Park in West Kalimantan with
787 trees ha-1 (Partomihardjo et al. 1999 in Yusuf 2005).
The density of trees in Lambak (482 trees ha-1) is slightly
higher than the average tree density in Sulawesi and
Kalimantan, and lower than in Sumatra. The density of
trees in Basaan (439 trees ha-1) is higher with the average
tree density in Sulawesi, but lower than in Kalimantan and
Sumatra. Whereas tree density in Garini (292 trees ha-1)
and Soyowan (164 trees ha-1) is considered low if
compared to the average tree density in Sulawesi,
Kalimantan and Sumatra.
Basal area in five studied areas ranges from 20.98 to
53.59 m2 ha-1 with an average of 36.4 m2 ha-1. Garini has
the highest basal area (53.59 m2 ha-1), followed by Basaan
(51.62 m2 ha-1), which are above the average basal area of
forest plots in Sulawesi, Kalimantan and Sumatra. Basal
area in these two locations is rivaled by Bentuang Karimun
National Park forest plot in West Kalimantan with 59.52
m2 ha-1 (Partomihardjo et al. 1999 In: Yusuf 2005). Basal
area in Lambak (30.74 m2 ha-1) is relatively similar with the
average basal area of forest plots in Sulawesi, Kalimantan
and Sumatra, but basal area in Bukaka (20.98 m2 ha-1) and
Soyowan (24.13 m2 ha-1) are classified as low.
Many factors influence the density and basal area of
trees in a forest area. The most prominent factors are
habitat quality and human activities (Mani and
Parthasarathy 2009). Disturbances to forests such as
logging and fires can reduce the population and basal area
and ultimately reduce species richness (Simbolon 2005,
Gibson et al. 2011).
The patches of forest in the studied areas are quite
susceptible to disturbances, especially in Bukaka, Lambak,
Soyowan and Basaan, as they are surrounded by
agricultural areas, mixed gardens and settlements. Soyowan
forest, which has low tree density and basal area, seems to
face more severe threat because of its location close to
settlement. In this forest, there is H. longipetiolata which is
classified as vulnerable to extinction (Vulnerable D2 ver
2.3) based on the IUCN red list (IUCN 2018). Bukaka also
faces the same problem. Although it is relatively far from
settlement, the location is on the side of road and side by
side with people's gardens, causing risk for disturbance. In
Bukaka, there is endangered species L. dilleniifolia
(Endangered B1 + 2ce ver 2.3) based on the IUCN red list
(IUCN 2018). Lambak forest is relatively far from
settlement, but it is surrounded by people's gardens.
Despite vulnerable to disturbances, condition of Lambak
forest is still relatively good in terms of the tree density and
basal area. There are two species of trees categorized as
vulnerable to extinction (Vulnerable A1c ver 2.3), namely
A. cumingiana and Saurauia leucocarpa. In Basaan, the
location is the closest to settlement and on the edge of
provincial road, but it is relatively protected. This is due to
the condition of rocky land (limestone) with thin soil solum
which is not suitable for agriculture. In addition, Basaan
forest also contains springs that are widely used by the
community. No endangered tree species is found in Basaan.
Tree density in Garini is relatively low, but it has large
basal area. Garini forest seems to be in climax stage with
emergent trees up to 35 m tall including B. racemose, C.
odorata, D. dao and O. sumatrana. Forest conditions are
still very good without any traces of logging. There is one
species of Dipterocarpaceae, namely P. malaanonan which
is under endangered category (Critically Endangered A1cd
ver 2.3) based on the IUCN red list (IUCN 2018). Need to
be aware, considering that on the edge of the forest there is
a simple camp with wood piles that shows logging
activities have begun to penetrate into this area.
It can be concluded that the patches of forest studied
have relatively large variations in tree species and are
thought to be a result of geological variations. Wealth of
tree species is lower than forest plots in the West Malesia
region (Kalimantan and Sumatra), but the vegetation
structure reflected in the density of individuals and their
basal area is relatively not much different. The variation is
greatly influenced by the level of disturbance in the forest.
The patches of forest were recorded as still containing tree
species classified as endangered based on the IUCN red
list.
ACKNOWLEDGMENTS
Acknowledgments are conveyed to Research Center for
Plant Conservation and Botanic Gardens (formerly Center
for Plant Conservation, Bogor Botanic Garden), Indonesian
Institute of Sciences (LIPI) for its funding support. We
thank the Government of Southeast Minahasa District and
all those who assisted this research.
REFERENCES
Abdulhadi R, Mirmanto E, Yusuf R. 1989. Forest structure and
composition of Dipterocarpaceae in Ketambe, Gunung Leuser National Park, Aceh. Ekologi Indonesia 1 (2): 29-36. [Indonesian]
Abdulhadi R, Yusuf R, Kartawinata K. 1991. A riverine tropical rain
forest in Ketambe, Gunung Leuser National Park, Sumatra, Indonesia. In: Soerianegara I, Tjitrosomo SS, Umaly RC, Umboh I (eds).
Proceedings of the fourth round-table conference on dipterocarps.
Biotrop Special Publication No. 41: 247-255. Aigbe HI, Omokhua GE. 2014. Modeling diameter distribution of the
tropical rainforest in Oban Forest Reserve. Journal of Environment
and Ecology 5 (2): 130-143. Arumingtyas L. 2018. Indonesian deforestation 2017 down, definition still
debate. Mongabay. Jakarta.
https://www.mongabay.co.id/2018/01/29/deforestasi-indonesia-2017-turun-definisi-masih-perdebatan/[Indonesian]
Climate-Data.Org. 2018. https://id.climate-data.org/
Corlett RT. 2005. Vegetation. In: Gupta A (ed.) The physical geography of Southeast Asia. Oxford University Press, Oxford: 105-119
Gentry AH. 1988. Changes in plant community diversity and floristic
composition on environmental and geographical gradients. Annals of the Missouri Botanical Garden 75 (1): 1-34.
Gibson L, Lee TM, Koh LP, Brook BW, Gardner TA, Barlow J, Peres
CA, Bradshaw CJ, Laurance WF, Lovejoy TE, Sodhi NS. 2011.

B IODIVERSITAS 20 (3): 643-655, March 2019
654
Primary forests are irreplaceable for sustaining tropical biodiversity.
Nature 478 (7369): 378-381.
Global Invasive Species Database. 2018. Piper aduncum. http://issg.org/database/species/ecology.asp?si=332&fr=1&sts=&lang
=EN
Grubb PJ. 1987. Global trends species-richness in terrestrial vegetation: a view from the northern hemisphere. In: Gee JMR, Giller PS (eds)
Organisation of communities, past and present. Symposium of British
Ecological Society 27: 99-118. Blackwell Scientific Publications, Oxford.
Forest Watch Indonesia. 2011. Portrait of the state of Indonesian forests
for the 2002-2009 period. 1st edition. [Indonesian] Gaveau DLA, Sheil D, Yaen H, Salim MA, Arjasakusuma S, Ancrenaz M,
Pacheco P, Meijaard E. 2016. Rapid conversions and avoided
deforestation: examining four decades of industrial plantation expansion in Borneo. Scientific Reports. 6:32017. DOI:
10.1038/srep32017
Gaveau DLA, Locatelli B, Salim MA, Yaen H, Pacheco P, Sheil D. 2018. Rise and fall of forest loss and industrial plantations in Borneo (2000-
2017). Policy Perspective. Conservation Letters. A Journal of The
Society for Conservation Biology. DOI: 10.1111/conl.12622. Hansen MC, Potapov PV, Moore R, Hancher M, Turubanova SA,
Tyukavina A, Thau D, Stehman SV, Goetz SJ, Loveland TR,
Kommareddy A, Egorov A, Chini L, Justice CO, Townshend JRG. 2013. High-resolution global paps of 21st-century forest cover
change. Science 342 (6160): 850-853.
Hartshorn, GS. 1980. Neotropical forest dynamics. Tropical succession. Biotropica, Suppl. 12 (2): 20-30.
Hammer, Ø. 2014. PAST-Paleontological Statistics version 3.04. Natural
History Museum, University of Oslo, Oslo, Norway. Irawan A. 2011. Linkages in structure and composition of vegetation to
the presence of anoa in the Mount Poniki complex, Bogani Nani
Wartabone National Park, North Sulawesi. Info BPK Manado 1 (1), November 2011. [Indonesian]
Istomo, Afnani M. 2014. Potential and distribution of meranti species
(Shorea spp.) in protected areas of PT. Wana Hijau Pesaguan, West
Kalimantan. Jurnal Silvikultur Tropika 5 (3):196-205. [Indonesia]
IUCN. 2018. The IUCN Red List of Threatened Species. http://www.iucnredlist.org/
Kalangi JI, Rombang J, Pollo HN. 2009. Hydrological Analysis and
Modeling in Drain Diversion Areas PT. NMR and Ratatotok river. Agriculture Faculty, UNSRAT: 14-22. [Indonesian]
Kartawinata K. 2010. Two centuries reveal the richness of Indonesia's
flora and ecosystem. Sarwono Prawirohardjo Memorial Lecture X LIPI. 23 August 2013. Jakarta. [Indonesian]
Kartawinata K. 2013. Indonesia's natural ecosystem diversity. A short
phrase with a photo and picture presentation. LIPI Press. Yayasan Pustaka Obor Indonesia. Jakarta [Indonesian]
Kartawinata K, Abdulhadi R, Partomihardjo T. 1981. Composition and
structure of a lowland dipterocarp forest at Wanariset, East Kalimantan. Malaysian Forester 44 (2-3): 397-406
Kartawinata K, Samsoedin I, Heriyanto M, Afriastini JJ. 2004. A tree
species inventory in a one-hectare plot at the Batang Gadis National Park, North Sumatra, Indonesia. Reinwardtia 12 (2): 145-157.
Ministry of Environment and Forestry. 2016. Statistics of Forestry
planology and environmental management in 2016. Directorate General of Forestry Planning and Environmental Management.
Ministry of Environment and Forestry. Jakarta.
http://pktl.menlhk.go.id/asset/action.php?action=openfile&filename=20180417120111.pdf [Indonesian]
Kimmins JP. 1987. Forest Ecology. New York: Macmillan Publishing Co.
Knight RS, Crowe TM, Siegfried WR. 1982. Distribution and species richness of trees in southern Africa. South African Journal of Botany
48: 455-480.
Krebs CJ. 1994. Ecology. The experimental analysis of distribution and abundance. New York: Addison-Wesley Educational Publishers.
Mani S, Parthasarathy N. 2009. Tree population and above-ground
biomass changes in two disturbed tropical dry evergreen forests of peninsular India. Trop Ecol 50 (2): 249-258.
Mansur M. 2005. Analysis of forest vegetation around Mount Wani, North
Buton Wildlife Reserve, Southeast Sulawesi. Jurnal Teknologi Lingkungan P3TL-BPPT 6 (3): 469-476. [Indonesian]
Mori SA, Boom AM, de Carvalino AM, dos Santos TS. 1983. Ecological
importance of Myrtaceae in an Eastern Brazilian wet forest. Biotropica 15 (1): 68-78.
Mueller-Dombois D, Ellenberg H. 1974. Aims and methods of vegetation
ecology. John Wiley & Sons, New York.
O'Brien, E.M. 1993. Climatic gradients in woody plant species richness: towards an explanation based on an analysis of Southern Africa's
woody flora. Journal of Biogeography 20 (2): 181-198.
Pausas JG, Austin MP. 2001. Patterns of plant species richness in relation to different environments: An appraisal. Journal of Vegetation
Science 12: 153-166.
Pausas JG, Carreras J. 1995. The effect of bedrock type, temperature and moisture on species richness of Pyrenean Scots pine (Pinus sylvestris
L.) forests. Vegetatio 116 (1): 85-92.
Polosakan R, Siregar M. 2001. Analysis of tree vegetation in the forest of Mount Kabela cluster Bogani Nani Wartabone National Park-North
Sulawesi. Ekologi Indonesia 3 (1): 37-50. [Indonesian]
Priatna D, Kartawinata K, Abdulhadi R. 2006. Recovery of a lowland dipterocarp forest twenty-two years after selective logging at
Sekundur, Gunung Leuser National Park, North Sumatra, Indonesia.
Reinwardtia 12 (3): 237-255. Proctor J, Anderson JM, Chai P, Vallack HW. 1983. Ecological studies in
four contrasting lowland rain forests in Gunung Mulu National Park,
Serawak. I. Forest environment, structure and floristics. J Ecol 71: 237-260.
Purwaningsih. 2006. Analysis of forest vegetation at several altitudes at
Mount Wawouwai, Wawonii Island, Southeast Sulawesi. Biodiversitas 7 (1): 49-54. [Indonesian]
Purwaningsih, Yusuf R. 2005. Species composition and forest vegetation
structure in Pakuli Region, Lore Lindu National Park, Central Sulawesi. Biodiversitas 6 (2): 123-128. [Indonesian]
Richerson PJ, Lum KL. 1980. Patterns of species diversity in California:
relations to weather and topography. American Naturalist 116 (4): 504-536.
Riswan S. 1987. Structure and floristic composition of a mixed
dipterocarp forest at Lempake, East Kalimantan. In: Kostermans AJGH (ed). Proceedings of the third-round table conference on
dipterocarps, UNESCO, Jakarta: 435-457.
Rukmi. 2014. Vegetation composition in ebony forest in the Tambarana
forest group in Poso Pesisir Utara Subdistrict, Poso Regency, Central
Sulawesi. Warta Rimba 2 (2): 158-165. [Indonesian] Sambas EN, Siregar M. 1999. Flora composition of the forests of Mount
Muncung, Singkep, Riau. Bulletin Kebun Raya Indonesia 9 (1): 7-17.
[Indonesia] Sambas EN, Siregar M. 2004. Flora of Alas River Bank, Ketambe,
Gunung Leuser National Park. BioSmart 6 (1): 33-38.
Sambas EN, Siregar M. 2017. Floristic and forest structural study in Batangtoru Watershed, North Sumatra. Jurnal Biologi Indonesia 13
(1): 21-31
Samsoedin I, Heriyanto NM. 2010. Structure and composition of illegal logged-over forests in the Sei Lepan forest group, Sei Serdang,
Gunung Leuser National Park, North Sumatera. Jurnal Penelitian
Hutan dan Konservasi Alam 7 (3): 299-314. [Indonesian] Sheil D, Kartawinata K, Samsoedin I, Priyadi H, Afriastini JJ. 2010. The
lowland forest tree community in Malinau, Kalimantan (Indonesian
Borneo): results from a one-hectare plot. Plant Ecology and Diversity 3: 1-8.
Sidiyasa K. 2009. Structure and composition of stands and their diversity
in the Sungai Wain Protection Forest in Balikpapan, East Kalimantan. Jurnal Penelitian Hutan dan Konservasi Alam 6 (1): 79-93.
[Indonesian]
Simbolon H. 2005. Dynamics of mixed Dipterocarp forest in Wanariset, Semboja, East Kalimantan after three fires in 1980-2003.
Biodiversitas 6 (2): 133-137. [Indonesian]
Simbolon H, Siregar M, Wakiyama S, Sukigara N, Abe Y, Shimizu H. 2005. Impacts of forest fires on tree diversity in tropical rain forest of
East Kalimantan, Indonesia. Phyton 45 (4): 551-559.
Siregar M. 2017. Spatial distribution of abundant tree species at a mixed dipterocarps forest in Bukit Bangkirai, East Kalimantan three years
after long drought and forest fire. In: Setyawan AD, Sugiyarto, Pitoyo
A, Sutomo, Widiastuti A, Windarsih G, Supatmi (eds). Prosiding Seminar Nasional Masyarakat Biodiversitas Indonesia 3 (2): 246-251.
Suryawan A, Kinho J, Mayasari A. 2013. Structure and distribution of
Euphorbiaceae family in Tangkoko Nature Reserve, Bitung, North Sulawesi. Info BPK Manado 3 (2): 89-101. [Indonesian]
Suwardi AB, Mukhtar E, Syamsuardi. 2013. Composition of species and
carbon stocks in lowland tropical forests, Ulu Gadut, West Sumatera. Berita Biologi 12 (2): 169-176. [Indonesian]
SIREGAR et al. – Forest patches in North Sulawesi
655
Tilman D. 1988. Plant strategies and the structure and dynamics of plant
communities. Princeton University Press, Princeton, New Jersey.
Tothmeresz B. 2013. Diversity. University of Debrecen, Debrecen, Hungary.
Toure D, Ge J. 2014. The response of plant species diversity to the
interrelationships between soil and environmental factors in the limestone forests of Southwest China. Journal of Environment and
Earth Science 4 (8): 105-122
Wahyuni NI, Mokodompit HS. 2016. Structure, composition and diversity of tree species in the Production Forest of Inobonto Poigar I, KPHP
Poigar, North Sulawesi. Jurnal Wasian 3 (1):45-50. [Indonesian]
Whitmore TC. 1986. Tropical rain forests of the far east, 2nded. Oxord
University Press, Oxford.
Wright SJ. 1992. Seasonal drought, soil fertility and species density of tropical forest plant communities. Trends in Ecology and Evolution 7
(8): 260-263.
Yusuf R. 2003. Ecological research on tree species in the Bulungan forest area, Bulungan Regency-East Kalimantan. Berita Biologi 6 (6): 767-
780. [Indonesian]
Yusuf R. 2005. Vegetation analysis of mixed Dipterocarpaceae forests in Kayan Mentarang National Park, East Kalimantan. Biosfera 22 (2):
54-66. [Indonesian]