veins - university of illinoislibrary.isgs.illinois.edu/pubs/pdfs/illinoisminerals/im074.pdf · :...
TRANSCRIPT


: Sphderite gash veins in the nois, The actual distance across t e field is onehaK inch (
figure 5 e, page 6 .
The abundance of zinc and ca by James 43. Cobb and others. - U
28p. : ill. ; 28cm. - (En.rslronrnenta1 Geology Notes - Survey ; 74)
1. Coal-Illinois. 2. Goal-Analysis. 3. Cod-Zbc content. 4. Cod-Ca I. Title. 11. Series.

Abstract Introduction Geology of study area Sphalerite in coal Collection, preparation, and analysis for zinc
and cadmium Sample collection Distribution of zinc and cadmium Estimating zinc and cadmium resources
References Appendixes
Tables 1. Results for bench samples 2. Results for column samples 3. Results for composite face channel samples 4. Results for composite face grid samples 5 . Results for composite auger samples 6. Summary of zinc data for all samples 7. Summary of cadmium data for all samples
Figures Illinois Basin Coal Field and study area Composite section of Pennsylvanian strata Generalized stratigraphic section Sphalerite veins in coals Structures of sphalerite veins in coal Sphalerite vein fillings Sphalerite in clastic dikes Other occurrences of sphalerite Fluid-filled inclusions in sphalerite Results of auger samling in disturbed and undisturbed coal of Herrin (No. 6) Coal Results of auger sampling in disturbed and undisturbed coal of Springfield (No. 5) Coal Results of auger sampling in undistubed part of Herrin (No. 6) Coal Results of composite face-grid and bench samples from same sites in Herrin (No. 6) Coal 13 Arithmetic frequency distribution of zinc and cadmium 14 Cumulative frequency plot for zinc 16 Cumultive frequency plot for cadmium 16
ABSTRACT
Coals in four Illinois Counties (Fulton, Knox, Peoria, and Stark) are enriched in zinc and cadmium. These coals are the Danville (No. 7), Herrin (No. 6), Springfield (No. 5 ) , and Colchester (No. 2) Coal Members. The zinc and cadmium enrichment is attributed to the presence of sphalerite, the principal ore mineral of zinc. The sphalerite is an epigenetic mineral occurring mainly as an open- space filling in fractures in the coals. This 4-county area contains approximately 7 x lo9 tons (6.3 x lo9 metric tons) of coal re- sources. The sphalerite, which is distributed in the coals, is a poten- tial source for zinc and, to a lesser extent, cadmium as a by-product of the coal production.
Sphalerite was identified in the coal in fractures, cleats, tension gashes, shears, pyrite nodules, cell lumens of fusinite, and crystal aggregates in clastic dikes. Sphalerite was also observed in phosphate nodules in the black shales overlying some of the coals.
Five methods of sampling were used to determine zinc and cadmium concentrations in the coals. The sampling methods were bench, column, composite auger, composite face channel, and composite face grid. Large variability in the data from the five methods precluded their being distinguished from one another by the Student's t test. On the basis of minimum variance, the com- posite face grid sample was selected as the most appropriate method for sampling these coal seams for zinc and cadmium.
A strong positive correlation exists between high concentra- tions of zinc and cadmium and the degree of local structural disturb- ance of the coal. Disturbances in the seams include clastic dikes, faults, shears, and fractures, all of which may contain sphalerite.
Estimates of the potential tonnage of zinc in the coals of this area range from 3 to 14 million tons and for cadmium 30 to 100 thousand tons.
ABUNDANCE OF ZINC AND CADMIUM IN SPHALERITE-BEARING COALS 1

The zinc industry is the world's fourth largest met producing industry after respectively (Bush, 4 979). zinc industry is cadmium, trial metal. The exponential rise in zinc consumption during the past several decades and fewer new ore discoveries have encouraged scientific interest in "unconventional9' sources of zinc. Sphalerite-bearing coals represent an unconven- tional source of both zinc and cadmium.
Some coals in eastern and western regions of the Interior Province are enriched in zinc and cadmium. The zinc and cadmium enrichment of these coals is restricted to certain areas of Illinois, Iowa, Kansas, and Missouri, and to a lesser extent in Oklahoma and Nebraska (Cobb et al., 1979; and Hatch, 1979). This report describes the occur- rences and distribution of sphalerite in coals of an area of west-central Illinois. An estimate of the potential of the zinc and cadmium as a by-product of coal production is presented.
The five types of sampling methods used in this study were auger, bench, column, composite face channel, and composite face grid. A comparison of the results obtained from these methods was made. Statistical methods were used to assess the abundance of zinc and cadmium in the coal of the study area.
Other reports dealing with trace elements and mineral matter in coal have provided essential background data for the present study. Zubovic (1960) was one of the first to report sphalerite in the Herrin (No. 6) Coal of Illinois. The earliest report of sphalerite in clastic dikes of the Spring- field (No. 5) Coal was by Roe (1934). Gluskoter, Watch, and Lindahl(1973) identified sphalerite in coals of Illinois and 'classified northwestern, northeastern, and southeastern areas of the Illinois Basin Coal Field as unusually enriched in zinc and cadmium. They found that cadmium occurs in solid solution with zinc in the sphalerite from coal. Ruch, Gluskoter, and Shimp (1974) demonstrated that cadmium is enriched by a factor of 14.4 in coals of Illinois over the crustal abundance (Taylor, 1964). Ruch, Gluskoter, and Shimp (1974) also determined that a high positive correla- tion exists for zinc and cadmium (r = 0.93). They also determined that the zinc and cadmium were in solid solu- tion in sphalerite and that sphalerite is not uniformly distributed within the Illinois asin Coal Field but is con- centrated in northwestern and southeastern Illinois.
Hatch, Gluskoter, and Lindahl (1976) mapped the regional distribution of zinc and cadmium in the Illinois Basin Coal Field. They discussed some of the field relation- ships of sphalerite in coal and showed a paragenesis for the mineralization. They also speculated that recoverable quantities of sphalerite may be present in existing coal refuse piles.
Hatch et al. (1976) reported high concentrations of z h c and cadmium in samples of coal from Kansas, Iowa,
edge, Bhatia, and Rueff (1976) reported analyses of sphalerite-bearing coals in Missouri.
Cobb et al. (1979) investigated the sphalerite in a slurry refuse deposit at a mine in the study area. About one thousand tons of zinc were estimated to be present in the slurry deposit; 95 percent of the zinc was believed to be concentrated within a 450-foot radius of the point of discharge into the deposit. The maximum concentration of zinc determined from samples of slurry waste in the study area was 2.36 percent.
The study area, consisting of Fulton, h o x , Peoria, and Stark Counties, is in the northwestern part of the Illinois Basin Coal Field (fig. 1). This area was selected for study because of the previously demonstrated high zinc and cadmium concentrations in the coals (Ruch, Gluskoter, and Shimp, 1974; atch, Gluskoter, and Lindahl, 1976; and Gluskoter et al., 1977) and because of the numerous and accessible exposures of the coal. Seven mines operating 17 pits were active during the investigation. These mines
from the Colchester (No. 2), Springfield errin (No. 6 ) Coal Members of the Carbon-
dale Formations. The Dandle (No. 7) Coal Member, though exposed in highwalls, was not being produced and was not included in the sampling program.
The study area lies in a stable tectonic region known as the Western Shelf. The strata dip gently southeast toward the center of the basin at less than 20 feet per mile (3.6 m per km). Minor structural disturbances of the coal such as fractures, faults, and warping of the strata are common.
Although the region has been mostly stable tecton- ically, Damberger (1970 and 1973) has described distur- bance features in the coal seams that may have been gener- ated by seismic activity. These features have been referred to as the "white top" disturbance and clastic dikes.
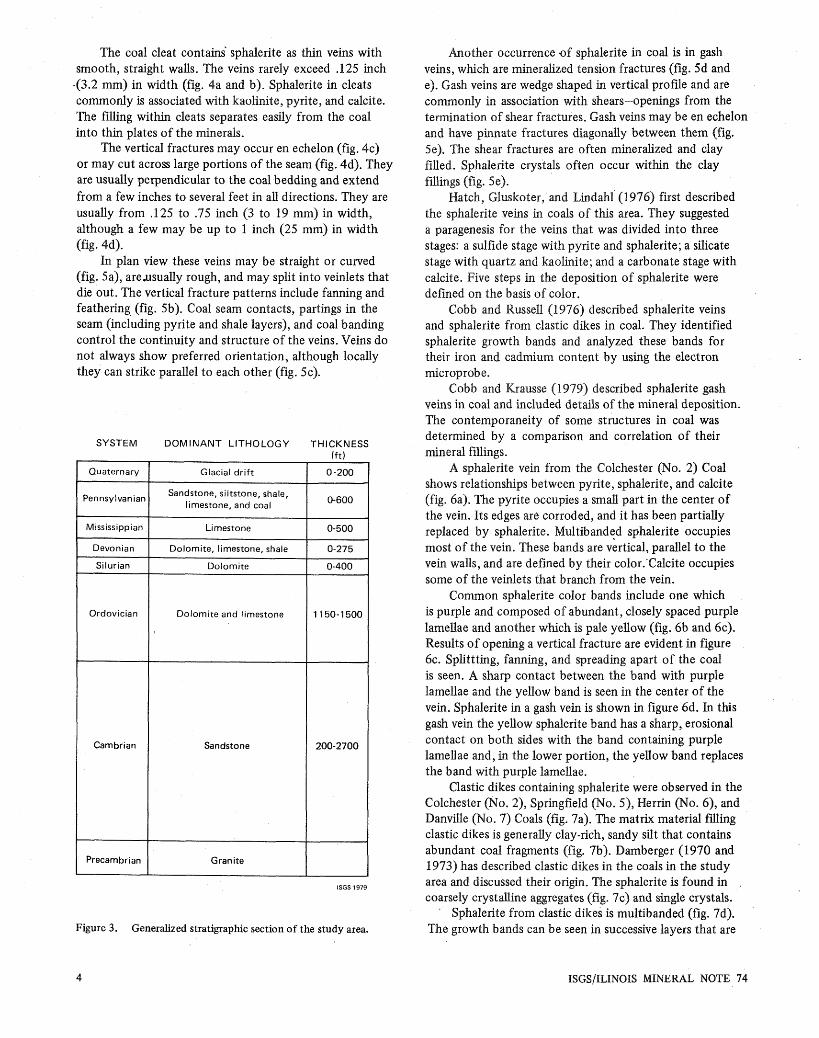
Pennsylvanian strata, overlain by Pleistocene glacial deposits, range in thickness from 0 to 600 feet (0 to 180 m) and cover nearly all of the study area. The Pennsylvanian strata are made up largely of sandstones and shales, but thin limestones and coals are scattered throughout (fig. 2). The total thickness of sedimentary strata overlying the Precambrian basement ranges from 3,600 to 5,100 feet (1,100 to 1,600 m). Figure 3 is a general stratigraphic section showing the principal lithologies from the Pre- cambrian to the Quaternary.
AE
Sphalerite is principally found as a deposit filling a pre- viously open space in the coal. It is also a replacement after pyrite. Types of structures in coal that contain sphal- erite include cleats, vertical fractures, gash veins, shear fractures, pyrite concretions, fusinite cell lumens, and clastic dikes. Vertical fractures appear to be the main sphalerite-bearing structures.
/I
ISGS/ILLINOIS MINERAL NOTE

NAMED MEMBERS r Z 0 v, 0
NAMED MEMBERS
Summum (No. 4) Coal
Kerton Creek Coal
Cramer Ls. Chapel (No. 8) Coal
Trivoli Ss. PEOR lA
KNOX I Exline Ls.
Lonsdale Ls. FULTON L Gimlet Ss.
Farmington Sh.
Oak Grove Ls.
Jake Creek Ss.
Francis Creek Sh Danville (No. 7 ) Coal
Fsq . Copperas Creek Ss.
Colchester (No. 2) Coal Browning Ss. Abingdon Coal Isabel Ss. Greenbush Coal Wiley Coal Seahorne Ls. W -----
A Fj Big Creek Sh. 5 De Long Coal
Brush Coal
Hermon Coal
. Seville Ls. Rock Island (No. 1 ) Coal Bernadotte Ss.
Pope Creek Coal
Tarter Coal
Area where Herrin No. 6 is at least 1000 f t deep
@ Surface mine
Area of study ..... -- -- -- Canton Sh.
Manley Coal
Baby Ion Ss.
Approximate scale in feet
25 50
- -
ISGS 1979
ISGS 1979
Figure 2. Composite section of Pennsylvanian strata in western Illinois (from Smith and Berggren, 1963). Figure 1. The Illinois Basin Coal Field and location of the study area.
The coal cleat contains sphalerite as thin veins with smooth, straight walls. The veins rarely exceed .I25 inch
-(3.2 mm) in width (fig. 4a and b). Sphalerite in cleats commonly is associated with kaolinite, pyrite, and calcite. The filling within cleats separates easily from the coal into thin plates of the minerals.
The vertical fractures may occur en echelon (fig. 4c) or may cut across large portions of the seam (fig. 4d). They are usually perpendicular to the coal bedding and extend from a few inches to several feet in all directions. They are usually from .I25 to .75 inch (3 to 19 mm) in width, although a few may be up to 1 inch (25 mm) in width (fig. 4d).
In plan view these veins may be straight or curved (fig. 5a), areasually rough, and may split into veinlets that die out. The vertical fracture patterns include fanning and feathering (fig. 5b). Coal seam contacts, partings in the seam (including pyrite and shale layers), and coal banding control the continuity and structure of the veins. Veins do not always show preferred orientation, although locally they can strike parallel to each other (fig. 5c).
SYSTEM
Quaternary
Pennsylvaniar
Mississippian
Devonian
Silurian
Ordovician
Cambrian
Precambrian
DOMINANT LITHOLOGY THICKNESS
Glacial drift --
Sandstone, siitstone, shale, limestone, and coal
Limestone
Dolomite, limestone, shale
Dolomite
Dolomite and limestone
Sandstone
Granite
ISGS 1979
Figure 3. Generalized stratigraphic section of the study area.
4
Another occurrence of sphalerite in coal is in gash veins, which are mineralized tension fractures (fig. 5d and e). Gash veins are wedge shaped in vertical profile and are commonly in association with shears-openings from the termination of shear fractures. Gash veins may be en echelon and have pinnate fractures diagonally between them (fig. 5e). The shear fractures are often mineralized and clay filled. Sphaierite crystals often occur within the clay fillings (fig. 5e).
Watch, Gluskoter, and kindahl (1976) first described the sphalerite veins in coals of this area. They suggested a paragenesis for the veins that was divided into three stages: a sulfide stage with pyrite and sphalerite; a silicate stage with quartz and kaolinite; and a carbonate stage with calcite. Five steps in the deposition of sphalerite were defined on the basis of color.
Cobb and Russell (1976) described sphalerite veins and sphalerite from clastic dikes in coal. They identified sphalerite growth bands and analyzed these bands for their iron and cadmium content by using the electron microprobe.
Cobb and Mrausse (1979) described sphalerite gash veins in coal and included details of the mineral deposition. The contemporaneity of some structures in coal was determined by a comparison and correlation of their mineral fillings.
A sphalerite vein from the Colchester (No. 2) Coal shows relationships between pyrite, sphalerite, and calcite (fig. 6a). The pyrite occupies a small part in the center of the vein. Its edges are corroded, and it has been partially replaced by sphalerite. Multibanded sphalerite occupies most of the vein. These bands are vertical, parallel to the vein walls, and are defined by their color.'Calcite occupies some of the veinlets that branch from the vein.
Common sphalerite color bands include one which is purple and composed of abundant, closely spaced purple lamellae and another which is pale yellow (fig. 6b and 6c). Results of opening a vertical fracture are evident in figure 6c. Splittting, fanning, and spreading apart of the coal is seen. A sharp contact between the band with purple lamellae and the yellow band is seen in the center of the vein. Sphalerite in a gash vein is shown in figure 6d. In this gash vein the yellow sphalerite band has a sharp, erosional contact on both sides with the band containing purple lamellae and, in the lower portion, the yellow band replaces the band with purple lamellae.
Clastic dikes containing sphalerite were observed in the Colchester (No. 2), Springfield (No. 5), Herrin (No. 6), and Danville (No. 7) Coals (fig. 7a). The matrix material filling clastic dikes is generally clay-rich, sandy silt that contains abundant coal fragments (fig. 7b). Damberger (1970 and 1973) has described clastic dikes in the coals in the study area and discussed their origin. The sphalerite is found in coarsely crystalline aggregates (fig. 7c) and single crystals.
' Sphalerite from clastic dikes is multibanded (fig. 7d). The growth bands can be seen in successive layers that are
ISGS/ILINOIS MINERAL NOTE 74

Figure 4. Sphalerite veins in coals. (a) Sphalerite filling a cleat in the Colchester (No. 2) Coal; (b) Sphalerite filling a cleat in the Herrin (No. 6) Coal; (c) Sphalerite veins en echelon in the Springfield (No. 5) Coal; (d) Sphalerite vein in the Danville (No. 7) Coal.
ABUNDANCE OF ZINC AND CADMIUM IN SPHALERITE-BEARING COALS

Figure 5. Structures of sphalerite veins in coal. (a) an view of a sphalerite vein in the Springfield (No. 5) Coal; (b) Vertical profile of a vein that fans out in clarah (c) and fusain (f) 'bands but is smooth in vitrah (v) in the Springfield (No. 5 ) Coal; (c) Two closely spaced sphalerite veins with parallel strike in the Springfield (No. 5) Coal; (dl) Sphalerite gash vein in Herrin (No. 4) Coal; (e) Sphalerite gash veins and sphalerite crystals (s) in clay matrix of a shear fracture in the Herrin (No. 6) Coal.
ISG%/I[L@INaCdIS MINERAL NOTE 74

Figure 6. Sphalerite vein fillings. (a) Partial paragenesis (pyrite-sphalerite-calcite) in a vein in the Colchester (No. 2) Coal; (b) Sphalerite color banding of yelow (y) and purple (p) and ca1cite (ca) in the haerrin (No. 6 ) Coal; (c) Sphalerite color bands yellow (y) and pw-ple (p) in the Springfield (No. 5) Coal; and (d) Sphalerite color bands yellow (y) and purple (p) in a gash vein in the Merrin (No. 4) Coal.
ABUNDANCE OF ZINC AND CADMIUM IN SPPHAEERITE-BEARING COALS

Figure 7. Sphalerite in clastic dikes. (a) Clastic dike in Colchester (No. 2) Coal and sphalerite crystals (s); (b) Plan view of clastic dike at top of Herrin (No. 4) Coal and sphalerite crystal (s); (c) Sphalerite crystal aggregate from clastic dike in Herrin (No. 6) Coal; (d) Photo- micrograph of sphalerite crystal from clastic dike showing color banding.
ISGS/ILLINOIS MINERAL NOTE 74

distinguished by color and texture. In many of the aggre- gates the sphalerite encloses coal particles and the growth bands are concentric around the coal-sphalerite boundary. Nucleation probably commenced at the coal contact and growth of the crystal proceeded outwar bands. The nucleation and growth of large, banded crystals suggests that the sphalerite was precipitated under generally static conditions from solutions of very low supeu- saturation.
Other occurrences of sphalerite are in pyrite nodules as a replacement after pyrite (fig. $a), filling in cell lumens in fusinite (fig. 861, in phosphate m ules in black shales
s (fig. 8c), and in fault surfaces
Figure 8. Other occurrences of syhalerite. (a) Sphalerite with pyrite nodule in Golchestes ( o. 2) Coal; (b) Sphalerite filling cell lumens in fusinite in Herrin (No. 4 ) Cod9 Bong dimension of the cell lumen in the lower left is 0.04. mm; (c) Sphalerite in phosphate nodule in black shale above Springfield (No. 5) Coal; (d) Sphalerite on fault surface in Henin (No. 6 ) Coal.
ABUNDANCE OF ZINC AND CADMHU IN SIPHALERITE-BEARING COALS 9

Figure 9. Fluid-filled inclusions in sphalerite from coal. (a) Two-phase fluid inclusion in sphalerite from the Colchester (NO. 2) Coal, long dimension of large inclusion is 112 pm; (b) Two-phase fluid inclusion in sphalerite from the Herrin (No. 6 ) Coal, long dimension of large inclusion is 122 prn.
The method of sampling has an important bearing on infor- mation derived from samples. Selection of an appropriate method of sampling depends on the distribution of the component of interest within the host. The coal seams in this study are considered to be the host for the sphalerite, which contains the zinc and cadmium of interest. Because of its nature as an open-space filling, sphalerite in coal is distributed in a somewhat erratic pattern.
Methods of sampling coal such as bench, channel, and composite face channel are useful for establishing its bulk composition according to standard methods of coal analysis (ASTM, 1977). These sampling methods are also useful for mapping variations in some major constituents of coal such as carbon, sulfur, moisture, ash, and volatile matter (Schopf, 1960). To assess the abundance of other constituents, however, such as zinc and cadmium, a method
must be chosen that provides representative weighting to both disturbed and undisturbed parts of the coal seam.
g explicitly avoids areas where the coal is unusually disturbed or where the coal contains a high percentage of mineral matter, as in clastic dikes.
e compared standard coal sampling methods in order to evaluate their appropriateness, then used these methods to estimate the zinc and cadmium content of the coal. The methods are described as follows.
sample from the coal face is taken in vertical segments determined by natural breaks in the coal bedding,
gs or pyrite layers. The benches vary in height in. (152 to 254 mm) and are about 6 in.
(1 52 mm) in width.
n. A sample of the entire coal seam is obtained by ximately 6 inch (152 mm) wide
aterial cut from the seam is in- cluded in the sample ; ho mineral partings are excluded.
lISCS/I[LLINOIS MINERAL NOTE 74

Composite face channel. A sample of the coal seam is taken that exludes mineral partings or nodules more than 318 inch (9.5 mm) in thickness. Channels are cut at three places on the coal seam and the material is combined into a com- posite sample. This follows a procedure used by the Illinois State Geological Survey and is based on a technique de- scribed by Holmes (1 9 18).
Composite face-grid. A sample of the coal face is taken by measuring a 20-foot wide (6.1 m) length of the coal face and placing a grid with intersections at foot intervals on the coal face. A hand-size chunk of the face is removed from each grid intersection. All material thus removed is com- bined into a single composite sample.
Composite auger sample. A composite sample of all cuttings was collected from each auger hole in a series of ten holes, each 8 inches (203 rnrn) in diameter and spaced 1.5 feet (457 mm) apart. In some cases analyses were made of the cuttings from each hole for purposes of comparison of the variability between the holes.
Discussion. The composite face-grid method was used because it could cover a larger proportion of the coal seam than other methods and have a greater likelihood that both disturbed and undisturbed conditions of the seam would be weighted in sampling.
The auger method has little bias in site selection be- cause the coal face is not observed before selection of the drilling site. Auger holes were drilled at even intervals along a line and as a result unbiased weighting was given to both disturbed and undisturbed conditions of the coal seam.
Observations made during sampling show that of the 55 samples collected during this study, 17 samples were collected from disturbed areas in the seam, 1 1 from un- disturbed sites, and 19 from areas large enough to include a mixture of undisturbed and disturbed coal. The coal seam condition for 8 other samples was not recorded.
Procedures for the preparation and chemical analysis of the samples are given in appendix A. The locations of samples, the names of mine and coal companies, the identi- fication of the coal seam mined, the sampling methods, and the sample numbers are listed in appendix B. The data are most complete for the Herrin (No. 6) and Springfield (No. 5) Coals; limited exposures prevented more compre- hensive sampling of the Colchester (No. 2) Coal. From the standpoint of the different sampling methods, the data are most numerous for the bench, column, composition face channel, and composite face grid, and least numerous for the composite auger samples.
Distribution of zinc and cadmium in cod
The highly variable distribution of zinc and cadmium in coal was demonstrated by a series of auger samples spaced 50 feet (15 m) apart in the Herrin (No. 6) Coal. The results
show variations in zinc and cadmium laterally in the seam (fig. 10). The highest zinc and cadmium concentrations were from auger holes that were closest to the disturbed coal, in this case clastic dikes. The lowest values occurred within the relatively undisturbed parts of the seqm.
Similar variations in the zinc and cadmium concentra- tions were found in the Springfield (No. 5) Coal (fig. 11). The auger holes in the Springfield Coal were 1.5 feet (.5 m) apart and encountered only one clastic dike. The highest zinc and cadmium values were clustered in the vicinity of the clastic dike.
A series of auger samples was collected from a part of the Herrin (NO. 6) Coal that was uniform in thickness and had no apparent disturbances (fig. 12). The zinc and cadmium values were consistently low.
The difficulty of representative sampling of coal for its zinc and cadmium content is shown by a sequence of coordinated composite face-grid and bench samples. Three sites were selected at random along a .5 mile (0.8 km) exposure. Twenty-foot lengths (6.1 m) of the seam were measured for the composite face-grid samples at-sites spaced at least 300 feet (90 m) apart. Bench samples were taken within the measured areas of composite face-grid sample. Figure 13 shows the results of this coordinated sampling.
The results from the composite face-grid samples have a narrow range from 762 to 1,048 pg/g zinc. This narrow range results from the large area covered by the sample, which eliminates localized extreme high and low values. The results obtained from the bench samples have a large range from 6 to 14,940 pg/g zinc. The large variqbility between the bench samples emphasizes this danger-for samples with limited coverage of the seam, undue weight might be placed on samples from either mineralized or non- mineralized portions of the seam. A comparison of the bench set results with the corresponding composite face- grid results illustrates the necessity of sampling large areas of the coal seams (fig. 13).
Figures 14a and b are the arithmetic frequency distri- butions for the sample results. The distribution of undis- turbed, disturbed, and mixed seam conditions is also shown. The results of samples collected from undisturbed coal are clustered near the origin; those from disturbed coal range outward to the highest values. Results from samples from a mixture of disturbed and undisturbed seam conditions are predominantly within the intermediate portion of the graph.
Ahrens (1954a and b) suggested that the lognormal distribution is one of the most common distributions in natural populations of trace elements in many rock types. The arithmetic frequency distributions for zinc and cadmium (figs. 14a and b) exhibit positive skewness. This skewness is indicative of a lognormal frequency distribu- tion. Because of the lognormal distribution in the data for zinc and cadmium concentrations, several methods of statistical analysis will be used in this paper.
ABUNDANCE OF ZINC AND CADMIUM IN SPHALERITE-BEARING COALS

Herrin (No. 6) Coal
ISGS 1979
Figure 10. Results of auger sampling in disturbed and undisturbed coal of the Herrin (No. 6 ) Coal.
Springfield (No. 5) Coal
39 500 420 96 1660 15 15 86 34
Cd (pg/g) < 0..3 < 0.4 5.3 5.1 1.1 31.6 <0.3 <0.4 0.9 <0.3
Figure 11. Results of auger sampling in disturbed and undisturbed coal of the Springfield (No. 5 ) Coal.
ISGS 1979
MINERAL NOTE 74

Herrin (No. 6) Coal
0
Figure 12. Results of auger sampling in an undisturbed part of the Herrin (No. 6 ) Coal.
ISGS 1979
Herrin (No. 6 ) Coal 4.9 f t
(1.5 m)
0 ..................... .................... .................... s.. . . . . . . . . . . . . . . . . . . . . . . . . . . . . . . . m e . . . . . ..................... .................... .................... .................... ..................... .................... ...................... ....................
q . . . . . . . . . . . . . . . . . . . .................... ..................... .................... ..................... a.... . . . . . . . . . . . . . . . . . . . . . . . . . . . . . . . . . . a .................... ..................... .................... ..................... .................... ................... .................... ..................... .................... ..................... s................... .................... .................... .................... .................... ..................... .................... . . . a , . . . . . . . . . . . . . . . .................... ..................... .................... ..................... .................... .................... .................... ..................... .................... ..................... .................... .................... .................... ..................... .................... ..................... s.. . . . . . . . . . . . . . . . . . .................... .................... ..................... a . . . . . . . . . . . . . . . . . . . ..................... e.. . . . . . . . . . . . . . . . . . .................... ...........*........ s.. . . . . . . . . . . . . . . . . . . .................... ..................... e . . . . . . . . . . . . . . . . . . . .................... .................... s.. . . . . . . . . . . . . . . . . . s . . . . . . . . . . . . . . . . . . . ..................... .................... - - - - - -
Ave. Zn 872 (pg/g)
Herrin (No. 6) Coal 4.9 f t
(1.5 m)
0
6 - 9 -
14 20 48 Ave. Zn \- 2212 33 ( ~ d g 1
322 Ave. Zn 3940 Ave. Zn
ISGS 1979 .
Figure 13. Results of composite face-grid and bench samples from the same sites in the Herrin (No. 6 ) Coal.
ABUNDANCE OF ZINC AND CADMIUM IN SPHALERITE-BEARING COALS


An additional indicator for lognormality is t o plot a cumulative frequency curve by using probability paper with a logarithmic ordinate. A lognormal distribution plots as a straight line on probability pager. Figures 15 and 16 show the plotted zinc and cadmium results. These plots consist of straight line segments with differing slopes. The line segments are interpreted as representing subpopulations of the zinc and cadmium distribution in coal. The line seg- ments BC in both figures are composed of results from disturbed or mixed conditions of the seam, and the line segments AB are of results from undisturbed coal. In the plot for zinc (fig. 15) a third line segment DA is not identified.
Results from bench, column, composite face channel, composite face grid, and composite auger samples are displayed in tables 1 t o 5. Statistical summaries of the data *re presented for comparison of the five sampling methods in tables 6 and 7. The summary tables contain three measures of central tendency: arithmetic mean, geometric mean, and Sichel's t (not to be confused with Student's t) (Sichel; 1952). Also included are three measures of variation: standard deviation, geometric de- viation, and the 90 percent confidence intervals for the arithmetic mean.
Data from the different sampling methods were paired - for all possible combinations and were subjected to the
Student's t test. At the 0.05 level of significance, there is no reason to reject the hypothesis that the arithmetic means for all the sampling methods have been taken from the same population. The inference from this is that be- cause of the large variability in the data, the results cannot be distinguished from one another by the Student's t . Likewise, the Student's t test shows that at the 0.05 level of significance, there is no reason to reject the hypothesis that the mean zinc and cadmium concentrations for each of the three coal seams, Colchester, Springfield, and Herrin Coals, were taken from the same population.
Estimating zinc and cadmium resources in coal
A problem in estimating the abundance of the zinc and cadmium in coal arises because of their lognormal distribu- tion. The sample arithmetic mean in a lognormal distribu- tion may not be a good estimator of the population arith- metic mean. The population arithmetic mean is, however, the only unbiased estimate of abundance. Sichel's t statis- tic, whch is a function of the geometric mean and geo- metric deviation, may be used to estimate the population arithmetic mean for lognormal distributions having few data (Sichel, 1952; and Miesch, 1967). According to Sichel (1 952) this statistic is unbiased, possesses minimum vari- ance, is not unduly influenced by occasional high values (when they occur among a set of low to moderate values), and lies nearer to the unknown true mean than any other statistic t o which it is compared. These criteria support the use of Sichel's t in the present study.
Two approaches have been taken in attempting to estimate the abundance of zinc and cadmium in the coals. The first approach takes advantage of the maximum amount of data available. The second approach takes into account the optimum sampling conditions of the composite face-grid method.
In the first approach the maximum number of data was used. This was justified by the results of the Student's t test where the data from the different sampling methods and the three different coal seams could not be differenti- ated. Sichel's t was calculated using the combined results of all 55 samples. These 55 results represent 12 bench sets, 1 1 column, 1 1 composite face channel, 14 composite face grid, and 7 composite auger samples. Sichel's t was calcu- lated to be 1050 pglg for zinc and 8.4 pg/g for cadmium. The values of 1050 pg/g zinc and 8.4 pg/g cadmium then will be used as the average concentrations for purposes of estimating the amounts of these metals in the coal seams studied. The central 90 percent confidence limits for these estimates are 680 pg/g < tzn < 1985 pg/g for zinc and 5.8 pglg < tcd < 14.0 pglg for cadmium.
In the second approach only those results from the composite face-grid samples were used because this meth- od: (1) covered the largest proportion of the coal seams; (2) provided the most representative weighting of disturbed and undisturbed portions of the coal seam; (3) lessened the potential for collector bias; and (4) exhibited the minimum variance in its results. Sichel's t using the 14 data from the composite face-grid sampling methods was calculated to be 633 pg/g for zinc and 5.9 pg/g for cadmium. The central 90 percent confidence limits for these estimates are 470 pg/g < tzn < 1069 pg/g for zinc and 4.4 pg/g < t,d < 9.8 pg/g for cadmium. The values of 633 pg/g zinc and 5.9 pg/g cadmium will be used as the average concentrations of these metals for purposes of estimating their amounts in the coal seams of the study area.
The potential resource of zinc and cadmium in coals of the 4-county study area may be considered to be the pro- duct of the mapped resources of the coals considered here and the estimated abundance of these metals in the coal. The coal resources of the area are approximately 7 billion tons of mapped coal in the ground (Smith and Berggren, 1963). No attempt has been made here to estimate the uncertainity of the coal resources.
The potential metal resources based on the approach using all the available data are approximately 7 million tons for zinc and 60 thousand tons for cadmium. These resource estimates show a range, based on the 9 0 percent confidence intervals of the Sichel's t estimates, of 5 to 14 million tons for zinc and 40 to 100 thousand tons for cadmium.
The potential metal resources based on the approach using the data from the preferred sampling method, the composite face grid, are approximately 4 n-iillion tons for zinc and 40 thousand tons for cadmium. These resource estimates show a range, based on the 90 percent confidence intervals of the t estimates, of 3 to 7 million tons for zinc and 30 to 70 thousand tons for cadmium.
ABUNDANCE OF ZINC AND CADMIUM IN SPHALERITE-BEARING COALS 15

Cumulative frequency, percentage ISGS 1979
Figure 15. Ccmulative frequency plot for zinc in samples.
98 90 80 70 60 50 40 30 20 10 2
Cumulative frequency, percentage ISGS 1979
Figure 16. Cumulative frequency plot for cadmium in samples.
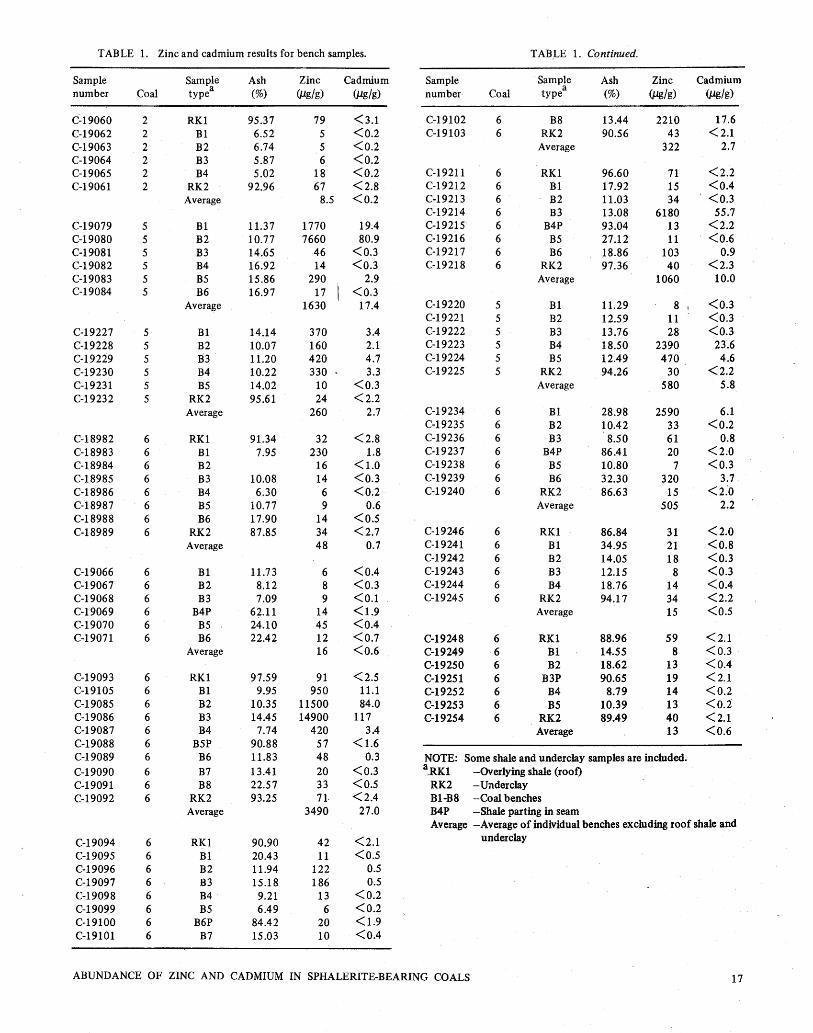
TABLE 1. Zinc and cadmium results for bench samples. TABLE 1. Continued.
Sample Sample Ash Zinc Cadmium number Coal typea (%) &g/g) k / g )
Sample Sample Ash Zinc Cadmium number Coal typea (%) @@k) @g/g)
RK1 B 1 B2 B3 B 4
RK2 Average
B 1 B2 B3 B4 B 5 B6
Average
B 1 B2 B 3 B4 B 5
RK2 Average
RK1 B1 B2 B3 B4 B5 B 6
RK2 Average
B1 B2 B3
B4P B 5 B 6
Average
RK 1 B1 B 2 B3 B4
B5P B 6 B 7 B8
RK2 Average
RK1 B1 B2 B3 B4 B 5
B6P B7
B8 RK2
Average
RK1 B 1 B2 B3
B4P B 5 B 6
RK2 Average
B1 B 2 B 3 B4 B 5
RK2 Average
B 1 B2 B3
B4P B5 B6
RK2 Average
RK1 B 1 B2 B3 B4
RK2 Average
RK1 B1 B2
B3P B4 B5
RK2 Average
NOTE: Some shale and underclay samples are included. a - R ~ l -Overlying shale (roof) RK2 -Underclay B1-B8 -Coalbenches B4P -Shale parting in seam Average -Average of individual benches excluding roof shale and
underclay
ABUNDANCE O F ZINC AND CADMIUM IN SPHALERITE-BEARING COALS

TABLE 2. Zinc and cadmium results for column samples. --
Sample Ash Zinc Cadmium number Coal (%I &/g) k / g ) ,
TABLE 3. Zinc and cadmium results for composite face channel samples.
Sample Ash Zinc Cadmium number Coal (%) @/& @Id
TABLE 4. Zinc and cadmium results for composite face grid samples.
Sample Ash Zinc Cadmium number Coal (%I @g/g) @45k)
TABLE 5. Zinc and cadmium results for composite auger samples.
Sample Ash Zinc Cadmium number Coal (%) duglg) o&/g)

TABLE 6. Summary of zinc data for all samples. '
90% conf. No. Estimated interval o f Arith. Geom. abundance Std. Geom. of Observed
Sample . Coal samples mean mean Sichel's t dev. dev. arith. mean range
Bench
Column
Composite face channel
Composite face grid
Composite auger
All
2 5 6
All
2 5 6
All
2 5 6
All
2 5 6
All
2 5 6
All
2 5 6
All
ABUNDANCE OF ZINC AND CADMIUM IN SPHALERITE-BEARING COALS

TABLE 7. Summary of cadmium
90% conf. No. Estimated interval of Arith. Geom. abundance td. Geom. o f Observed
Sample Coal samples mean mean Sichel's P ev. ' dev. arith. mean range
Bench
Column
Composite face channel
Composite face grid
Composite auger
All
2 5 6
All
2 5 6
All
2 5 6
All
2 5 6
All
2 5 6
All
2 5 6
All
II$GS/ILLINOIS MINERAL NOTE 74

We are grateful to the many staff members of the Illinois State Geological Survey who assisted in the field and 1aborat.ory work for this project, particularly Russell J. Jacobson. We gratefully acknowledge the U.S. Geological Survey, Branch of Eastern Minerals Resources, who sup- ported this research in part under U.S. Department of the Interior Grants 14-08-0001 -G-249 and 14-08-0001G496, and the authors would like to personally thank Helmuth Wedow, Jr. and Joseph R. Hatch for their assistance in the field and critical reviews of the manuscript.
We also wish to thank all of the coal companies in the study area. Without their cooperation this project would not have been possible.
REFERENCES
Ahreqs, L. H., 1954a, The lognormal distribution of the elements: Geochimica et Cosmochimica Acta, v. 5, p. 49-73.
Ahrens, L. H., 1954 b, The lognormal distribution of the elements: Geochimica et Cosmochimic Acta, v. 6, p. 121-1 31.
American Society for Testing and Materials, 1977, Gaseous fuels; coal and coke; atmospheric analysis: Annual Book of ASTM Standards, Part 26, D 2234-76, p. 301-320.
Bernas, B., 1968, A new method for decomposition and compre- hensive analysis of silicates by atomic absorption spectro- metry: Analytical Chemistry, v. 40, no. 11, p. 1682-1686.
Bush, W. R., 1979, Econometric forecasting of the world zinc industry: Society of Mining Engineers of AIME, preprint no. 79-35, 8 p.
Cobb, J. C., and H.-F. Krausse, 1979, Opening and mineralization of gash veins in coal: Ninth International Congress of Carbonif- erous Stratigraphy and Geology, Abstracts of Papers, p. 40.
Cobb, J. C., J. M. Masters, C. G. Treworgy, and R. J. Helfinstine, 1979, Abundance and recovery of sphalerite and fine coal from mine waste in Illinois: Illinois State Geological Survey Minerals Note 71, l l p .
Cobb, J. C., and S. J. Russell, 1976, Sphalerite mineralization in coal: Geological Society of America 1976 Annual Meeting, Abstracts with Programs, v. 8, no. 6, p. 816.
Cobb, J. C., J. D. Steele, and J. F. Ashby, 1979, Sphalerite-bearing coals in the central region of the United States: Ninth Inter- national Congress of Carboniferous Stratigraphy and Geology, Abstracts of Papers, p. 40.
Damberger, H. H., 1970, Clastic dikes and related impurities in the Herrin (No. 6) and Springfield (No. 5) Coals of the Illinois Basin: Illinois State Geological Survey Guidebook Series No. 8, p. 11 1-1 19.
Damberger, H. H., 1973, Physical properties of the Illinois Herrin (No. 6) Coal before burial, as inferred from earthquake- induced disturbances: 7th International Congres de Strati- graphie et de Geologie du Carbonifere, Compte Rendu, v. 2, p. 341-350.
French, W. J., and S. J. Adams, 1973, Polypropylene bottles in the decomposition of silicate rocks: Analytical Chemica Acta, V. 66, p. 324-328.
Gluskoter, H. J., J. R. Hatch, and P. C. Lindahl, 1973, Zinc in coals of the Illinois Basin: Geological Society of America, Annual Meeting, Abstracts with Programs, v. 5, p. 637.
Gluskoter, H. J., R. R. Ruch, W. G. Miller, R. A. Cahill, G. B. Dreher, and J. K. Kuhn, 1977, Trace elements in coal: Occur- rence and distribution: Illinois State Geological Survey Circular 499,154 p.
Hatch, Joseph R., 1979, Distribution of zinc and cadmium in coals from the Eastern and Western Regions, Interior Coal Province: Ninth International Congress of Carboniferous Stratigraphy and Geology, Abstracts of Papers, p. 86.
Hatch, J. R., M. J. Aarcin, W. K. Wedge, and L. L. Brady, 1976, Sphalerite in coals from southeastern Iowa, Missouri, and southeastern Kansas: U.S. Geological Survey Open-file Report 76-796, 26 p.
Hatch, J. R., H. J. Gluskoter, and P. C. Lindahl, 1976, Sphalerite in coals from the Illinois Basin: Economic Geology,~. 71, no. 3, p. 613-624.
Holmes, J. A., 191 1, The sampling of coal in the mine: U.S. Bureau of Mines Technical Paper 1, 18 p.
Miesch, A. 'IT., 1967, Methods of computation for estimating geo- chemical abundance: U.S. Geological Survey Professional Paper 574-By 15 p.
Roe, W.B., 1934, Clay-veins in Illinois Springfield (No. 5) Coal: unpublished M.S. thesis, Northwestern University, Evanston, 105 p.
Roedder, Edwin, 1979, Fluid inclusion evidence on the environ- ments of sedimentary diagenesis, a review: SEPM Special Publication No. 26, p. 89-107.
Ruch, R. R., H. J. Gluskoter, and N. F. Shimp, 1974, Occurrence and distribution of potentially volatile trace elements in coal: A final report: Illinois State Geological Survey Environmental Geology Note 72,96 p.
Schopf, James M., 1960, Field description and sampling of coal beds: U.S. Geological Survey Bulletin 11 1 1-B, 70 p.
Sichel, N. S., 1952, New methods in the statistical evaluation of mine sampling data: Transactions of the Institute of Mining and Metallurgy (London), v. 61, p. 261-288.
Smith, W. H., and D. J. Berggren, 1963, Strippable coal reserves of Illinois, Part 5A-Fulton, Henry, Knox, Peoria, Stark, Taze- well, and parts of Bureau, Marshall, Mercer, and Warren Coun- ties: Illinois State Geological Survey Circular 348,59 p.
Taylor, S. R., 1964, Abundance of chemical elements in the conti- nental crust: A new table: Geochimica et Cosmochimica
'
Acta, v. 28, no. 8, p. 1273-1 285. Wedge, W. K., Bhatia, D.M.S., and Rueff, A. E., 1976, Chemical
analyses of selected Missouri coals and some statistical impli- cations: Missouri Department of Natural Resources, Geological Survey, Report of Investigation 60,40 p.
Zubovic, P., 1960, Minor element content of coal from Illinois beds 5 and 6 and their correlatives in Indiana and western Ken- tucky: U.S. Geological Survey open file report, 79 p.
ABUNDANCE OF ZINC AND CADMIUM IN SPHALERITE-BEARING COALS
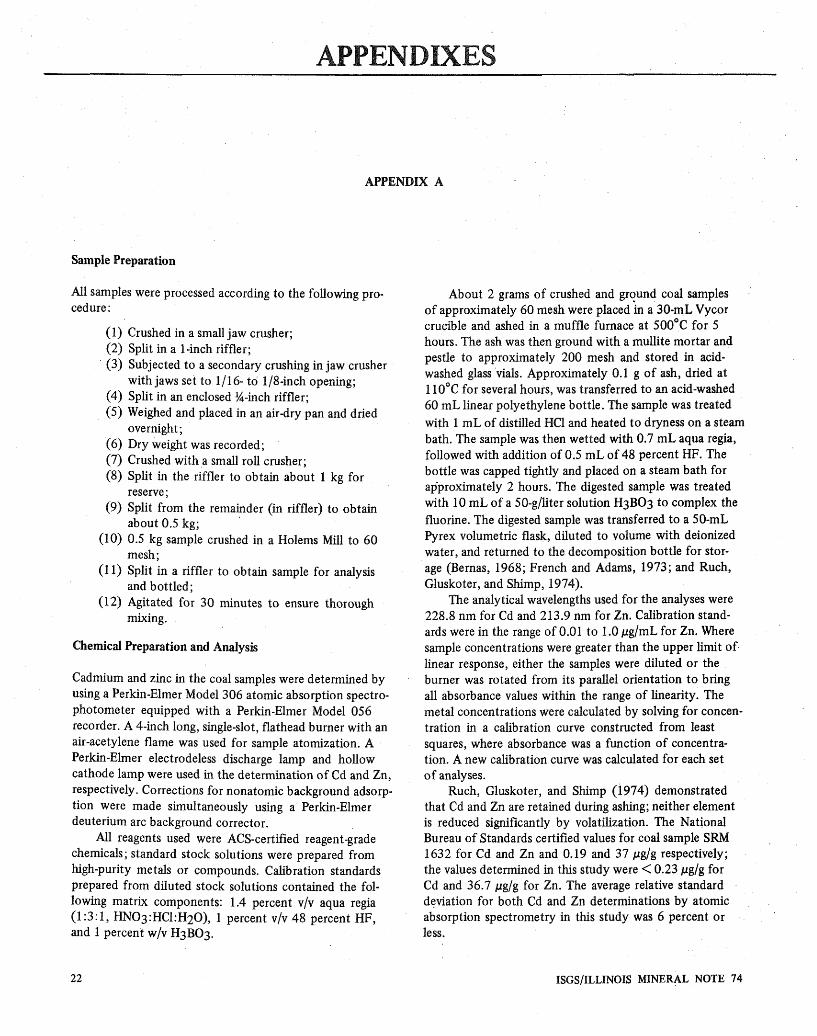
Sample Preparation
All samples were processed according to the following pro- About 2 grams of crushed and grqund coal samples
Crushed in a small jaw crusher; Split in a 1 -inch riffler; Subjected to a secondary crushing in jaw crusher with jaws set to 111 6- to 118-inch opening; Split in an enclosed %-inch riffler; Weighed and placed in an air-dry pan and dried overnight ; Dry weight was recorded; Crushed with a small roll crusher; Split in the riffler to obtain about 1 kg for reserve; Split from the remainder (in riffler) to obtain about 0.5 kg; 0.5 kg sample crushed in a Holems Mill to 60 mesh; Split in a riffler to obtain sample for analysis and bottled; Agitated for 30 minutes to ensure thorough mixing.
Chemical Preparation and Analysis
Cadmium and zinc in the coal samples were determined by using a Perkin-Elmer Model 306 atomic absorption spectro- photometer equipped with a Perkin-Elmer Model 056 recorder. A 4-inch long, single-slot, flathead burner with an air-acetylene flame was used for sample atomization. A Perkin-Elmer electrodeless discharge lamp and hollow cathode lamp were used in the determination of Cd and Zn, respectively. Corrections for nonatomic background adsorp- tion were made simultaneously using a Perkin-Elmer deuterium arc background corrector.
All reagents used were ACS-certified reagent-grade chemicals; standard stock solutions were prepared from high-purity metals or compounds. Calibration standards prepared from diluted stock solutions contained the fol- lowing matrix components: 1.4 percent v/v aqua regia (1 :3: 1, HNO3:HCl:H20), 1 percent v/v 48 percent HF, and 1 percent wlv H3B03.
of approximately 60 mesh were placed in a 30-mL Vycor crucible and ashed in a muffle furnace at 5 0 0 ' ~ for 5 hours. The ash was then ground with a mullite mortar and pestle to approximately 200 mesh and stored in acid- washed glass vials. Approximately 0.1 g of ash, dried at 110°C for several hours, was transferred to an acid-washed 60 mL linear polyethylene bottle. The sample was treated with 1 mE of distilled HCl and heated to dryness on a steam bath. The sample was then wetted with 0.7 mL aqua regia, followed with addition of 0.5 mL of 48 percent HF. The bottle was capped tightly and placed on a steam bath for approximately 2 hours. The digested sample was treated with 10 mL of a 50-glliter solution H3B03 to complex the fluorine. The digested sample was transferred to a 50-mL Pyrex volumetric flask, diluted to volume with deionized water, and returned to the decomposition bottle for stor- age (Bernas, 1968; French and Adams, 1973; and Ruch, Gluskoter, and Shimp, 1974).
The analytical wavelengths used for the analyses were 228.8 nm for Cd and 213.9 nm for Zn. Calibration stand- ards were in the range of 0.01 to 1.0 pg/mL for Zn. Where sample concentrations were greater than the upper limit of linear response, either the samples were diluted or the burner was rotated from its parallel orientation to bring all absorbance values within the range of linearity. The metal concentrations were calculated by solving for concen- tration in a calibration curve constructed from least squares, where absorbance was a function of concentra- tion. A new calibration curve was calculated for each set of analyses.
Ruch, Gluskoter, and Shimp (1974) demonstrated that @d and Zn are retained during ashing; neither element is reduced significantly by volatilization. The National Bureau of Standards certified values for coal sample SRM 1632 for Cd and Zn and 0.19 and 37 pg/g respectively; the values determined in this study were < 0.23 pg/g for Cd and 36.7 pg/g for Zn. The average relative standard deviation for both Cd and Zn determinations by atomic absorption spectrometry in this study was 6 percent or less.
ISGS/ILLINOIS MINERAL NOTE 74
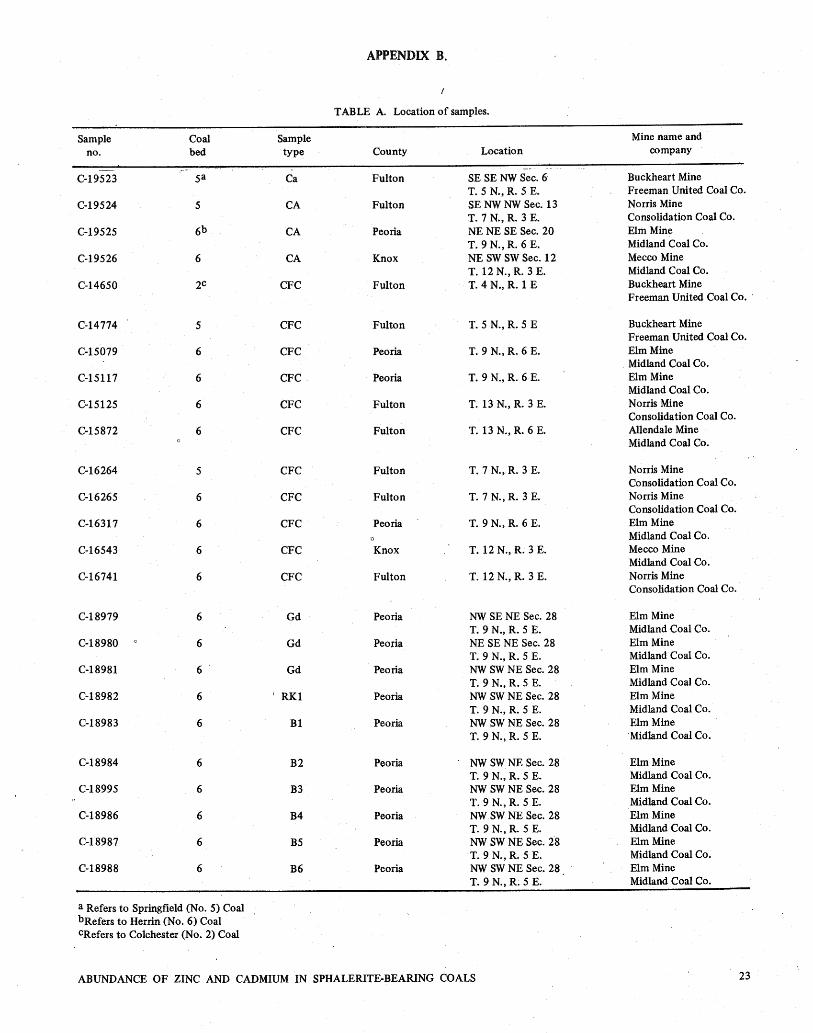
TABLE A. Location of samples.
Sample Coal Sample Mine name and no. bed type County Location company
Ca
CA
CA
CA
CFC
CFC
CFC
CFC
CFC
CFC
CFC
CFC
CFC
CFC
CFC
Gd
Gd
Gd
' RK1
B 1
B2
B 3
B4
B5
B6
Fulton
Fulton
Peoria
Knox
Fulton
Fulton
Peoria
Peoria
Fulton
Fulton
Fulton
Fulton
Peoria 0
Knox
Fulton
Peoria
Peoria
Peoria
Peoria
Peoria
Peoria
Peoria
Peoria
Peoria
Peoria
SE SE NW Sec. 6 T. 5 N., R. 5 E. SE NW NW Sec. 13 T. 7 N., R. 3 E. NE NE SE Sec. 20 T. 9 N., R. 6 E. NE SW SW Sec. 12 T. 12 N., R. 3 E. T. 4 N., R. 1 E
T. 5 N., R. 5 E
T. 9 N., R. 6 E.
T. 9 N., R. 6 E.
T. 13 N., R. 3 E.
T. 13 N., R. 6 E.
T. 7 N., R. 3 E.
T. 7 N., R. 3 E.
T, 12 N., R. 3 E.
NW SE NE Sec. 28 T. 9 N., R. 5 E. NE SE NE Sec. 28 T. 9 N., R. 5 E. NW SW NE Sec. 28 T. 9 N., R. 5 E. NW SW NE Sec. 28 T. 9 N., R. 5 E. NW SW NE Sec. 28 T. 9 N., R. 5 E.
NW SW NE Sec. 28 T. 9 N., R. 5 E. NW SW NE Sec. 28 T. 9 N., R. 5 E. NW SW NE Sec. 28 T. 9 N., R. 5 E. NW SW NE Sec. 28 T. 9 N., R. 5 E. NW SW NE Sec. 28
Buckheart Mine Freeman United Coal Co. Norris Mine Consolidation Coal Co. Elm Mine Midland Coal Co. Mecco Mine Midland Coal Co. Buckheart Mine Freeman United Coal Co.
Buckheart Mine Freeman United Coal Co. Elm Mine Midland Coal Co. Elm Mine Midland Coal Co. Norris Mine Consolidation Coal Co. Allendale Mine Midland Coal Co.
Norris Mine Consolidation Coal Co. Norris Mine Consolidation Coal Co. Elm Mine Midland Coal Co. Mecco Mine Midland Coal Co. Norris Mine Consolidation Coal Co.
Elm Mine Midland Coal Co. Elm Mine Midland Coal Co. Elm Mine Midland Coal Co. Elm Mine Midland Coal Co. Elm Mine Midland Coal Co.
Elm Mine Midland Coal Co. Elm Mine Midland Coal Co. Elm Mine Midland Coal Co. Elm Mine Midland Coal Co. Elm Mine
T. 9 N., R. 5 E. Midland Coal Co.
a Refers to Springfield (No. 5) Coal b ~ e f e r s to Herrin (No. 6) Coal CRefers to Colchester (No. 2) Coal
ABUNDANCE OF ZINC AND CADMIUM IN SPHALERITE-BEARING COALS 2 3
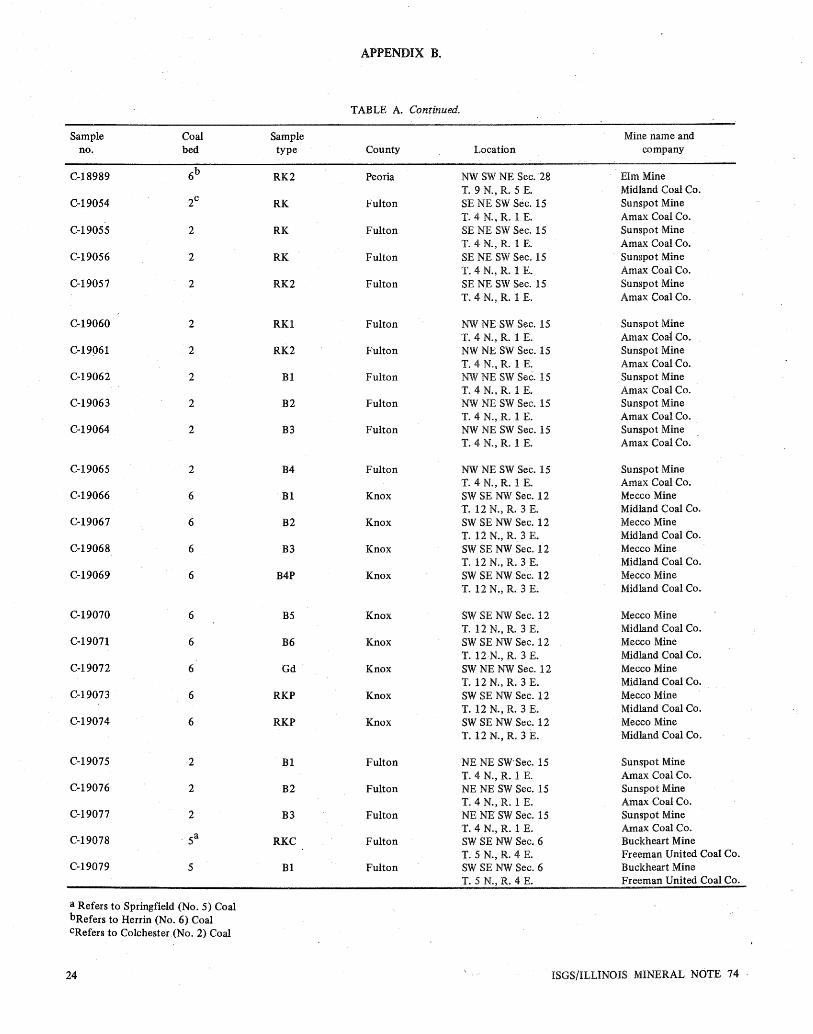
TABLE A. Continued,
Sample no.
Coal bed
Sample type County Location
ine name and company
RK2
RK
RK
RK
RK2
RK1
RK2
B1
B2
B3
B4
B1
B2
B3
B4P
B 5
B 6
Gd
RKP
RKP
B 1
B2
B3
RKC
B 1
Peoria
Fulton
Fulton
Fulton
Fulton
Fulton
Fulton
Fulton
Fulton
Fulton
Fulton
Knox
Knox
Knox
Knox
Knox
Knox
Knox
Knox
Knox
Fulton
Fulton
Fulton
Fulton
Fulton
SW NE Sec. 28 T. 9 N., Re 5 E. SE NE SW Sec. 15 T. 4 N., R. f E. SE NE SW Sec. 15 T. 4 N., R. 1 E. SE NE SW Sec. 15 T. 4 N., R. P E. SE NE SW Sec. 15 T. 4 N., R. 1 E.
NE SW Sec. 15 N., R. 1 E.
W NE SW Sec. 15 T. 4 N., R. 1 E.
NE SW Sec. 15
NE SW Sec. 1 5
NE SW Sec. 15 T. 4 N., R. 1 E.
T. 112 N. R. 3 E.
SW SE NW Sec. 12 T. 12 N., M. 3 E.
T. 12 N., R. 3 E.
Elm Mine Midland Coal Co. Sunspot Mine Amax Coal Co. Sunspot Mine Amax Coal Co. Sunspot Mine h a x Coal Co. Sunspot Mine Amax Coal Co.
Sunspot Mine Amax Coal Co. Sunspot Mine Amax Coal Co. Sunspot Mine Amax Coal Co. Sunspot Mine Amax Coal Go. Sunspot Mine .
Amax Coal Co.
Sunspot Mine Amax Coal Co. Mecco Mine Midland Coal Co. Mecco Mine Midland Coal Co. Mecco Mine Midhnd Coal Co. Mecco Mine
idland Coal Co.
Mecco Mine Midland Coal Co. Mecco Mine Midland Coal Co.
ecco Mine Midland Coal Co. Mecco Mine Midland Coal Go. Mecco Mine Midland Coal Co.
Sunspot Mine Amax Coal Co. Sunspot Mine Amax Coal Co. Sunspot Mine Amax Coal Co. Buckheart Mine Freeman United Coal Co. Buckheart Mine
T. 5 N., R. 4 E. Freeman United Coal Co.
a Refers to Springfield (No. 5) Coal b ~ e f e r s to Herrin (No. 6 ) Coal CRefers to Colchester (No. 2) Coal
ISGSIILLINOIS MINERAL NOTE 74
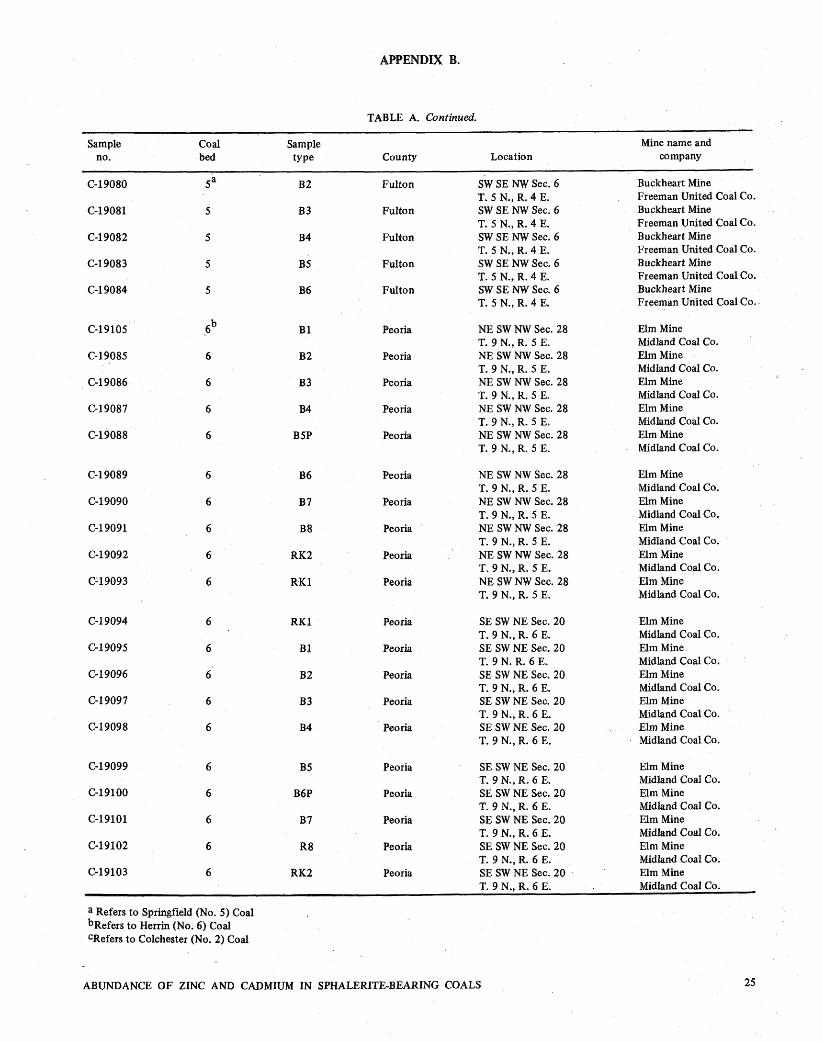
TABLE A. Continued.
Sample no.
Coal Sample bed tY Pe County Location
Mine name and company
Fulton
Fulton
Fulton
Fulton
Fulton
Peoria
Peoria
Peoria
Peoria
Peoria
Peoria
Peoria
Peoria
Peoria
Peoria
Peoria
Peoria
Peoria
Peoria
Peoria
Peoria
Peoria
Peoria
Peoria
Peoria
SW SE NW Sec. 6 T. 5 N., R. 4 E. SW SE NW Sec. 6 T. 5 N., R. 4 E. SW SE NW Sec. 6 T. 5 N., R. 4 E. SW SE NW Sec. 6 T. 5 N., R. 4 E. SW SE NW Sec. 6 T. 5 N., R. 4 E.
NE SW NW Sec. 28 T. 9 N., R. 5 E. NE SW NW Sec. 28 T. 9 N., R. 5 E. NE SW NW Sec. 28 T. 9 N., R. 5 E. NE SW NW Sec. 28 T. 9 N., R. 5 E. NE SW NW Sec. 28 T. 9 N.,R. 5 E.
NE SW NW Sec. 28 T. 9 N.,R. 5 E. NE SW NW Sec. 28 T. 9 N., R. 5 E. NE SW NW Sec. 28 T. 9 N., R. 5 E. NE SW NW Sec. 28 T. 9 N., R. 5 E. NE SW NW Sec. 28 T. 9 N., R. 5 E.
SE SW NE Sec. 20 T. 9 N., R. 6 E. SE SW NE Sec. 20 T. 9 N. R. 6 E. SE SW NE Sec. 20 T. 9 N., R. 6 E. SE SW NE Sec. 20 T. 9 N., R. 6 E. SE SW NE Sec. 20 T. 9 N., R. 6 E.
SE SW NE Sec. 20 T. 9N.,R. 6 E. SE SW NE Sec. 20 T. 9 N., R. 6 E. SE SW NE Sec. 20 T. 9 N., R. 6 E. SE SW NE Sec. 20 T. 9 N., R. 6 E. SE SW NE Sec. 20 T. 9 N.. R. 6 E.
Buckheart Mine Freeman United Coal Co. Buckheart Mine Freeman United Coal Co. Buckheart Mine Freeman United Coal Co. Buckheart Mine Freeman United Coal Co. Buckheart Mine Freeman United Coal Co..
Elm Mine Midland Coal Co. Elm Mine Midland Coal Co. Elm Mine Midland Coal Co. Elm Mine Midland Coal Co. Elm Mine Midland Coal Co.
Elm Mine Midland Coal Co. Elm Mine Midland Coal Co. Elm Mine Midland Coal Co. Elm Mine Midland Coal Co. Elm Mine Midland Coal Co.
Elm Mine Midland Coal Co. Elm Mine Midland Coal Co. Elm Mine Midland Coal Co. Elm Mine Midland Coal Co. Elm Mine Midland Coal Cod
Elm Mine Midland Coal Co. Elm Mine Midland Coal Co. Elm Mine Midland Coal Co. Elm Mine Midland Coal Co. Elm Mine Midland Coal Co.
a Refers to Springfield (No. 5) Coal b ~ e f e r s to Herrin (No. 6) Coal CRefers to Colchester (No. 2) Coal
ABUNDANCE OF ZINC AND CADMIUM IN SPHALERITE-BEARING COALS

TABLE A. Continued.
Sample Coal Sample no. bed type County Location
Mine name and company
Peoria
Stark
Stark
Stark
Stark
Stark
Stark
Stark
Stark
Stark
Fulton
Fulton
Fulton
Fulton
Fulton
Fulton
Fulton
Fulton
Fulton
Fulton
Fulton
Fulton
Fulton
Fulton
Knox
SE SW NE Sec. 20 T. 9 N., R. 6 E. SE NW NW Sec. 11 T. 13 N., Pi. 4 E. SENWNWSec. 11 T. 13 N., R. 6 E. SENWNW Sec. 4.1 T. 13 N., R. 6 E.
T. 13 N., R. 6 E.
Elm Mine Midland Coal Co. Allendale Mine Midland Coal Co. Allendale Mine Midland Coal Go. Mlendale Mine Midland Coal Co. Allendale Mine Midland Coal Co.
SE NW P6W Sec. 11 T. 13 N., R. 6 E.
T. 1 3 N., W. 6 E. SE NW NW Sec. 114. T. 13 N., R. 6 E. SE NW NW Sec. 11 T. 13 N., R. 6 E. SE NW NW Sec. 11 T. 1 3 N., R. 6 E.
SE SW NW Sec. 13 T. 7 N., R. 3 E. SE SW PdaN Sec. 13 T. 7 N., R. 3 E. SE SW NW Sec. 13 T. 7 N., R. 3 E. SE SW NW Sec. 13 T. 7 N., R. 3 E. SE SW NW Sec. 13 T. 7 N., R. 3 E.
SE SW NW Sec. 1 3 T. 7 N., R. 3 E. SE SW NW Sec. 1 3 T. 7 N., R. 3 E. SE SW NW Sec. 1 3 T. 7 N., R. 3 E. SW NE NE Sec. 13 T. 7 N., R. 3 E. SW NE NE Sec. 13 T. 7 N., R. 3 E.
SW NE NE Sec. 13 T. 7 N., R. 3 E. SW NE NE Sec. 13 T. 7 N., R. 3 E. SW NE NE Sec. 13 T. 7 N., R. 3 E. SW NE NE Sec. 13 T. 7 N., R. 3 E. NW NE NE Sec. 1 0 T. 1 2 N., R. 3 E.
Allendale Mine Midland Coal Co. Allendale Mine Midland Coal Co. Allendale Mine Midland Coal Co. Allendale Mine Midland Coal Co. Allertdale Mine Midland Coal Co.
Norris Mine Consolidation Coal Co. Norris Mine Consolidation Coal Go. Norris Mine Consolidation Coal Co. Norris Mine Consolidation Coal Co. Norris Mine Consolidation Coal Co.
Norris Mine Consolidation Coal Co. Norris Mine Consolidation Coal Co. Norris Mine Consolidation Coal Co. Norris Mine Consolidation Coal Co. Norris Mine Consolidation Coal Co.
Norris Mine Consolidation Coal Co. Norris Mine Consolidation Coal Co. Norris Mine Consolidation Coal Co. Norris Mine Consolidation Coal Co. Mecco Mine Midland Coal Go. ,
a Refers to Springfield (No. 5) Coal b ~ e f e r s to Herrin (No. 6) Coal CRefers to Colchester (No. 2) Coal
ISGS/ILLINOIS MINERAL NOTE 7 4

uoqnd
UoJpd
p o a d
qsoad
BilOad
xoug
xou)][
xoug
xoug
xoug
xoag
xoug
xoux
xoux
XOUX
xoux
x o q
xoug
XOUX
xoux
XOUX
xoax
xoux
xoug
xoag

Sample Coal Sample no. bed type County Location
Mine name and company
T. 7 N., R* 3 E. Gd Fulton
T.4 W., R. 1 E. C-19401 2 Gd Fulton
C-19402 5,sb Gob Peoria T. 9 N,, R, 5 E.
C-19403 5 , 6 Gob eoria
Gd
Gb
Gob
Slr
Slr
Slr
Stark
Fulton
Fulton
Fulton
F u h n
Fulton
Fulton
Fulton
Fulton
Knox
Knox
Knox
Peoria
Fulton
Fulton
Fulton
SW NW Sec. 6
SW NE Sec. 13
SW NE Sec. 83 T. 7 N., R. 3 E.
T. 12 N., R" 3 E.
prep. plant T. 9 Id., R, 5 E. pond Sec. 24
pond Sec. 24 T. 6 N., R. 4 E. pond Sea;. 4 T. 3 N., R, 1 E,
Consolidation Coal Co. Sunspot Mine Amm Goal Co. Sunspot Mhe Amax Coal Co. Elm Mine Midland Coal Co. E h Mine Midland Coal Co.
Allendale Mine Midland Coal Co.
Amax Coal Co.
Buckheart Mine Freeman United Coal Co.
uckheart Mhe Freeman United Coal Go. Norris Mine Consolidation Coal Co. Norris Mine Consolidation Goal Co. Mecco Mine Midhnd Coal Co.
Memo Mine Midland Coal Co. Mecco Mine
dhnd Coal Co.
idland Coal Co. ucklneart Mine
Freeman United Coal Co.
Amax Coal Co.
aRefers to Springfield (No. 5) Coal b ~ e f e r s to Herrin (No. 6) Cod CRefers to Colchester (No. 2) Coal
IS MINERAL NOTE 74

IAL MINERALS NOTE
ites in Livingston County, IUhois. 19 Illinois Natural Resouces-An Industrial Develppmenit Asset. 1964.
nois Minerah Notes Series conthrnes t Series and incorporates the Mineral Eco
1974.
nois Mineral Industry in 1974. 1 977. Market Potential for Coals of the Illinois B a s h 1977.
Pria~ed by authority of the State offllkois (1 980/1500) . Iinois .hskitute of Natural %aesources