ventilation and human responses in non residential … · 2017-08-23 · concentrations in...
TRANSCRIPT

1
Association of Ventilation Rates and CO2-Concentrations with Health and other Responses in Commercial and Institutional Buildings
O. A. Seppänen*, W. J. Fisk+
, M. J. Mendell#
*Helsinki University of Technology Laboratory for Heating, Ventilating and Air Conditioning Finland
+
Lawrence Berkeley National Laboratory Environmental Energy Technologies Division Indoor Environment Department, USA
#
National Institute for Occupational Safety and Health USA
December 11, 1999 This review was supported with a grant from the Finnish Academy and by the Assistant Secretary for Energy Efficiency and Renewable Energy, Office of Building Technology, State, and Community Programs, Office of Building Systems of the U.S. Department of Energy (DOE) under contract No. DE‐AC03‐76SF00098.
Published in Indoor Air 1999; 9: 226‐252 LBNL‐43334

Published in Indoor Air 1999; 9: 226-252 Association of ventilation rates and CO2-concentrations with health and other responses in commercial and institutional buildings
O. A. Seppänen*, W. J. Fisk+, M. J. Mendell#
*Helsinki University of Technology, Laboratory for Heating, Ventilating and Air Conditioning, Finland +Lawrence Berkeley National Laboratory, Indoor Environment Department, Environmental Energy Technologies Division, USA #National Institute for Occupational Safety and Health, USA
December 11, 1999
Correspondence to: W.J. Fisk Lawrence Berkeley National Laboratory 1 Cyclotron Road, MS 3058 Berkeley, CA 94720 USA Email: [email protected] Fax: + 1 510 486 6658
Abstract This paper reviews current literature on the associations of ventilation rates and carbon dioxide concentrations in non-residential and non-industrial buildings (primarily offices) with health and other human outcomes. Twenty studies, with close to 30,000 subjects, investigated the association of ventilation rates with human responses, and 21 studies, with over 30,000 subjects, investigated the association of carbon dioxide concentration with these responses. Almost all studies found that ventilation rates below 10 Ls-1 per person in all building types were associated with statistically significant worsening in one or more health or perceived air quality outcomes. Some studies determined that increases in ventilation rates above 10 Ls-1 per person, up to approximately 20 Ls-1 per person, were associated with further significant decreases in the prevalence of SBS symptoms or with further significant improvements in perceived air quality. The carbon dioxide studies support these findings. About half of the carbon dioxide studies suggest that the risk of sick building syndrome symptoms continued to decrease significantly with decreasing carbon dioxide concentrations below 800 ppm. The ventilation studies reported relative risks of 1.5 - 2 for respiratory illnesses and 1.1 - 6 for sick building syndrome symptoms for low compared to high ventilation rates. Keywords: ventilation rates, carbon dioxide, health effects, SBS-symptoms, air exchange rate, relative risks.
LBNL-43334
Introduction
Purpose of the paper The primary aims of this paper are to review and synthesize the literature on the associations of ventilation rates in commercial buildings with health and other human responses, to provide a better scientific basis for setting health-related ventilation standards. We were particularly interested in the following human responses due to their widespread occurrence and potentially great economic impact (Fisk and Rosenfeld 1997, 1998): (1) communicable respiratory illnesses; (2) sick building syndrome symptoms; and (3) unacceptability or poor quality of air as perceived by occupants or sensory panels. The secondary aims are to point out strengths and weaknesses of study methodologies and to suggest energy efficient approaches for achieving the benefits of increased ventilation.
Sick Building Syndrome Symptoms During the last 20 years numerous studies both in Europe and North America have indicated that non-specific symptoms related to occupancy in office buildings are common among the office workers, and that there is considerable variation in the prevalence of symptoms among buildings. These symptoms are generally referred to as sick building syndrome symptoms. According to a World Health Organization working group (WHO 1983) the sick building syndrome (SBS) is characterized by the following: eye, nose and throat irritation; a sensation of dry mucous membranes and skin; erythema (skin redness); mental fatigue; headache; a high frequency of airway infections and cough; hoarseness; wheezing, itching and nonspecific hypersensitivity; nausea and dizziness. SBS is often also characterized by other non-specific symptoms such as: nasal dryness; nasal congestion (stuffy, blocked nose); nasal excretion (runny nose); pharyngeal symptoms; difficulty in concentration; and difficulty in breathing and tight chest. SBS symptoms are associated with occupancy in buildings and dissipate or decrease when the individual is absent from the building. The term “SBS” is used primarily when the agents causing the symptoms are unidentified and the symptoms do not indicate a specific known disease. Ventilation rates and their relationship to indoor air quality (IAQ) In this paper the term ventilation refers to the flow of outdoor air to a space, either through the ventilation system or by infiltration through the building envelope; this is always accompanied by an equal flow of indoor air to outdoors. Ventilation brings outdoor air to the occupied zone and removes or dilutes indoor-generated pollutants. Ventilation air can be supplied to rooms through mechanical ventilation systems or with the help of natural forces such as wind pressure and the buoyancy effects caused by air temperature differences between indoor and outdoor air. Ventilation air supplied to the spaces can be mixed with recirculated return air or be entirely outdoor air. Ventilation does not directly affect occupant health or perception outcomes, but the rate of ventilation affects indoor environmental conditions including air pollutant concentrations that, in turn, may modify the occupants’ health or perceptions. The air pollutant concentrations in a given space depend on several factors other than ventilation air flow rate. In principle, steady state concentrations in a well-mixed indoor space can be calculated from the following simple equation,
])()([ ∑++= λλ othervsin VSCC (1) where Cin = the indoor concentration, Cs = the concentration in the air entering the space, S/V = the indoor pollutant generation rate per unit air volume, λv = the air exchange rate equal to the
2

LBNL-43334
outside air flow rate divided by the indoor volume, and Σλother = the sum of all other indoor pollutant removal rates. In practice, the situation is not as simple as suggested by the equation. Equation 1 assumes a uniform pollutant concentration in the space. Mixing, however, is not necessarily complete, and the concentration of pollutants at the breathing zone may vary significantly depending on the air distribution pattern and the locations of pollutant sources. The indoor pollutant generation rate (source strength) is usually not constant. Pollutants may be adsorbed by room surfaces during high concentration periods and desorbed again into the air during low concentration periods. Indoor pollutant source strengths are highly variable among buildings, and considered the biggest cause of the variation in pollutant concentrations among buildings (Turk et al. 1987). In many buildings, ventilation rates are not constant. For example, ventilation systems may not operate at night, and rates of ventilation during operation may change with internal heat loads or with outdoor air temperature. Pollutant concentrations may not reach equilibrium until several hours (if ever) after ventilation rates stabilize. Thus, the indoor air quality is also dependent on the operating schedule of the ventilation system. Additionally, the concentration of pollutants in the air entering the space is affected by five major factors: (1) the level and type of pollutants outdoors; (2) possible recirculation of return air; (3) the location of the outdoor air intake relative to outdoor air pollution sources including exhaust air outlets; (4) pollution sources in the air handling system; and (5) pollutant removal from supply air by filters, sorbents, or deposition on duct surfaces. Thus, with a given ventilation rate, indoor air quality may vary significantly due to variations in the quality of the supply air (Björkroth et al. 1998, Seppänen 1999). The brief summary above illustrates that ventilation rate, though important, is one of many factors affecting indoor air quality. The association of ventilation rates with health outcomes and perceived air quality will vary among buildings and also within individual buildings over time. Consequently, the average or typical relationship between ventilation rate and health from studies of large numbers of buildings is not likely to apply precisely to specific individual buildings. Additionally, the complex relationship between ventilation rate and indoor air quality makes it difficult to draw conclusions about the effects of ventilation rates from studies in which the confounding influences of other important factors are not controlled in the study design or during the data analyses. Indoor Carbon Dioxide Many investigations of the association of indoor carbon dioxide concentrations with health and perceived air quality (PAQ) have been reported. At the concentration range encountered in normal indoor environments (350 – 2500 ppm), CO2 is not thought to be a direct cause of health effects (ACGIH 1991). However, because occupants are the dominant indoor source of CO2, the increase in indoor CO2 concentration above the outdoor concentration (approximately 350 ppm) is considered a good surrogate for the indoor concentrations of bioeffluents (e.g., body odors). Additionally, other indoor pollutants may be generated and vary in rough proportion to occupant-generated CO2 ; for example, emissions from office equipment. The indoor CO2 concentration is also often considered to be a surrogate for the rate of ventilation per occupant. However, the indoor CO2 concentration will vary with time even if the ventilation rate and occupancy are constant and, as discussed later, the CO2 concentration is often a poor indicator of ventilation rate.
Ventilation and energy use Ventilation consumes energy, primarily because the ventilation air is thermally conditioned, i.e.,
3
LBNL-43334
heated, cooled, and dehumidified or humidified. In mechanically ventilated buildings, the operation of ventilation fans also consumes energy. The capacity of heating and cooling equipment must also be increased as the amount of ventilation air provided increases. Thus, ventilation rates have often been minimized, particularly after the energy crisis in the early 70’s, in order to reduce equipment and energy costs. Buildings, particularly those in cold climates, have also become more airtight which has reduced ventilation air flow through the building envelope. The ventilation rates selected for buildings must strike a balance between energy consumption by ventilation and the known or postulated benefits of ventilation to health and comfort. Orme (1998) has performed one of the most comprehensive assessments of energy use for ventilation. In a set of 13 countries participating in the IEA Energy Conservation in Buildings & Community Systems Program, the primary energy1 consumption attributable to the ventilation of all buildings is estimated to equal 9% of the total primary energy consumption of the countries. An estimated 3 exojoule (EJ) of energy2 are used annually to ventilate US residential buildings, approximately 30% of the total energy used in these buildings. In the US service sector (e.g., commercial, institutional, and government buildings), the estimated energy consumed for ventilation is ~1.5 EJ, approximately one quarter of total service-sector building energy use (Orme 1998). The annual carbon dioxide emissions attributed to ventilation are approximately 1000 and 800 million tons for the US residential and service sectors, respectively. Climate has a large influence on the energy required to thermally condition ventilation air. In Europe, most of this energy is used for heating the ventilation air. In the U.S., significant energy is used for both heating and cooling. In the humid Miami climate, 86% of the energy is used to remove moisture from the ventilation air. In American-style commercial building ventilation systems with air recirculation, the ventilation rate often has a negligible influence on the energy consumption of fans in the ventilation system; however, energy is required to thermally condition the ventilation air. In European-style ventilation systems without air recirculation, both fan energy and energy for thermal conditioning are affected by the ventilation rate, but the common use of heat recovery from the ventilation air decreases the influence of ventilation rate on building energy consumption.
Ventilation rate measurements The total ventilation rate, because it includes infiltration through the building envelope as well as outdoor air flow through the ventilation system, can usually be measured only by tracer gas methods. In buildings without air recirculation, the ventilation rate can also be determined with reasonable accuracy by measuring supply or exhaust air flow rates. The choice between supply and exhaust flow rate measurements should be based on the indoor air pressure relative to that outdoors. Typically, to reduce moisture problems, the design intent is to underpressurize buildings in cold climates and to overpressurize buildings in warm climates. In underpressurized buildings, the measurement of exhaust flow gives a good estimate for the total ventilation rate, and in over-pressurized buildings the measurement of supply flow rate indicates the total ventilation rate. If return air is mixed with outdoor air and recirculated back to the rooms, the supply flow rate must be multiplied by the proportion of outdoor air in the supply air stream which is measured by a tracer gas procedure or estimated from CO2 measurements in the return air, outdoor air, and mixed air. 1 Primary energy use is higher than the energy consumed within the buildings because of the losses during energy production and transmission to the building. 2 Energy consumed in the building, which is less than primary energy consumption.
4

LBNL-43334
Ventilation rates are also inferred from carbon dioxide measurements. Occupants generate carbon dioxide, causing indoor carbon dioxide concentrations to exceed outdoor concentrations. According to equation (1) the ventilation rate can be estimated if the carbon dioxide source strength and the concentrations of supply air and room air are known (ventilation is the only significant process for carbon dioxide removal). Indoor and outdoor CO2 concentrations are measured and the indoor CO2 source strength is based on the number of occupants in a building and an estimate of their CO2 production. However, this method is subject to several sources of error which are described in detail elsewhere (Persily 1997, Mudarri 1997, ASTM D 6245-98) and summarized below: • Carbon dioxide concentrations have often not stabilized when the measurements are
performed, and the use of non-steady-state values of carbon dioxide concentration in a steady-state mass balance equation usually leads to overestimation of the ventilation rate.
• Carbon dioxide concentrations are often measured using instruments, such as indicator tubes, with large potential errors.
• Concentrations of carbon dioxide in outdoor air vary with location and time, and significant error may result if assumed outdoor concentrations are used in calculations.
• The number, weight, activity and diet of the occupants affect the indoor carbon dioxide generation rate and each of these parameters can only be estimated.
• Indoor carbon dioxide concentrations may be spatially non-uniform and measurements at a few locations may not accurately represent the average concentration in the exhaust air.
• Use of the peak CO2 instead of actual steady state values may produce erroneous ventilation rate estimates, off by a factor of 2 at low ventilation rates, and less at higher ventilation rates (Persily and Dols 1990).
Measurement of carbon dioxide concentration Measurement methods for carbon dioxide are described elsewhere (e.g., IPMVP IEQ-Committee 1999). The sampling strategy for CO2 is extremely important. The indoor CO2 concentration will generally be spatially non-uniform and measurement protocols should be designed to determine the average CO2 concentration in the breathing zone or in the exhaust air streams. Precautions are necessary to avoid measurements in air directly exhaled by building occupants. The CO2 concentration is seldom at steady state in real buildings because of variations in occupancy and ventilation rates. If occupancy and ventilation rate are reasonably stable, the time required to reach steady state depends on the ventilation time constant which is the reciprocal of the air exchange rate of the space; e.g., if the air exchange rate is 0.5 h-1 the time constant is 2 hours. A period of three time constants with a stable occupancy and ventilation rate is required for CO2 concentrations to reach 95% of their steady state value. Three time constants corresponds to 6 hours if the air exchange rate is 0.5 h-1 and to 3 hours if the air exchange rate is 1 h-1.
Ventilation codes and standards and carbon dioxide guidelines The minimum allowed or recommended rate of ventilation is described in national and international building codes and standards. Most commonly, ventilation is expressed in the codes as volume flow of outdoor air, either per occupant or per floor area. In some cases, particularly in residential applications, the ventilation rates may be expressed as minimum air change rate (flow rate per unit indoor air volume) or as a minimum flow per room. Uncertainty regarding appropriate minimum ventilation rates is apparent from the variation among current guideline values and the variation among standards during recent decades. Since 1981, the guideline values have varied from 2.5 Ls-1 per person (ASHRAE 1981) to 20 Ls-1 per person (NKB 61 1991). Currently for non-residential buildings, the guideline values in major standards are close to 10 Ls-1 per person. This number is derived from laboratory experiments in which a
5

LBNL-43334
visiting panel of judges has evaluated the acceptability of the odor in a room containing only sedentary occupants as the pollution sources (Cain et al. 1983, Fanger and Berg-Munch 1986). Approximately 20 % of the panel is dissatisfied when the ventilation rate is 7-8 Ls-1 per person. Dissatisfaction among no more than 20 % is the criterion for acceptable of indoor air quality in some standards (ASHRAE 1989). However, in real buildings occupants are not the only pollution source, and even though ventilation rates are high enough to dilute the body odors to acceptable levels, a higher percentage of occupants often perceive air quality as unacceptable because of other indoor pollution sources (Bluyssen et al. 1995a, 1995b, 1996). In addition to minimum ventilation rate standards, some guidelines and standards list a maximum acceptable indoor carbon dioxide concentration, typically 800 ppm or 1000 ppm. These two concentrations correspond to outdoor ventilation rates of 11.6 and 8.0 Ls-1 per person with sedentary activity (ASTM D 6245-98) at steady state when the concentration of carbon dioxide in outdoor air is 350 ppm. A proposed revision of the American ventilation standard (ASHRAE 1989) and prenormative work for the European ventilation standard (CEN 1998) have proposed that ventilation rates should be based on loads from both occupancy and buildings.
Methods of studies reviewed Two primary types of field studies have been used to investigate the association of ventilation rates with health and perception outcomes. In cross-sectional studies, a type of observational study, data on health (or perception) outcomes, ventilation rates, and other relevant factors are collected in multiple buildings or building spaces and analyzed with statistical models to determine the strength and uncertainty in the associations of ventilation rates with the health outcomes. A major weakness of this study design is that many factors other than ventilation rate which vary among the buildings may influence the health outcomes, confounding the association of ventilation rate with the health outcome. Confounding occurs when a factor related to the outcome is distributed differently in the groups being compared and distorts the relationship being studied. Another potential weakness is that occupants with substantial adverse health effects from an exposure may preferentially leave the buildings or be absent more often. The better cross-sectional studies control for potential confounding factors in the study design or data analyses. Cross-sectional studies can find statistical associations but, without other supporting findings, such studies can not confirm cause and effect relationships. The second major type of study is an experimental or intervention study. In one or more buildings or spaces, the ventilation rate is set sequentially at two or more values and the health outcomes are measured at each ventilation rate. Typically, a few days or a week elapses between the change in ventilation rate and the health assessment. Much of the potential confounding is eliminated with this type of study; for example, personal, job, and most building characteristics are unchanged when ventilation rates are modified. However, there is still a possibility of residual confounding by some parameters, such as indoor temperature, outdoor conditions (temperature, pollen, daylight hours) or job stress, which may vary among the experimental periods, as well as bias from various effects of being studied: placebo effects or repeated questionnaire effects, (Menzies 1993a, Jaakkola 1995). Most confounding and bias effects, however, may be in either direction. The stronger experimental studies measure potential confounding factors and control for them in analyses and also simultaneously study a similar control group which is expected to have comparable levels of confounding factors, but experiences no change in ventilation rate. The changes in health outcomes in the control group are used to “correct” the measured changes in the experimental group. Repeating the experiment several times in a single group reduces the limitations of a study without a control group. This single-group experimental design, called an “interrupted time series with multiple
6
LBNL-43334
replications” is discussed by Cook and Campbell (1979). Regardless of the study design, study participants should not be aware of the experimental conditions – i.e., the study must be blinded, particularly when the outcomes measured are subjective (e.g., questionnaire responses, which are strongly influenced by expectations). Ideally, researchers who interact with participants should also be blinded. The previous paragraphs have referred to potential confounding of the observed associations of health outcomes with ventilation rates. Table 1 lists some of the factors that are potential confounders because they vary among buildings or with time and have commonly been associated with SBS symptoms (Mendell 1993a, 1993b; Menzies and Bourbeau 1997). Unfortunately, some studies have controlled for few or no confounding factors, either in statistical analyses or through use of appropriate control groups. Objectives Our primary aim was to review the evidence for the association of ventilation rate or CO2 concentration with health and other human responses in commercial and institutional buildings based on the studies done to date. We wanted to answer the following more specific questions: 1. Does the magnitude of ventilation rate or carbon dioxide concentration, within the normally
encountered range, affect human health and other human responses? 2. Can a “no-effect” threshold value for the ventilation rate (or carbon dioxide concentration) be
found, above (or below) which the prevalence of negative outcomes does not change measurably?
3. Can an average dose-response relationship between ventilation rates or carbon dioxide concentrations and human responses be inferred from existing research data?
Approach
General approach Our general approach was to identify the relevant papers for the study, to set criteria for including studies in the review, to analyze the available information from studies included, to process the results into a common format, and finally to draw conclusions. The papers were identified through literature searches from the following databases: Medline; Current Contents; Byggdok (a database supported by the Swedish Council for Building Research); Airbase (a database maintained by the Air Infiltration and Ventilation Centre of the International Energy Agency); and a data base of the papers published by the American Society of Heating Refrigerating and Air Conditioning Engineers (ASHRAE). In order to include studies presented at conferences, we also identified relevant papers from proceedings of the following conference series: International Conferences on Indoor Air Quality and Climate, International Conferences on Healthy Buildings, and Indoor Air Quality Conferences organized by ASHRAE. In addition we used our personal contacts to collect research publications relevant to the topic.
Study inclusion criteria The power and precision of a cross-sectional study increases with the number of study buildings or study spaces in which ventilation rates or CO2 concentrations and occupant health outcomes are measured, and also with the number of participants. Increased power reduces the effects of random error, but does not reduce systematic bias. We excluded from consideration any cross-sectional studies with only two buildings or study spaces. We excluded cross-sectional studies not including statistical analyses. We considered potential confounding so important in cross sectional studies that we excluded any studies where confounding by personal factors was not
7

LBNL-43334
controlled either through statistical means, by including approximately similar comparison spaces, or through restrictions in the study population. We included studies which assessed indoor air quality with a human panel, because use of the same panel as an instrument across study spaces and common training of panel members reduces variation in assessments due to personal differences In summary, the criteria for including cross sectional studies in the review were: (1) at least three buildings or ventilation zones, (2) statistical analysis of results, and (3) control for confounding by personal factors as described above. Among experimental studies, we excluded from consideration: experiments with changes in the type of air handling system or with movement of occupants to a different building; studies that did not either use a control group or repeat the experiment, (e.g., change between baseline and modified ventilation rates) more than once in the same group; studies in which the subjects were obviously or most likely aware of the timing of the changes in ventilation rates; and studies that did not use statistical analyses to evaluate the data (unless a substantial change in symptoms was obvious from a plot of the data). All studies which fulfilled the criteria described above were included in our review whether or not statistically significant associations were reported. We were forced to reject almost half of the studies dealing with the topic due to one or several exclusion criteria. As a further criterion of quality among the included studies, we noted those published as peer-reviewed articles.
Processing of the study data In our review we used the information reported in the papers; however, some of the desired study information was not provided unambiguously. In some cases authors were contacted, but the information requested was not provided in all cases. Lacking such guidance, it was necessary to use our judgement to make interpretations, which may have led to some errors in our interpretations. If ventilation rates were not provided in the desired form, they were calculated from information available, sometimes supplemented by default assumptions. As a primary indicator of the magnitude of ventilation we used outdoor air flow rate per person (Ls-1 per person). This was the most commonly reported ventilation rate metric in the reviewed studies, and the metric often used in codes and standards. If the total ventilation rate (mechanical supply plus infiltration) was measured and reported we used it to estimate ventilation rate per person. If only the supply or exhaust air flow rates were measured, we estimated ventilation rates from reported flows and occupancies. In the study by Brundage et al. 1988 we assumed 17 Ls-1 per person supply air flow rate in old barracks, equal to the reported supply air flow rate in the new barracks. Reported recirculation rates of 95 % in new barracks and 60 % in old barracks were used to calculate ventilation rates. In the study by Drinka et al. 1996 we assumed the supply flow rate to be 13 Ls-1 per person, and used reported recirculation rates to calculate ventilation rates. In the study by Zweers et al. (1990) we calculated ventilation rates from reported air exchange rates, and room volume per occupant. Carbon dioxide measurements were reported inconsistently in studies. Only a few reports specified exactly where and when the measurements were done. Some studies used average values, some peak values, and some representative afternoon values. Some assessments used the building average in the analysis, while some used work station concentrations. A number of studies estimated CO2 concentrations with detection tubes, which is a less precise method than the use of infrared or other type of analyzers.
8

LBNL-43334
Estimation of relative risks from prevalence odds ratios Studies have generally reported the strength of associations as relative risks or odds ratios, often adjusted for confounding factors. The relative risk (RR) is generally the prevalence of the outcome in the group with higher prevalence divided by the prevalence of the outcome in the group with lower prevalence (sometimes the reciprocal is reported). The odds ratio (OR) is defined by the equation
OR = [a/(1-a)]/[b/(1-b)] = RR (1-b) / (1-a) (2) where a and b in cross-sectional studies are prevalences of the outcomes in the two groups. If odds ratios were reported in the study, the relative risk (i.e., a/b) has been estimated from equation 2, using reported symptom prevalences. When a and b are less than ~0.2, the OR and relative risk are quite similar numerically. An OR or RR equal to 1.0 denotes no increased risk. Results Description of Ventilation Studies Table 2 summarizes the major features of the studies with measured ventilation rates and lists the papers and reports in which the results of the study have been reported. A study may have assessed the association of ventilation rates with multiple health or perception outcomes or performed multiple analyses using different categories of ventilation rates or different subsets ofstudy data. Consequently, many studies provided multiple assessments (see Table 4) of the associations of ventilation rates with human outcomes. The review included almost 30,000 subjects and more than 350 buildings in fifteen cross-sectional and five experimental studies. Fourteen studies were reported in at least one peer-reviewed article. Most studies included male and female office workers, but some studies were performed with special groups: army trainees (Brundage et al. 1988); elderly people in a nursing home (Drinka et al. 1996); inmates in a jail (Hoge et al. 1994); pupils in a school (Smedje et al. 1996); and hospital personnel (Wyon 1992, Nordström et al. 1995a and b). The human outcome in most studies was the prevalence of SBS symptoms assessed with a self-administered questionnaire. Some studies analyzed results by symptom groups or employed an integrated symptom summation score. The recall period varied considerably between studies (e.g., symptoms last week, symptoms last month, symptoms last year). To reduce errors in the recall of prior symptoms, some studies used questionnaires that asked about current symptom intensity (Wyon 1992, Jaakkola et al. 1994, Menzies et al. 1993a, Bluyssen et al. 1996). Occupants evaluated air quality in five studies, while trained sensory panels made the evaluations in two studies. Panel members evaluated perceived air quality (PAQ) directly after breathing clean outside air, but occupants were adapted to indoor conditions. In three studies, the health outcome was communicable respiratory illness. In one study, short-term sick leave was the outcome (Milton et al. 1999) and respiratory illness was discussed as a probable contributor to short term sick leave. One study used a self-rating of impaired mental performance as an outcome (Smedje et al. 1996), while another used nasal patency3 and biomarkers in nasal lavage (Wålinder et al. 1997, 1998). A factor which may affect study outcomes is the design and use of windows. In most American studies windows were sealed, while in most of the European studies the windows were openable, although possibly not opened during the study. Most of the studies were performed during the winter when windows are most often closed.
3 An indicator of lack of nasal congestion.
9

LBNL-43334
Exposure to environmental tobacco smoke is a potential confounding factor that was not always controlled. In Table 2, a building was considered a non-smoking building if smoking was restricted to designated areas. Many studies did not report if smoking was allowed or restricted. The type of air-handling system varied and was not always reported. Some air handling systems recirculated air and some did not. Some studies included both recirculating and non-recirculating systems. Humidification may also be a confounding factor. Usually, the type of humidification was not specified. The expected accuracy of ventilation rate measurements varies considerably. Ventilation rate was measured with tracer gases in six studies, and with air flow rate measurements in 10 studies. Carbon dioxide concentrations were used in two studies to estimate the ventilation rates. To calculate ventilation rates from reported recirculation rates, we assumed supply air flow rates (see the Table 2 remarks) in the study by Drinka et al. (1996) and for some of the buildings in the study by Brundage et al. (1988). The reported range in ventilation rate was large, ranging from zero to 70 Ls-1 per person. Ventilation rates were reported as zero when the mechanically-supplied air flow rates to a room were zero or too small to measure. These air flow rate measurements do not account for ventilation via air infiltration and inter-room airflows. Ventilation rates of zero are obviously not possible for the long-term average. The control for confounding factors varied considerably. All SBS studies controlled for some personal factors, 13 studies controlled for work- or building-related factors, and just two cross-sectional studies (Bluyssen et al. 1996, Jaakkola and Miettinen 1995) attempted to control for environmental factors.
Description of CO2 studies Table 3 summarizes the major features of studies with measured carbon dioxide concentrations. Of the 21 studies, ten were reported in peer-reviewed articles, and all are cross-sectional except for two experiments. Sixteen studies included ventilation in office buildings, four in school buildings, one in a jail, and one in military buildings, presumably offices. The reviewed studies include more than 30,000 subjects in over 400 buildings, of which over 100 were complaint buildings. Three studies reported ventilation rates, and were also included in Table 2. The most common human outcome was the prevalence of SBS symptoms, assessed with self-administered questionnaires. In four studies, air quality was evaluated by trained sensory panels or by occupants. In one study, the health outcome was communicable respiratory illness (Hoge et al.1994). One study used a computerized test of mental performance as the outcome (Myhrvold et al. 1996). As with the ventilation rate studies, most of the CO2 studies were performed in winter, many failed to control for all suspected confounders, and many failed to report the type of HVAC system and to fully characterize the study buildings. Association of ventilation rates with health and other outcomes For each study, Table 4 provides the following information (when available): key features of the study; the proportion of statistical tests that identified statistically-significant associations between outcomes and ventilation rates; the range of relative
10

LBNL-43334
risks; and the range of outcome prevalences. A study may have included one or several assessments of the association of ventilation rate with health outcomes. The different assessments of a single study may, for example, have been performed using different ventilation rates, different sub populations, or different seasons. Each assessment is described in Table 4 on a single row and noted if reported in a peer-reviewed scientific article. The presence or absence of statistically significant associations of ventilation rates with outcomes is illustrated graphically within the table using an adaptation of the format of Mendell (1993b). For comparison of outcomes at two levels of ventilation rate, each level is represented with a circle, with multiple assessments within single studies displayed separately. Three studies (Bluyssen et al. 1996, Cochet et al. 1995, Ruotsalainen et al. 1994) have both SBS data and perceived air quality as outcomes. These outcomes are presented also separately in Table 4. If the study compared outcomes among groups of workers experiencing different ranges of ventilation rate (e.g., < 10 Ls-1 per person versus > 10 Ls-1 per person), the graph presents the approximate mean ventilation rate within each range. Statistically significant differences in outcomes at different ventilation rates are illustrated graphically within the table by shaded circles, shading indicating at least one significantly worsened health or perception outcome at that ventilation rate. If all circles are unshaded for a comparison, this indicates lack of a statistically significant increase in any outcome with ventilation. In general the criteria for statistical significance are p< 0.05, or a 95% confidence interval that excludes unity. Several studies have recorded the symptoms experienced at several levels or ranges of ventilation, and analyzed the relationship of ventilation rates with outcomes using statistical models. Some of these analyses indicate a dose-response relationship, i.e., a progressive increase in the risk of the outcome as the ventilation rate decreased. In other instances the ventilation rates were represented as a continuous variable in a model and only a model coefficient or correlation coefficient was provided. If ventilation rate was a significant parameter in the model, the finding was interpreted as a dose-response relationship. These findings of dose-response relationships are presented in Table 4 using a horizontal bar, with the darker shaded end representing a worsened outcome. An unshaded bar indicates that no statistically significant relationship was identified. The ends of the shaded and unshaded bars correspond to the range of ventilation rates in the data analyses5. When the ventilation rate has been a continuous parameter in a model, because the model estimates only the average relationship, the maximum ventilation rates for which reported dose-response relationships remain statistically significant usually cannot be determined. The results in Table 4 have been organized by outcome: sick building syndrome, respiratory disease and absence outcomes, perceived air quality, and other outcomes. Within outcome groups, results were organized by whether a relationship was reported, and within these groups, by the lowest ventilation rate included in the assessment. The results show clearly that the magnitude of ventilation was significantly associated with at least one reported outcome in the majority of the studies. All studies of respiratory illnesses found a significant increase in the risk of illness in the group with a lower ventilation rate. The relative risk for respiratory illness varied between 1.51 and 4.7. Theoretical modeling by Nardell (1997) and Nardell et al. (1991) also predicts that ventilation rates will affect the transmission of respiratory illness. Ventilation rates in studies with respiratory disease outcomes were below typical mean ventilation rates in the other studies. 5 An exception is the shaded bar for the study by Sundell (1994), where the bar is terminated at 17 Ls-1 per person because the dose-response relationship is not significant for higher ventilation rates.
11
LBNL-43334
Of 27 assessments (rows in Table 4) with SBS symptoms as outcomes, 20 found a significantly higher prevalence of one or more symptoms with lower ventilation rates, with relative risks or odds ratios between 1.1 and 6 (with one outlier value of 37). The findings of a significantly increased outcome were particularly consistent when the lower ventilation rate was below 10 Ls-
1 per person. Only three of 22 such assessments failed to find lower ventilation rates below 10 Ls-1 per person to be associated with an increase in at least one symptom or symptom group. There was no clear ventilation rate threshold above which no further reduction in SBS symptoms occurs. Several studies, particularly those indicating a dose-response relationship (e.g., Sundell 1994, Jaakkola and Miettinen 1995) suggested that the risk of sick building symptoms continues to decrease with increasing ventilation rates above 10 Ls-1 per person, possibly up to 25 Ls-1 per person (Table 5). In the ventilation rate range of 25 - 0 Ls-1 per person, Jaakkola and Miettinen (1995) found odds ratios of 1.01– 1.3 for each decrease of 1 Ls-
1 per person. However, four assessments did not find increases in ventilation rates above 10 Ls-
1 per person to be associated with a significant change in symptoms. Three studies found a significant increase in the prevalence of symptoms with increases in ventilation rate. Jaakkola and Miettinen (1995) found a significant increase in three out of 13 symptoms (eye, mucosal irritation and allergic reaction) as ventilation rates increased above 25 Ls-1 per person. Jaakkola et al. (1994) found a significant increase in two out of 13 symptoms with a lower air recirculation rate, which corresponded to a higher ventilation rate of 23 Ls-1 per person. Nordström et al. (1995 a) found that two out of 13 symptoms were associated significantly with higher ventilation rates in hospitals. Worsened air quality as perceived by occupants and panels was associated with lower ventilation rates in 7 out of 8 studies. The results of six studies were interpreted as dose response relationships. Nordström (1995 b) provided odds ratios (3.3 for stuffy air and 2.5 for dustiness) per decrease in ventilation rate of 10 Ls-1 per person. These studies also suggest that perceived air quality is improved with increased ventilation rate up to 20 Ls-1 per person. The prevalence of perceived inferior air quality is high. In all six studies with a perceived air quality outcome, up to 50 % of the occupants have considered the indoor air unacceptable even though the study buildings were considered non-complaint buildings. By sorting the results, we attempted to determine whether the relationships of ventilation rates with health or perception outcomes were affected by complaint building status, air recirculation, operability of windows, and smoking restrictions. However, the data were inadequate for such assessments. Several studies included buildings with more than one of these characteristics (e.g., some study buildings had operable windows but other study buildings had non operable windows), and not all studies described the buildings in sufficient detail to make exact classification possible. Also, restricting the review to the findings of the 14 studies reported in peer-reviewed articles did not substantially affect the interpretation. Some studies provided the relative risk or odds ratio for the outcome at several different measured ventilation rates, or presented data from which these relative risks could be calculated. A summary of these studies is presented graphically in Table 5. Relative risk is indicated by columns at each ventilation rate assessed, with the height of the column proportional to the relative risk, and the RR value shown above each column. The column on the right end of the connecting line for each study is the reference, with relative risk and column height equal to one. Double columns are used to indicate the range of relative risks for multiple outcomes -- the higher of the adjoining double columns represents the highest relative risk and
12

LBNL-43334
the lower represents the lowest relative risk. Table 5 also shows the prevalences of the outcomes at the reference ventilation rate. Thus, the prevalence of some outcomes at lower ventilation rates can be estimated by multiplying the relative risk at that ventilation rate by the prevalence at the reference ventilation rate. Association of CO2 concentration with health or perception outcomes The results of the analysis of each study of the association of CO2 with health and perception outcomes are presented in Table 6, using the same format as Table 4. Findings are organized by outcomes, and within these by the highest CO2 concentration. Seventeen of the 32 assessments found that a higher CO2 concentration was significantly associated with a worsening of at least one outcome. Out of 18 assessments with SBS symptoms as outcomes (including studies with naturally ventilated buildings), 9 (50%) found a significantly higher prevalence of symptoms with higher CO2 concentrations. Relative risks and odds ratios were reported in fewer CO2 studies than ventilation rate studies. Relative risks for symptoms in the higher CO2 groups ranged up to 1.85 (Sieber et al. 1998). An odds ratio of 8.0 for ln [CO2 concentration] with nonspecific symptoms was reported by NIOSH (1991). In addition, some studies found a dose-response relationship between outcomes and CO2 concentration (Bright et al. 1992, Sohn et al. 1994). Restricting the review to findings of the ten studies reported in peer-reviewed articles eliminated most of the evidence for relationships. The CO2 concentrations in the studies varied considerably. Table 7 illustrates that the percentage of studies with a significant association between CO2 concentration and SBS symptoms increased as higher concentrations of CO2 were included in the study. There was no clear threshold value for carbon dioxide concentration below which further reductions were not associated with further decreased SBS symptoms. Several studies (7 of 16) suggested that the risk of sick building symptoms continued to decrease with decreasing carbon dioxide concentrations below 800 ppm (corresponding to steady state ventilation rates of 11.6 Ls-1 per person). None of the assessments found an increase of symptoms with decreasing carbon dioxide concentration. Half of the 12 assessments with perceived air quality as outcome reported an association between air quality and CO2 concentration, and suggested that improvements in perceived air quality were associated with decreasing CO2 concentration down to 500 – 600 ppm (corresponding to steady state ventilation rates of 34.7 - 20.8 Ls-1 per person). While some studies used total SBS symptom scores, several studies tested for the association of several specific SBS symptoms (or symptom groups) with ventilation rates or carbon dioxide concentrations. We reviewed the data to determine if specific symptoms were most commonly associated significantly with ventilation rate or CO2 concentration; however, we were not able to identify symptoms or symptom groups which were consistently associated with ventilation rate or CO2 concentration. Significant associations with general symptoms including headache were reported in seven studies. Five studies reported significant associations with fatigue and significant associations with eye symptoms were reported in six studies. Significant associations with nasal symptoms were reported in four studies. Respiratory tract symptoms, which included several sub-groups such as throat symptoms, multiple lower respiratory symptoms, and breathing difficulties, were significantly associated with ventilation rates or CO2 concentrations in four studies. Some studies reported significant associations with mucous membrane symptoms without specifying the exact end points.
13
LBNL-43334
Discussion
Overall findings from ventilation studies Summarizing findings of multiple studies based on statistical significance alone (as in the review by Mendell 1993b) can be too conservative, ignoring consistent effects across studies and persuasive dose-response patterns within studies, when they lack statistical significance due to small study size. In particular, this strategy may systematically fail to detect real and important, yet small, differences in outcomes between relatively high ventilation rates. Our strategies here for synthesizing findings across studies overcomes some of the limitations in the previous review. This review contains a substantially larger number of studies, it includes for review only studies meeting specific quality criteria, and it considers two crucial additional aspects of study findings beyond statistical significance: estimated magnitude of the difference in outcome between ventilation rates (when available), and findings of dose-response relations between outcomes and ventilation rate. Some remaining limitations inherent either in the review or the studies reviewed include: use of mean ventilation rates estimated from other reported numbers, less accurate ventilation measurements in some studies; and measurement of ventilation rates over large areas of buildings rather than more locally. Each of these limitations may introduce random error into ventilation rate estimates; however, all these errors unless systematically related to the outcome would tend to obscure any existing relationships between ventilation and outcome. Also, dose-response relationships indicated by coefficients or slopes for continuous ventilation rate variables cannot be interpreted properly as showing significant association of ventilation with outcomes throughout the entire range of included ventilation rates. The results of our review indicate that lower ventilation rates within the normally encountered range (2.5 - 30 Ls-1 per person) were significantly associated with both increased health effects and worsened perceived air quality. The reported or estimated relative risks were over 2.0 in five of 14 assessments and over 1.8 in nine assessments, indicating that changes in ventilation rates had a considerable influence on health outcomes and perceived air quality. SBS symptom prevalences at the higher reference ventilation levels were over 20 % in half of the assessments. If the prevalence at the reference ventilation rates is 20%, a relative risk of 1.8 corresponds to a prevalence of 36 % in the population with the lower ventilation rate. Thus, changes in ventilation rates potentially influence symptoms in a substantial proportion of the workforce. The association of ventilation rates with health and perceived air quality (PAQ) was more consistent in assessments of buildings or spaces with lower ventilation rates. Such a finding was expected because changes in ventilation rates by a few Ls-1 per person will have a larger influence on indoor pollutant concentrations when the initial ventilation rate is low (because the percent change in ventilation rate is larger). Our findings are consistent with those of Mendell (1993b). Based on six studies, he reported a consistent association of higher SBS symptom prevalences with lower outside air ventilation rates below 10 Ls-1 per person. Of the 196 studies meeting our selection criteria which included ventilation rates less than 10 Ls-1 per person, lower ventilation rates in 18 of these studies were significantly associated with a worsening of at least one health or PAQ outcome7. Thirty-one assessments in Table 4 included buildings or spaces
6 In this context, the research of Jaakkola (1991a) is counted as two studies, one experimental and one cross-sectional. 7 In one study the outcome was a self-assessment of impaired mental functioning.
14

LBNL-43334
with ventilation rates below 10 Ls-1 per person, and in 27 of these assessments lower ventilation rates were significantly associated with worsening of at least one health or PAQ outcome. A significant association was not found in the cross-sectional study by Jaakkola et al. (1991a), which was conducted in a single large building. Several unusual factors were present: (1) the ventilation system was unusual with air supplied to the hallways and exhausted only from the perimeter offices; (2) smoking was allowed in both designated smoking areas and in private offices; (3) subjective symptom reporting on questionnaires may have been less reliable in this building because occupants were dissatisfied with having been moved to a new location and with management. The experimental study of Jaakkola et al. (1994) also did not find variation in the recirculation rate from 0 to 70 % (which affected the ventilation rate) to be associated with SBS symptoms. The measured outdoor air ventilation rates were 6 and 23 Ls-1 per person. The absence of an association may possibly be explained by one or several of the following factors: (1) there were only 72 subjects within two buildings; (2) occupants recorded their symptoms daily in a diary - a method not used in other studies; and (3) the buildings were not designed for the particularly high or low recirculation rates used in the experiments, which changed indoor pressure differences and may have caused an increased spread of indoor pollutants. Jaakkola and Miettinen 1995 and Jaakkola et al. 1994 found a significant increase in prevalence of symptoms with increases in ventilation rates. These studies were performed in Finland in winter, when very low indoor humidities occur with high ventilation rates as in other cold climates. Due to low outdoor air temperatures, the water content (humidity ratio) outdoors is very low (below 1 g H2O per kg dry air) during the winter time in Nordic countries. Low relative humidities also have been measured in buildings. Reinikainen et al. (1991) reported relative humidity of 10-20 % in a Finnish office building, Sundell et al. (1994) reported a median value for relative humidity of 23.8 % in 160 Swedish office buildings. Nordström et al. (1995) studied symptoms and perceived air quality in eight hospitals and reported a significant increase in 2 of 13 symptoms with higher ventilation rates; however, the higher ventilation rates were associated with better perceived air quality. This contradictory result may possibly be a consequence of low relative humidity caused by increased ventilation rates. Low relative humidity increases the drying of mucous membranes, but improves the perceived air quality (Fang et al. 1998). A cross sectional study in Swedish schools (Wålinder et al. 1998) found objectively measured nasal patency and biomarkers for allergic reactions to be associated significantly with ventilation rate expressed as air changes per hour, but did not find these outcomes to be significantly associated with ventilation rate per person. This result suggests significant pollution from a source, unrelated to occupant density, in the school buildings, such as emissions from building materials or bioaerosol emissions from moisture damaged structures. Ventilation rates were low in this study, ranging on average from 1.1 to 9 Ls-1 per person. We were not able to identify a no-effect threshold value of ventilation rate above which further increases had little or no effect on outcomes. The absence of such a threshold based on studies performed in a diverse set of buildings may be a consequence of the variation among buildings in pollutant sources and in many other factors that affect indoor air quality. Additionally, fewer studies have been performed with ventilation rates above ~ 15 Ls-1 per person; thus, the available data may be insufficient for detection of a threshold.
15

LBNL-43334
Two studies with ventilation rates above 10 Ls-1 per person failed to detect an association of ventilation rate with health or PAQ outcomes. Wyon (1992) changed the ventilation rate to 70 and 140 % of the design value in some sections of a hospital, and did not report statistically significant changes in the prevalence of SBS symptoms. The number of subjects in these experimental groups was relatively small, 51 and 65. Also, hospitals have many sources of pollutants and a range of types of rooms with different ventilation rates. Thus, the measured ventilation rates may be a poorer surrogate for pollutant exposures in hospitals than in other buildings. Menzies et al. (1993a) changed the ventilation rates in the range of 14 – 30 Ls-1 per person by adjusting the proportion of recirculated air in the supply air stream, and the prevalence of SBS symptoms did not change significantly after controlling for other factors. The reported ventilation rates were relatively high even during the low ventilation period, and the method based on CO2 measurements is relatively inaccurate. Changes in high ventilation rates have a lower probability of substantially reducing adverse exposures. Ventilation rates were estimated from CO2-measurements using a steady state mass balance, e.g., Equation 1, and this method of estimating ventilation rates is subject to several sources of error. A dose-response relationship between ventilation rate and SBS symptoms was indicated in three studies including six different assessments (Groes 1995, Sundell et al. 1994, Wu et al. 1996). A dose-response relationship between ventilation rate and PAQ outcomes was indicated in six assessments (Bluyssen et al. 1996, Groes 1995, Nordström et al. 1995b, Palonen et al. 1990, Cochet et al. 1995, Zweers et al. 1990). In addition, Smedje et al. (1996) reported a dose-response relationship with subjectively assessed mental performance. Dose-response relationships increase the robustness of the findings, because they are less likely to be chance findings than associations involving only two ventilation rates. We were not able to identify symptoms or symptom groups which were consistently associated with ventilation rate or CO2 concentration. The inconsistency of the pattern of associated symptoms may be due to different causative agents in studied groups of buildings. As increased ventilation reduces the concentrations of many contaminants in the air, it is possible that the agents causing the symptoms have been different in different buildings. The graphical presentation of results in Table 4 may over-emphasize the significance of the relationship of ventilation rates with SBS symptoms. The graphs indicate positive associations for all studies that found one or more symptoms to be significantly associated with ventilation rates. However, in most of these same studies several SBS symptoms were not significantly associated with ventilation rates, and in one case the relationship is based on one symptom out of nine (Ruotsalainen et al. 1994). However, as discussed below the overall findings are unlikely to be due to chance.
Overall findings from CO2 studies Results of the studies on the association of CO2 concentrations with health and PAQ outcomes generally support the findings of an association of ventilation rates with outcomes; however, a larger proportion of the CO2 studies, compared to ventilation rate studies, failed to find a significant association of CO2 with health or perceived air quality outcomes; this was particularly true among the findings reported in peer-reviewed articles. We suspect that the less consistent findings of the CO2 studies are due to the temporal variation in indoor CO2 concentrations. CO2 concentrations vary each day with time elapsed after the start of occupancy, even when the rate of outside air supply is stable. The timing of CO2 measurements, and the CO2 metrics used in the analyses (e.g., peak value, measured range), varied among the studies; thus, the measured
16

LBNL-43334
CO2 concentrations reflect the measurement time as well as the rate of air supply per occupant. More consistent results would be expected if all studies used either the peak or time-average indoor carbon dioxide concentration. The spatial variability in indoor CO2 concentrations and the variability in the outdoor concentration have also not been addressed in many of the studies. Only two studies reported CO2 as the differences between indoor and outdoor CO2 concentrations, a more reliable indicator of the ventilation rate than indoor concentration. Outdoor air concentrations were reported only in six studies out of 22; these data showed a significant variation in outdoor air concentration (275 – 549 ppm). The large range of reported values are also likely to reflect measurement errors. The CO2 values in the assessments depicted in Table 6 are subject to instrument measurement errors, failures to account for the variable outdoor carbon dioxide, and failure to standardize measurement locations and times. These factors may cause some of the CO2 concentration ranges or means depicted in the graphic section of table 6 to be in error by a significant amount, on the order of 100 ppm. We do not expect systematic errors (i.e., in one direction) in the CO2 concentrations in relation to the associated health outcomes. Therefore, these inaccuracies will make it more difficult to detect actual associations and generally bias the estimated relative risks or odds ratios from these studies toward 1.0, causing observed associations with health outcomes to be smaller than the true associations.
Chance Association Most of the studies with SBS symptom outcomes assessed the associations of ventilation rates with specific or grouped SBS symptoms. With the typical criteria for statistical significance (p<0.05), there will be a statistically significant association due to chance found in about one out of 20 analyses where no real association exists. Thus, the following question arises: are the significant associations identified in these studies likely to be just chance associations? For several reasons, these findings appear not to be mere chance associations. First, when no actual relationship exists, chance negative associations are as probable as chance positive associations. However, there are only four reported significant negative associations (i.e., worse outcomes at higher ventilation rates), compared to 20 positive associations. Second, in every study with a reported significant association, the number of significant associations for different outcomes relative to the number of statistical tests performed exceeds the one in 20 expected by chance. Three assessments out of four with respiratory illnesses as the outcome found a statistically significant association in more than half of the statistical tests. 16 out of 20 assessments with sick building symptoms as the outcome found a statistically significant association in more than half of the statistical tests. In ten assessments with individually recorded SBS symptoms, five found an association with more than half of the recorded symptoms. These proportions are much higher than expected by chance. Third, as discussed above, there are several reported dose-response relationships, which are less likely to be caused by chance. Confounding Confounding can occur when some factor that varies in the study is associated with the independent variable (e.g., ventilation rate) and also affects the dependent variable (e.g., SBS symptom prevalence). The variability in the confounding factor can distort the measured relationship between the independent and dependent variable. Many, perhaps all, of the studies have not controlled for all of the important confounders. Confounding factors may have influenced associations found between ventilation and occupant outcomes in individual studies; however, confounding, which can increase or decrease the measured association, seems to be an unlikely explanation for the generally consistent findings of this review. The personal and work-related confounders (listed in Table 1), environmental tobacco smoke, and dusty surfaces
17

LBNL-43334
are not likely to be associated in a consistent manner with ventilation rates. In addition, many studies have controlled for some of these potential confounders. The remaining potential confounders from Table 1 are sealed windows, type of ventilation system, humidification, building age, quantity of carpet or textile surfaces, air temperature, and air humidity. A brief discussion of the potential for confounding by each of these factors follows: • Sealed windows might influence health or PAQ via some psychosocial or lighting-related
mechanism (typically buildings with sealed windows have deeper bays and different illumination conditions). However, ventilation rates were associated with health symptoms in studies of buildings with all-openable windows (Sundell et al. 1994, Jaakkola and Miettinen 1995, Palonen et al. 1990, Ruotsalainen et al. 1994, Smedje et al. 1996) and with all-sealed windows (Gamble et al. 1986, Milton et al. 1999, Wu et al. 1996). Also, window characteristics were controlled in the experimental studies. . Overall, a high level of confounding with window type seems unlikely.
• The type of ventilation system may be associated with ventilation rate in the cross sectional studies and also associated with the risk of microbiological or other pollutant sources in the ventilation systems that cause symptoms. However, such confounding would be an unlikely source of the observed dose-response relationships and such confounding did not occur in the experimental studies. Additionally, naturally ventilated buildings, although associated with lower symptom prevalence, appear more likely to have lower ventilation rates (Bluyssen et al. 1996, Sundell et al. 1994). Three large studies (Bluyssen et al. 1996, Jaakkola and Miettinen 1995, Sundell et al. 1994) which reported significant associations with ventilation included buildings with several ventilation and air conditioning system types.
• Humidification systems have been linked with SBS symptoms, and humidification is more common in cold dry climates where there is an increased incentive to save energy by reducing ventilation. However, several of the cross-sectional studies with significant associations did not include humidified buildings (Jaakkola et al. 1991 a and b, Jaakkola et al. 1995, Palonen et al. 1990, Ruotsalainen et al. 1994, Smedje et al. 1996). Significant associations were also reported in studies limited to humidified buildings (Milton et al. 1999) and studies with both non-humidified and humidified buildings (Bluyssen et al. 1996, Sundell et al. 1994). The latter studies controlled for humidification in the data analysis. Furthermore, humidification would not confound experimental ventilation studies.
• Carpets and textile surfaces have been associated with SBS symptoms and carpets and textiles may be more common in newer buildings that may have lower ventilation rates. Such confounding seems an unlikely explanation for the overall findings because some cross-sectional studies and all experimental studies controlled for carpets and other “fleecy” surfaces. Also, the association of fleecy surfaces with ventilation rate is weak, and possibly non-existent.
• Increased air temperatures have been associated with an increased prevalence of SBS symptoms and worsened perceptions of indoor air quality. However, there is no overriding reason to expect systematically higher temperatures with lower ventilation rates. Also, some studies have controlled for temperature in the data analyses.
• Humidities that are particularly low have been associated with increased skin and mucous membrane symptoms in a few studies. These particularly low humidities are more likely to be associated with high ventilation rates in cold climates than with low ventilation rates. Higher humidities have been linked with worsened PAQ in laboratory research and higher humidity may be associated with decreased ventilation. Thus, humidity could be an uncontrolled confounder in some studies. However, in field studies, higher humidity has not been consistently or strongly associated with increased SBS symptoms.
18

LBNL-43334
• Building age may be a surrogate for a number of risk factors for SBS symptoms and poorer PAQ. The association of age with ventilation rate is based on the expectation that more recent concerns about energy use have resulted in less leaky building envelopes and ventilation system designs with lower ventilation rates. However, the ventilation system design does not necessarily determine the ventilation rate. For many designs, with recirculation of return air the ventilation rates can be set within a wide range. Also, there is no confirmation of a strong association of building age with ventilation rate. The age of buildings may be related to the types and strengths of indoor pollutant sources. Older buildings may have a higher probability of microbiological contamination. Newer buildings, particularly those that are very new, may have more or stronger sources of volatile organic compounds emitted by building materials. However, excluding very new buildings, the association of VOCs with age is likely to be weak because buildings are periodically refurbished. Also the emissions of VOCs from consumer products and equipment may not differ substantially between newer and older buildings. Overall, a high level of confounding with building age seems unlikely.
Other sources of bias A bias common to most or all studies seems improbable as an explanation of our overall findings. There is no reason to expect that the building selection process causes a relevant bias, since the investigators do not know the ventilation rates prior to making measurements. Building occupants are almost always unaware of ventilation rates; thus, symptom reporting should be unbiased by any expectations regarding the effects of ventilation. There are many sources of error in ventilation rate measurements, but the direction of the errors should be independent of the building ventilation rate and these errors would reduce the ability to detect real relationships. Finally, we have no reason to expect that researchers have intentionally or unintentionally caused bias during their data analyses. Publication bias remains a possibility, since studies finding significant associations are more often published than those finding no associations; however, lack of associations in this research area are considered of importance and are readily publishable (Menzies et al. 1993a, Wyon et al. 1992). Reported ventilation rates in the studies reviewed are likely to be biased downward because most of the data are based on air flow rate measurements, which will not account fully for air infiltration. Thus the actual ventilation rates are in most cases higher than reported and shown in Tables 3 and 4. Simultaneous flow rate and tracer gas measurements by Nagda et al. (1990, 1991) and Persily et al. (1987) showed almost 50 % higher ventilation rates with tracer gas measurements than with air flow rate measurements in buildings with very low ventilation rates. The mechanical supply of outdoor air often does not exceed the rate of mechanical exhaust airflow by an amount sufficient to pressurize the building and prevent air infiltration because the building envelopes are leaky (Persily et al. 1987). The likelihood of such a systematic measurement bias in most studies reviewed, and the generally consistent associations between ventilation rates and symptoms, suggests that true ventilation rates even higher than those found in this review are associated with improved occupant outcomes. The errors in CO2 determinations, from instrument errors, failure to account for outdoor CO2, etc., will lead to random misclassification of buildings as having reported values of CO2 that are higher or lower than actual values. Such a random misclassification will make it more difficult to detect actual associations between CO2 and health outcomes and will tend to bias the odds ratios or relative risks towards no effect.
Relative risks and excess risk The reviewed studies reported relative risks of 1.5 to 4.7 for respiratory illnesses and 1.1 to 6 for sick building symptoms. The most representative study data from US office buildings (Brightman
19
LBNL-43334
et al. 1999) found that 20% and 25% of office workers reported that they experienced work-related upper-respiratory or eye symptoms, respectively, at least once per week. Typical prevalences of individual sick building symptoms in European buildings are of the same magnitude, ranging from 7 to 32 % (Bluyssen et al. 1996). The results of Jaakkola (1995) indicate that each 1 Ls-1 per person change in ventilation rate between 0 and 25 Ls-1 per person (which includes most indoor environments) is associated with a relative risk of 1.1 for experiencing symptoms. Assuming this relationship is causal, we can estimate that a 5 Ls-1 per person increase in ventilation rate in US office buildings would reduce the proportion of occupants with frequent upper respiratory symptoms (as defined above) from 25% to 16%. The corresponding estimated reduction in prevalence of eye symptoms is from 22% to 14%. Similarly, a 5 Ls-1 per person decrease in ventilation rate would increase the proportion of occupants with frequent upper respiratory symptoms from 25% to 40%, with an increase for eye symptoms of similar magnitude. Published discussions of ventilation rates and health have generally not discussed how scientific findings could be used to determine health-protective ventilation rates. There is a tradition among indoor environment practitioners that conditions are acceptable which dissatisfy no more than 20% of the population. This is presumably based on customs in the field of thermal comfort. Health risk assessments, by contrast, usually assess excess risk of disease relative to a maximum acceptable excess risk above a background (unexposed) level, where the acceptable excess risk depends on the severity of the health effect. Excess lifetime risks considered acceptable may range from 10-6 or 10-5 for potentially fatal outcomes such as cancer, to 10-3 for less serious outcomes. Applying this strategy to effects of ventilation rate would involve determining baseline levels of health effects, and deciding what additional risk was acceptable. Many studies report the association of ventilation rates with health outcomes only as a model coefficient or report that a significant dose-response was found within that range. These findings help corroborate that a relationship exists, but are not easily used in making decisions about recommended ventilation rates. By assuming a linear relationship throughout the ventilation rates included, they provide no information on whether the relationship in fact holds equally throughout this range. Reporting formats that distinguish the magnitude of outcome differences at multiple specific ventilation levels would be more usable, both in future studies, and in recalculations from previous studies. One format particularly useful for public health decision making would estimate risks, relative to background levels (e.g., high ventilation rates with minimal exposure to indoor pollutants), for various levels of the risk factor (e.g., lower ventilation rates with resulting higher concentrations of indoor pollutants). Figure 1 provides an example of relative risk plots for two kinds of symptoms in relation to various lowered ventilation rates relative to 21 Ls-1 in two buildings. The purpose of this plot is to illustrate how data on the risks of low ventilation rates could be presented for public health purposes. The excess risk for a symptom, at each ventilation rate, would be the relative risk at that ventilation rate minus 1. This figure does not present a generic relation even though it is derived from real data points (unadjusted relative risks from Wu 1996). These results also do not show that ventilation rates above 21 L/s-1 per person would not further reduce risks -- the ventilation rate 21 Ls-1 per person was used as the reference value in the figure because it was the highest ventilation rate included in the study.
Other issues The ventilation rate in most studies reviewed was expressed in Ls-1 per person. The ventilation rate can be converted to Ls-1 per square meter of floor area in most but not all of these studies.
20

LBNL-43334
The floor space per occupant was in the range of 15-25 m2 per person in most of the office buildings except in the Asian study (Wu 1996) which had much less space per person (3-4 m2 per person). When the conversion to Ls-1 per m2 was made, ventilation rates below 1 Ls-1m-2 appeared to be associated with an increased risk of adverse health effects and poor PAQ. With the available data, we could not determine if the outcomes were more strongly and consistently associated with ventilation per person or ventilation per unit floor area. This review suggests that in many cases increases in ventilation rates are associated with improved occupant health; however, increases in ventilation rates will also often increase building energy consumption and the initial costs of HVAC systems and supporting utility infrastructure. The study data in this review indicate substantial variation in ventilation rates both within and among buildings, consistent with earlier findings (Fisk et al. 1992, Lagus Applied Technologies 1995, Teijonsalo et al. 1996). The large range of ventilation rates within buildings suggests an opportunity to improve health and PAQ through better balancing and control of air flows within buildings. Ventilation rates may be increased in rooms with unusually low ventilation rates and simultaneously decreased in rooms with unusually high ventilation rates. Due to the dose-response relationships evident from this review, the average level of SBS symptoms and PAQ should be improved without increasing the total ventilation rate of the building or the associated energy use. There is an analogous opportunity to alleviate symptoms and improve PAQ in the overall building stock without increasing energy consumption, by increasing ventilation rates in buildings with low ventilation rates and decreasing ventilation rates in buildings with high ventilation rates. It seems quite possible that better ventilation control and balancing could simultaneously improve health and PAQ outcomes while saving energy. In a European study, buildings with lower energy consumption also had a lower rate of building-related symptoms (Bluyssen et al. 1996, Roulet et al. 1995). This finding suggests that well-designed buildings which are operated by qualified, well-trained personnel who understand both the requirements for good indoor air quality and energy efficiency can have healthy environments and maintain energy efficiency. Indoor air quality is affected by many factors other than ventilation rates. The quality of supply air is important as well as the spatial and temporal distribution of fresh air. Several strategies for ventilation exist, such as displacement ventilation or ventilation with energy recovery, which improve indoor air quality without increasing energy consumption. Additionally, reductions in indoor pollutant sources8 are often the most effective and energy efficient means of improving indoor air quality. In the best cases, improvements in indoor air quality and energy savings are achieved simultaneously. Some of these technologies and strategies are discussed in Seppänen (1999), ECA 17 (1998), Hall et al. (1998) and IPMVP IEQ Committee (1999). In addition to energy savings and improved health, improved control of ventilation rates and other measures that improve indoor air quality in commercial buildings are a likely source of productivity gains. The potential productivity gains from reduced respiratory illnesses and SBS symptoms have been discussed in detail by Fisk and Rosenfeld (1997, 1998) and Seppänen and Palonen (1998). The primary sources of productivity gains are reduced health care costs, reduced absence from work, and increases in the performance of workers while at work. These costs and the financial values of the reduced absences and performance increases are of the same magnitude as the total energy cost of the buildings, much larger than the costs of energy for ventilation (Seppänen and Palonen 1998, Seppänen 1999)
8 However, we do not yet have substantial data linking specific reductions in pollutant sources with improved health outcomes.
21
LBNL-43334
Conclusions and Implications The complex relationship between ventilation rate and indoor air quality greatly complicates research on the associations of ventilation rates with health outcomes and perceived air quality. Many of the studies have failed to control for important potential confounders or have incompletely characterized the study buildings and study methods. The difficulties and inaccuracies in ventilation rate measurements have also served as a barrier to this area of research. Almost all the studies included in this review found that ventilation rates below 10 Ls-1 per person were associated with a significantly worse prevalence or value of one or more health or perceived air quality outcomes. Most of these studies have been conducted in office buildings. Available studies further show that increases in ventilation rates above 10 Ls-1 per person, up to approximately 20 Ls-1 per person, are sometimes associated with a significant decrease in the prevalence of SBS symptoms or with improvements in perceived air quality. Data from multiple studies also indicate a dose-response relationship between ventilation rates and health and perceived air quality outcomes, up to approximately 25 Ls-1 per person; however, available data are not sufficient to quantify an average dose-response relationship. The less consistent findings for relationships in the range above 10 Ls-1 per person are compatible with the prediction that benefits per unit increase in ventilation would be likely to diminish at higher ventilation rates and, thus, be more difficult to detect epidemiologically. Only five studies were conducted in hot humid climates; thus, the results of this review apply primarily to moderate and cool climates. Based on these results, we conclude that in office buildings or similar spaces constructed using current building practices, increases in ventilation rate in the range between 0 and 10 Ls-1 per person will, on average, significantly reduce occupant symptoms and improve perceived air quality. Increases in ventilation rate above 10 Ls-1 per person up to 20 Ls-1 per person may further reduce symptoms and improve air quality, although these benefits are currently less certain based on available data. No threshold for effects is evident at 10 Ls-1 per person or at any other specific ventilation rate. As ventilation rates increase, benefits gained for occupants per additional unit of ventilation are likely to decrease in magnitude and to require larger studies for convincing demonstration. Benefits which have yet to be consistently demonstrated in this way (e.g., for ventilation rates above 10 Ls-1 per person) may still be of substantial public health importance. Ventilation standards thus may need to periodically revisit the available evidence for occupant benefits at particular ventilation rates, and the magnitude of these benefits, weighed against the current incremental costs of increasing ventilation. This process would be new, as minimum ventilation rates in existing codes and standards do not substantially reflect health data such as is reviewed here. Furthermore, buildings in practice often fail to deliver even the minimum ventilation rates required by current or previous building codes (e.g., of the 15 cross-sectional surveys included in Table 2, 10 surveys include buildings with ventilation rates below 2.5 Ls-1 per person). These low ventilation rates usually do not violate building codes and standards, which generally specify minimum rates for ventilation system design but not for system operation. New or revised building codes and standards may need to specify minimum ventilation rates during building occupancy to maintain acceptable levels of occupant health and satisfaction. Buildings with economizer cycle control systems have a minimum ventilation rate and increase the rate of ventilation above this minimum during mild weather. Changing the set point for minimum ventilation rate in these buildings will influence health symptoms during periods of low ventilation when the control system reduces the ventilation rates close to the minimum.
22

LBNL-43334
Limitations in existing data make it essential that future studies better assess health and PAQ changes in the ventilation rate range between 10 and 25 Ls-1 per person. Future research should be based on well-controlled cross-sectional studies or well-designed blinded and controlled experiments. The most effective studies will include high quality measurements of ventilation rates, ample study size and power to detect effects considered of public health importance, and if possible, improved measures of adverse occupant outcomes; e.g., more sensitive or more objective assessment tools. Future research should also assess the associations of health outcomes with ventilation rates per unit floor area and place a greater emphasis on buildings that are not offices. In addition to new studies of ventilation effects on occupants, we also need studies to specify the causative agents of adverse health outcomes. The most effective strategies to improve indoor air quality (e.g., source removal) cannot be specified before the agents and their sources are known. When this information is available the ventilation rates necessary to control exposures can be calculated using equation (1), and rational decisions made between effectiveness of source control and adjustment of ventilation. Because increases in ventilation may increase building energy consumption, research is also needed to identify practical methods of decreasing minimum ventilation requirements by reducing pollutant emissions from buildings and building air handling systems. Methods to increase ventilation rates without increasing energy consumption, or to increase the effectiveness of ventilation in controlling pollutant exposures, should also be investigated. Acknowledgements This review was supported with a grant from the Finnish Academy and by the Assistant Secretary for Energy Efficiency and Renewable Energy, Office of Building Technology, State, and Community Programs, Office of Building Systems of the U.S. Department of Energy (DOE) under contract No. DE-AC03-76SF00098. Authors are grateful to the authors of the original papers who have supplied additional information on request. The authors thank Mike Apte, Joan Daisey, David Grimsrud, and Kai-Shen Liu for their many insightful comments on a draft of this document. References ACGIH (1991) Documentation of the Threshold Limit Values and Biological Exposure Indices,
Sixth Edition. American Conference of Governmental Industrial Hygienists, Inc. Cincinnati, Ohio.
Aizlewood, C., Raw, G. and Oseland, N. (1996). “A study of office building environment in eight office buildings”, Proceedings of Indoor Air ’96, 2: 895-900. , Seec Ishibashi, Inc. Japan
Apte, M, Daisey, J. (1999) “Indoor CO2 concentrations and sick building syndrome: analysis of the 1994-1996 BASE study data” Lawrence Berkeley National Laboratory, Berkeley, CA. To be submitted to Indoor Air.
ASHRAE (1981), ASHRAE standard 62-1981, “Ventilation for acceptable indoor air quality”, American Society of Heating, Refrigerating and Air Conditioning Engineers, Atlanta.
ASHRAE (1989), ASHRAE standard 62-1989, “Ventilation for acceptable indoor air quality”, American Society of Heating, Refrigerating and Air Conditioning Engineers, Atlanta.
ASTM D 6245-98 (1998), “Standard guide for using indoor carbon dioxide concentrations to evaluate indoor air quality and ventilation”, American Society for Testing Materials, American West Conshohocken, PA
Berg-Munch B., Clausen B.G., Fanger P.O. (1986) “Ventilation requirements for the control of body odor in space occupied by women", Environment International 12: 195-199.
23
LBNL-43334
Björkroth, M., Seppänen, O. and Torkki, A. (1998) “Chemical and sensory emissions from HVAC components and ducts”, In: Moschandreas, D. (editor) Design, Construction, and Operation of Healthy Buildings - Solutions to Global and Regional Concerns, American Society of Heating, Refrigerating, and Air Conditioning Engineers, Atlanta. pp. 47-55.
Bluyssen, P.M., de Oliviera Fernandes, E., Groes, L., Clausen, G., Fanger, P.O., Valbjorn, O., Bernhard C.A. and. Roulet, C.A. (1996) “European indoor air quality audit project in 56 office buildings”, Indoor Air, 6: 221-238.
Bluyssen, P., de Oliveira Fernandes, E., Fanger, P.O., Groes, L., Clausen, G., Roulet, C.A., Bernhard, C. and Valbjorn, O. (1995a) ”European audit project to optimize indoor air quality and energy consumption in office buildings”. Final report, March 1995, The Commission of the European Communities, Joule II – programme, Contract JOU-CT92-0092.
Bluyssen, P.M., de Oliviera Fernandes E., Groes, L., Clausen G., Fanger, P.O., Valbjorn, O., Bernhard, C.A. and Roulet C.A. (1995b) “European audit study in 56 office buildings: Conclusions and recommendations”. Proceedings of Healthy Buildings ’95, 1287-1304.
Bright, D.P., Mader, M.J., Carpenter, D.R. and Hermon-Cruz, I.Z. (1992) “Guide for indoor air quality surveys”, Armstrong Laboratory, AL-TR-1992-0016, Brooks Air Force Base, Texas.
Brightman, H.S., Wallace, L.A., Sieber, W.K., McCarthy, J.F., and Spengler, J.D. (1999). “Comparing symptoms in United States office buildings”, Proceedings of Indoor Air ’99, vol. 1, pp. 847-852. Construction Research Communications Ltd., London.
Brundage, J.F., Scott, R.M. and Lednar, W.M., Smith, D.W. and Miller, R.N. (1988) "Building-associated risk of febrile acute respiratory diseases in army trainees", Journal of the American Medical Association, 259(14): 2108-2112.
Cain, W., Leaderer, R., Isseroff, L., Berglund, R., Huey, E., Lipsitt, E. and Perlman, D. (1983) “Ventilation Requirements in buildings – I. Control of occupancy odor and tobacco smoke”, Atmospheric Environment, 17(6): 1183-1197.
Carpenter, D. and Poitrast, B., (1990) “Recommended carbon dioxide and relative humidity levels for maintaining acceptable indoor air quality”, AF Occupational and Environmental Health Laboratory (AFSC), Human Systems Division, AFOEHL Report 90-169CA00111KGA.
CEN 1998. “Ventilation for buildings; Design criteria for indoor environment”, CEN Technical Report CR 1752.
Cochet, C., Ribéron, J. and Kirchner, S. (1995) “Reported symptoms, ventilation performance and building characteristics in six French office buildings” Proceedings of Healthy Buildings ’95, 3: 1359-1364.
Cook, T.D. and Campbell (1979) “Quasi-experimentation: design and analysis issues for field settings”, Houghton Mifflin Co., Boston.
Drinka, P., Krause, P., Schilling, M., Miller, B., Schult, P., and Gravenstein, S. (1996) “Report of an outbreak: Nursing home architecture and influenza-A attack rates”, Journal of American Geriatric Society, 44(8): 910-913.
ECA 17 (1998) “Indoor air quality and the energy use of buildings”. European Collaborative Action. Indoor Air Quality & its Impact on Man. Report 17, Office for Official Publications of the European Communities, Luxembourg.
Emmerich, S. and Persily, A. (1999) “ Energy impacts of infiltration and ventilation in U.S. office buildings using multi-zone airflow simulation”, Proceedings of IAQ & Energy 98, American Society of Heating, Refrigerating and Air Conditioning Engineers, Atlanta. pp. 191-203
Fang, L., Clausen, G. and Fanger, P.O. (1998) “Impact of temperature and humidity on the perception of indoor air quality”, Indoor Air, 8(2): 80-90.
Fanger, P.O. and Berg-Munch, B. (1983) “Ventilation and body odor”, Proceedings of Management of Atmospheres in Tightly Enclosed Spaces, American Society of Heating, Refrigerating and Air Conditioning Engineers, Atlanta, pp. 45 - 50.
Fisk, W.J. and Faulkner, D. (1992). "Air Exchange Effectiveness in Office Buildings: Measurement Techniques and Results." Proceedings of the 1992 International Symposium
24

LBNL-43334
on Room Air Convection and Ventilation Effectiveness, July 22-24, Tokyo, pp. 213-223, American Society of Heating, Refrigerating and Air Conditioning Engineers, Atlanta.
Fisk, W.J., Mendell, M.J., Daisey, J.M., Falkner, D., Hodgson, A.J., Nematollahi, M., Macher, J.M. (1993) “Phase I of the California Healthy Building Study: A Summary Indoor Air 3: 246-254.
Fisk, W. and Rosenfeld, A. (1997) “Estimates of improved productivity and health from better indoor environments”, Indoor Air, 7(3): 158-172.
Fisk, W. and Rosenfeld, A. (1998) “Potential nationwide improvements in productivity and health from better indoor environments”, Proceedings of the 1998 Summer School Study on Energy Efficiency in Buildings, American Council for an Energy-Efficient Economy, Asilomar, California, pp. 8.85-8.97.
Gamble, J., Morey, P., Richards, T., Petersen, M. and Castellan, R. (1986) “Building-related respiratory symptoms: problems in identification”, Proceedings of IAQ ’86, American Society of Heating, Refrigerating and Air Conditioning Engineers, Atlanta, pp. 16-30.
Groes, L. (1995) “The European IAQ-audit project, Statistical analysis of indoor environmental factors”, Ph.D. thesis, Laboratory of Heating and Air Conditioning, Technical University of Denmark.
Groes, L., Raw, G. and Bluyssen, P. (1995) “Symptoms and environmental perceptions for occupants in European office buildings”, Proceedings of 4th International conference on Healthy Buildings, 1293-1298
Hall, J., Mudarri, D. and Werling, E. (1998) “Energy impacts of indoor environmental quality modifications to energy efficiency projects”, Proceedings of IAQ & Energy 98, American Society of Heating, Refrigerating and Air Conditioning Engineers, Atlanta. pp. 171-179.
Hedge, A., Erickson, W.A. and Rubin, G. (1995) “Individual and occupational correlates of the sick building syndrome”, Indoor Air, 5(1): 10-21.
Hill, B.A., Craft, B.F. and Burkart, J.A. (1992) “Carbon dioxide, particulates, and subjective human responses in office buildings without histories of indoor air quality problems”, Applied Occupational Environmental Hygiene 72(2): 101-111.
Hodgson, M.J., and Collopy. P. (1989) ”Symptoms and the micro-environment in the sick building syndrome: A pilot study”, Proceedings of IAQ ‘89, American Society of Heating, Refrigerating and Air Conditioning Engineers, Atlanta. pp. 8-16.
Hoge, C.W., Reichler, M.R., Dominguez, E.A., Bremer, J.C., Mastro,T.D., Hendricks, K.A., Musher, D.M., Elliott, J.A., Facklam, R.R. and Breiman, R.F. (1994) “An Epidemic of pneumococcal disease in a overcrowded, inadequately ventilated jail”, The New England Journal of Medicine, 331: 643-648.
IPVMP, IEQ committee (1999). Indoor environmental quality: Introduction, linkage to energy conservation, and measurement and verification. Appendix to the 1999 version of the International performance measurements and verification protocol. www.IPVMP.org
Jaakkola, J.K.K. (1995) “Sick building syndrome: the phenomenon and its air-handling etiology”, Helsinki University of Technology, Faculty of Mechanical Engineering. Laboratory of Heating, Ventilating and Air Conditioning. Report A2, Espoo, 121 pages.
Jaakkola, J.J.K., Heinonen, O.P., and Seppänen, O. (1991a) "Mechanical Ventilation in Office Buildings and the Sick Building Syndrome. An Experimental and Epidemiological Study." Indoor Air, 1: 111-122.
Jaakkola, J.J.K. and Miettinen, P. (1995) “Ventilation rate in office buildings and sick building syndrome” Occupational and Environmental Health, 52: 709-714.
Jaakkola, J.K.K., Reinikainen, L.M., Heinonen, O.P., Majanen, A. and Seppänen, O. (1991 b) “Indoor air requirements for healthy office buildings: recommendations based on an epidemilogic study”, Environment International, 17: 371-378.
Jaakkola, J.J.K., Tuomaala, P. and Seppänen, O. (1994) “Air recirculation and sick building syndrome: A blinded crossover trial”, American Journal of Public Health, 84(3): 422-428.
25

LBNL-43334
Janssen,J., Wolff, A. (1986) “Subjective response to ventilation” Proceedings of IAQ’86, American Society of Heating, Refrigerating and Air Conditioning Engineers, Atlanta. pp. 161-170.
Lagus Applied Technologies (1995) “Air change rates in non-residential buildings in California”, Report P400-91-034BCN, California Energy Commission, Sacramento, CA.
Mader M.J. and O’Neal, M.J. (1994) Attachment 2 of testimony and evidence for OSHA’s notice of proposed rule making on occupational exposure to indoor air quality, OSHA Docket H122, Indoor Air Quality, Exhibit 10-144.
Marmot, A.F., Eley J., Nguyen M., Warwick E. and Marmot M.G. (1997) “Building health in Whitehall: An epidemiological study of causes of SBS in 6,831 civil servants”, Proceedings of Healthy Buildings ’97, 2: 483-488, Healthy Buildings/ IAQ’97 Washington DC
Mendell, M.J. (1993a) “Optimizing research on office worker symptoms: Recommendations from a critical review of the literature”, Proceedings of Indoor Air ’93, 1: 713-720. Indoor Air'93, Helsinki
Mendell, M.J. (1993b) “Non specific symptoms in office workers: a review and summary of the epidemiologic literature”, Indoor Air, 3: 227-236.
Menzies, D. and Bourbeau, J. (1997) “Building related illnesses”, The New England Journal of Medicine, 337(21): 1524-1531
Menzies, R., Tamblyn, R., Farant, J.-P.,Hanley J., Nunes, F. and Tamblyn, R. (1993a) “The effect of varying levels of outdoor-air supply on the symptoms of sick building syndrome”, The New England Journal of Medicine, 328(12): 821-827.
Menzies, D., Tamblyn, R.M., Nunes, F., Leduc, J., Pasztor, J. and Tamblyn, R.T. (1993b) “Varying ventilation conditions to provide a more complete assessment of building HVAC operation and indoor air quality”, Proceedings of Indoor Air ’93, 6: 551-556. Indoor Air'93, Helsinki
Milton, D., Glencross, P. and Walters M. (1998) “Illness related work absence associated with workplace ventilation and humidification”. American Journal of Respiratory Critical Care Medicine, 157: A647.
Milton, D., Glencross, P. and Walters M. (1999) “Risk of sick leave associated with outdoor ventilation level, humidification, and building related complaints”. Harvard School of Public Health, submitted to the New England Journal of Medicine.
Mudarri, D. (1997) “Potential correction factors for interpreting CO2 measurements in buildings”, ASHRAE Transactions, 103(2): 244-255
Myhrvold, A., Olesen, E., and Lauridsen O. (1996) “Indoor environment in schools – pupils health and performance in regard to CO2 concentrations”, Proceedings of Indoor Air’ 96, 4: 369-374
Nagda, N.L., Koontz, M.D. and Albrecht, R.J. (1991), “Effect of ventilation rate in a healthy building”, Proceedings of IAQ ’91, American Society of Heating, Refrigerating and Air Conditioning Engineers, Atlanta. pp. 101-107.
Nagda, N., Koontz, M., Lumby, D., Albrecht, R. and Rizzuto, J. (1990), “Impact of increased ventilation rates on office building air quality”, Proceedings of Indoor Air ’90, 1: 281-286. International Conference on Indoor Air Quality and Climate, Inc., Ottawa, Ontario
Nardell, E., Keegan, J., Cheney, S. and Etkind, S. (1991) “Airbone infection. Theoretical limits of protection achievable by building ventilation. American Review of Respiratory Disease, 144: 302-306.
Nardell, E.A. (1997) “Environmental control of drug resistant tuberculosis in industrial and developing countries”, Proceedings of Healthy Buildings ’97, 1: 301-313, Healthy Buildings/ IAQ’97 Washington DC
Nelson, N.A., Kaufman, J.D., Burt,J. and Karr, C. (1995) “Health symptoms and the work
26
LBNL-43334
environment in four non-problem United States office buildings”, Scandinavian Journal on Work Environment and Health, 21: 51-59.
Nelson, C.J., Calyton, C.A., Wallace, L.A., Highsmith, V.R., Kollander, M., Bascom, R. and Leaderer, B.P. (1991) “EPA’s indoor air quality and work environment survey: relationships of employee’s self-reported health symptoms with direct indoor air quality measurements”, Proceedings of IAQ’ 91, American Society of Heating, Refrigerating and Air Conditioning Engineers, Atlanta. pp. 14-21.
NIOSH (1991) “Health Hazard Evaluation Report”, Indoor air quality and work environment study, volume III, HETA 88-364-2104- vol. III, Library of Congress, National Institute For Occupational Safety and Health.
NKB 61 (1991) “Indoor Climate - Air Quality”, NKB Publication No 61 E. Nordic Committee on Building Regulations.
Norbäck, D. (1995) “Subjective indoor air quality in schools – the influence of high room temperature, carpeting, fleecy wall materials and volatile organic compounds (VOC)”, Indoor Air, 5(4): 237-246.
Nordström, K., Norbäck, D. and Akselsson, R. (1995a) “Influence of indoor air quality and personal factors on the sick building syndrome (SBS) in Swedish geriatric hospitals”, Occupational and Environmental Medicine, 52: 170-176
Nordström, K., Norbäck, D. and Akselsson, R. (1995b) “Subjective indoor air quality in hospitals – The influence of building age, ventilation flow, and personal factors”, Indoor Environment, 4: 37-44.
Orme, M. (1998) “ Energy impact of ventilation”, Technical Note 49, International Energy Agency – Air Infiltration and Ventilation Centre, Coventry, Great Britain.
Palonen, J. and Seppänen, O. (1990) “Design criteria for central ventilation and air-conditioning system of offices in cold climate”, Proceedings of Indoor Air ’90 1: 299-304. International Conference on Indoor Air Quality and Climate, Inc., Ottawa, Ontario
Persily, A. (1997) “Evaluating building IAQ and ventilation with indoor carbon dioxide”, ASHRAE Transactions 103(2):193-204.
Persily, A. and Norford L. (1987) “Simultaneous measurements of infiltration and intake in an office building”, ASHRAE Transactions 93(2): 42-56
Persily, A. and Dols, W.S. (1990) “The relation of CO2 concentration to office building ventilation”, ASTM Special Technical Publication 1067-1990, pp. 77-91, American Society for Testing and Materials, West Conshohocken, PA
Reinikainen, L., Jaakkola, J. and Heinonen, O. (1991) “The effects of air humidification on different symptoms in office workers – an epidemiologic study”, Environment International, 17: 242-250
Roulet, C., Bluyssen, P., Ducarme, D., de Oliveira Fernandes, E., Ribedon, J. and Wouters, P. (1995) “Ventilation performance and energy consumption in European office buildings”, Proceedings of 4th International conference on Healthy Buildings,: 1299-1304.
Ruotsalainen, R., Jaakkola, N. and Jaakkola, J.J.K. (1994) “Ventilation rate as a determinant of symptoms and perceived odors among workers in daycare centers”, Environment International, 20(6): 731-737
Seppänen, O. (1999) “ Ventilation strategies for good indoor air quality and energy efficiency”, Proceedings of IAQ & Energy 98, American Society of Heating, Refrigerating and Air Conditioning Engineers, Atlanta. pp. 257-276.
Seppänen, O. and Palonen, J. (1998) “The effect of indoor climate on national economy” (in Finnish with English summary of nine pages), Finnish Society of Indoor Air Quality and Climate.
Sieber, W., Wallingford, K. and Allen, J. (1998) “Carbon dioxide levels in the indoor office
27

LBNL-43334
environment”, Proceedings of the Section of Statistics and the Environment, pp 115-117, American Statistical Association, August 9-13, Dallas, Texas.
Smedje, G., Norbäck, D. and Edling, C. (1996) “Mental performance by secondary school pupils in relation to the quality of indoor air”, Proceedings of Indoor Air’ 96, 1: 413-418
Smedje, G., Norbäck, D. and Edling, C. (1997) “Subjective indoor air quality in schools in relation to exposure”, Indoor Air, 7: 143-150.
Sohn, J-Y., Park, J-S., Park, B-Y., Yoon, D-W. and Minamino, O. (1994) “Experimental research on the indoor air quality and sick building syndrome in office buildings”, Proceedings of Healthy Buildings 94, pp. 397- 406.
Steele, T. and Brown, M. (1990) “ASHRAE Standard 62-1989: Energy, Cost, and Program Implications”, DOE/BP-1657, Bonneville Power Administration, Portland, OR.
Stenberg. B., Erikson N., Hoog, J. Sundell, J. and Wall, S. (1994) “The sick building syndrome (SBS) in office workers, a case-reference study of personal, psychosocial and building-related risk indicators”, International Journal of Epidemiology, 23(6): 1190-1197.
Sundell, J. (1994) “On the association between building ventilation characteristics, some indoor environmental exposures, some allergic manifestations and subjective symptom reports”, Indoor Air, 4, Supplement No. 2/94.
Sundell, J., Lindvall, T., Stenberg, B. (1994a) “Association between type of ventilation and air flow rates in office buildings and the risk of SBS-symptoms among occupants”, Environment International, 20(2): 239-251.
Sundell, J., Lindvall, T. Stenberg, B. and Wall, S. (1994b) “Sick building syndrome (SBS) in office workers and facial skin symptoms among VDT-workers in relation to building and room characteristics: Two case-referent studies”, Indoor Air, 4, Supplement No. 2/94.
Teijonsalo, J. and Jaakkola, J.J. and Seppänen, O. (1996) “The Helsinki office environmental study: Air change in mechanically ventilated buildings”, Indoor Air, 6(2): 111-117.
Turk, B.H., Brown J.T., Geisling-Sobatka, K., Froelich, D.A., Grimsrud, D.T., Harrison, J., Koonce, J.F., Prill, R.J., and Revzan, K.L. (1987) “Indoor Air Quality and Ventilation Measurements in 38 Pacific Northwest Commercial Buildings--Volume 1: Measurement Results and Interpretation”, Lawrence Berkeley Laboratory Report, LBL-22315 1/2, Berkeley, CA.
Wålinder, R., Norbäck, D., Wieslander, G., Smedje, G., and Erwall, C., Venge P (1998) “Nasal patency and biomarkers in nasal lavage – the significance of air exchange rate and type of ventilation in schools”, International Archives Occupational Environmental Health 71: 479-486
Wålinder, R., Norbäck, D., Wieslander, G., Smedje, G., and Erwall, C. (1997) “Nasal mucosal swelling in relation to low air exchange rate in schools”, Acta Otolaryngol, 117: 724-727
WHO (1983) Indoor pollutants: exposure and health effects, report of a WHO meeting. EURO Reports and Studies No. 78. World Health Organization Regional Office for Europe, Copenhagen.
Wu, X. and Wang, G-H. (1996) Fresh air make up, air distribution principle, and sick building syndrome, Proceedings of Indoor Air’96, 2: 919-922.
Wyon, D.P. (1992) "Sick Buildings and the Experimental Approach", Environmental Technology, 13: 313 - 322.
Wyon, D., Andersson, B., and Söderling, M. (1991) “ Fältprovning av ett nytt åtgärdspaket mot SBS (Sjuka Hus Syndromet): stegvis teknisk sanering med kvantitativ mätning av symptomintensitetet”, Project report to AMF, 80 p, with English summary. Malmö, Sweden: Sjukvården Malmö, Allmän Service, 21401 Malmö
Wålinder, R., Norbäck, D., Wieslander, G., Smedje, G., Erwall, C. and Venge, P. (1998) “ Nasal patency and biomarkers in nasal lavage – the significance of air exchange rate and type of
28
LBNL-43334
ventilation in schools”, International Archives of Environmental Health, 71: 479-486. Wålinder, R., Norbäck, D., Wieslander, G., Smedje, G. and Erwall, C. (1997) “Nasal congestion
in relation to low air exchange rate in schools”, Acta Otolanryngol, 117: 724-727 Zweers, T., Preller, L., Brunekreef, B. and Boleij, J.S.M. (1992) “Health and comfort complaints
of 7043 office workers in 61 buildings in the Netherlands”, Indoor Air, 2(3): 127-136. Zweers, T., Skov, P., Valbjørn, O. and Mølhave, L. (1990) “The effect of ventilation and pollution
on perceived indoor air quality in five town halls”, Energy and Buildings, 14: 175-181.
29

LBNL-43334
30
0
1
2
3
4
0 10 20 30
Ventilation Rates (L/s,p)
Rel
ativ
e R
isk
S1-ChestS1-Dizz/Head S2-ChestS2-Dizz/Head
Example Only, Not for Generalizations
Figure 1. An example of relative risk plots for two kinds of symptoms (chest = rate of chest distress and dizz/head = rate of dizziness and headache) at various lowered ventilation rates relative to 21 Ls-1in two buildings (S1 and S2). This figure does not present a generic relation even though it is derived from real data (Wu 1996). Table 1. Examples of potential confounding factors in studies of ventilation rates and SBS symptoms. Personal Characteristics
Work-Related Factors
Building-Related Factors
Indoor Environmental Factors
Gender Atopy (allergic disposition) History of asthma Smoking history Job type Medical treatment (especially for asthma and atopy)
Job stress or satisfaction Use of carbonless copy paper Use of or proximity to photocopy machines Use of video display terminals
Type of ventilation system Type of humidification Quantity of carpet or textile surfaces Sealed windows Building age
Air temperature Air humidity Environmental tobacco smoke Dusty surfaces

LBNL-43334
Num
ber o
f stu
dy*
Firs
t aut
hor o
f main
pap
erYe
ar
Stud
y rep
orte
d als
o in
thes
e pa
pers
,
see
refe
renc
es b
elow
Build
ing s
elect
ion c
riter
ia
Build
ing ty
peSe
aled
(S) o
r ope
nable
(O) w
indow
s
Smok
ing
No o
f buil
dings
Ty
pe o
f stu
dySe
ason
Outc
omes
ass
esse
dTy
pe o
f occ
upan
tsNo
of s
ubjec
ts
Floo
r are
a (m
2 per
occ
upan
t)
Repo
rted
rang
e of
vent
ilatio
n, L
s-1 pe
r
pers
onRe
circu
lation
by H
VAC
Hum
idific
ation
Hour
s of
Ope
ratio
nVe
ntila
tion
mea
sure
men
t C
onfo
unde
rs c
ontro
lled
in de
sign
or
analy
sis
Rem
arks
1 Bluyssen 96 1,2,3,4,5 R O S,O Y/N 56 CS W SBS, PAQp,o M/F 6537 13.2 0 - 56 Y/N N/Y N/A Tr,FM P,B,W,E a
2 Brundage 88 R B S,O N Several CS WY ARD M 2.6x10⁶ 10 1.2 - 10 Y N/A 24 E P,B b
3 Cochet 95 R O S,O N/A 6 CS W SBS M/F 615 14-25 4.2-19.8 Y/N Y/N N/A Tr,FM P,B,W c
4 Drinka 96 NR NH N/A N/A 4 CS W influenza E 690 N/A 3.9 - 13 Y/N N/A 24 E N/A d
5 Gamble 86 C O S Y 1 CS W SBS M/F 1115 N/A 0 - 60 Y N/A N/A FM P e
6 Hoge 94 C J N/A Y 1 CS F Pneumonia M 6700 3.2-7.4 2.0-3.8 Y N/A 24 FM P f
7 Jaakkola 91a 6 C O O Y 1 CS,Exp W SBS M/F 1719 N/A 0 - 70 N N 10 FM P,W,B g
8 Jaakkola 94 NR O O Y 2 Exp W SBS, PAQo M/F 75 N/A 6-23 Y N 10 Tr,FM P,W,B h
9 Jaakkola 95 R O O N 14 CS W SBS M/F 399 N/A 2.5 - >25 N N N/A Tr,FM P,W,B,E j
10 Menzies 93a NR O S Y/N 4 Exp Sp,F SBS M/F 1546 N/A 14 - 30 Y Y N/A CO2 P,W,B k
11 Milton 99 7 NR O,M S N/A 40 CS WY Sick leave M/F 3720 N/A 12.0 - 24.0 Y Y N/A CO2 P,W l
12 Nordström 95a 8 R H O Y/N 8 CS W SBS, PAQo F 235 N/A 0.6 - 17.2 N N 24 FM P,B,E m
13 Palonen 90 NR O O Y/N 5 CS W PAQo M/F 580 N/A <2.5 -> 15 Y N N/A FM P n
14 Ruotsalainen 94 R DC O N 30 CS W SBS F 268 N/A 0 -11 N N N/A FM P,W,B nn
15 Smedje 96 R S O N 11 CS Sp Performance C 627 N/A 0.1 - 19 N N N/A FM P,B,E o
16 Sundell 94 9,10,11 R O O Y/N 160 CS W SBS M/F 4943 6-15 <2 - 50 Y/N Y/N N/A Tr,FM P,B,W p
17 Wu 96 C O S N 2 Exp N/A SBS M/F 46 2.3-3.4 4.2 - 20.8 Y N/A N/A FM P,B r
18 Wyon 92 12 C H O N 1 Exp W SBS M/F 561 6.6-10.0 12.0 - 24.0 N N 24 FM P,B s
19 Wålinder 98 13 R S N N 12 CS W Nasal M/F 279 N/A 1.1 - 9.0 N N Tr P,B,E ss
20 Zweers 90 NR O O N/A 4 CS W PAQp(acc) M/F 53 6.1-9.8 5.9 - 19.6 N/Y N N/A FM P t
*Published as a peer-reviewed article if study number is bold
Table 2. Studies of measured ventilation rates and health or other human outcomes. Several studies include more than one assessment of ventilation data and outcomes.

LBNL-43334
u e
Table 2. Continued.Key: Building selection criteria: R= representative, NR=non-representative, C= complaint buildings
Outcomes: SBS = SBS symptoms, PAQ = perceived air quality by occupants (o) or by panel (p) , ARD = acute respiratory disease
B ilding type: O=office building, S=school, NH=nursing home, J=jail, M=Light manufacturing, DC=day care center Type of study: CS=cross sectional, Exp=experimental
Season: W=winter, Sp=spring, S=summer, F=fall, WY=whole year Type of occupants: F=female, M=male, C=children, E=elderly people
V ntilation measurements: Tr=tracer gas, FM=flow measurements, CO2=estimated from carbon dioxide concentration, E=estimated from HVAC data
Controlled confounders: P=personal factors, W=work related factors, B=building factors, E=environmental factors
References: 1= Bluyssen et al. 95a, 2=Groes et al. 95, 3=Groes 95 , 4= Roulet et al. 95, 5= Bluyssen et al. 95b, 6= Jaakkola 91b, 7=Milton et al. 98, 8=Nordström et al. 95b
9= Sundell et al. 94a, 10=Sundell et al. 94b, 11=Stenberg et al. 94, 12=Wyon et al. 91, 13= Walinder et al. 97
Remarks a) Includes 7 naturally ventilated buildings and various ventilation systems, 56 buildings in 9 countries, 226 measured rooms include open spaces and private offices
b) Number of subjects: Assumed 10 m2 per trainee, 2.6 106 trainee weeks corresponds 50000 trainee years, exact number of buildings is not available
c) Buildings were also part of the European Audit Project, Study # 1, includes a few naturally ventilated buildings
d) Ventilation calculated from 30 and 70 % recirculation rates assuming supply air flow rate of 13 L/s per person
e) Only office floors 2-7 included in the comparison, mold damage was suspected, study included a control building
f) Overcrowded jail, with high occupant density
g) Mechanical supply to hallways, exhaust from offices, ventilation rates changed in some parts of the building, one part as reference
h) No significant pollution sources in buildings,70 % and 0% recirculation rates, supply air flow was constant, double blind six week cross over experiment
j) Subset of 14 buildings from original random sample of 41 buildings with similar air handling systems k) Two week blind cross over experiment
l) Original sample of 65 buildings included office, trade and manufacturing workers in 150 floors, ventilation estimated from CO 2 measurements and design
m) 8 geriatric hospitals, rotary heat recovery systems, ventilation range is the range of means, number of rooms not available, only workers included in the study
n) 5 buildings with various ventilation systems nn) Windows closed during the measurements, but used for airing during the operation hours
o) 11 schools with various ventilation systems, 4 natural ventilation systems included, subjective impaired mental performance of pupils as outcome
p) Heterogeneous buildings with respect to ventilation characteristics and other building factors, sample includes also small (<15 occ) buildings, and a few naturally ventilated buildings
r) Experiments in two office buildings, with high occupant density s) Hospital building, ventilation experiment limited to two sections of building
ss) Included 4 buildings with natural ventilation t) Buildings are subset from Danish Town Hall study
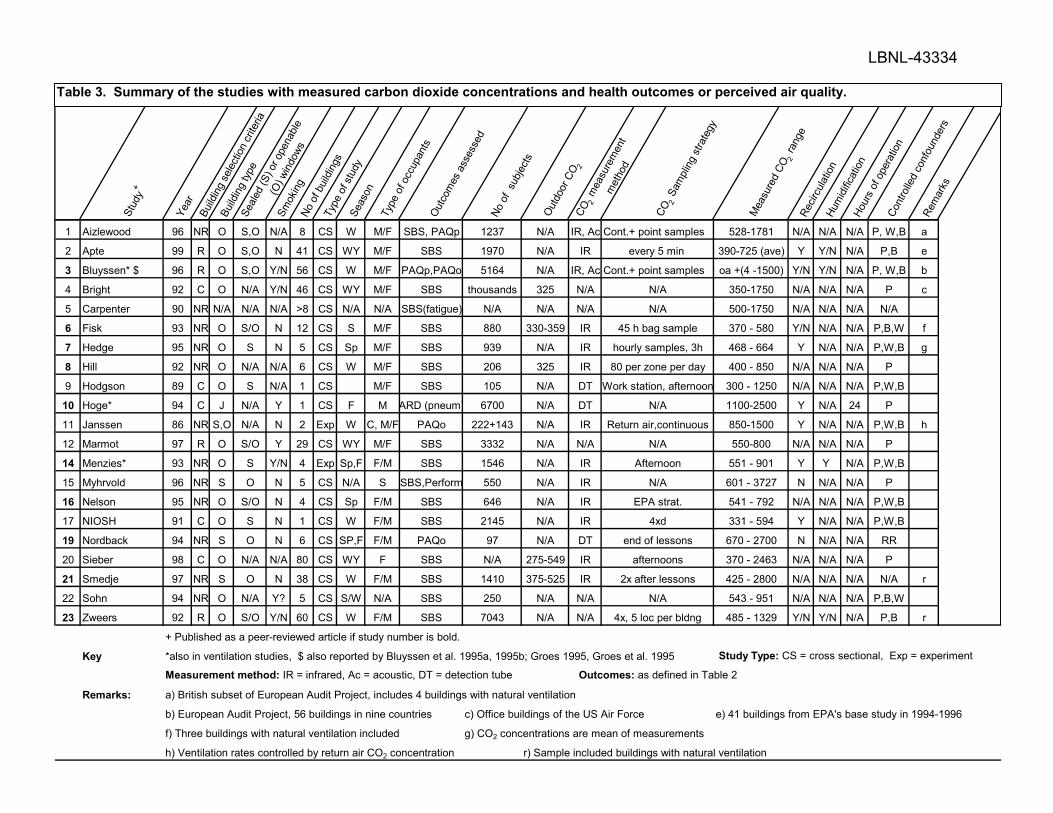
LBNL-43334
St
udy
+
Year
Build
ing s
elect
ion c
riter
ia
Build
ing ty
peSe
aled
(S) o
r ope
nable
(O) w
indow
s
Smok
ingNo
of b
uildin
gsTy
pe o
f stu
dySe
ason
Type
of o
ccup
ants
Outc
omes
ass
esse
d No
of
subje
cts
Outd
oor C
O 2CO
2 m
easu
rem
ent
met
hod
CO2 S
ampli
ng s
trate
gy
Mea
sure
d CO
2 ra
nge
Recir
culat
ionHu
midi
ficat
ionHo
urs
of o
pera
tion
Cont
rolle
d co
nfou
nder
sRe
mar
ks
1 Aizlewood 96 NR O S,O N/A 8 CS W M/F SBS, PAQp 1237 N/A IR, Ac Cont.+ point samples 528-1781 N/A N/A N/A P, W,B a
2 Apte 99 R O S,O N 41 CS WY M/F SBS 1970 N/A IR every 5 min 390-725 (ave) Y Y/N N/A P,B e
3 Bluyssen* $ 96 R O S,O Y/N 56 CS W M/F PAQp,PAQo 5164 N/A IR, Ac Cont.+ point samples oa +(4 -1500) Y/N Y/N N/A P, W,B b
4 Bright 92 C O N/A Y/N 46 CS WY M/F SBS thousands 325 N/A N/A 350-1750 N/A N/A N/A P c
5 Carpenter 90 NR N/A N/A N/A >8 CS N/A N/A SBS(fatigue) N/A N/A N/A N/A 500-1750 N/A N/A N/A N/A
6 Fisk 93 NR O S/O N 12 CS S M/F SBS 880 330-359 IR 45 h bag sample 370 - 580 Y/N N/A N/A P,B,W f
7 Hedge 95 NR O S N 5 CS Sp M/F SBS 939 N/A IR hourly samples, 3h 468 - 664 Y N/A N/A P,W,B g
8 Hill 92 NR O N/A N/A 6 CS W M/F SBS 206 325 IR 80 per zone per day 400 - 850 N/A N/A N/A P
9 Hodgson 89 C O S N/A 1 CS M/F SBS 105 N/A DT Work station, afternoon 300 - 1250 N/A N/A N/A P,W,B
10 Hoge* 94 C J N/A Y 1 CS F M ARD (pneum) 6700 N/A DT N/A 1100-2500 Y N/A 24 P
11 Janssen 86 NR S,O N/A N 2 Exp W C, M/F PAQo 222+143 N/A IR Return air,continuous 850-1500 Y N/A N/A P,W,B h
12 Marmot 97 R O S/O Y 29 CS WY M/F SBS 3332 N/A N/A N/A 550-800 N/A N/A N/A P
14 Menzies* 93 NR O S Y/N 4 Exp Sp,F F/M SBS 1546 N/A IR Afternoon 551 - 901 Y Y N/A P,W,B
15 Myhrvold 96 NR S O N 5 CS N/A S SBS,Perform 550 N/A IR N/A 601 - 3727 N N/A N/A P
16 Nelson 95 NR O S/O N 4 CS Sp F/M SBS 646 N/A IR EPA strat. 541 - 792 N/A N/A N/A P,W,B
17 NIOSH 91 C O S N 1 CS W F/M SBS 2145 N/A IR 4xd 331 - 594 Y N/A N/A P,W,B
19 Nordback 94 NR S O N 6 CS SP,F F/M PAQo 97 N/A DT end of lessons 670 - 2700 N N/A N/A RR
20 Sieber 98 C O N/A N/A 80 CS WY F SBS N/A 275-549 IR afternoons 370 - 2463 N/A N/A N/A P
21 Smedje 97 NR S O N 38 CS W F/M SBS 1410 375-525 IR 2x after lessons 425 - 2800 N/A N/A N/A N/A r
22 Sohn 94 NR O N/A Y? 5 CS S/W N/A SBS 250 N/A N/A N/A 543 - 951 N/A N/A N/A P,B,W
23 Zweers 92 R O S/O Y/N 60 CS W F/M SBS 7043 N/A N/A 4x, 5 loc per bldng 485 - 1329 Y/N Y/N N/A P,B r
+ Published as a peer-reviewed article if study number is bold.
Key *also in ventilation studies, $ also reported by Bluyssen et al. 1995a, 1995b; Groes 1995, Groes et al. 1995 Study Type: CS = cross sectional, Exp = experiment
Measurement method: IR = infrared, Ac = acoustic, DT = detection tube Outcomes: as defined in Table 2
Remarks: a) British subset of European Audit Project, includes 4 buildings with natural ventilation
b) European Audit Project, 56 buildings in nine countries c) Office buildings of the US Air Force e) 41 buildings from EPA's base study in 1994-1996
f) Three buildings with natural ventilation included g) CO2 concentrations are mean of measurements
h) Ventilation rates controlled by return air CO2 concentration r) Sample included buildings with natural ventilation
Table 3. Summary of the studies with measured carbon dioxide concentrations and health outcomes or perceived air quality.
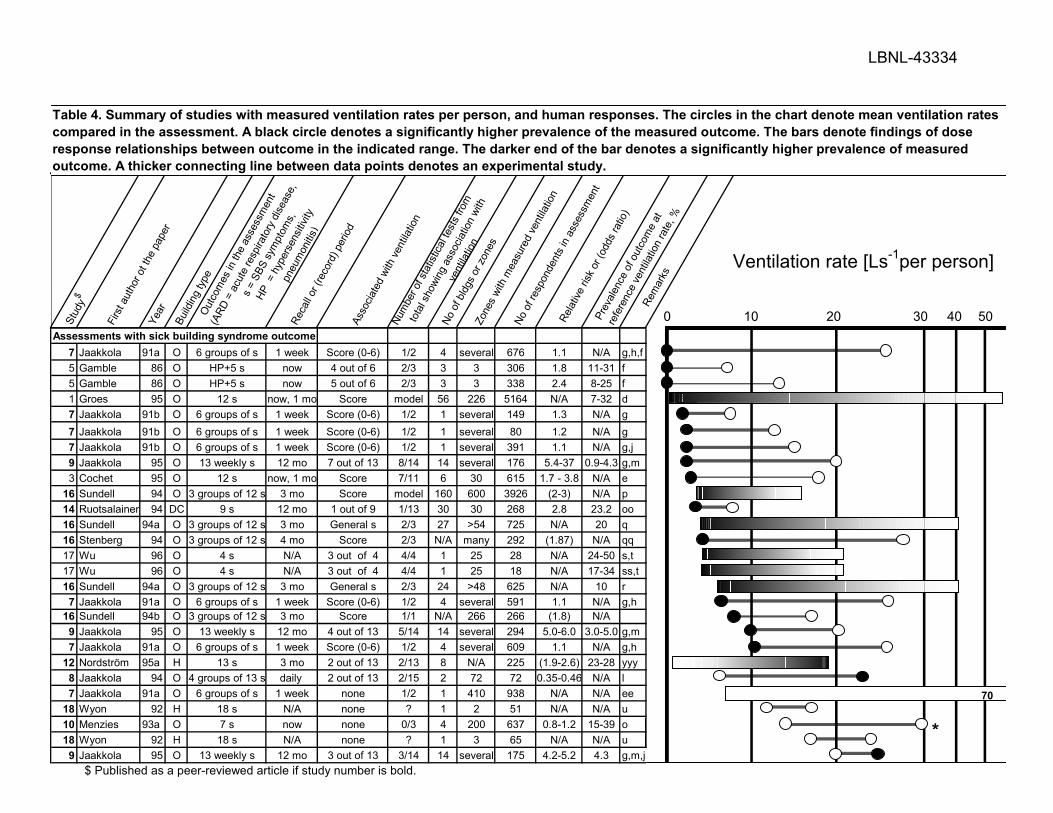
LBNL-43334
Stud
y$
Firs
t aut
hor o
t the
pap
erYe
arBu
ilding
type
Outc
omes
in th
e as
sess
men
t
(ARD
= a
cute
resp
irato
ry d
iseas
e,
s =
SBS
sym
ptom
s,
HP =
hyp
erse
nsitiv
ity
pneu
mon
itis)
Reca
ll or (
reco
rd) p
eriod
Asso
ciate
d wi
th ve
ntila
tion
Num
ber o
f sta
tistic
al te
sts
from
tota
l sho
wing
ass
ociat
ion w
ith
vent
ilatio
n
No o
f bldg
s or
zone
s Zo
nes
with
mea
sure
d ve
ntila
tion
No o
f res
pond
ents
in a
sses
smen
t
Rela
tive
risk
or (o
dds
ratio
)
Prev
alenc
e of
out
com
e at
refe
renc
e ve
ntila
tion
rate
, %
Rem
arks
Assessments with sick building syndrome outcome7 Jaakkola 91a O 6 groups of s 1 week Score (0-6) 1/2 4 several 676 1.1 N/A g,h,f5 Gamble 86 O HP+5 s now 4 out of 6 2/3 3 3 306 1.8 11-31 f5 Gamble 86 O HP+5 s now 5 out of 6 2/3 3 3 338 2.4 8-25 f1 Groes 95 O 12 s now, 1 mo Score model 56 226 5164 N/A 7-32 d7 Jaakkola 91b O 6 groups of s 1 week Score (0-6) 1/2 1 several 149 1.3 N/A g7 Jaakkola 91b O 6 groups of s 1 week Score (0-6) 1/2 1 several 80 1.2 N/A g7 Jaakkola 91b O 6 groups of s 1 week Score (0-6) 1/2 1 several 391 1.1 N/A g,j9 Jaakkola 95 O 13 weekly s 12 mo 7 out of 13 8/14 14 several 176 5.4-37 0.9-4.3 g,m3 Cochet 95 O 12 s now, 1 mo Score 7/11 6 30 615 1.7 - 3.8 N/A e
16 Sundell 94 O 3 groups of 12 s 3 mo Score model 160 600 3926 (2-3) N/A p14 Ruotsalainen 94 DC 9 s 12 mo 1 out of 9 1/13 30 30 268 2.8 23.2 oo16 Sundell 94a O 3 groups of 12 s 3 mo General s 2/3 27 >54 725 N/A 20 q16 Stenberg 94 O 3 groups of 12 s 4 mo Score 2/3 N/A many 292 (1.87) N/A qq17 Wu 96 O 4 s N/A 3 out of 4 4/4 1 25 28 N/A 24-50 s,t17 Wu 96 O 4 s N/A 3 out of 4 4/4 1 25 18 N/A 17-34 ss,t16 Sundell 94a O 3 groups of 12 s 3 mo General s 2/3 24 >48 625 N/A 10 r7 Jaakkola 91a O 6 groups of s 1 week Score (0-6) 1/2 4 several 591 1.1 N/A g,h
16 Sundell 94b O 3 groups of 12 s 3 mo Score 1/1 N/A 266 266 (1.8) N/A9 Jaakkola 95 O 13 weekly s 12 mo 4 out of 13 5/14 14 several 294 5.0-6.0 3.0-5.0 g,m7 Jaakkola 91a O 6 groups of s 1 week Score (0-6) 1/2 4 several 609 1.1 N/A g,h
12 Nordström 95a H 13 s 3 mo 2 out of 13 2/13 8 N/A 225 (1.9-2.6) 23-28 yyy8 Jaakkola 94 O 4 groups of 13 s daily 2 out of 13 2/15 2 72 72 0.35-0.46 N/A l7 Jaakkola 91a O 6 groups of s 1 week none 1/2 1 410 938 N/A N/A ee
18 Wyon 92 H 18 s N/A none ? 1 2 51 N/A N/A u10 Menzies 93a O 7 s now none 0/3 4 200 637 0.8-1.2 15-39 o18 Wyon 92 H 18 s N/A none ? 1 3 65 N/A N/A u9 Jaakkola 95 O 13 weekly s 12 mo 3 out of 13 3/14 14 several 175 4.2-5.2 4.3 g,m,j
100 20 50 30 40
Ventilation rate [Ls-1per person]
SBS
PAQo
*
Table 4. Summary of studies with measured ventilation rates per person, and human responses. The circles in the chart denote mean ventilation rates compared in the assessment. A black circle denotes a significantly higher prevalence of the measured outcome. The bars denote findings of dose response relationships between outcome in the indicated range. The darker end of the bar denotes a significantly higher prevalence of measured outcome. A thicker connecting line between data points denotes an experimental study.
70
$ Published as a peer-reviewed article if study number is bold.

LBNL-43334
Stud
y$
Firs
tth
or o
t the
pap
erYe
arBu
ilding
type
Outc
omes
in th
e as
sess
men
t
(ARD
= a
cute
resp
irato
ry d
iseas
e,
s =
SBS
sym
ptom
s,
HP =
hyp
erse
nsitiv
ity p
neum
onitis
SMP
= se
lf m
easu
red
perfo
rman
ce)
Reca
ll or (
reco
rd) p
eriod
Asso
ciate
d wi
th ve
ntila
tion
Num
ber o
f sta
tistic
al te
sts
from
tota
l
show
ing a
ssoc
iation
with
vent
ilatio
n
No o
f bldg
s or
zone
s Zo
nes
with
mea
sure
d ve
ntila
tion
No o
f res
pond
ents
in a
sses
smen
t
Rela
tive
risk
or (o
dds
ratio
)
Prev
alenc
e of
out
com
e at
refe
renc
e
vent
ilatio
n ra
te, %
Rem
arks
Studies with respiratory disease or absence outcome2 Brundage 88 B ARD (4 years) ARD 24/30 many N/A 2.6x10⁶ 1.51 0.46 a6 Hoge 94 J Pneumonia (4 weeks) Pneumonia 1/1 1 49 6700 1.94 0.34 Drinka 96 NH Influenza (4 mo) Influenza 1/1 4 N/A 396 2.2-4.7 3-20 b
11 Milton 99 O,M Absence 1 year Sick leave 1/3 40 110 3364 1.53 1.5 cAssessments with perceived air quality as outcome
1 Bluyssen 95a O Decipols now 1/1 model 56 226 5164 N/A N/A d,v1 Groes 95 O PAQ now 1/1 model 56 226 5164 N/A 30 d,w
12 Nordst 95b H Stuffy air, odor 3 mo 2/2 2/2 8 N/A 225 (03-0.4) 24-44 yy13 Palonen 90 O Odor, dust, stuff. 1 week 2/3 2/3 5 many 580 1.9-2.8 N/A z14 Ruotsalainen 94 DC Odor, body odor 12 mo 1/2 1/2 30 30 268 2.8 19.53 Cochet 95 O Dissatisfaction now 1/1 plot 5 25 522 N/A 5-35 y
20 Zweers 90 O PAQ now 1/5 1/5 8 8 12 N/A ? zz8 Jaakkola 94 O Odor, dust, stuff. Daily 1/3 1/3 72 72 0.47 N/A
Assessments with other outcomes15 Smedje 96 S SMP N/A 1/1 1/1 Many 28 627 (0.9) N/A x19 Wålinde 98 S Nasal N/A 5/5 5/5 12 24 279 N/A N/A xx
* Thes entilation rate estimates may have higher uncertainties because they are based on carbon dioxide measurements or rely on assumed supply air flow rates.
100 20 5030 40
Ventilation rate [Ls-1per person]
Table 4 (continued). Summary of studies with measured ventilation rates per person, and human responses. The circles in the chart denote mean ventilation rates compared in the assessment. A black circle denotes a significantly higher prevalence of the measured outcome. The bars denote findings of dose response relationships between outcome in the indicated range. The darker end of the bar denotes a significantly higher prevalence of measured outcome. Thicker connecting line between data points denotes an experimental study.
PAQo
60
**
*
$ Published as a peer-reviewed article if study number is bold.
a
u
röm
r
e v

LBNL-43334
Stud
y$
Firs
t aut
hor o
f pap
erYe
arBu
ilding
type
Outc
ome
asso
ciate
d wi
th
vent
ilatio
n ra
tes
Reca
ll or (
reco
rd) p
eriod
Prev
alenc
e (%
) at r
efer
ence
vent
ilatio
n ra
te R
elativ
e Ri
sk
Rem
arks
Studies with respiratory disease or absence outcome
2 Brundage 88 BAcute respir.
disease (4 years) 0.46 1.51
6 Hoge 94 J Pneumonia (4 weeks) 0.3 1.7-2.3 a
4 Drinka 96 NH
Influenza, respiratory
Illness (4 mo) 3 2.2-4.7 b
11 Milton 99 O,M Sick leave (1 year) 1.50 1.5-2.3 c
5 Gamble 86 O 5 symptoms now 8-25 1.3-2.4
7 Jaakkola 91a O score (0-6) 1 week N/A 1.1
9 Jaakkola * 95 O 13 symptoms 12 mo 0.9-4.3 1.4-37
Jaakkola 91b O score (0-6) 1 week N/A 1.1-1.3
3 Cochet 95 O 12 symptoms now, 1 mo N/A 1.7 - 3.8
16 Stenberg 94 O score 3 mo N/A 1.1-1.7
$ Published in a peer-reviewed article if study number is bold.
Remarksa Relative risk for three different ventilation ratesb Relative risk RR= 4.7 for influenza, 2.2 for other respiratory illnessesc Relative risk RR=1.5 for short-term sick leave, 2.3 for total sick leave, prevalence for short-term sick leave
excluding those with disability paymentsB, J, NH, O, M See footnotes of Table 2* Reference for this study is at 20 Ls-1 per person
Studies with respiratory disease or absence outcome
Studies with sick building syndrome outcome
100 20
Ventilation rate[Ls-1 per person]
37
1.5
4.7
2.3 1.5
1.3
3.81.7
1.7 1.1
1.1 1.1
1.1 1.1 1.1
2.4
1.8
8.9
1.4
1.4 1.3
2.2
2.3 1.7
Table 5. Risk of increased prevalence of respiratory illnesses and sick building symptoms with decreasing ventilation rates in studies with necessary data. The column at the right end of each bar is the reference with a height of one unit. The heights of other columns are proportional to the relative risk at the ventilation rate indicated on the horizontal axis. The dark bars denote statistically significant increases in risk relative risks. Double columns refer to the symptoms with highest and lowest prevalences.
30
2.4
4.25.2
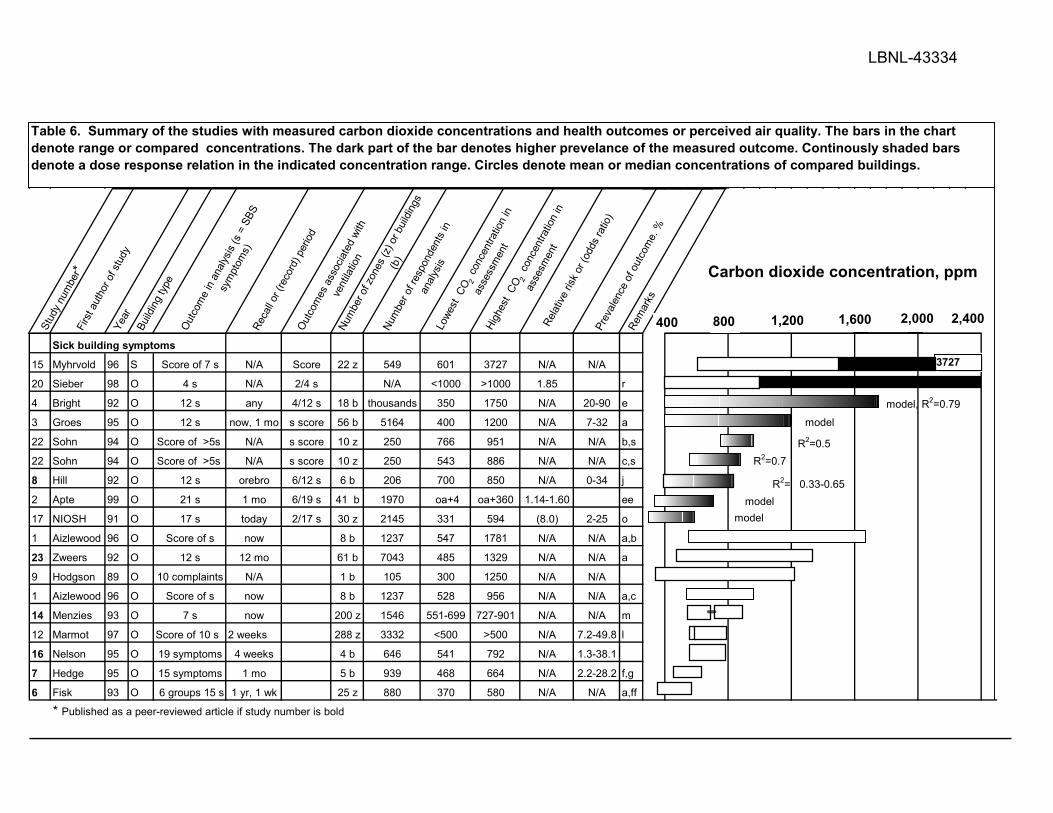
LBNL-43334
Stud
y nu
mbe
r*Fi
rst a
utho
r of s
tudy
Year
Build
ing ty
peOu
tcom
e in
analy
sis (s
= S
BS
sym
ptom
s)Re
call o
r (re
cord
) per
iodOu
tcom
es a
ssoc
iated
with
vent
ilatio
nNu
mbe
r of z
ones
(z) o
r buil
dings
(b)
Num
ber o
f res
pond
ents
in
analy
sisLo
west
CO 2
con
cent
ratio
n in
asse
ssm
ent
High
est
CO2
con
cent
ratio
n in
asse
smen
tRe
lative
risk
or (
odds
ratio
)Pr
evale
nce
of o
utco
me.
%
Rem
arks
Sick building symptoms
15 Myhrvold 96 S Score of 7 s N/A Score 22 z 549 601 3727 N/A N/A
20 Sieber 98 O 4 s N/A 2/4 s N/A <1000 >1000 1.85 r
4 Bright 92 O 12 s any 4/12 s 18 b thousands 350 1750 N/A 20-90 e
3 Groes 95 O 12 s now, 1 mo s score 56 b 5164 400 1200 N/A 7-32 a
22 Sohn 94 O Score of >5s N/A s score 10 z 250 766 951 N/A N/A b,s
22 Sohn 94 O Score of >5s N/A s score 10 z 250 543 886 N/A N/A c,s
8 Hill 92 O 12 s orebro 6/12 s 6 b 206 700 850 N/A 0-34 j
2 Apte 99 O 21 s 1 mo 6/19 s 41 b 1970 oa+4 oa+360 1.14-1.60 ee
17 NIOSH 91 O 17 s today 2/17 s 30 z 2145 331 594 (8.0) 2-25 o
1 Aizlewood 96 O Score of s now 8 b 1237 547 1781 N/A N/A a,b
23 Zweers 92 O 12 s 12 mo 61 b 7043 485 1329 N/A N/A a
9 Hodgson 89 O 10 complaints N/A 1 b 105 300 1250 N/A N/A
1 Aizlewood 96 O Score of s now 8 b 1237 528 956 N/A N/A a,c
14 Menzies 93 O 7 s now 200 z 1546 551-699 727-901 N/A N/A m
12 Marmot 97 O Score of 10 s 2 weeks 288 z 3332 <500 >500 N/A 7.2-49.8 l
16 Nelson 95 O 19 symptoms 4 weeks 4 b 646 541 792 N/A 1.3-38.1
7 Hedge 95 O 15 symptoms 1 mo 5 b 939 468 664 N/A 2.2-28.2 f,g
6 Fisk 93 O 6 groups 15 s 1 yr, 1 wk 25 z 880 370 580 N/A N/A a,ff
* Published as a peer-reviewed article if study number is bold
Table 6. Summary of the studies with measured carbon dioxide concentrations and health outcomes or perceived air quality. The bars in the chart denote range or compared concentrations. The dark part of the bar denotes higher prevelance of the measured outcome. Continously shaded bars denote a dose response relation in the indicated concentration range. Circles denote mean or median concentrations of compared buildings.
Carbon dioxide concentration, ppm
800400 1,200 1,600 2,400
3727
R2=0.5R2=0.7
model
R2= 0.33-0.65
modelmodel, R2=0.79
2,000
model

LBNL-43334
Stud
y nu
mbe
r*Fi
rst a
utho
r of s
tudy
Year
Build
ing ty
peOu
tcom
e in
analy
sis (s
= S
BS
sym
ptom
s)Re
call o
r (re
cord
) per
iodOu
tcom
es a
ssoc
iated
with
vent
ilatio
nNu
mbe
r of z
ones
(z) o
r buil
dings
(b)
Num
ber o
f res
pond
ents
in
analy
sisLo
west
CO 2
con
cent
ratio
n in
asse
ssm
ent
High
est
CO2
con
cent
ratio
n in
asse
smen
tRe
lative
risk
or (
odds
ratio
)Pr
evale
nce
of o
utco
me.
%
Rem
arks
Respiratory diseases9 Hoge 94 J Pneumonia (4 weeks) Pneumonia 1 6700 1654 2000 1.94 0.3
Perceived air quality
3 Bluyssen 96 O PAQp now decipols 56 b 9x12(panel) oa+4 oa+1500 N/A N/A a,d
1 Aizlewood 96 O PAQo now decipols 8 b 12(panel) 547 1781 N/A N/A a,b
10 Janssen 86 S PAQo now stale-fresh 1 b 222 1180 1540 N/A N/A k
3 Groes 95 O PAQo now acceptab. 57 b 5164 400 1200 N/A N/A a
21 Sohn 94 O Discomfort N/A 11 z 543 970 N/A N/A t
7 Hill 92 O PIAQo N/A odor, stuffy 6 b 206 <500 >500 N/A N/A h
20 Smedje 97 S PIAQo 96 z 1303 425 2800 N/A N/A
18 Nordback 94 S PIAQo 6 mo 6 b 97 880 1850 N/A N/A q
10 Janssen 86 B/O PAQo now 1 b 143 500-700 800-1100 N/A N/A k
1 Aizlewood 96 O PAQo now decipols 8 b 12(panel) 528 956 N/A N/A a,c
13 Menzies 93 O PIAQo now 200 z 1546 551-699 727-901 N/A N/A n
6 Hedge 95 O PIAQo 1 mo 5 b 939 468 664 N/A N/A f,g
Other outcomes
15 Myhrvold 96 S Performance now 22 z 548 601 3727 N/A N/A
* Published in peer-reviewed article if study number is bold.
Respiratory diseases
Table 6 (continued). Summary of the studies with measured carbon dioxide concentrations and health outcomes or perceived air quality. The bars in the chart denote range or compared concentrations. The dark part of the bar denotes higher prevelance of the measured outcome. Continously shaded bars denote a dose response relation in the indicated concentration range. Circles denote mean or median concentrations of compared buildings.
Carbon dioxide concentration, ppm
800400 1200 1600 2400
3727
2800
R2=0.47
R2= 0.33-0.65
OR=1.94
2000

LBNL-43334
y: ma
Ke Building type: O=office building, S=school J=jail, B=bank Outcomes: defined in Table 2 except PIAQ=perceived indoor climate, includes factors other than IAQ
Re rks a) Sample includes buildings with natural ventilation b) Winter bb) Plotted data suggest relationship between PAQp and maximum CO2 with R2=0.47
c) Summer d) CO2 concentration = difference between indoors and outdoors, national panels in nine countries
e) Even better correlation within buildings with recirculation of air
ee) Analysis of EPA's BASE study data, 41 buildings from 1994-1996, OR=1.14-1.60 per 100 ppm of CO2
f) Average CO2 concentration of 45 hour work week sample ff) Range of prevalences for 12 symptoms reported "now"
g) SBS score included 15 symptoms, PIAQ included 7indoor climate factors not only IAQ prevalence of symptoms 1-3x month, CO2 concentration is mean of measurements
h) Plotted data suggest correlation of unpleasant odor and stuffy air to max CO2 concentration with R2=0.43 and 0.60
j) The paper does not report the relationship but, plotted data suggest correlation of six of 12 symptoms with the maximum CO2 concentration with R2=0.33 - 0.65
k) CO2 controlled ventilation system, two week periods, blinded test l) Score formed from 10 symptoms, past 14 days
m) Seven symptoms in two groups irritation of nose, throat or cough, and systemic symptoms: headache, fatigue or difficulty in concentration
n) Environmental dissatisfaction score consiss of nine parameters; good correlation between symptoms and environmental dissatisfaction score
o) Odds ratio >1 for 16 of 17 symptoms, statistically significant OR=8.0 per ln (CO2) for non specific symptoms (head ache and fatigue)
q) Subjective indoor air quality score formed by rating of room temperature, air dryness, dustiness of air
r) From three reported symptoms Shortness of breath and Chest tightness clearly higher (RR=1.85) in group with CO2 > 1000 than in those <1000
s) Plotted data suggest correlation between CO2 concentration and SBS in summer and winter, score includes headache, eye irritation, fatigue, and difficult. concentration
t) Plotted data suggest correlation between CO2 concentration and IAQ discomfort by occupants
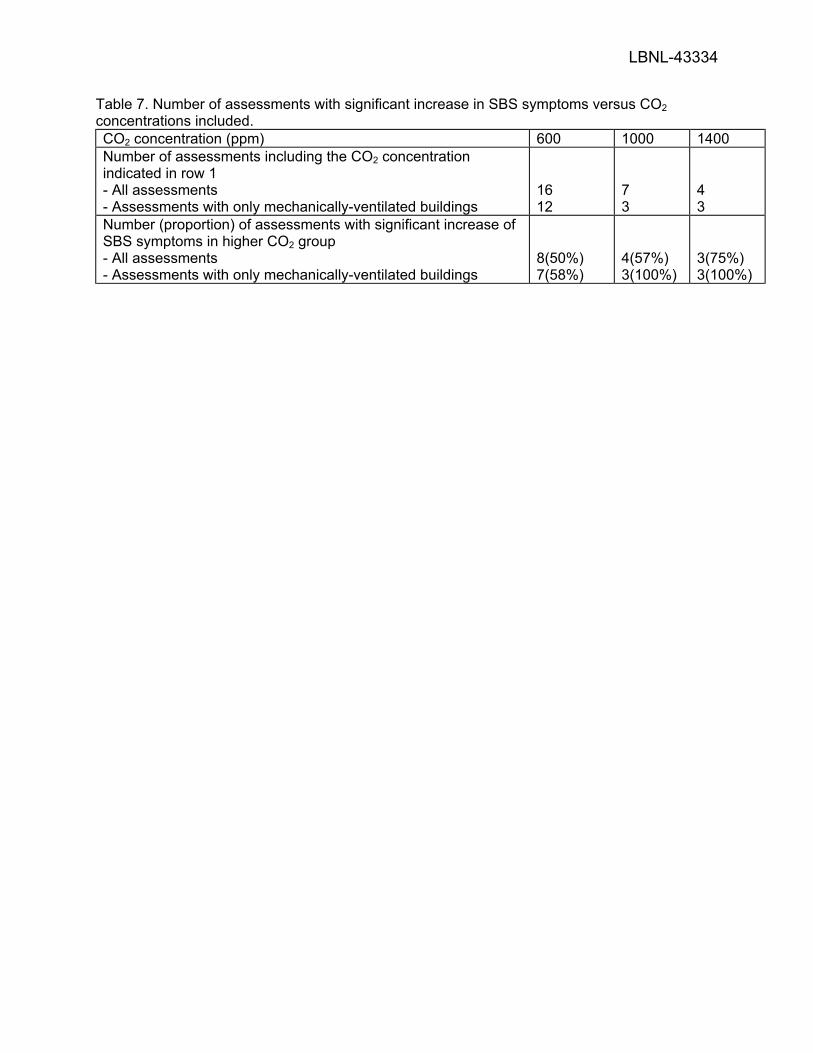
LBNL-43334
Table 7. Number of assessments with significant increase in SBS symptoms versus CO2 concentrations included. CO2 concentration (ppm) 600 1000 1400 Number of assessments including the CO2 concentration indicated in row 1 - All assessments - Assessments with only mechanically-ventilated buildings
16 12
7 3
4 3
Number (proportion) of assessments with significant increase of SBS symptoms in higher CO2 group - All assessments - Assessments with only mechanically-ventilated buildings
8(50%) 7(58%)
4(57%) 3(100%)
3(75%) 3(100%)