ventura county employees’ retirement...
TRANSCRIPT

VENTURA COUNTY EMPLOYEES’ RETIREMENT ASSOCIATION
BOARD OF RETIREMENT
BUSINESS MEETING
May 18, 2015
AGENDA PLACE: Ventura County Employees' Retirement Association
Second Floor Boardroom 1190 South Victoria Avenue Ventura, CA 93003
TIME: 9:00 a.m. Members of the public may comment on any item under the Board’s jurisdiction by filling out a speaker form and presenting it to the Clerk. Unless otherwise directed by the Chair, comments related to items on the agenda will be heard when the Board considers that item. Comments related to items not on the agenda will generally be heard at the time designated for Public Comment.
ITEM:
I. CALL TO ORDER Master Page No.
II. APPROVAL OF AGENDA 1 – 3
III. APPROVAL OF MINUTES
A. Disability Meeting of May 4, 2015. 4 – 9
IV. CONSENT AGENDA
A. Approve Regular and Deferred Retirements and Survivors Continuances for the Month of April 2015
10 – 14
B. Receive and File Report of Checks Disbursed in April 2015
15 – 23
C. Receive and File Budget Summary for FY 2014-15 Month Ending April 30, 2015
24
MASTER PAGE NO. 1

BOARD OF RETIREMENT MAY 18, 2015 AGENDA BUSINESS MEETING PAGE 2 V. ACTUARIAL INFORMATION
A. Final Approval of June 30, 2014 Actuarial Valuation Report with Corrections
25
1. Recommendation to Board of Supervisors dated April 30, 2015
26 – 27
2. Revised Actuarial Valuation and Review as of June 30, 2014 RECOMMENDED ACTION: Approve.
28
B. Actuarial Experience Study and Review of Economic Assumptions, Continued from April 20, 2015 Business Meeting Paul Angelo, FSA and John Monroe, ASA of Segal Consulting
29 – 66
1. Analysis of Actuarial Experience During the Period of July 1, 2011 through June 30, 2014
67 – 131
2. Review of Economic Actuarial Assumptions for the June 30, 2015 Actuarial Valuation
132 – 157
VI. INVESTMENT INFORMATION
A. NEPC – Allan Martin, Partner, and Dan LeBeau, Consultant.
1. Currency Hedging Investment Guideline Approval, Parametric Engineered Portfolio Solutions
2. Securities Lending Review
a. NEPC Securities Lending Program Update 158 – 160
b. State Street Presentation 161 – 178
3. GTAA Manager Search Interviews 179 – 184
a. Bridgewater 185 – 208
b. PIMCO 209 – 249
c. Standard Life 250 – 296
4. Presentation of Investment Performance Report Quarter Ending March 31, 2015. RECOMMENDED ACTION: Receive and file.
297 – 373
5. Preliminary Performance Report Month Ending April 30, 2015 RECOMMENDED ACTION: Receive and file.
374 – 380
MASTER PAGE NO. 2

BOARD OF RETIREMENT MAY 18, 2015 AGENDA BUSINESS MEETING PAGE 3 VII. NEW BUSINESS
A. Quarterly Administrator Report for January – April, 2015. RECOMMENDED ACTION: Receive and file.
381 – 384
B. Ventura County Employees’ Retirement Information System (VCERIS) Pension Administration Project
1. VCERIS Project Monthly Status Report RECOMMENDED ACTION: Receive and file.
385
C. Oral Update on VCERA’s General Counsel Position
VIII. INFORMATIONAL
A. Adams Street Client Conference, June 2-3 2015, Chicago, IL.
386 – 387
B. CALAPRS Trustees’ Roundtable, June 12, 2015, Burbank, CA.
388
IX. PUBLIC COMMENT
X. STAFF COMMENT
XI. BOARD MEMBER COMMENT
XII. ADJOURNMENT
MASTER PAGE NO. 3

VENTURA COUNTY EMPLOYEES’ RETIREMENT ASSOCIATION
BOARD OF RETIREMENT
DISABILITY MEETING
May 4, 2015
MINUTES DIRECTORS PRESENT:
Tracy Towner, Chair, Alternate Safety Employee Member William W. Wilson, Vice Chair, Public Member Peter C. Foy, Public Member Joseph Henderson, Public Member Mike Sedell, Public Member Deanna McCormick, General Employee Member Craig Winter, General Employee Member Chris Johnston, Safety Employee Member Arthur E. Goulet, Retiree Member Will Hoag, Alternate Retiree Member
DIRECTORS ABSENT:
Steven Hintz, Treasurer-Tax Collector
STAFF PRESENT:
Lori Nemiroff, Assistant County Counsel Julie Stallings, Chief Operations Officer Vickie Williams, Retirement Benefits Manager Donna Edwards, Retirement Benefits Specialist Stephanie Caiazza, Program Assistant Dan Gallagher, Chief Investment Officer
PLACE: Ventura County Employees' Retirement Association Second Floor Boardroom 1190 South Victoria Avenue Ventura, CA 93003
TIME: 9:00 a.m.
MASTER PAGE NO. 4

BOARD OF RETIREMENT MAY 4, 2015 MINUTES DISABILITY MEETING PAGE 2 ITEM:
I. CALL TO ORDER Chair Towner called the Disability Meeting of May 4, 2015, to order at 9:00 a.m.
II. APPROVAL OF AGENDA Chair Towner amended the agenda by switching items “V.E.” and “V.F.”. Chair Towner stated that the amendment was necessary because the applicant’s attorney for Case 11-021 indicated that he may be late or absent for the meeting due to illness. The following motion was made: MOTION: Approve the agenda, as amended. Moved by Henderson, seconded by Sedell. Vote: Motion carried Yes: Goulet, Foy, Johnston, Sedell, Winter, Henderson, McCormick, Wilson No: - Absent: Hintz
III. APPROVAL OF MINUTES
A. Business Meeting of April 20, 2015. The following motion was made: MOTION: Approve. Moved by Henderson, seconded by Goulet. Vote: Motion carried Yes: Goulet, Foy, Johnston, Sedell, Winter, Henderson, McCormick, Wilson No: - Absent: Hintz
MASTER PAGE NO. 5

BOARD OF RETIREMENT MAY 4, 2015 MINUTES DISABILITY MEETING PAGE 3 IV. RECEIVE AND FILE PENDING DISABILITY APPLICATION STATUS REPORT
MOTION: Approve. Moved by Goulet, seconded by Henderson. Vote: Motion carried Yes: Goulet, Foy, Johnston, Sedell, Winter, Henderson, McCormick, Wilson No: - Absent: Hintz
V. APPLICATIONS FOR DISABILITY RETIREMENT
A. Application for Service Connected and Non-Service Connected Disability Retirement, Andrew W. Poland; Case No. 13-005.
1. Summary of Evidence, Findings of Fact, Conclusions of Law, and Recommendations, submitted by Hearing Officer John L. Rosenthal, dated April 11, 2015.
2. Hearing Notice Served on April 15, 2015.
Paul Hilbun and John Gilman, Attorney at Law, were present on behalf of County of Ventura Risk Management. The applicant, Andrew Poland, was also present. Both parties declined to make a statement. Staff clarified that the hearing officer’s original report contained incorrect references to OCERS instead of VCERA and the corrected report that was submitted to the Board was meant to replace the original report within the case record. The following motion was made: MOTION: Approve the Hearing Officer’s recommendation and grant the applicant, Andrew Poland, a non-service connected disability retirement. Moved by Wilson, seconded by Johnston. Vote: Motion carried Yes: Goulet, Foy, Johnston, Sedell, Winter, Henderson, McCormick, Wilson No: - Absent: Hintz
MASTER PAGE NO. 6

BOARD OF RETIREMENT MAY 4, 2015 MINUTES DISABILITY MEETING PAGE 4 B. Application for Service Connected Disability Retirement, Ignacio Godinez;
Case No. 14-023.
1. Application for Service Connected Disability Retirement and Supporting Documentation.
2. Hearing Notice Served on April 14, 2015. Janet Chu-Hooker and Michael Youril, Attorney at Law, were present on behalf of Ventura Regional Sanitation District (VRSD). The applicant, Ignacio Godinez, was also present. The representatives from VRSD declined to make a statement. The applicant gave a brief statement describing his background and condition. Trustee Goulet commented that the report from VRSD was comprehensive and well-done. The following motion was made: MOTION: Grant the applicant, Ignacio Godinez, a service connected disability retirement. Moved by Goulet, seconded by McCormick. Vote: Motion carried Yes: Goulet, Foy, Johnston, Sedell, Winter, Henderson, McCormick, Wilson No: - Absent: Hintz The parties agreed to waive preparations of Findings of Fact and Conclusions of Law.
C. Application for Service Connected Disability Retirement, RayMel Lloyd; Case No. 14-024.
1. Application for Service Connected Disability Retirement and Supporting Documentation.
2. Hearing Notice Served on April 8, 2015. Janet Chu-Hooker and Michael Youril, Attorney at Law, were present on behalf of Ventura Regional Sanitation District. The applicant, RayMel Lloyd, was also present.
MASTER PAGE NO. 7

BOARD OF RETIREMENT MAY 4, 2015 MINUTES DISABILITY MEETING PAGE 5
Trustee Goulet stated that he found the report to be deficient and noted that it did not include a description of how the accident occurred. The applicant summarized the events of the accident for the Board. Trustee Goulet requested further clarification of the records submitted by VRSD. Following discussion by the Board and Mr. Youril, the following motion was made: MOTION: Request that VRSD submit a revised report with additional supporting documentation, and continue this matter at the July 6, 2015 disability meeting or at a preceding meeting if the materials are submitted early. Moved by Henderson, seconded by Johnston. Vote: Motion carried Yes: Goulet, Foy, Johnston, Sedell, Winter, Henderson, McCormick, Wilson No: - Absent: Hintz
D. Application for Non-Service Connected Disability Retirement, Cynthia Lazenby; Case No. 14-026.
1. Application for Non-Service Connected Disability Retirement and Supporting Documentation.
2. Hearing Notice Served on April 22, 2015. Paul Hilbun was present on behalf of County of Ventura Risk Management. The applicant, Cynthia Lazenby, was also present. Both parties declined to make statements. The following motion was made: MOTION: Grant the applicant, Cynthia Lazenby, a non-service connected disability retirement. Moved by Wilson, seconded by McCormick.
MASTER PAGE NO. 8

BOARD OF RETIREMENT MAY 4, 2015 MINUTES DISABILITY MEETING PAGE 6
Vote: Motion carried Yes: Goulet, Foy, Johnston, Sedell, Winter, Henderson, McCormick, Wilson No: - Absent: Hintz The parties agreed to waive preparations of Findings of Fact and Conclusions of Law.
E. Michael Wheat v. Board of Retirement of VCERA, Ventura County Superior Court Case No. 56-2013-00440045-CU-WM-VTA
1. Memorandum from County Counsel dated April 24, 2015
2. Notice of Entry of Judgement and Issuance of Writ of Mandate, dated April 9, 2015
3. Minute Order dated December 19, 2014
4. Hearing Notice Served on April 8, 2015 Paul Hilbun and Derek Straatsma, Attorney at Law, were present on behalf of County of Ventura Risk Management. Following the issuance of judgment on the applicant’s petition for writ of mandate, Ms. Nemiroff recommended that the Board grant the applicant a service connected disability. The following motion was made: MOTION: Grant the applicant, Michael Wheat, a service connected disability retirement. Moved by Wilson, seconded by McCormick. Vote: Motion carried Yes: Goulet, Foy, Johnston, Sedell, Winter, Henderson, McCormick, Wilson No: - Absent: Hintz
F. Application for Service Connected Disability Retirement, Karen Anderson; Case No. 11-021.
1. Proposed Findings of Fact, Conclusions of Law, and Recommendation, submitted by Hearing Officer Kenneth A. Perea,
MASTER PAGE NO. 9

BOARD OF RETIREMENT MAY 4, 2015 MINUTES DISABILITY MEETING PAGE 7
dated March 18, 2015.
2. Hearing Notice Served on April 16, 2015. The applicant’s attorney was not present due to illness. The following motion was made:
MOTION: Continue this matter at the June 1, 2015 disability meeting. Moved by Goulet, seconded by McCormick. Vote: Motion carried Yes: Goulet, Foy, Johnston, Sedell, Winter, Henderson, McCormick, Wilson No: - Absent: Hintz
VI. NEW BUSINESS
A. Approval of Assignment of Contract from Schott & Lites to California Strategies & Advocacy, LLC
1. Staff Letter
2. Press Release
3. Schott & Lites Advocates Letter of Agreement, dated January 29, 2015. After discussion by the Board, the following motion was made: MOTION: Approve assignment of the contract for advocating VCERA’s proposed CERL Legislation (AB 1291) to California Strategies and Advocacy, LLC. and delegate authority to the Chair to approve and execute an assignment agreement. Moved by Goulet, seconded by Sedell. Vote: Motion carried Yes: Goulet, Foy, Johnston, Sedell, Winter, Henderson, McCormick, Wilson No: - Absent: Hintz
B. Recommendation to Approve Trustees’ Attendance at Nossaman LLP Public Pensions & Investments Fiduciaries Forum, September 24 – 25, 2015, San Francisco, CA.
MASTER PAGE NO. 10

BOARD OF RETIREMENT MAY 4, 2015 MINUTES DISABILITY MEETING PAGE 8
The following motion was made: MOTION: Approve. Moved by Henderson, seconded by Winter. Vote: Motion carried Yes: Goulet, Foy, Johnston, Sedell, Winter, Henderson, McCormick, Wilson No: - Absent: Hintz
C. Pension Bridge Report, Submitted by Trustee McCormick and Trustee Goulet The following motion was made: MOTION: Receive and file. Moved by Henderson, seconded by Winter. Vote: Motion carried Yes: Goulet, Foy, Johnston, Sedell, Winter, Henderson, McCormick, Wilson No: - Absent: Hintz
D. Ventura County Employees’ Retirement Information System (VCERIS) Pension Administration Project
1. Staff Letter
2. VCERIS Project Quarterly Status Update Brian Colker of Linea Solutions, Inc. was present to provide the Board with a status update on the VCERIS Pension Administration Project. After discussion by the Board and Mr. Colker, the following motion was made: MOTION: Receive and file. Moved by Henderson, seconded by Sedell.
MASTER PAGE NO. 11

BOARD OF RETIREMENT MAY 4, 2015 MINUTES DISABILITY MEETING PAGE 9
Vote: Motion carried Yes: Goulet, Foy, Johnston, Sedell, Winter, Henderson, McCormick, Wilson No: - Absent: Hintz
VII. INFORMATIONAL
A. CALAPRS Principles of Pension Management for Trustees 2015, August 25 – 28, 2015, Pepperdine University, Malibu, CA.
VIII. PUBLIC COMMENT None.
IX. STAFF COMMENT None.
X. BOARD MEMBER COMMENT Chair Towner welcomed Dan Gallagher, VCERA’s new Chief Investment Officer.
XI.
ADJOURNMENT The meeting was adjourned at 9:41 a.m. Respectfully submitted,
___________________________________________ LINDA WEBB, Retirement Administrator Approved, ___________________________________ TRACY TOWNER, Chairman
MASTER PAGE NO. 12

DATE OF TOTAL OTHER EFFECTIVEFIRST NAME LAST NAME G/S MEMBERSHIP SERVICE SERVICE DEPARTMENT DATE
Steven R. Adam S 10/14/1990 3.20 C = 21.22863Sheriff's Department 03/30/15(deferred)
Scott C. Anderson G 12/08/2008 6.20 C=4.54900 Probation 02/28/15Carla J. Ardissoni G 09/29/1991 0.24 Public Defender 04/01/15
(Non-member spouse, deferred)
Nancy E. Austin G 01/20/1991 23.00 Resource Management 03/14/15Steven A. Baker S 11/11/1991 23.40 C=4.26100 Fire Protection 03/25/15Rita Batchley G 10/19/1986 21.00 B=0.6252 Health Care Agency 03/05/15Donald P. Beese S 11/04/1990 25.50 D= 1.08330 Sheriff's Department 03/27/15Ivor Benci-Woodward G 08/06/2001 4.20 Public Works 12/01/14
(deferred)
Debora M. Bohan G 02/04/1990 8.50 Health Care Agency 03/26/15Deborah W. Burke G 04/11/1982 13.20 C=19.717 Library 02/01/15
(deferred)
Irene Camarena G 07/04/2004 10.60 Human Services Agency 03/27/15Alan L. Campbell S 03/27/1983 31.90 Fire Protection 03/17/15Karen A. Carpenter G 12/23/2002 12.20 Human Services Agency 03/06/15Debora A. Carrington G 05/15/1977 37.50 Public Defender 03/28/15Connie F. Clark G 04/01/1990 24.00 Health Care Agency 03/18/15Cyndie R. Cole G 01/19/1992 18.30 Health Care Agency 03/28/15Cheryl M. Collart G 01/21/2001 12.60 B=0.41740 CEO 03/10/15
(deferred)
Judith Collinge G 11/07/2004 5.70 Health Care Agency 03/18/15(deferred)
Anne M. Dana G 08/05/1990 26.60 B=2.1286 Public Works 03/14/15Wilma L. Donovan G 12/09/2002 11.90 Child Support Services 03/31/15
(deferred)
Christopher D. Dumbauld S 02/04/1991 25.90 B=1.81350 Fire Protection 03/15/15C=5.5833
Jean L. Farley G 07/21/1986 28.60 C=7.42763 Public Defender 03/28/15Doni J. Farner-Smith G 02/13/2005 12.20 A=2.4287 Fire Protection 03/12/15Janet H. Foreny G 11/06/2005 5.80 B=.74090 Library 03/16/15
(deferred)
Melba P. Fry G 11/01/1998 15.30 Health Care Agency 03/06/15Linda B. Galvan G 05/31/1987 31.80 B=1.3410 Health Care Agency 03/18/15James B. Hall G 01/22/2001 13.10 Harbor 03/28/15Ruby Lara-Leon G 03/15/1992 21.70 Human Services Agency 03/20/15Minerva Loya G 03/29/1981 33.80 District Attorney 03/26/15John M. Pennington G 05/11/1980 34.90 Public Works 03/28/15Mary L. Poulson G 04/29/2014 4.30 Courts 02/01/15
(non-member spouse, deferred)
Phillip M. Poulson G 05/12/1991 4.30 C=13.646 Courts 07/01/13(deferred)
VENTURA COUNTY EMPLOYEES' RETIREMENT ASSOCIATIONREPORT OF REGULAR AND DEFERRED RETIREMENTS AND SURVIVORS CONTINUANCES
APRIL 2015
REGULAR RETIREMENTS:
MASTER PAGE NO. 13

DATE OF TOTAL OTHER EFFECTIVEFIRST NAME LAST NAME G/S MEMBERSHIP SERVICE SERVICE DEPARTMENT DATE
VENTURA COUNTY EMPLOYEES' RETIREMENT ASSOCIATIONREPORT OF REGULAR AND DEFERRED RETIREMENTS AND SURVIVORS CONTINUANCES
APRIL 2015
Kelly A. Ryan G 06/04/1995 17.60 Sheriff's Department 04/01/15Thomas P. Sloyan S 07/02/1978 38.40 A=0.30480 Probation 03/27/15
B=1.33210Barbara J. Stallings G 09/30/2014 13.57 Sheriff's Department 03/01/15
(Non-member spouse, deferred)
Yolanda C. Walker G 05/25/2003 11.80 C=26.800 CEO 03/28/15Christina F. Zarate S 09/21/1997 20.00 A=1.378 Probation 03/18/15
B=2.555Stanley J. Zarkowski G 03/24/1996 15.70 Public Works 03/11/15
Rebecca Sue Carter G 04/29/2002 12.96 Animal Regulations 04/10/2015Jose Tabin Cosio G 02/04/2007 8.18 CEO 04/10/2015Juan Antonio Diaz G 03/27/2005 9.81 Health Care Agency 04/02/2015Nicole Faulkner G 05/04/2008 6.55 Health Care Agency 02/27/2015Claudia Giba G 11/05/2006 7.68 Human Services Agency 03/26/2015Elizabeth Krene S 07/24/1988 26.70 B=0.1151 Probation Agency 03/27/2015Patrick McKinley G 06/18/2006 8.72 Health Care Agency 04/03/2015Melissa Rodriguez G 11/10/2013 0.78 C=7.236 Sheriff's Department 08/22/2014
Barbara E. HigginbothamCarlos E. RodriguezWillodeane Valdez
* = Member Establishing ReciprocityA = Previous MembershipB = Other County Service (eg Extra Help)C = Reciprocal ServiceD = Public Service
SURVIVORS' CONTINUANCES:
DEFERRED RETIREMENTS:
MASTER PAGE NO. 14

ClosedInvoice Discount AmountDocRefCheck Check InvoiceCheck
Nbr Type DateVendor IDVendor Name Nbr Type Date Taken PaidNumberTo Post
Date:Time:User:
Monday, May 04, 201510:13AMRET10011
Page:Report:Company:
1 of 903630.rptVCERA
Ventura County Retirement AssnCheck Register - Standard
Period: 10-15 As of: 5/4/2015
Period
Company: VCERAAcct / Sub: 1002 00
100856 14,586.790.00REFUND T2 COL 4/1/2015CKCHARLOTTE CARBONE
4/1/2015 VO024985 01984510-15
104638 13,445.680.00REFUND T2 COL 4/1/2015CKMELBA P. FRY
4/1/2015 VO024986 01984610-15
106474 11,520.340.00REFUND T2 COL 4/1/2015CKMARIA L. LANDEROS
4/1/2015 VO024987 01984710-15
107840R 115,092.980.00ROLLOVER 4/1/2015CKUSAA IMCO
4/1/2015 VO024988 01984810-15
118463 22,086.250.00REFUND CONTRIB 4/1/2015CKTAMARA HORNSEY
4/1/2015 VO024989 01984910-15
119367 15,897.500.00REFUND CONTRIB 4/1/2015CKFRANCIS H. MORELLI
4/1/2015 VO024990 01985010-15
119624 423.410.00REFUND CONTRIB 4/1/2015CKDONNA VENARDOS
4/1/2015 VO024991 01985110-15
120909 6,386.680.00REFUND CONTRIB 4/1/2015CKSHAWN T. PERREIRA
4/1/2015 VO024992 01985210-15
121189R 1,188.450.00ROLLOVER 4/1/2015CKPRINCIPAL FUNDS
4/1/2015 VO024993 01985310-15
122036R 822.160.00ROLLOVER 4/1/2015CKTD AMERITRADE
4/1/2015 VO024994 01985410-15
122157 14,516.240.00REFUND CONTRIB 4/1/2015CKJOSHUA MCKINNON
4/1/2015 VO024995 01985510-15
123015 825.950.00REFUND CONTRIB 4/1/2015CKRAFAEL M. BORRAYO
4/1/2015 VO024996 01985610-15
F0723B1 206.900.00DEATH BENEFIT 4/1/2015CKMARK TOPPING
4/1/2015 VO024997 01985710-15
MASTER PAGE NO. 15

ClosedInvoice Discount AmountDocRefCheck Check InvoiceCheck
Nbr Type DateVendor IDVendor Name Nbr Type Date Taken PaidNumberTo Post
Date:Time:User:
Monday, May 04, 201510:13AMRET10011
Page:Report:Company:
2 of 903630.rptVCERA
Ventura County Retirement AssnCheck Register - Standard
Period: 10-15 As of: 5/4/2015
Period
F3554S 1,671.540.00DEATH BENEFIT 4/1/2015CKWILLODEANE VALDEZ
4/1/2015 VO024998 01985810-15
F4109B1 2,191.450.00DEATH BENEFIT 4/1/2015CKERIN A. DOYLE
4/1/2015 VO024999 01985910-15
F4109B2 2,191.440.00DEATH BENEFIT 4/1/2015CKSHEA M. DOYLE
4/1/2015 VO025000 01986010-15
F6443B1 1,194.580.00DEATH BENEFIT 4/1/2015CKREGINA CALDERON
4/1/2015 VO025001 01986110-15
F6443B3 1,023.920.00DEATH BENEFIT 4/1/2015CKJENNIFER GARCIA
4/1/2015 VO025002 01986210-15
COUNTY 27,367.000.00ADMIN EXP 4/1/2015CKCOUNTY COUNSEL
4/1/2015 VO025003 01986310-15
CPS 2,291.810.00ADMIN EXP 4/1/2015CKCOOPERATIVE PERSONNEL
4/1/2015 VO025004 01986410-15
PRUDENTIAL 197,833.430.00INVESTMENT FEES 4/1/2015CKPRUDENTIAL INSURANCE
4/1/2015 VO025005 01986510-15
SPRUCE 58,966.120.00INVESTMENT FEES 4/1/2015CKSPRUCEGROVE INVESTMEN
4/1/2015 VO025006 01986610-15
107611 16,028.120.00REFUND T2 COL 4/8/2015CKWILMA L. DONOVAN
4/8/2015 VO025007 01986710-15
118895 39,165.580.00REFUND CONTRIB 4/8/2015CKJAMIE N. SPALDING
4/8/2015 VO025008 01986810-15
121738 17,337.640.00REFUND CONTRIB 4/8/2015CKJUSTIN Q. WERTH
4/8/2015 VO025009 01986910-15
121852R 12,724.290.00ROLLOVER 4/8/2015CKAMERICAN CENTURY INVEST
4/8/2015 VO025010 01987010-15
MASTER PAGE NO. 16

ClosedInvoice Discount AmountDocRefCheck Check InvoiceCheck
Nbr Type DateVendor IDVendor Name Nbr Type Date Taken PaidNumberTo Post
Date:Time:User:
Monday, May 04, 201510:13AMRET10011
Page:Report:Company:
3 of 903630.rptVCERA
Ventura County Retirement AssnCheck Register - Standard
Period: 10-15 As of: 5/4/2015
Period
F4319B2 2,544.920.00DEATH BENEFIT 4/8/2015CKTRACEY D. WALTERS
4/8/2015 VO025011 01987110-15
F8496S 2,978.930.00DEATH BENEFIT 4/8/2015CKCARLOS E. RODRIGUEZ
4/8/2015 VO025012 01987210-15
990002 39.100.00MILEAGE REIMB 4/8/2015CKARTHUR E. GOULET
4/8/2015 VO025013 01987310-15
CORPORATE 1,821.590.00ADMIN EXP 4/8/2015CKSTAPLES ADVANTAGE
4/8/2015 VO025014 01987410-15
MEGAPATH 608.580.00IT/PAS 4/8/2015CKGLOBAL CAPACITY
4/8/2015 VO025015 01987510-15
SBS 87.500.00IT 4/8/2015CKSBS GROUP
4/8/2015 VO025016 01987610-15
THONIS 39,930.740.00ADMIN EXP 4/8/2015CKTIM THONIS
4/8/2015 VO025017 01987710-15
VOLT 2,060.640.00ADMIN EXP/PAS 4/8/2015CKVOLT
4/8/2015 VO025018 01987810-15
WSJ 373.970.00ADMIN EXP 4/8/2015CKWALL STREET JOURNAL
4/8/2015 VO025019 01987910-15
102039B1R 137,310.730.00ROLLOVER 4/15/2015CKJP MORGAN CHASE - JPMCC
4/15/2015 VO025020 01988010-15
102204 12,408.900.00REFUND T2 COL 4/15/2015CKCONNIE F. CLARK
4/15/2015 VO025021 01988110-15
102788 13,268.920.00REFUND T2 COL 4/15/2015CKRUBY LARA-LEON
4/15/2015 VO025022 01988210-15
104599B1 148,736.650.00DEATH BENEFIT 4/15/2015CKTHE JUDITH L. OVERMYER TR
4/15/2015 VO025023 01988310-15
107645 11,982.050.00 REFUND T2 COL 4/15/2015CKKAREN CARPENTER
4/15/2015 VO025024 01988410-15
MASTER PAGE NO. 17

ClosedInvoice Discount AmountDocRefCheck Check InvoiceCheck
Nbr Type DateVendor IDVendor Name Nbr Type Date Taken PaidNumberTo Post
Date:Time:User:
Monday, May 04, 201510:13AMRET10011
Page:Report:Company:
4 of 903630.rptVCERA
Ventura County Retirement AssnCheck Register - Standard
Period: 10-15 As of: 5/4/2015
Period
117866 38,182.430.00REFUND-CONTRIB 4/15/2015CKJESSICA CARSON
4/15/2015 VO025025 01988510-15
124134 6,487.350.00REFUND-CONTRIB 4/15/2015CKANH-HAO LE VU
4/15/2015 VO025026 01988610-15
221018 666.090.00REFUND T2 COL 4/15/2015CKJOHN C. ECKERT
4/15/2015 VO025027 01988710-15
990002 1,035.140.00TRAVEL REIMB 4/15/2015CKARTHUR E. GOULET
4/15/2015 VO025028 01988810-15
ADP 11,619.930.00ADMIN EXP 4/15/2015CKADP LLC
4/15/2015 VO025029 01988910-15
BARNEY 945.000.00ADMIN EXP 4/15/2015CKABU COURT REPORTING INC
4/15/2015 VO025030 01989010-15
CMP 16,738.130.00IT/PAS 4/15/2015CKCMP & ASSOCIATES, INC
4/15/2015 VO025031 01989110-15
HARRIS 134.500.00ADMIN EXP 4/15/2015CKHARRIS WATER CONDITIONIN
4/15/2015 VO025032 01989210-15
HEXAVEST 92,414.990.00INVESTMENT FEES 4/15/2015CKHEXAVEST INC
4/15/2015 VO025033 01989310-15
LINEA 66,758.750.00IT/PAS 4/15/2015CKLINEA SOLUTIONS
4/15/2015 VO025034 01989410-15
MBS 18,675.870.00PAS 4/15/2015CKMANAGED BUSINESS SOLUT
4/15/2015 VO025035 01989510-15
PEREA 6,475.000.00ADMIN EXP 4/15/2015CKKENNETH A. PEREA
4/15/2015 VO025036 01989610-15
ROSENTHAL 10,543.750.00ADMIN EXP 4/15/2015CKJOHN L. ROSENTHAL
4/15/2015 VO025037 01989710-15
MASTER PAGE NO. 18

ClosedInvoice Discount AmountDocRefCheck Check InvoiceCheck
Nbr Type DateVendor IDVendor Name Nbr Type Date Taken PaidNumberTo Post
Date:Time:User:
Monday, May 04, 201510:13AMRET10011
Page:Report:Company:
5 of 903630.rptVCERA
Ventura County Retirement AssnCheck Register - Standard
Period: 10-15 As of: 5/4/2015
Period
SACRS 960.000.00ADMIN EXP 4/15/2015CKSACRS
4/15/2015 VO025038 01989810-15
S&L ADV 2,500.000.00ADMIN EXP 4/15/2015CKSCHOTT & LITES ADVOCATE
4/15/2015 VO025039 01989910-15
TOWERS 23,500.000.00ADMIN/PAS 4/15/2015CKTOWERS WATSON DELAWAR
4/15/2015 VO025040 01990010-15
TRI 1,388.280.00ADMIN EXP 4/15/2015CKTRI COUNTY OFFICE FURNIT
4/15/2015 VO025041 01990110-15
VITECH 219,600.000.00PAS 4/15/2015CKVITECH SYSTEMS GROUP IN
4/15/2015 VO025042 01990210-15
VSG 19,500.000.00PAS 4/15/2015CKVSG HOSTING, INC
4/15/2015 VO025043 01990310-15
VOLT 4,028.940.00ADMIN/PAS 4/15/2015CKVOLT
4/15/2015 VO025044 01990410-15
WISSLEY 332.500.00ADMIN EXP 4/15/2015CKDEBORAH Z. WISSLEY
4/15/2015 VO025045 01990510-15
101493 13,010.120.00REFUND T2 COL 4/22/2015CKLINDA GALVAN
4/22/2015 VO025046 01990610-15
103569 272.460.00REFUND T2 COL 4/22/2015CKLUCIANNE RANNI
4/22/2015 VO025047 01990710-15
104914 10,496.580.00REFUND T2 COL 4/22/2015CKIRENE CAMARENA
4/22/2015 VO025048 01990810-15
115594 12,506.880.00REFUND CONTRIB 4/22/2015CKBRENDA GOMEZ ORTIZ
4/22/2015 VO025049 01990910-15
119245 50,684.980.00REFUND CONTRIB 4/22/2015CKKENNETH N. HAMILTON
4/22/2015 VO025050 01991010-15
123579 4,457.950.00REFUND CONTRIB 4/22/2015CKRAPHAEL J. LACHS
4/22/2015 VO025051 01991110-15
MASTER PAGE NO. 19

ClosedInvoice Discount AmountDocRefCheck Check InvoiceCheck
Nbr Type DateVendor IDVendor Name Nbr Type Date Taken PaidNumberTo Post
Date:Time:User:
Monday, May 04, 201510:13AMRET10011
Page:Report:Company:
6 of 903630.rptVCERA
Ventura County Retirement AssnCheck Register - Standard
Period: 10-15 As of: 5/4/2015
Period
123619 6,820.570.00REFUND CONTRIB 4/22/2015CKCHRISTOPHER R. PAGE
4/22/2015 VO025052 01991210-15
124272 1,561.060.00REFUND CONTRIB 4/22/2015CKANN MARIE JEROME
4/22/2015 VO025053 01991310-15
F9050 737.220.00PENSION PAYMENT 4/22/2015CKSALLY A. DOYLE
4/22/2015 VO025054 01991410-15
F1777B1 1,835.770.00DEATH BENEFIT 4/22/2015CKDAVID J. MALMIN
4/22/2015 VO025055 01991510-15
F2672B1 3,986.460.00DEATH BENEFIT 4/22/2015CKGREGORY L. BECKER
4/22/2015 VO025056 01991610-15
F2758S 6,221.860.00DEATH BENEFIT 4/22/2015CKBARBARA ELLEN HIGGINBOT
4/22/2015 VO025057 01991710-15
F3206B1R 3,819.810.00ROLLOVER 4/22/2015CKMORGAN STANLEY
4/22/2015 VO025058 01991810-15
F5892S 1,530.800.00DEATH BENEFIT 4/22/2015CKCHRISTINE S. HECKERMAN
4/22/2015 VO025059 01991910-15
F6811B1 5,771.740.00DEATH BENEFIT 4/22/2015CKSTEVEN J. STONE
4/22/2015 VO025060 01992010-15
990002 39.100.00MILEAGE REIMB 4/22/2015CKARTHUR E. GOULET
4/22/2015 VO025061 01992110-15
ACCESS 320.620.00ADMIN EXP 4/22/2015CKACCESS INFORMATION MANA
4/22/2015 VO025062 01992210-15
AT&T 409.050.00IT 4/22/2015CKAT & T MOBILITY
4/22/2015 VO025063 01992310-15
BOFA 1,805.760.00ADMIN/PAS/IT 4/22/2015CKBUSINESS CARD
4/22/2015 VO025064 01992410-15
MASTER PAGE NO. 20

ClosedInvoice Discount AmountDocRefCheck Check InvoiceCheck
Nbr Type DateVendor IDVendor Name Nbr Type Date Taken PaidNumberTo Post
Date:Time:User:
Monday, May 04, 201510:13AMRET10011
Page:Report:Company:
7 of 903630.rptVCERA
Ventura County Retirement AssnCheck Register - Standard
Period: 10-15 As of: 5/4/2015
Period
CORPORATE 105.280.00ADMIN EXP 4/22/2015CKSTAPLES ADVANTAGE
4/22/2015 VO025065 01992510-15
INTERGRATE 250.000.00IT 4/22/2015CKINTEGRATED FIRE & SAFETY
4/22/2015 VO025066 01992610-15
MF 16,547.530.00ADMIN EXP 4/22/2015CKM.F. DAILY CORPORATION
4/22/2015 VO025067 01992710-15
SHRED-IT 195.600.00ADMIN EXP 4/22/2015CKSHRED-IT USA
4/22/2015 VO025068 01992810-15
TWC 481.970.00ADMIN EXP 4/22/2015CKTIME WARNER CABLE
4/22/2015 VO025069 01992910-15
VOLT 1,253.880.00ADMIN EXP 4/22/2015CKVOLT
4/22/2015 VO025070 01993010-15
CA SDU 1,052.470.00CRT ORDERED PMT 4/29/2015CKCALIFORNIA STATE
4/29/2015 VO025071 01993110-15
CALPERS 18,263.040.00INSURANCE 4/29/2015CKCALPERS LONG-TERM
4/29/2015 VO025072 01993210-15
CHILD21 171.740.00CRT ORDERED PMT 4/29/2015CKOREGON DEPT OF JUSTICE
4/29/2015 VO025073 01993310-15
CHILD9 260.000.00CRT ORDERED PMT 4/29/2015CKSHERIDA SEGALL
4/29/2015 VO025074 01993410-15
CHILD5 511.000.00CRT ORDERED PMT 4/29/2015CKSTATE DISBURSEMENT UNIT
4/29/2015 VO025075 01993510-15
CVMP 592,793.850.00INSURANCE 4/29/2015CKCOUNTY OF VENTURA
4/29/2015 VO025076 01993610-15
FTBCA3 137.260.00GARNISHMENT 4/29/2015CKFRANCHISE TAX BOARD
4/29/2015 VO025077 01993710-15
IRS6 321.000.00GARNISHMENT 4/29/2015CKINTERNAL REVENUE SERVIC
4/29/2015 VO025078 01993810-15
MASTER PAGE NO. 21

ClosedInvoice Discount AmountDocRefCheck Check InvoiceCheck
Nbr Type DateVendor IDVendor Name Nbr Type Date Taken PaidNumberTo Post
Date:Time:User:
Monday, May 04, 201510:13AMRET10011
Page:Report:Company:
8 of 903630.rptVCERA
Ventura County Retirement AssnCheck Register - Standard
Period: 10-15 As of: 5/4/2015
Period
IRS7 500.000.00GARNISHMENT 4/29/2015CKINTERNAL REVENUE SERVIC
4/29/2015 VO025079 01993910-15
REAVC 4,287.000.00DUES 4/29/2015CKRETIRED EMPLOYEES' ASSO
4/29/2015 VO025080 01994010-15
SEIU 355.500.00DUES 4/29/2015CKSEIU LOCAL 721
4/29/2015 VO025081 01994110-15
SPOUSE2 1,874.000.00CRT ORDERED PMT 4/29/2015CKKELLY SEARCY
4/29/2015 VO025082 01994210-15
SPOUSE3 250.000.00CRT ORDERED PMT 4/29/2015CKANGELINA ORTIZ
4/29/2015 VO025083 01994310-15
SPOUSE4 550.000.00CRT ORDERED PMT 4/29/2015CKCATHY C. PEET
4/29/2015 VO025084 01994410-15
SPOUSE5 829.000.00CRT ORDERED PMT 4/29/2015CKSUZANNA CARR
4/29/2015 VO025085 01994510-15
SPOUSE6 675.000.00CRT ORDERED PMT 4/29/2015CKBARBARA JO GREENE
4/29/2015 VO025086 01994610-15
SPOUSE7 104.000.00CRT ORDERED PMT 4/29/2015CKMARIA G. SANCHEZ
4/29/2015 VO025087 01994710-15
SPOUSE8 1,358.000.00CRT ORDERED PMT 4/29/2015CKDEBBIE ANN BETTIS
4/29/2015 VO025088 01994810-15
VCDSA 248,352.420.00INSURANCE 4/29/2015CKVENTURA COUNTY DEPUTY
4/29/2015 VO025089 01994910-15
VCPFF 71,654.740.00INSURANCE 4/29/2015CKVENTURA COUNTY PROFESS
4/29/2015 VO025090 01995010-15
VRSD 7,429.610.00INSURANCE 4/29/2015CKVENTURA REGIONAL
4/29/2015 VO025091 01995110-15
MASTER PAGE NO. 22

ClosedInvoice Discount AmountDocRefCheck Check InvoiceCheck
Nbr Type DateVendor IDVendor Name Nbr Type Date Taken PaidNumberTo Post
Date:Time:User:
Monday, May 04, 201510:13AMRET10011
Page:Report:Company:
9 of 903630.rptVCERA
Ventura County Retirement AssnCheck Register - Standard
Period: 10-15 As of: 5/4/2015
Period
VSP 10,247.650.00INSURANCE 4/29/2015CKVISION SERVICE PLAN - (CA)
4/29/2015 VO025092 01995210-15
Check Count: 108 Acct Sub Total: 2,620,726.45
Amount PaidCountCheck Type2,620,726.45108Regular
0.000Hand
0.000Void
0.000Stub
Zero 0.000Mask 0 0.00Total: 108 2,620,726.45
Electronic Payment 0 0.00
Company Total 2,620,726.45Company Disc Total 0.00
MASTER PAGE NO. 23

VENTURA COUNTY EMPLOYEES' RETIREMENT ASSOCIATION BUDGET SUMMARY FISCAL YEAR 2014-2015April 2015 - 83.33% of Fiscal Year Expended
Adopted AdjustedEXPENDITURE DESCRIPTIONS 2014/2015 2014/2015 Year to Date Available Percent
Budget Budget Apr-15 Expended Balance ExpendedSalaries & Benefits: Salaries 1,842,500.00$ 1,842,500.00$ 209,605.77$ 1,338,328.50$ 504,171.50$ 72.64% Extra-Help 62,600.00 62,600.00 47,274.20 105,213.23 (42,613.23) 168.07% Overtime 1,000.00 1,000.00 0.00 2,155.44 (1,155.44) 215.54% Supplemental Payments 59,600.00 59,600.00 6,300.34 40,095.52 19,504.48 67.27% Vacation Redemption 102,500.00 102,500.00 6,153.74 62,058.08 40,441.92 60.54% Retirement Contributions 366,000.00 366,000.00 42,080.87 273,869.64 92,130.36 74.83% OASDI Contributions 115,600.00 115,600.00 13,511.78 83,641.54 31,958.46 72.35% FICA-Medicare 29,100.00 29,100.00 3,160.00 20,447.33 8,652.67 70.27% Retiree Health Benefit 13,300.00 13,300.00 1,447.20 18,371.60 (5,071.60) 138.13% Group Health Insurance 182,100.00 182,100.00 20,196.00 130,607.40 51,492.60 71.72% Life Insurance/Mgmt 1,100.00 1,100.00 117.64 800.66 299.34 72.79% Unemployment Insurance 2,300.00 2,300.00 253.25 1,617.66 682.34 70.33% Management Disability Insurance 4,500.00 4,500.00 1,509.34 7,430.93 (2,930.93) 165.13% Worker' Compensation Insurance 13,400.00 13,400.00 1,701.61 10,746.50 2,653.50 80.20% 401K Plan Contribution 33,100.00 33,100.00 3,781.17 22,233.82 10,866.18 67.17% Transfers In 150,700.00 150,700.00 5,188.31 63,076.07 87,623.93 41.86% Transfers Out (150,700.00) (150,700.00) (5,188.31) (63,076.07) (87,623.93) 41.86%
Total Salaries & Benefits 2,828,700.00$ 2,828,700.00$ 357,092.91$ 2,117,617.85$ 711,082.15$ 74.86%
Services & Supplies: Telecommunication Services - ISF 37,800.00$ 37,800.00$ 3,158.12$ 31,486.09$ 6,313.91$ 83.30% General Insurance - ISF 12,200.00 12,200.00 0.00 6,104.00 6,096.00 50.03% Office Equipment Maintenance 1,000.00 1,000.00 0.00 539.80 460.20 53.98% Membership and Dues 9,500.00 9,500.00 0.00 8,359.00 1,141.00 87.99% Education Allowance 10,000.00 10,000.00 0.00 4,000.00 6,000.00 40.00% Cost Allocation Charges (35,400.00) (35,400.00) (17,498.00) (34,996.00) (404.00) 98.86% Printing Services - Not ISF 3,000.00 3,000.00 0.00 2,275.47 724.53 75.85% Books & Publications 2,500.00 2,500.00 373.97 1,930.04 569.96 77.20% Office Supplies 20,000.00 20,000.00 1,926.87 12,192.60 7,807.40 60.96% Postage & Express 59,700.00 59,700.00 12,907.25 49,095.13 10,604.87 82.24% Printing Charges - ISF 10,000.00 10,000.00 5,423.72 15,777.00 (5,777.00) 157.77% Copy Machine Services - ISF 6,500.00 6,500.00 0.00 1,030.80 5,469.20 15.86% Board Member Fees 12,000.00 12,000.00 1,600.00 10,000.00 2,000.00 83.33% Professional Services 1,074,000.00 1,091,500.00 78,505.12 739,563.48 351,936.52 67.76% Storage Charges 5,500.00 5,500.00 320.62 3,025.80 2,474.20 55.01% Equipment 0.00 0.00 0.00 8,277.50 (8,277.50) #DIV/0! Office Lease Payments 186,000.00 196,700.00 16,547.53 158,449.36 38,250.64 80.55% Private Vehicle Mileage 9,000.00 9,000.00 879.95 5,454.59 3,545.41 60.61% Conference, Seminar and Travel 63,000.00 63,000.00 2,003.39 41,162.30 21,837.70 65.34% Furniture 5,000.00 5,000.00 1,388.28 4,190.48 809.52 83.81% Facilities Charges 3,900.00 3,900.00 1,384.79 5,334.26 (1,434.26) 136.78% Transfers In 16,000.00 16,000.00 550.97 6,698.38 9,301.62 41.86% Transfers Out (16,000.00) (16,000.00) (550.97) (6,698.38) (9,301.62) 41.86%
Total Services & Supplies 1,495,200.00$ 1,523,400.00$ 108,921.61$ 1,073,251.70$ 450,148.30$ 70.45%
Total Sal, Ben, Serv & Supp 4,323,900.00$ 4,352,100.00$ 466,014.52$ 3,190,869.55$ 1,161,230.45$ 73.32%
Technology: Computer Hardware 32,600.00$ 32,600.00$ 1,783.99$ 3,972.54 28,627.46$ 12.19% Computer Software 193,000.00 193,000.00 149,963.72 198,982.99 (5,982.99) 103.10% Systems & Application Support 670,200.00 670,200.00 48,435.12 426,724.19 243,475.81 63.67% Pension Administration System 1,621,400.00 1,972,800.00 158,836.62 1,332,850.45 639,949.55 67.56%
Total Technology 2,517,200.00$ 2,868,600.00$ 359,019.45$ 1,962,530.17$ 906,069.83$ 68.41%
Contingency 615,200.00$ 235,600.00$ -$ -$ 235,600.00$ 0.00%
Total Current Year 7,456,300.00$ 7,456,300.00$ 825,033.97$ 5,153,399.72$ 2,302,900.28$ 69.11%
MASTER PAGE NO. 24

May 18, 2015 Board of Retirement Ventura County Employees’ Retirement Association 1190 South Victoria Avenue, Suite 200 Ventura, CA 93003 SUBJECT: FINAL APPROVAL OF JUNE 30, 2014 ACTUARIAL VALUATION REPORT WITH CORRECTIONS Dear Board Members: On February 23rd, the Board of Retirement approved the June 20, 2014 Actuarial Valuation Report. In late March, we were informed by Segal that they had a correction/revision to page 75 to the chart listing member contribution rates for non-PEPRA Tiers that include a 50/50 sharing of normal cost. As this revision effected member contribution rates, VCERA allowed for another 25-day review period after informing stakeholders of the correction. This period has passed and staff requests formal adoption of the report and contribution rates within it. Page 75 is provided again for your reference; the entire final report is on our public site as well as the actuarial folder in DropBox. Provided is my written recommendation to the Ventura County Board of Supervisors, dated April 30, 2015 communicating the rates provided in the report for their adoption. This item is scheduled for their May 19th, 2015 meeting. RECOMMENDATION: ADOPT CORRECTED JUNE 30, 2014 ACTUARIAL VALUATION, RATIFY WRITTEN RECOMMENDATION TO BOARD OF SUPERVISORS DATED APRIL 30, 2015 AND AUTHORIZE THE RETIREMENT ADMINISTRATOR TO FORMALLY RECOMMEND THE CORRESPONDING RATES AT THE BOARD OF SUPERVISORS MEETING ON MAY 19TH. Sincerely,
Linda Webb Retirement Administrator
MASTER PAGE NO. 25

April 30, 2015 Board of Supervisors County of Ventura 800 S. Victoria Avenue Ventura, CA 93009 SUBJECT: APPROVAL OF ANNUAL ACTUARIAL VALUATION OF THE VENTURA COUNTY EMPLOYEES’ RETIREMENT ASSOCIATION (Report on File with Clerk of the Board) Dear Board Members: RECOMMENDATION: Adopt, pursuant to Government Code sections 31453 and 31454, the employer and employee retirement plan contribution rates as detailed in the provided Actuarial Valuation and Review as of June 30, 2014, prepared by Segal Consulting (Study). FISCAL IMPACTS: Specific rates for specific member categories are provided on the following page, reflecting the 50/50 sharing of Normal Cost for non-PEPRA tiers. Generally speaking though, for all of active VCERA members before reflecting this sharing, the average employer rate will decrease from 29.03% of payroll to 28.11% of payroll. The average member rate will increase from 8.58% of payroll to 8.61% of payroll. Total annual employer contributions are projected to decrease from $185 million to approximately $182 million based upon a projected total plan compensation payroll of approximately $649 million. Total annual employer contributions, and the associated employer contribution rates, will decrease for most retirement association member categories; the only increasing employer contribution rates are observed in the General Tier 2 categories with COLA (both legacy and PEPRA). Annual employee contributions are expected to increase slightly from $54.8 to $55.8 million in the upcoming fiscal year (Study – pages v and 21). SUMMARY OF RESULTS FROM JUNE 30, 2014, ACTUARIAL VALUATION AND REVIEW:
• VCERA’s plan assets earned 18.1% for fiscal year ending June 30, 2014 on a market value basis.
• The investment return on the valuation value of assets in the Study was 8.1% due to the deferral of most of the current year investment gains and recognition of prior year investment gains and losses.
• There were $310 million in net deferred investment gains as of June 30, 2014, compared to $6 million deferred losses as of June 30, 2013.
MASTER PAGE NO. 26

April 30, 2015 Page 2 of 2
• VCERA’s funded status, the ratio of valuation value of assets to accrued liabilities is 82.7%as of June 30, 2014, an improvement of 3.5% since June 30, 2013.
The following table provides the new total contribution rates to be adopted for each tier for the fiscal year beginning July 1, 2015. It reflects the normal cost as well as the costs associated with the Unfunded Actuarial Accrued Liability (UAAL) and, for those categories eligible, COLA costs.
2015-2016 CONTRIBUTION RATES (REFLECTING 50/50 COST SHARING FOR LEGACY MEMBERS)
MEMBER CATEGORY
TOTAL* EMPLOYER
RATE TOTAL*
MEMBER RATE First $350 Over $350
General Tier 1 Members 22.61% 6.65% 9.98% General Tier 2 Members w/o COLA 16.8% 4.81% 7.22% General Tier 2 Members w/COLA 19.43% 7.44% 9.85% Safety Members 52.09% 15.35% 15.35%
General PEPRA Tier 2 Members w/o COLA 16.63% 6.92% General PEPRA Tier 2 Members w/COLA 19.21% 9.55% Safety PEPRA Members 50.30% 14.69% *Combines normal cost, UAAL and COLA costs, where applicable.
DISCUSSION:
The investment gain of $310 million indicated above will be recognized in the determination of the actuarial value of assets for funding purposes over the next few years. This net deferred gain represents about 7.3% of the market value of assets.
Last year, directly comparing the June 30, 2013, and June 30, 2012, valuations proved difficult, largely because of the Board of Retirement’s decision to “phase-in” costs associated with certain plan economic assumption changes. In this current valuation, the 3-year phase-in is complete. The June 30, 2013 valuation results shown do not include the effect of the phase-in.
The Study was previously provided to the County Executive Office in December for use in developing budget projections in the upcoming fiscal year.
Sincerely,
Linda Webb Retirement Administrator
c: Michael Powers, County Executive Officer Leroy Smith, County Counsel Jeff Burgh, Auditor-Controller
MASTER PAGE NO. 27
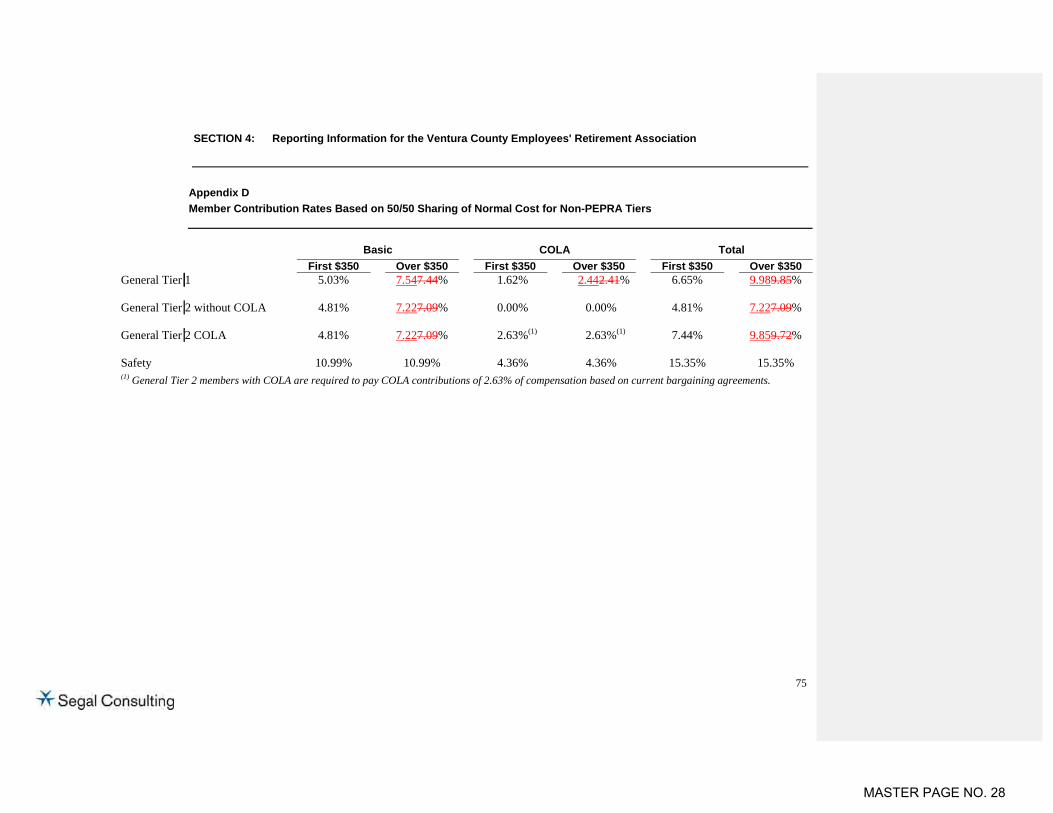
SECTION 4: Reporting Information for the Ventura County Employees' Retirement Association
75
Appendix D Member Contribution Rates Based on 50/50 Sharing of Normal Cost for Non-PEPRA Tiers
Basic COLA Total
First $350 Over $350 First $350 Over $350 First $350 Over $350General Tier 1 5.03% 7.547.44% 1.62% 2.442.41% 6.65% 9.989.85% General Tier 2 without COLA 4.81% 7.227.09% 0.00% 0.00% 4.81% 7.227.09% General Tier 2 COLA 4.81% 7.227.09% 2.63%(1) 2.63%(1) 7.44% 9.859.72% Safety 10.99% 10.99% 4.36% 4.36% 15.35% 15.35% (1) General Tier 2 members with COLA are required to pay COLA contributions of 2.63% of compensation based on current bargaining agreements.
MASTER PAGE NO. 28

Copyright © 2015 by The Segal Group, Inc. All rights reserved.
Actuarial Experience Study
April 20, 2015
Ventura County Employees’ Retirement Association
Paul Angelo, FSA
John Monroe, ASA
Segal Consulting, San Francisco
5361434v1MASTER PAGE NO. 29

2
Actuarial assumptions – two kinds• Demographic
– When benefits will be payable– Amount of benefits
• Economic – How assets grow– How salaries increase
Actuarial Assumptions
MASTER PAGE NO. 30

3
Rates of “decrement”•Termination, mortality, disability, retirement•Termination
– Withdrawal– Deferred vested
•Mortality:– Before and after retirement– Service connected or not– Service, disability, beneficiary
Percent married Member/spouse age differenceReciprocityAssumptions can be distinct for General and Safety
Demographic Assumptions
MASTER PAGE NO. 31

4
Inflation - component, plus COLAInvestment return•Real returnSalary increases•Real wage increases (“across the board”)•Merit and promotion (included with demographic
assumptions)In-Service Redemptions: also “demographic”
Economic Assumptions
MASTER PAGE NO. 32
5
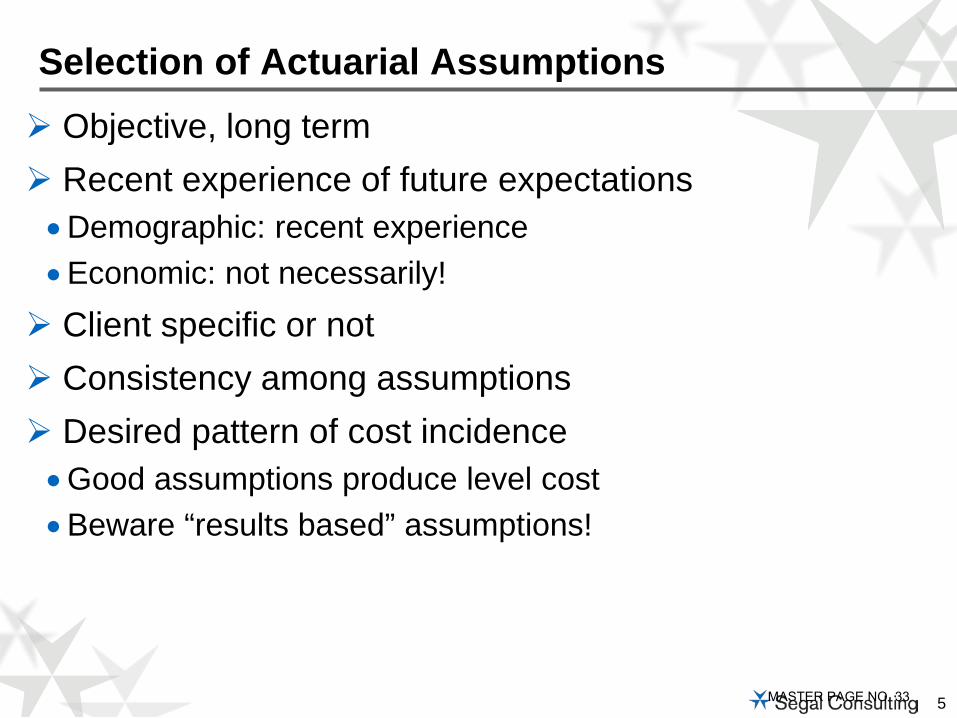
Objective, long term Recent experience of future expectations•Demographic: recent experience•Economic: not necessarily! Client specific or not Consistency among assumptions Desired pattern of cost incidence•Good assumptions produce level cost•Beware “results based” assumptions!
Selection of Actuarial Assumptions
MASTER PAGE NO. 33

6
Actuarial valuation determines the current or “measured” cost, not the ultimate cost Assumptions and funding methods affect only the timing
of costs
Always remember
C + I = B + EContributions + Investment Income
equalsBenefit Payments + Expenses
MASTER PAGE NO. 34

7
To determine rates for each assumption we count the “decrements” and “exposures” for that event•Exposures = Number of employees who could have
terminated, retired, etc.•Decrements = Number of employees who actually
terminated, retired, etc.•This gives the “actual” decrement rates during the periodCompare to the “current” assumed rates (or to expected
number of decrements based on those current rates)Develop “proposed” new assumption based on both
“current” assumption and recent “actual” experience•Weight the “actual” based on “credibility”
Setting Demographic Assumptions
MASTER PAGE NO. 35

8
Setting Demographic Assumption – Retirement Rates
Retirement Rates from Experience Study
0%
5%
10%
15%
20%
25%
30%
35%
40%
45%
50%
55%
50 51 52 53 54 55 56 57 58 59 60 61 62 63 64 65 66 67 68 69
Age
Chart 1 Retirement Rates – Non-PEPRA General Members
Current Actual Proposed
MASTER PAGE NO. 36

9
Retirement rates:• Slightly later retirements for both General and SafetyTermination rates:•Change from service/age based to service based
– Decrease termination rates for both General and Safety•Maintain current assumption that member will choose a refund or
deferred benefit based on which option is more valuableDisability incidence:•Decreased for both General and SafetyIn-Service Redemptions:•Decreased the assumptions for both non-PEPRA General Tier 1
and non-PEPRA Safety
Recommendations - Demographic
MASTER PAGE NO. 37

10
Mortality Rates• Service retirement – Longer life expectancies • Disabled retirement – Longer life expectancies for General and
shorter for Safety• Preferable to have a margin of around 10%
– Actual deaths during the study period should be around 10% greater than the expected deaths
• Can allow for margin using “age setbacks”, mortality improvement scales or both
• The Society of Actuaries has published scales to estimate future mortality improvements:– Scale AA - Has been standard since around 2000
» Does not accurately reflect recent improvements in mortality– Scale BB - Interim standard scale issued in 2012– Scale MP-2014 – Issued in October 2014
Setting Demographic Assumptions – Mortality
MASTER PAGE NO. 38

11
Setting Demographic Assumptions – Mortality Rates
Mortality Experience from Experience Study
0
50
100
150
200
250
Male Female Total
105131
236
95
143
238
86
124
210
Chart 5Post - Retirement Deaths
Non - Disabled General Members
Expected - Current Actual Expected - ProposedMASTER PAGE NO. 39

12
Two ways to use mortality improvement scales to project future mortality improvements: Static or GenerationalStatic projection to a future year - reflect mortality at a future date, not
as of today• Recommend use of static mortality projection to achieve
approximately 10% margin for future mortality improvement– RP-2000 with Scale BB projection to 2035
Future studies might include a recommendation for generational mortality• Each future year has its own mortality table that reflects the
forecasted improvements at every age– Younger participants have more future mortality improvement built
in than for older participantsCalPERS has adopted a static projection
Setting Demographic Assumptions – Mortality
MASTER PAGE NO. 40

13
Price Inflation (CPI):• Investment Return, Salary Increases, COLA
Salary Increases• “Across the board” increases (wage inflation)
– Includes price inflation plus real wage growth• Promotional & Merit: based on experience
– Really is a “demographic” assumption
Investment Return (Investment Earnings)•Components include price inflation, real return, expenses
(administrative and/or investment)•Generally based on passive returns
Economic Assumptions
MASTER PAGE NO. 41

14
Last full review was for 6/30/2012• Price inflation (CPI): 3.25%•Wage inflation: 4.00%
– So real wage growth is 0.75% • Investment return: 7.75%
– So net real return is 4.50%
Current Economic Assumptions
MASTER PAGE NO. 42

15
Price inflation (CPI)•Decrease from 3.25% to 3.00%
Salary increases•Decrease price inflation from 3.25% to 3.00%•Reduce the real wage growth from 0.75% to 0.50%• Total wage inflation reduced from 4.00% to 3.50%•Merit and promotional: slight increases to rates overall •Net impact is a reduction in assumed future salary increases
Investment return: Decrease from 7.75% to 7.50%•Change from net of administrative expenses to gross
Explicit Administrative Expenses• 0.7% of payroll allocated between the employer and member
Economic Assumptions - Recommended
MASTER PAGE NO. 43

16
Economic Assumptions - Recommended
6/30/2012 Val’n RecommendedReturn Pay Return Pay
Price Inflation 3.25% 3.25% 3.00% 3.00%
Real Wages n/a 0.75% n/a 0.50%
Merit(16+ years)
n/a 0.50% n/a 0.50%
Net Real Return 4.50% n/a 4.50%* n/a
Total 7.75% 4.50% 7.50% 4.00%
* Recommended return is gross of administrative expense
MASTER PAGE NO. 44
17
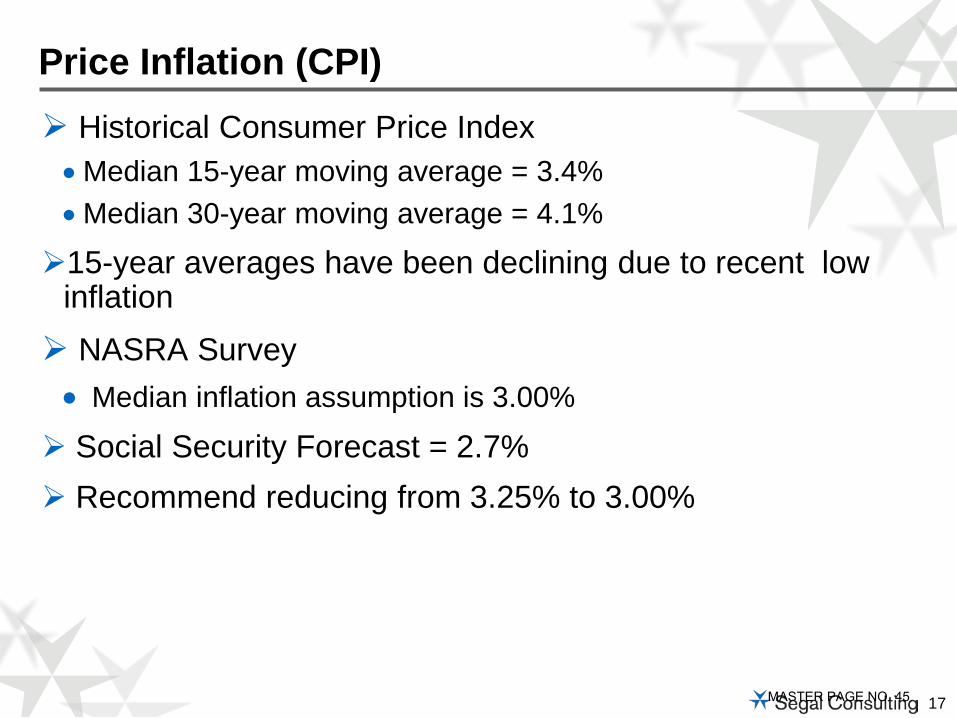
Historical Consumer Price Index•Median 15-year moving average = 3.4%•Median 30-year moving average = 4.1%
15-year averages have been declining due to recent low inflation NASRA Survey• Median inflation assumption is 3.00%
Social Security Forecast = 2.7% Recommend reducing from 3.25% to 3.00%
Price Inflation (CPI)
MASTER PAGE NO. 45

18
Three components Price inflation: decrease from 3.25% to 3.00% Real increases: decrease from 0.75% to 0.50%•Department of Labor: Annual State and Local Government real
productivity increase: 0.5% - 0.7% over 10 - 20 years
Promotional & Merit: from experience study• Based on years of service•General: Currently 5.00% (0-1 years) to 0.50% (9+ years)
– Overall minor increase at most years of service• Safety: Currently 8.50% (0-1 years) to 0.50% (16+ years)
– Overall minor increase at most years of service
Net reduction in assumed future salary increases
Salary Increase Assumption - Recommended
MASTER PAGE NO. 46

19
Active member payroll based on wage inflation Includes price inflation and real wage increases• Price inflation: reduce from 3.25% to 3.00%• Real increases: decrease from 0.75% to 0.50%• Total is reduced from 4.00% to 3.50%
Used to project total payroll for UAAL amortization
Payroll Growth Assumption
MASTER PAGE NO. 47

20
Also called the discount rate Used for contribution requirements Affects timing of Plan cost• Lower assumed rate means higher current cost• Ultimately, actual earnings determine cost
– C + I = B + E• “Can’t pay benefits with assumed earnings!”
Investment Earnings Assumption
MASTER PAGE NO. 48

21
Four components• Inflation: consistent with salary increase assumption•Real returns by asset class
– Weighted by asset allocation•Reduced by assumed expenses
– Currently both investment and administrative– Recommend reflecting only investment expenses,
with separate assumption for administrative expenses•Reduced by “risk adjustment”
– Margin for adverse deviation– Expressed as confidence level above 50%
Setting the Earnings Assumption
MASTER PAGE NO. 49

22
VCERA Earnings Assumption
Current RecommendedAssumed Inflation 3.25% 3.00%Portfolio Real Rate of Return 5.31% 5.26%Assumed Expenses * (0.40%) (0.40%)Risk Adjustment (0.41%) (0.36%)Assumed Investment Return 7.75% 7.50%
Confidence level 54% 54%
* Includes both investment and administrative expenses
Preview: Components of Preliminary Investment Return Assumption
MASTER PAGE NO. 50

23
Easy: change in asset allocationHard: change in estimated future real returns for asset
classesSource of data:• Investment consultants (industry)• Investment consultant (your Fund)
Actuaries are neither economists nor investment consultants
When to Change Earnings Assumption?
MASTER PAGE NO. 51

24
Segal uses an average of 9 investment advisory firms retained by Segal public clients•Used results from NEPC for asset categories unique to VCERADecrease in real return is due to a combination of:• Changes in the target asset allocation (+0.38%)• Changes in real return assumptions in survey (-0.33%)
Real Returns by Asset Class
MASTER PAGE NO. 52

25
VCERA Real Rate of Return
Asset Class Target Real WeightedAllocation Return Return*
Large Cap U.S. Equity 27.74% 5.90% 1.64%Small Cap U.S. Equity 3.41% 6.60% 0.23%Developed Int'l Equity 14.73% 6.95% 1.02%Emerging Market Equity 3.12% 8.44% 0.26%U.S. Core Fixed Income 14.00% 0.71% 0.10%Real Estate 7.00% 4.65% 0.33%Private Debt/Credit Strategies 5.00% 6.01% 0.30%Absolute Return (Risk Parity) 16.00% 4.13% 0.66%Real Assets (MLPs) 4.00% 6.51% 0.26%Private Equity 5.00% 9.25% 0.46%Total 100.00% 5.26%
* Results may not add due to rounding
MASTER PAGE NO. 53

26
Administrative and Investment Expenses
Administrative and Investment Expenses as a Percentage of Actuarial Value of Assets
(All dollars in 000’s)
FYE
Actuarial Value of Assets
Administrative Expenses
Investment Expenses
Administrative %
Investment % Total %
2010 $3,134,978 $4,081 $6,256 0.13% 0.20% 0.33%
2011 3,236,217 4,387 7,404 0.14 0.23 0.36
2012 3,411,149 3,505 9,103 0.10 0.27 0.37
2013 3,633,626 3,944 9,901 0.11 0.27 0.38
2014 3,964,814 4,045 12,877 0.10 0.32 0.43 Average 0.12% 0.26% 0.37%
Based on this experience, we have maintained the future expense component at 0.40% for investment andadministrative expenses.
MASTER PAGE NO. 54

27
Compares the Association’s risk position over time Confidence level is a relative, not absolute measure• Can be reevaluated and reset for future comparisons
Confidence level is based on standard deviation• Measure of volatility based on portfolio assumptions
Results should be evaluated for reasonableness
Risk Adjustment Model and Confidence Level
MASTER PAGE NO. 55
28
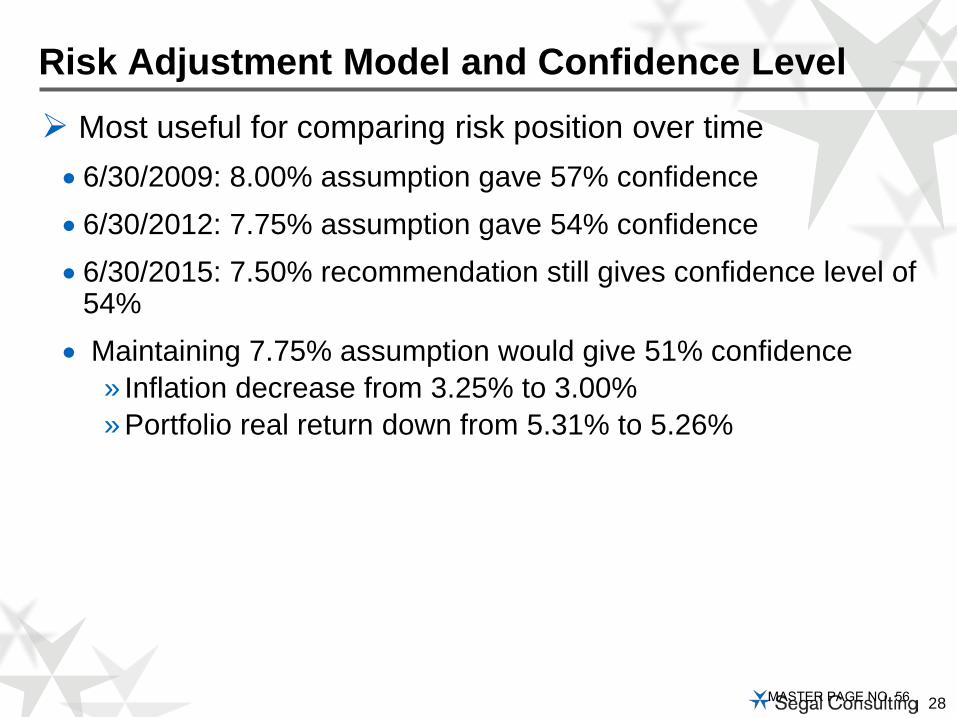
Most useful for comparing risk position over time• 6/30/2009: 8.00% assumption gave 57% confidence • 6/30/2012: 7.75% assumption gave 54% confidence• 6/30/2015: 7.50% recommendation still gives confidence level of
54%• Maintaining 7.75% assumption would give 51% confidence
» Inflation decrease from 3.25% to 3.00%» Portfolio real return down from 5.31% to 5.26%
Risk Adjustment Model and Confidence Level
MASTER PAGE NO. 56

29
VCERA Earnings Assumption
Current RecommendedAssumed Inflation 3.25% 3.00%Portfolio Real Rate of Return 5.31% 5.26%Assumed Expenses * (0.40%) (0.40%)Risk Adjustment (0.41%) (0.36%)Assumed Investment Return 7.75% 7.50%
Confidence level 54% 54%
* Includes both investment and administrative expenses
Components of Preliminary Investment Return Assumption
MASTER PAGE NO. 57

30
Comparison with other systems•Median is 7.90% but trending down nationwide•California public systems – most at 7.25% to 7.50%•Orange CERS, Contra Costa CERA, Fresno CERA,
Mendocino CERA and San Mateo CERA recently adopted 7.25%
Earnings Assumption - 2015
MASTER PAGE NO. 58

31
For funding, current investment return assumption is net of both investment and administrative expensesFor financial reporting, GASB 67 and 68 require this
assumption to be gross of administrative expenseAdvantages to using same assumption for funding and for
financial reporting• Take advantage of consistency between new GASB rules and
current funding practices– Entry Age cost method– Discount rate based on expected investment return
•Consistency of liability and normal cost measures– The only difference is in how changes in liability are recognized
Developing an Investment Return Assumption for use in GASB 67 and 68 Financial Reporting
MASTER PAGE NO. 59
32
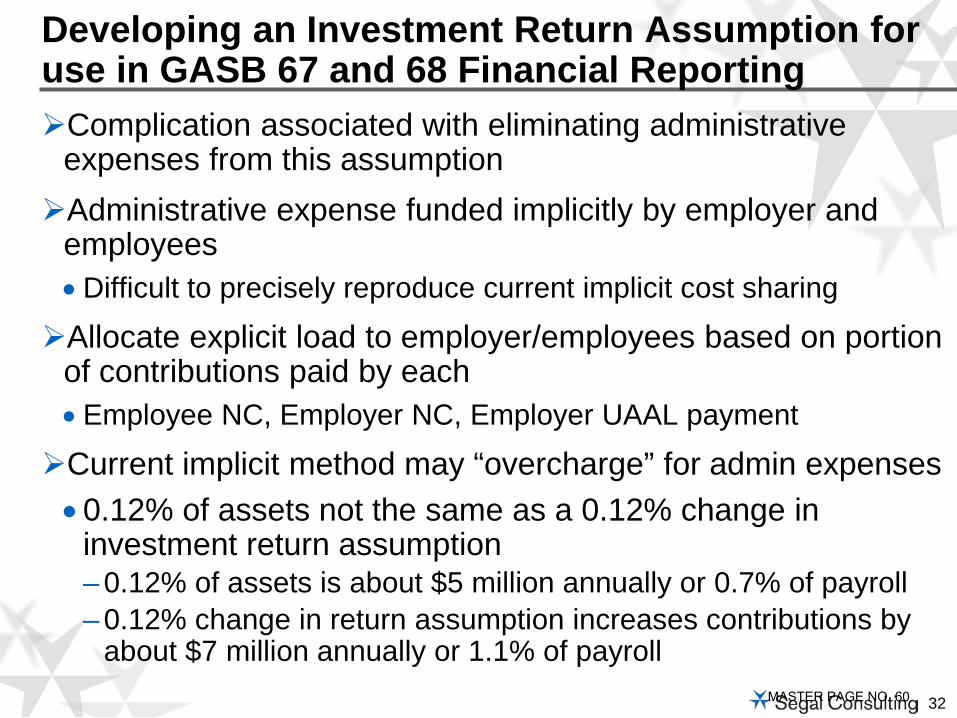
Complication associated with eliminating administrative expenses from this assumptionAdministrative expense funded implicitly by employer and
employees•Difficult to precisely reproduce current implicit cost sharing
Allocate explicit load to employer/employees based on portion of contributions paid by each• Employee NC, Employer NC, Employer UAAL payment
Current implicit method may “overcharge” for admin expenses•0.12% of assets not the same as a 0.12% change in
investment return assumption– 0.12% of assets is about $5 million annually or 0.7% of payroll– 0.12% change in return assumption increases contributions by
about $7 million annually or 1.1% of payroll
Developing an Investment Return Assumption for use in GASB 67 and 68 Financial Reporting
MASTER PAGE NO. 60

33
Review: Advantages to using same assumption for funding and for financial reporting•Consistency of liability and normal cost measures
Two ways to do this: •Option “A” – Set the investment return assumption for funding on
a gross of administrative expenses basis– Use same assumption for financial reporting– Add and allocate explicit contribution load for admin. expenses
•Option “B” – Continue to set investment return assumption for funding on a net of administrative expenses basis – Use same value for assumption for financial reporting gross of
administrative expenses» That return is net of administrative expenses for funding» Same return is gross of administrative expenses for financial
reporting
Developing an Investment Return Assumption for use in GASB 67 and 68 Financial Reporting
MASTER PAGE NO. 61

34
Same investment return assumption for both funding and financial reporting that is gross of administrative expenses
Introduce explicit administrative expenses loading of 0.7% of payroll or $5 million annually (allocated 0.55% employer and 0.15% employee)
Option A – Investment Return Assumption for Funding on a Gross of Administrative Expenses Basis
Recommended if Used only for
Funding
Recommended for both Funding and
Financial ReportingAssumed Inflation 3.00% 3.00%Portfolio Real Rate of Return 5.26% 5.26%Assumed Expenses (0.40%) (0.28%)Risk Adjustment (0.36%) (0.48%)Assumed Investment Return 7.50% 7.50%Confidence level 54% 55%
Administrative Expense Load Not Applicable 0.70% of payMASTER PAGE NO. 62

35
“Same” investment return assumption for both funding and financial reporting• Recommended 7.50% return is net of administrative expenses for funding• Recommended 7.50% return is gross of administrative expenses for
financial reporting
Option B – Investment Return Assumption for Funding on a Net of Administrative Expenses Basis
Recommended if Used only for
FundingRecommended for Financial Reporting
Assumed Inflation 3.00% 3.00%Portfolio Real Rate of Return 5.26% 5.26%Assumed Expenses (0.40%) (0.28%)Risk Adjustment (0.36%) (0.48%)Assumed Investment Return 7.50% 7.50%Confidence level 54% 55%
Administrative Expense Load Not Applicable Not ApplicableMASTER PAGE NO. 63

36
Modeled as of June 30, 2014 for illustrationIncrease in Actuarial Accrued Liability ($224 million)Total increase in average employer rate (3.45% of payroll)• Increase in average employer Normal Cost (0.20% of pay)• Increase in average employer UAAL rate (2.70% of pay)• Portion of explicit administrative expense allocated to employer
(0.55% of payroll)• Primarily due to updating the mortality table, changing investment
return assumption and introducing explicit administrative expenseIncrease in average member rate (0.20% of payroll)• Includes explicit administrative expense allocated to member
(0.15% of payroll)Results are before 50/50 Normal sharing for non-PEPRA tiers• 50/50 sharing shifts 0.07% of the cost impact from employer to
member
Anticipated Impact on Valuation Results
MASTER PAGE NO. 64

37
Investment return assumption is based on the asset allocation• Asset allocation results from a balance of risk and return,
reflecting a plan’s tolerance for risk
Asset allocation is NOT based on the earnings assumption!• Earnings assumption is NOT a target, benchmark, hurdle or goal
that the allocation seeks to achieve•Do not set asset allocation to “chase” your current earnings
assumption
Asset Allocation and Earnings Assumption
MASTER PAGE NO. 65

38
Actuarial valuation determines the current or “measured” cost, not the ultimate cost Assumptions and funding methods affect only the timing of
costs
Always remember
C + I = B + EContributions + Investment Income
equalsBenefit Payments + Expenses
MASTER PAGE NO. 66

100 Montgomery Street, Suite 500 San Francisco, CA 94104
Ventura County Employees’ Retirement Association
ACTUARIAL EXPERIENCE STUDY Analysis of Actuarial Experience
During the Period July 1, 2011 through June 30, 2014
COPYRIGHT © 2015 ALL RIGHTS RESERVED MARCH 2015
MASTER PAGE NO. 67

100 Montgomery Street Suite 500 San Francisco, CA 94104-4308 T 415.263.8200 www.segalco.com
Benefits, Compensation and HR Consulting. Member of The Segal Group. Offices throughout the United States and Canada
April 14, 2015 Board of Retirement Ventura County Employees’ Retirement Association 1190 South Victoria Avenue, Suite 200 Ventura, CA 93003-6572 Re: Review of Non-economic Actuarial Assumptions
for the June 30, 2015 Actuarial Valuation
Dear Members of the Board:
We are pleased to submit this report of our review of the actuarial experience of the Ventura County Employees’ Retirement Association. This study utilizes the census data of the last four actuarial valuations to review plan experience during the period from July 1, 2011 through June 30, 2014. The study develops the proposed actuarial assumptions to be used in future actuarial valuations starting with the June 30, 2015 actuarial valuation.
Please note that we have also reviewed the economic assumptions. The economic actuarial assumption recommendations for the June 30, 2015 valuation are provided in a separate report.
We are members of the American Academy of Actuaries and we meet the Qualification Standards of the American Academy of Actuaries to render the actuarial opinion herein.
We look forward to reviewing this report with you and answering any questions you may have. Sincerely, Paul Angelo, FSA, MAAA, FCA, EA Senior Vice President and Actuary
John W. Monroe, ASA, MAAA, EA Vice President and Actuary
AW/bqb
MASTER PAGE NO. 68

TABLE OF CONTENTS Page
I. INTRODUCTION, SUMMARY, AND RECOMMENDATIONS ........................................1
II. BACKGROUND AND METHODOLOGY ...........................................................................4
III. ACTUARIAL ASSUMPTIONS .............................................................................................5
A. ECONOMIC ASSUMPTIONS .........................................................................................5
B. RETIREMENT RATES ....................................................................................................5
C. MORTALITY RATES - HEALTHY .............................................................................15
D. MORTALITY RATES - DISABLED ............................................................................23
E. TERMINATION RATES ................................................................................................28
F. DISABILITY INCIDENCE RATES ..............................................................................36
G. PROMOTIONAL AND MERIT SALARY INCREASES ...........................................41
H. IN-SERVICE REDEMPTIONS .....................................................................................47
I. AVERAGE ENTRY AGE (FOR MEMBER CONTRIBUTIONS) ............................48
IV. COST IMPACT OF ASSUMPTION CHANGES ..............................................................49
APPENDIX A. CURRENT ACTUARIAL ASSUMPTIONS ..................................................51
APPENDIX B. PROPOSED ACTUARIAL ASSUMPTIONS ................................................57
MASTER PAGE NO. 69

-1-
I. INTRODUCTION, SUMMARY, AND RECOMMENDATIONS
To project the cost and liabilities of the pension plan, assumptions are made about all future events that
could affect the amount and timing of the benefits to be paid and the assets to be accumulated. Each year
actual experience is compared against the projected experience, and to the extent there are differences, the
future contribution requirement is adjusted.
If assumptions are modified, contribution requirements are adjusted to take into account a change in the
projected experience in all future years. There is a great difference in both philosophy and cost impact
between recognizing the actuarial deviations as they occur annually and changing the actuarial
assumptions. Taking into account one year’s gains or losses without making a change in the assumptions
means that that year’s experience is treated as temporary and that, over the long run, experience will
return to what was originally assumed. Changing assumptions reflects a basic change in thinking about
the future, and it has a much greater effect on the current contribution requirements than recognizing
gains or losses as they occur.
The use of realistic actuarial assumptions is important in maintaining adequate funding, while paying the
promised benefit amounts to participants already retired and to those near retirement. The actuarial
assumptions used do not determine the “actual cost” of the plan. The actual cost is determined solely by
the benefits and administrative expenses paid out, offset by investment income received. However, it is
desirable to estimate as closely as possible what the actual cost will be so as to permit an orderly method
for setting aside contributions today to provide benefits in the future, and to maintain equity among
generations of participants and taxpayers.
This study was undertaken in order to review the demographic actuarial assumptions and to compare the
actual experience with that expected under the current assumptions during the three-year experience
period from July 1, 2011 through June 30, 2014. The study was performed in accordance with Actuarial
Standard of Practice (ASOP) No. 35, “Selection of Demographic and Other Non-economic Assumptions
for Measuring Pension Obligations” and ASOP No. 27 “Selection of Economic Assumptions for
Measuring Pension Obligations.” These Standards of Practice put forth guidelines for the selection of the
various actuarial assumptions utilized in a pension plan actuarial valuation. Based on the study’s results
and expected future experience, we are recommending various changes in the current actuarial
assumptions.
The economic assumptions are currently reviewed every three years at the same time as the non-economic
assumptions. See the “Review of Economic Actuarial Assumptions for the June 30, 2015 Actuarial
Valuation” that is provided in a separate report.
MASTER PAGE NO. 70

-2-
In this report we are recommending changes in the assumptions for retirement from active employment,
percent married at retirement, average entry age for active members, average retirement age for deferred
vested members, percent of members assumed to go on to work for a reciprocal system, reciprocal salary
increases, pre-retirement mortality, healthy life post-retirement mortality, disabled life post-retirement
mortality, turnover, disability (ordinary and duty), promotional and merit salary increases, and in-service
redemptions.
Our recommendations for the major actuarial assumption categories are as follows:
Retirement Rates – The probability of retirement at each age at which participants are eligible to
retire.
Recommendation: Adjust the current retirement rates to those developed in Section III(B).
Both General and Safety members are assumed to retire at slightly later ages.
Mortality Rates – The probability of dying at each age. Mortality rates are used to project life
expectancies.
Recommendation: Decrease pre- and post-retirement mortality rates for non-disabled General
and Safety members as developed in Section III(C). Increase mortality rates for disabled Safety
members and decrease mortality rates for disabled General members as developed in Section
III(D).
Termination Rates – The probability of leaving employment at each age and receiving either a
refund of contributions or a deferred vested retirement benefit.
Recommendation: Change the termination rates for both General and Safety members to those
developed in Section III(E). Overall, the termination rates have been decreased. In addition,
maintain the assumption that a member will choose between a refund of contributions and a
deferred vested benefit based on which option is more valuable.
Disability Incidence Rates – The probability of becoming disabled at each age.
Recommendation: Decrease the current disability rates for General and Safety members to
those developed in Section III(F).
Individual Salary Increases – Increases in the salary of a member between the date of the
valuation to the date of separation from active service.
Recommendation: Change the promotional and merit increases to those developed in Section
III(G). In general, future promotional and merit salary increases are slightly higher under the
new assumptions. Overall, salary increase are slightly lower for both General and Safety
members due to the lower price inflation assumption (as recommended in our separate review
of economic assumptions).
Ref: Pg. 36
Ref: Pg. 15 Pg. 23
Ref: Pg. 28
Ref: Pg. 5
Ref: Pg. 41
MASTER PAGE NO. 71

-3-
In-Service Redemptions – Additional pay elements that are expected to be received during the
member’s final average earnings period.
Recommendation: Decrease the current in-service redemption assumptions for non-PEPRA
General Tier 1 and non-PEPRA Safety to those developed in Section III(H).
Average Entry Age (for member contributions) – Used for determining contribution rates for
members hired after November 1974.
Recommendation: Decrease the current average entry age assumption for General members
and maintain the current average entry age assumption for Safety members as developed in
Section III(I).
We have estimated the impact of proposed assumption changes as if they were applied to the
June 30, 2014 actuarial valuation. Please note that the rates shown below do not reflect the 50/50 sharing
of Normal Cost for non-PEPRA Tiers. If all of the proposed demographic assumption changes were
implemented, the average employer rate would have increased by 1.57% of compensation. The average
member rate would have increased by 0.05% of compensation. Of the various demographic assumption
changes, the most significant cost impact is from the mortality assumption change.
If all of the proposed economic assumptions (recommended in a separate report) were implemented
(including the proposed change to an explicit administrative expense load), the average employer rate
would have increased by 1.88% of compensation and the average member rate would have been increased
by 0.15%. Of the various economic assumption changes, the most significant cost impact is from the
investment return assumption change from 7.75% net of administrative expenses to 7.50% gross of
administrative expenses.
Therefore, the estimated cost impact of all proposed assumption changes (both demographic and
economic) is 3.45% of compensation for the average employer rate, where the Normal Cost rate increased
by 0.20%, the UAAL amortization rate increased by 2.70% and the explicit administrative expense load is
0.55%. The average member rate would have increased by 0.20% of compensation, including the explicit
administrative load of 0.15%. The allocation of the explicit administrative expense load between
employers and members is discussed in the economic assumptions report.
Section II provides some background on basic principles and the methodology used for the experience
study and for the review of the demographic actuarial assumptions. A detailed discussion of each
assumption and reasons for the proposed changes is found in Section III. Section IV shows the cost
impact of the proposed assumption changes.
Ref: Pg. 47
Ref: Pg. 48
MASTER PAGE NO. 72

-4-
II. BACKGROUND AND METHODOLOGY
In this report, we analyzed the “demographic” or “non-economic” assumptions only. Our analysis of the
“economic” assumptions for the June 30, 2015 valuation is provided in a separate report. Demographic
assumptions include the probabilities of certain events occurring in the population of members, referred to
as “decrements,” e.g., termination from service, disability retirement, service retirement, and death after
retirement. We also review the individual salary increases net of inflation (i.e., the promotional and merit
assumptions) in this report.
Demographic Assumptions
In order to determine the probability of an event occurring, we examine the “decrements” and
“exposures” of that event. For example, taking termination from service, we compare the number of
employees who actually terminate in a certain age and/or service category (i.e., the number of
“decrements”) with those “who could have terminated” (i.e., the number of “exposures”). For example, if
there were 500 active employees in the 20-24 age group at the beginning of the year and 50 of them
terminate during the year, we would say the probability of termination in that age group is 50 ÷ 500 or
10%.
The reliability of the resulting probability is highly dependent on both the number of decrements and the
number of exposures. For example, if there are only a few people in a high age category at the beginning
of the year (number of exposures), we would not lend as much credibility to the probability of termination
developed for that age category, especially if it is out of line with the pattern shown for the other age
groups. Similarly, if we are considering the death decrement, there may be a large number of exposures
in, say, the age 20-24 category, but very few decrements (actual deaths); therefore, we would not be able
to rely heavily on the probability developed for that category.
One reason we use several years of experience for such a study is to have more exposures and
decrements, and therefore more statistical reliability. Another reason for using several years of data is to
smooth out fluctuations that may occur from one year to the next. However, we also calculate the rates on
a year-to-year basis to check for any trend that may be developing in the later years.
MASTER PAGE NO. 73

-5-
III. ACTUARIAL ASSUMPTIONS
A. ECONOMIC ASSUMPTIONS
The economic assumptions are currently reviewed every three years at the same time as the non-economic
assumptions. See the separate reported titled “Review of Economic Actuarial Assumptions for the
June 30, 2015 Actuarial Valuation”.
B. RETIREMENT RATES
The age at which a member retires from service (i.e., who did not retire on a disability pension) will affect
both the amount of the benefits that will be paid to that member as well as the period over which funding
must take place.
The table on the following page shows the observed service retirement rates for non-PEPRA General
members based on the actual experience over the past three years. The observed service retirement rates
were determined by comparing those members who actually retired from service to those eligible to retire
from service. This same methodology is followed throughout this report and was described in Section II.
Also shown are the current assumed rates and the rates we propose:
MASTER PAGE NO. 74

-6-
Non-PEPRA General Tiers
Age Current Rate of
Retirement Actual Rate of
Retirement Proposed Rate of
Retirement Under 50 0.00% 66.67% 0.00%
50 3.00 2.46 2.50 51 3.00 1.93 2.50 52 4.00 1.94 3.00 53 4.00 3.49 3.50 54 6.00 3.38 4.00 55 6.00 4.02 4.50 56 7.00 3.17 5.00 57 8.00 4.44 6.00 58 10.00 6.34 8.00 59 10.00 6.21 8.00 60 14.00 10.06 12.00 61 18.00 11.76 15.00 62 22.00 23.77 22.00 63 20.00 18.33 20.00 64 25.00 19.14 22.00 65 35.00 27.97 30.00 66 35.00 34.58 35.00 67 35.00 23.44 35.00 68 25.00 51.06 35.00 69 20.00 29.41 20.00 70 20.00 27.27 20.00 71 20.00 14.71 20.00 72 20.00 13.64 20.00 73 20.00 7.14 20.00 74 40.00 0.00 30.00
75 & Over 100.00 16.00 100.00
As shown above, we are recommending decreases in most of the retirement rates for non-PEPRA General
members.
Chart 1 that follows later in this section compares actual experience with the current and proposed rates of
retirement for non-PEPRA General members.
MASTER PAGE NO. 75

-7-
The following table shows the observed retirement rates for non-PEPRA Safety members over the past
three years. Also shown are the current assumed rates and the rates we propose:
Non-PEPRA Safety Tiers
Age Current Rate of
Retirement Actual Rate of
Retirement Proposed Rate of
Retirement Under 40 0.00% 0.00% 0.00%
40 1.00 50.00 1.00 41 1.00 0.00 1.00 42 1.00 4.00 1.00 43 1.00 2.86 1.00 44 1.00 0.00 1.00 45 1.00 0.00 1.00 46 1.00 0.00 1.00 47 1.00 0.00 1.00 48 1.00 0.00 1.00 49 1.00 2.56 1.50 50 2.00 3.36 2.50 51 2.00 1.64 2.00 52 4.00 1.61 3.00 53 6.00 1.92 4.00 54 18.00 16.35 17.00 55 25.00 16.84 22.00 56 20.00 25.00 22.00 57 20.00 21.28 20.00 58 18.00 21.88 19.00 59 25.00 19.35 22.00 60 25.00 18.18 22.00 61 30.00 21.43 25.00 62 40.00 36.36 35.00 63 50.00 16.67 40.00 64 50.00 14.29 40.00
65 & Over 100.00 100.00 100.00
Overall, we are recommending decreases in the retirement rates for non-PEPRA Safety members.
Chart 2 compares actual experience with the current and proposed rates for non-PEPRA Safety members.
Note that effective January 1, 2013, new PEPRA formulas were implemented for PEPRA General and
PEPRA Safety Tiers. For these new tiers we do not have any experience from the past three years to
propose new rates based on actual retirements from members of those tiers. However, we have
recommended changes to the retirement assumptions at some ages for PEPRA members based on our
recommended assumptions for non-PEPRA members.
MASTER PAGE NO. 76

-8-
The following are the current and proposed rates of retirement for PEPRA General and Safety members:
General and Safety PEPRA Tiers
Age Current
General PEPRA Tiers Proposed
General PEPRA Tiers Current
Safety PEPRA Tiers Proposed
Safety PEPRA Tiers 50 0.00% 0.00% 4.00% 5.00% 51 0.00 0.00 2.00 2.00 52 2.00 2.00 5.00 4.00 53 2.00 2.00 8.00 6.00 54 3.00 2.50 18.00 16.00 55 5.00 4.00 20.00 20.00 56 5.00 4.50 20.00 20.00 57 6.00 5.00 18.00 18.00 58 7.00 6.00 18.00 18.00 59 8.00 7.00 30.00 25.00 60 10.00 9.00 30.00 25.00 61 12.50 11.00 30.00 25.00 62 20.00 20.00 50.00 40.00 63 20.00 20.00 50.00 40.00 64 20.00 18.00 50.00 40.00 65 25.00 20.00 100.00 100.00 66 30.00 30.00 100.00 100.00 67 30.00 30.00 100.00 100.00 68 30.00 30.00 100.00 100.00 69 30.00 30.00 100.00 100.00 70 50.00 50.00 100.00 100.00 71 50.00 50.00 100.00 100.00 72 50.00 50.00 100.00 100.00 73 50.00 50.00 100.00 100.00 74 50.00 50.00 100.00 100.00
75 & Over 100.00 100.00 100.00 100.00
Chart 3 compares the current rates with the proposed rates of retirement for PEPRA General members.
Chart 4 compares the current rates with the proposed rates of retirement for PEPRA Safety members.
MASTER PAGE NO. 77

-9-
Deferred Vested Members
In prior valuations, deferred vested General and Safety members were assumed to retire at age 58 and 54,
respectively. The average age at retirement over the prior three years was 59 for General and 54 for
Safety. We recommend increasing the General assumption to age 59 and maintaining the Safety
assumption at age 54.
Reciprocity
It was also assumed that 50% of inactive General and 65% of inactive Safety deferred vested participants
would be covered under a reciprocal retirement system and receive 4.50% annual salary increases from
termination until their date of retirement. As of June 30, 2014, about 52% of the total General deferred
vested members and 63% of the total Safety deferred vested members have gone on to be covered by a
reciprocal retirement system. As a result, we recommend maintaining the reciprocal assumption at 50%
for General members and decreasing the assumption to 60% for Safety members. This recommendation
takes into account the experience of all deferred vested members as of June 30, 2014 instead of just new
deferred vested members during the three-year period. This is because there is a lag between a member’s
date of termination and the time that it is known if they have reciprocity with a reciprocal retirement
system.
Based on our recommended salary increase assumptions, we propose that the current 4.50% annual salary
increase assumption for reciprocal members be reduced from 4.50% to 4.00% to anticipate salary
increases from termination from VCERA to the expected date of retirement.
Survivor Continuance Under Unmodified Option
In prior valuations, it was assumed that 70% of all active male members and 50% of all active female
members would be married or have an eligible domestic partner when they retired. We reviewed
experience for new retirees during the three-year period and determined the actual percentage of these
new retirees that had an eligible spouse or eligible domestic partner at the time of retirement. The results
of that analysis are shown below.
New Retirees – Actual Percent with Eligible Spouse or Domestic Partner
Year Ending June 30
Male
Female
2012 71% 55% 2013 64% 52% 2014 53% 58% Total 63% 55%
MASTER PAGE NO. 78

-10-
According to experience of members who retired during the last three years, about 63% of all male
members and 55% of all female members were married or had a domestic partner at retirement. However,
we note that the 2014 percentage for males of 53% appears to be unusually low. We recommend
maintaining the assumption at 70% for male members and increasing the assumption to 55% for female
members.
Since the value of the survivor’s benefit is dependent on the survivor’s age and sex, we must also have
assumptions for the age and sex of the survivor. Based on the experience during the three-year period and
studies done for other retirement systems, we believe that it is reasonable to continue to assume a three-
year age difference for the survivors age as compared to the member’s age.
Since the majority of survivors are expected to be of the opposite sex, even with the inclusion of domestic
partners, we will continue to assume that the survivor’s sex is the opposite of the member.
The proposed assumption for the age of the survivor and recommended assumption are shown below.
These assumptions will continue to be monitored in future experience studies.
Survivor Ages – Current Assumptions
Survivor’s Age as Compared to Member’s Age
Beneficiary Sex Current
Assumption Recommended
Assumption
Male 3 years older No change
Female 3 years younger No change
MASTER PAGE NO. 79

-11-
Cha
rt 1
R
etire
men
t Rat
es -
Non
-PEP
RA
Gen
eral
Mem
bers
0%5%10%
15%
20%
25%
30%
35%
40%
45%
50%
55%
5051
5253
5455
5657
5859
6061
6263
6465
6667
6869
7071
7273
74
Age
Cur
rent
Actu
alPr
opos
ed
MASTER PAGE NO. 80

-12-
Cha
rt 2
R
etire
men
t Rat
es -
Non
-PEP
RA
Safe
ty M
embe
rs
0%5%10%
15%
20%
25%
30%
35%
40%
45%
50%
4041
4243
4445
4647
4849
5051
5253
5455
5657
5859
6061
6263
64
Age
Cur
rent
Actu
alPr
opos
ed
MASTER PAGE NO. 81

-13-
0%5%10%
15%
20%
25%
30%
35%
40%
45%
50%
5253
5455
5657
5859
6061
6263
6465
6667
6869
7071
7273
74
Age
Cha
rt 3
R
etire
men
t Rat
es -
PEPR
A G
ener
al M
embe
rs
Cur
rent
Prop
osed
MASTER PAGE NO. 82

-14-
0%5%10%
15%
20%
25%
30%
35%
40%
45%
50%
5051
5253
5455
5657
5859
6061
6263
64Ag
e
Cha
rt 4
R
etire
men
t Rat
es -
PEPR
A Sa
fety
Mem
bers
Cur
rent
Prop
osed
MASTER PAGE NO. 83

-15-
C. MORTALITY RATES - HEALTHY
The “healthy” mortality rates project what proportion of members will die before retirement as well as the
life expectancy of a member who retires from service (i.e., who did not retire on a disability pension). The
table currently being used for both General and Safety post-service retirement mortality rates is the RP-
2000 Combined Healthy Mortality Table (separate tables for males and females) projected with Scale AA
to 2025 with ages set back one year. Beneficiaries are assumed to have the same mortality of a General
member of the opposite sex who has taken a service (non-disability) retirement.
Recent changes to ASOP 35 have increased the actuary’s responsibility to reflect and to disclose an
allowance for future mortality improvement in this assumption. Ways to reflect anticipated future
mortality improvement include:
Age adjustments – A standard table is used without projection but with age adjustments (“set back”
or “set forward”) chosen as to forecast fewer deaths than the current experience level, thus
implicitly allowing for future mortality improvement.
Projection to a future year – The same mortality table is used for future years, but that table is
intended to be reflective of mortality at some particular future year, not as of the current year.
Generational mortality – Each future year has its own mortality table that reflects the forecasted
improvements. In effect, this means that younger participants have more future mortality
improvement built in than older participants do.
Historically, we have used age adjustments, but in the previous study we also included a projection to a
future year when setting mortality assumptions for VCERA. In particular, the RP-2000 Combined
Healthy Mortality Table was projected to the year 2025 and then we applied an age adjustment similar to
the one described in the first bullet so that actual deaths would be at least 10% greater than those
assumed.
Pre-Retirement Mortality
The number of deaths among active and deferred vested members is not large enough to provide a
statistically credible basis for a specific pre-retirement mortality analysis. Therefore, we continue to
propose that pre-retirement mortality follow the same tables used for post-retirement mortality. In
addition, based on experience from the last three years of 23 total deaths, none were due to service
connected (duty) causes. For that reason, we recommend maintaining the current assumption that all pre-
retirement deaths are assumed to be ordinary (non-duty) based on recent data.
MASTER PAGE NO. 84

-16-
Post-Retirement Mortality (Service Retirements)
Our analysis starts with a table that shows among all service retired members, the actual deaths compared
to the expected deaths under the current assumptions for the last three years. We also show the deaths
under proposed assumptions based on using a methodology generally consistent with prior years. As
noted above, in prior years we have generally set the mortality assumption so that actual deaths will be at
least 10% greater than those assumed. We are recommending continuation of that methodology in this
experience study. However, as discussed later in this section, the Board should be aware that a future
recommendation may include the use of a generational mortality table.
General – Healthy Safety – Healthy
Current Expected Deaths
Actual Deaths
Proposed Expected Deaths
Current Expected Deaths
Actual Deaths
Proposed Expected Deaths
Male 106 95 86 21 15 15 Female 131 143 124 1 1 1 Total 237 238 210 22 16 16
Actual / Expected 100% 113% 73% 100%
Chart 5 compares actual to expected deaths for General members under the current and proposed
assumptions over the last three years. Experience shows that there was one more death than predicted by
the current table.
Chart 6 has the same comparison for Safety members. Experience shows that there were fewer deaths
than predicted by the current table.
For General service retirees the ratio of actual to expected deaths was 100%. We recommend changing
the current table to the RP-2000 Combined Healthy Mortality Table (separate tables for males and
females) projected with Scale BB to 2035 with ages set back one year for males and set forward one year
for females. This will bring the actual to expected ratio to 113%. This is consistent with ASOP 35 as we
are continuing to include about a 10% margin in the rates to anticipate expected future improvement in
life expectancy.
For Safety service retirees the ratio of actual to expected deaths was 73%. We recommend changing the
current table to the RP-2000 Combined Healthy Mortality Table (separate tables for males and females)
projected with Scale BB to 2035 with ages set back three years for both males and females. This will
bring the actual to expected ratio to 100%. The aggregate actual to expected ratio is 112% when
combining with General members. We will continue to closely monitor this assumption in future studies.
MASTER PAGE NO. 85

-17-
Chart 7 shows the life expectancies (i.e., expected future lifetime) under the current and the proposed
tables for General members.
Chart 8 shows the same information for Safety members.
As mentioned earlier, we want to make the Board aware that a future recommendation might be for the
use of a generational mortality table. While the use of generational mortality tables is under considerable
discussion as an emerging practice within the actuarial profession, to date it is still uncommon for public
sector retirement plans to actually use a generational mortality table. However, we anticipate that actuarial
practice will continue to move in this direction, for reasons we will now discuss.
A generational mortality table provides dynamic projections of mortality experience for each cohort of
retirees. For example, the mortality rate for someone who is 65 next year will be slightly less than for
someone who is 65 this year. In general, using generational mortality anticipates increases in the cost of
the Plan over time as participants’ life expectancies are projected to increase. This is in contrast to
updating a static mortality assumption with each experience study as we have proposed in this and prior
experience studies.
Using generational mortality rather than static mortality incorporates a more explicit assumption for
future mortality improvement. Accordingly, the goal is to start with a mortality table that closely matches
the current experience (without a margin for future mortality improvement), and then reflect mortality
improvement by projecting lower mortality rates in future years. That is why, for an illustrative
generational mortality table that we developed for the Plan, the current actual to expected ratio shown in
the tables below is only around 100%. In future years these ratios would remain around 100%, as long as
actual mortality improved at the same rates as anticipated in the generational mortality tables.
General – Healthy Safety – Healthy
Expected Deaths
Actual Deaths
Proposed Expected Deaths*
Expected Deaths
Actual Deaths
Proposed Expected Deaths**
Male 106 95 93 21 15 16 Female 131 143 143 1 1 1 Total 237 238 236 22 16 17
Actual / Expected 100% 101% 73% 94%
* For illustration purposes only and shown for the RP-2000 Combined Healthy Mortality Table projected to 2013 (middle year of the experience study period) with Scale BB, with age set back three years for males and no age set back for females.
** For illustration purposes only and shown for the RP-2000 Combined Healthy Mortality Table projected to 2013 (middle year of the experience study period) with Scale BB, with ages set back five years for males and females.
MASTER PAGE NO. 86

-18-
Note that using generational mortality increases current liabilities and costs more than using static
mortality but should result in fewer changes (and cost increases) in later years. For example, the
generational mortality table developed above would increase the total (employer and member)
contribution rate by about 1.5% of compensation more than the updated static table that we are
recommending.1
Note that there are currently unresolved issues regarding how generational mortality tables would be used
in determining member contribution rates, optional forms of payments and reserve values. These issues
would need to be addressed for VCERA before using a generational mortality table.
Mortality Table for Member Contributions
We recommend that the mortality table used for determining contributions for General members be
changed from RP-2000 Combined Healthy Mortality Table projected with Scale AA to 2025 set back one
year weighted 35% male and 65% female to the RP-2000 Combined Healthy Mortality Table projected
with Scale BB to 2035 set back one year for males and set forward one year for females weighted one-
third male and two-third female. This is based on the proposed valuation mortality table for General
members and the actual sex distribution of General members.
For Safety members, we recommend the mortality table be changed from the RP-2000 Combined Healthy
Mortality Table projected with Scale AA to 2025 set back one year weighted 80% male and 20% female
to the RP-2000 Combined Healthy Mortality Table projected with Scale BB to 2035 set back three years
weighted 80% male and 20% female. This is based on the proposed valuation mortality table for Safety
members and the actual sex distribution of Safety members.
1 These cost increases reflect the hypothetical adoption of generational mortality for both healthy and disabled retirees.
MASTER PAGE NO. 87

-19-
106
9586
131
143
124
237
238
210
050100
150
200
250
Mal
eFe
mal
eTo
tal
Cha
rt 5
Post
- R
etire
men
t Dea
ths
Non
- D
isab
led
Gen
eral
Mem
bers
Expe
cted
- C
urre
ntAc
tual
Ex
pect
ed -
Prop
osed
MASTER PAGE NO. 88

-20-
21
1515
11
1
22
1616
0510152025
Mal
eFe
mal
eTo
tal
Cha
rt 6
Post
- R
etire
men
t Dea
ths
Non
- D
isab
led
Safe
ty M
embe
rs
Expe
cted
- C
urre
ntAc
tual
Expe
cted
- Pr
opos
ed
MASTER PAGE NO. 89

-21-
Cha
rt 7
Li
fe E
xpec
tanc
ies
Non
- D
isab
led
Gen
eral
Mem
bers
010203040506070
20-2
425
-29
30-3
435
-39
40-4
445
-49
50-5
455
-59
60-6
465
-69
70-7
475
-79
80-8
485
-89
90-9
495
-99
Age
Cur
rent
(Mal
e)Pr
opos
ed (M
ale)
Cur
rent
(Fem
ale)
Prop
osed
(Fem
ale)
MASTER PAGE NO. 90

-22-
Cha
rt 8
Li
fe E
xpec
tanc
ies
Non
- D
isab
led
Safe
ty M
embe
rs
01020304050607080
20-2
425
-29
30-3
435
-39
40-4
445
-49
50-5
455
-59
60-6
465
-69
70-7
475
-79
80-8
485
-89
90-9
495
-99
Age
Cur
rent
(Mal
e)Pr
opos
ed (M
ale)
Cur
rent
(Fem
ale)
Prop
osed
(Fem
ale)
MASTER PAGE NO. 91

-23-
D. MORTALITY RATES - DISABLED
Since mortality rates for disabled members can vary from those of healthy members, a different mortality
assumption is often used. For General members, the table currently being used is the RP-2000 Combined
Healthy Mortality Table (separate tables for males and females) projected with Scale AA to 2025 with
ages set forward five years for males and seven years for females. For Safety members, the table currently
being used is the RP-2000 Combined Healthy Mortality Table (separate tables for males and females)
projected with Scale AA to 2025 with ages set back one year for both males and females.
The number of actual deaths compared to the number expected for the last three years has been as
follows:
General – Disabled Safety – Disabled
Current Expected Deaths
Actual Deaths
Proposed Expected Deaths
Current Expected Deaths
Actual Deaths
Proposed Expected Deaths
Male 17 17 16 13 19 15 Female 26 26 23 1 1 1 Total 43 43 39 14 20 16
Actual / Expected 100% 110% 143% 125%
Based on this experience, we recommend that the mortality table for General members be changed to the
RP-2000 Combined Healthy Mortality Table (separate tables for males and females) projected with Scale
BB to 2035 with ages set forward six years for males and set forward eight years for females. We
recommend that the mortality table for Safety members be changed to the RP-2000 Combined Table
(separate tables for males and females) projected with Scale BB to 2035 with ages set forward two years.
Chart 9 compares actual to expected deaths under both the current and proposed assumptions for disabled
General members over the last three years. Experience shows that there were exactly the same number of
deaths as predicted by the current table. Our recommendation for General members incorporates a margin
for future mortality improvement.
Chart 10 has the same comparison for Safety members. Although experience shows that there were more
deaths than predicted by the current table, our recommendation for Safety members still incorporates a
reduced but sufficient margin for future mortality improvement.
Chart 11 shows the life expectancies under both the current and proposed tables for General members.
Chart 12 shows the same information for Safety members.
MASTER PAGE NO. 92

-24-
1717
16
2626
23
4343
39
051015202530354045
Mal
eFe
mal
eTo
tal
Cha
rt 9
Post
- R
etire
men
t Dea
ths
Dis
able
d G
ener
al M
embe
rs
Expe
cted
- C
urre
ntAc
tual
Ex
pect
ed -
Prop
osed
MASTER PAGE NO. 93

-25-
13
19
15
11
1
14
20
16
02468101214161820
Mal
eFe
mal
eTo
tal
Cha
rt 1
0Po
st -
Ret
irem
ent D
eath
sD
isab
led
Safe
ty M
embe
rs
Expe
cted
- C
urre
ntAc
tual
Ex
pect
ed -
Prop
osed
MASTER PAGE NO. 94

-26-
Cha
rt 1
1
Li
fe E
xpec
tanc
ies
Dis
able
d G
ener
al M
embe
rs
0102030405060
20-2
425
-29
30-3
435
-39
40-4
445
-49
50-5
455
-59
60-6
465
-69
70-7
475
-79
80-8
485
-89
90-9
495
-99
Age
Cur
rent
(Mal
e)Pr
opos
ed (M
ale)
Cur
rent
(Fem
ale)
Prop
osed
(Fem
ale)
MASTER PAGE NO. 95

-27-
Cha
rt 1
2
Li
fe E
xpec
tanc
ies
Dis
able
d Sa
fety
Mem
bers
010203040506070
20-2
425
-29
30-3
435
-39
40-4
445
-49
50-5
455
-59
60-6
465
-69
70-7
475
-79
80-8
485
-89
90-9
495
-99
Age
Cur
rent
(Mal
e)Pr
opos
ed (M
ale)
Cur
rent
(Fem
ale)
Prop
osed
(Fem
ale)
MASTER PAGE NO. 96

-28-
E. TERMINATION RATES
Termination rates include all terminations for reasons other than death, disability, or retirement. Under the
current assumptions there is an overall incidence of termination assumed, combined with an assumption
that a member will choose between a refund of contributions and a deferred vested benefit based on
which option is more valuable. With this study, we continue to recommend that this same assumption
structure be used.
Currently, the assumed termination rates are a function of a member’s age for members with five or more
years of service. Our experience review analyzed terminations both as a function of age and as a function
of years of service. Our review found that while termination rates correlate with both years of service and
age, we believe there is a stronger correlation with years of service. This is consistent with our experience
from other systems.
As a result of this review, we recommend that the termination rate assumption be structured solely as a
function of years of service.
The termination experience over the last three years for General and Safety members is shown by years of
service in the following tables. Please note that we have excluded any members that were eligible for
retirement. We also show the current and proposed assumptions.
MASTER PAGE NO. 97

-29-
Rates of Termination (General) Years of Service Current Rate* Observed Rate Proposed Rate
Less than 1 15.00% 12.80% 14.00%
1 10.00 9.81 10.00
2 8.00 8.20 8.00
3 7.00 6.16 7.00
4 6.00 6.15 6.00
5 3.56 4.32 4.00
6 3.38 2.76 3.75
7 3.21 4.03 3.50
8 3.07 2.44 3.50
9 3.30 2.28 3.25
10 3.75 3.68 3.25
11 3.65 2.66 3.00
12 3.55 3.21 3.00
13 3.49 1.82 2.75
14 3.38 2.53 2.75
15 3.22 2.89 2.50
16 3.17 3.07 2.50
17 2.99 1.31 2.25
18 2.93 0.76 2.00
19 2.81 0.85 2.00
20 or more 2.71 4.41 2.00
* The rate shown for five or more years of service is an average rate developed from the current age based assumption for members in that service category.
MASTER PAGE NO. 98
-30-
Rates of Termination (Safety) Years of Service Current Rate* Observed Rate Proposed Rate
Less than 1 12.00% 3.42% 10.00%
1 6.00 6.90 6.00
2 5.50 4.83 5.50
3 5.00 4.92 5.00
4 4.00 3.56 4.00
5 2.79 2.61 2.75
6 2.62 1.98 2.50
7 2.48 1.32 2.00
8 2.08 1.47 1.80
9 1.98 0.79 1.60
10 1.81 0.59 1.40
11 1.67 0.61 1.20
12 1.54 0.88 1.00
13 1.42 1.10 0.95
14 1.27 0.61 0.90
15 1.21 0.00 0.85
16 1.11 0.69 0.80
17 1.01 0.00 0.75
18 0.91 0.88 0.70
19 0.92 0.00 0.65
20 or more 0.54 100.00 0.60
* The rate shown for or more five years of service is an average rate developed from the current age based assumption for members in that service category.
MASTER PAGE NO. 99

-31-
It is important to note that not every service category has enough exposures and/or decrements such that
the results in that category are statistically credible. This is mainly the case at the highest service
categories since most members in those categories are eligible to retire and so have been excluded from
our review of this experience. It is also the case in the tables that follow due to the even more limited
experience regarding actual terminations.
Chart 13 compares actual to expected terminations over the past three years for both the current and
proposed assumptions for General members.
Chart 14 graphs the same information as Chart 13, but for Safety members.
Chart 15 shows the actual termination rates over the past three years compared to the current and
proposed assumptions for General members.
Chart 16 shows the same information as Chart 15, but for Safety members.
Based upon the recent experience, the termination rates for General members have been increased for
those with 5 to 8 years of service and decreased for all other years of service categories. For Safety, we
have decreased the termination rates at most years of service categories. Overall, for both General and
Safety members, the proposed termination rates are lower than those under the current assumptions.
It is our understanding that General Tier 2 COLA members can elect a refund of all or a portion of their
Tier 2 COLA member contributions and forgo the Tier 2 COLA upon retirement. Based on the data,
about 97% of General Tier 2 COLA retirees during the three-experience period are receiving a COLA on
their Tier 2 benefits. We will continue to assume that all members retiring with the Tier 2 COLA will
elect to have the COLA applied to their benefit.
We will also continue to assume that termination rates are zero at any age where members are assumed to
retire. In other words, at those ages, members will either retire in accordance with the retirement rate
assumptions or continue working, rather than terminate and defer their benefit.
MASTER PAGE NO. 100

-32-
`
285
227
279
273
267
267
276
286
270
834
780
816
0
100
200
300
400
500
600
700
800
900
2012
2013
2014
Tota
lYe
ar e
nded
Jun
e 30
,
Cha
rt 1
3A
ctua
l Num
ber o
f Ter
min
atio
ns C
ompa
red
to E
xpec
ted
- Gen
eral
Mem
bers
Expe
cted
- C
urre
nt
Actu
alEx
pect
ed -
Prop
osed
MASTER PAGE NO. 101

-33-
3326
2830
2526
32
1828
95
6982
0102030405060708090100
2012
2013
2014
Tota
lYe
ar e
nded
Jun
e 30
,
Cha
rt 1
4A
ctua
l Num
ber o
f Ter
min
atio
ns C
ompa
red
to E
xpec
ted
- Saf
ety
mem
bers
Expe
cted
- C
urre
nt
Actu
alEx
pect
ed -
Prop
osed
MASTER PAGE NO. 102

-34-
0%2%4%6%8%10%
12%
14%
16%
01
23
45
67
89
1011
1213
1415
1617
1819
20
Year
s of
Ser
vice
Cha
rt 1
5
Term
inat
ion
Rat
es -
Gen
eral
Mem
bers
Cur
rent
Act
ual
Prop
osed
MASTER PAGE NO. 103

-35-
0%2%4%6%8%10%
12%
14%
01
23
45
67
89
1011
1213
1415
1617
1819
20
Year
s of
Ser
vice
Cha
rt 1
6
Term
inat
ion
Rat
es -
Safe
ty M
embe
rs
Cur
rent
Act
ual
Prop
osed
MASTER PAGE NO. 104

-36-
F. DISABILITY INCIDENCE RATES
When a member becomes disabled, he or she may be entitled to at least a 50% pension (service connected
disability), or a pension that depends upon the member’s years of service (non-service connected
disability). The following summarizes the actual incidence of combined service and non-service
connected disabilities over the past three years compared to the current and proposed assumptions for
both service connected and non-service connected disability incidence:
Rates of Disability Incidence (General) Age Current Rate* Observed Rate Proposed Rate
20 – 24 0.01% 0.00% 0.01% 25 – 29 0.02 0.00 0.02 30 – 34 0.05 0.00 0.05 35 – 39 0.10 0.05 0.10 40 – 44 0.15 0.12 0.15 45 – 49 0.25 0.26 0.25 50 – 54 0.50 0.22 0.35 55 – 59 0.60 0.25 0.45 60 – 64 0.75 0.50 0.60 65 – 69 1.00 0.18 0.75 70 – 74 1.00 0.80 1.00
* Total current rate for duty and non-duty disabilities.
Rates of Disability Incidence (Safety) Age Current Rate* Observed Rate Proposed Rate
20 – 24 0.05% 0.00% 0.05% 25 – 29 0.20 0.00 0.15 30 – 34 0.30 0.29 0.30 35 – 39 0.60 0.13 0.40 40 – 44 1.10 0.23 0.70 45 – 49 1.20 0.90 1.00 50 – 54 2.50 0.51 1.80 55 – 59 4.00 3.51 3.60 60 – 64 5.00 7.89 6.00
* Total current rate for duty and non-duty disabilities.
MASTER PAGE NO. 105

-37-
Chart 17 compares the actual number of duty and ordinary disabilities over the past three years to that
expected under both the current and proposed assumptions. The proposed disability rates were adjusted to
reflect the past three years experience. Overall, there are decreases in the rates proposed for both General
and Safety members.
Chart 18 shows actual disability incidence rates, compared to the assumed and proposed rates for General
members. Since 25% of disabled General members received a duty disability, we recommend reducing
the current assumption from 40% to 35% of disabilities being entitled to a duty disability retirement. The
remaining 65% of disabled General members are assumed to receive an ordinary disability retirement.
Chart 19 graphs the same information as Charts 18, but for Safety members. Since 97% of disabled Safety
members received a duty disability, we recommend maintaining the current assumption that 90% of
disabilities will receive a duty disability retirement. This recommendation is based partially on the fact
that 79% of Safety members received a duty disability in the prior experience study period. The
remaining 10% of disabled Safety members are assumed to receive an ordinary disability retirement.
MASTER PAGE NO. 106

-38-
67
36
5456
3145
123
67
99
020406080100
120
140
Gen
eral
Safe
tyTo
tal
3-Ye
ar T
otal
s (B
oth
Serv
ice
and
Non
-Ser
vice
Con
nect
ed)
Cha
rt 1
7Ac
tual
Num
ber o
f Dis
abili
ties
Com
pare
d to
Exp
ecte
d
Expe
cted
Actu
alPr
opos
ed
MASTER PAGE NO. 107

-39-
Cha
rt 1
8
D
isab
ility
Inci
denc
e R
ates
for G
ener
al M
embe
rs
0.0%
0.1%
0.2%
0.3%
0.4%
0.5%
0.6%
0.7%
0.8%
0.9%
1.0%
1.1%
20-2
425
-29
30-3
435
-39
40-4
445
-49
50-5
455
-59
60-6
465
-69
70-7
4
Age
Cur
rent
Actu
alPr
opos
ed
MASTER PAGE NO. 108

-40-
Cha
rt 1
9
D
isab
ility
Inci
denc
e R
ates
for S
afet
y M
embe
rs
0.0%
1.0%
2.0%
3.0%
4.0%
5.0%
6.0%
7.0%
8.0%
9.0%
20-2
425
-29
30-3
435
-39
40-4
445
-49
50-5
455
-59
60-6
4
Age
Cur
rent
Actu
alPr
opos
ed
MASTER PAGE NO. 109

-41-
G. PROMOTIONAL AND MERIT SALARY INCREASES
The Association’s retirement benefits are determined in large part by a member’s compensation just prior
to retirement. For that reason, it is important to anticipate salary increases that employees will receive
over their careers. These salary increases are made up of three components:
Inflationary increases;
Real “across the board” increases; and
Promotional and merit increases.
The inflationary increases are assumed to follow the general annual price inflation assumption discussed
in our separate economic assumptions report where we recommended a decrease in the inflation
assumption from 3.25% to 3.00%. We also discussed in that report decreasing the annual “across the
board” pay increase assumptions from 0.75% to 0.50%. Therefore, the total assumed inflation and real
“across the board” pay increase (i.e., wage inflation) decreases from 4.00% to 3.50%. This is the annual
rate of payroll growth at which payments to amortize the Unfunded Actuarial Accrued Liability (UAAL)
are assumed to increase.
The annual promotional and merit increases are determined by measuring the actual increases received by
members over the experience period, net of the inflationary and real “across the board” pay increases.
Increases are measured separately for General and Safety members. This is accomplished by:
Measuring each continuing member’s actual salary increase over each year of the experience period;
Excluding any members with increases of more than 50% or decreases of more than 10% during any
particular year;
Categorizing these increases according to member demographics;
Removing the wage inflation component from these increases (assumed to be equal to the increase in
the members’ average salary during the year);
Averaging these annual increases over the three-year experience period; and
Modifying current assumptions to reflect some portion of these measured increases reflective of their
“credibility.”
Note that, to be consistent with other economic assumptions, these merit and promotional assumptions
should be used in combination with the proposed 3.50% inflation and real “across the board” increases
shown in our economic assumptions report.
MASTER PAGE NO. 110
-42-
The following table shows the General members’ actual average promotional and merit increases by years
of service over the three-year period from July 1, 2011 through June 30, 2014 along with the actual
average increases based on a combination of increases in the current three-year period and those shown in
the prior experience study. The current and proposed assumptions are also shown. The actual increases
for the most recent three-year period and the prior three-year period were reduced by the actual average
inflation plus “across the board” increase (i.e., wage inflation, estimated as the increase in average
salaries) for each year over the three-year experience period (0.8% and 3.8% respectively, on average).
General
Years of Service
Current Assumptions
July 1, 2011 Through June 30, 2014
Average Promotional and Merit Increases
Actual Average Increases from Current and Prior Study
Proposed Assumptions
Less than 1 5.00% 7.65% 7.14% 6.00%
1 3.75 5.35 4.82 4.25
2 3.00 3.77 3.38 3.25
3 2.50 2.97 2.92 2.75
4 2.00 2.54 2.35 2.25
5 1.50 2.04 1.90 1.75
6 1.00 2.46 1.77 1.25
7 1.00 1.72 1.35 1.00
8 0.75 1.18 0.79 0.75
9 0.50 0.62 0.43 0.50
10 0.50 0.86 0.31 0.50
11 0.50 0.90 0.77 0.50
12 0.50 0.93 0.70 0.50
13 0.50 1.21 0.34 0.50
14 0.50 1.45 0.67 0.50
15 0.50 1.25 0.60 0.50
16 0.50 0.87 0.42 0.50
17 0.50 0.68 0.42 0.50
18 0.50 1.21 0.43 0.50
19 0.50 0.33 0.14 0.50
20 & over 0.50 0.33 -0.21 0.50
MASTER PAGE NO. 111

-43-
The following table provides the same information for Safety members. The actual average promotional
and merit increases for the most recent three-year period and the prior three-year period were determined
by reducing the actual average total salary increases by the actual average inflation plus “across the
board” increase (i.e., wage inflation, estimated as the increase in average salaries) for each year over the
three-year experience period (0.2% and 5.4% respectively, on average).
Safety
Years of Service
Current Assumptions
July 1, 2011 Through June 30, 2014
Average Promotional and Merit Increases
Actual Average Increases from Current and Prior Study
Proposed Assumptions
Less than 1 8.50% 7.29% 7.36% 8.00%
1 6.25 6.31 5.96 6.25
2 4.75 4.91 4.92 4.75
3 4.00 3.83 4.53 4.00
4 3.00 5.06 3.67 3.25
5 2.50 3.99 3.42 3.00
6 2.00 2.68 2.81 2.25
7 1.50 1.38 0.65 1.50
8 1.25 1.86 0.98 1.25
9 1.00 1.65 1.33 1.00
10 0.75 -0.21 0.51 0.75
11 0.75 0.88 0.53 0.75
12 0.75 0.24 0.70 0.75
13 0.75 1.03 1.08 0.75
14 0.75 0.93 0.63 0.75
15 0.75 1.32 1.37 0.75
16 0.50 0.64 0.04 0.50
17 0.50 0.91 0.14 0.50
18 0.50 1.46 0.88 0.50
19 0.50 1.36 0.22 0.50
20 & over 0.50 0.70 -0.29 0.50
MASTER PAGE NO. 112

-44-
Charts 20 and 21 provide a graphical comparison of the actual promotional and merit increases, compared
to the proposed and current assumptions. The charts also show the actual promotional and merit increases
based on an average of both the current and previous experience periods. This is discussed below. Chart
20 shows this information for General members and Chart 21 for Safety members.
We realize that the most recent three-year experience period may not be typically indicative of future
long-term promotional and merit salary increases. This appears to be the case for both General and Safety
members as they received virtually no “across the board” salary increases (based on the very low increase
in average wages). Note that, in this situation, our model may lead to higher estimated promotional and
merit increases. Therefore, we also examined the promotional and merit salary experience used in the
prior experience study (which actually consisted of two years of experience). We believe that when the
experience from the last two studies are combined into an average result it provides a more reasonable
representation of potential future promotional and merit salary increases over the long term. Nevertheless,
in our proposed changes to the promotional and merit increases, we have still given relatively less weight
to the actual average increases experience during the last two studies.
Based on this experience, we are proposing slight increases in the promotional and merit salary increases
for both General and Safety members. Overall, salary increases are lower for General and Safety
members due to the lower price inflation and real “across the board” pay increase assumptions.
MASTER PAGE NO. 113
-45-
Cha
rt 2
0
Pr
omot
iona
l and
Mer
it Sa
lary
Incr
ease
Rat
es -
Gen
eral
Mem
bers
-1.0
%
0.0%
1.0%
2.0%
3.0%
4.0%
5.0%
6.0%
7.0%
8.0%
01
23
45
67
89
1011
1213
1415
1617
1819
20+
Year
s of
Ser
vice
Cur
rent
Actu
alPr
opos
edAc
tual
Ave
rage
of L
ast T
wo
Stud
ies
MASTER PAGE NO. 114

-46-
Cha
rt 2
1
Pr
omot
iona
l and
Mer
it Sa
lary
Incr
ease
Rat
es -
Safe
ty M
embe
rs
-1.0
%
0.0%
1.0%
2.0%
3.0%
4.0%
5.0%
6.0%
7.0%
8.0%
9.0%
01
23
45
67
89
1011
1213
1415
1617
1819
20+
Year
s of
Ser
vice
Cur
rent
Actu
alPr
opos
edAc
tual
Ave
rage
of L
ast T
wo
Stud
ies
MASTER PAGE NO. 115

-47-
H. IN-SERVICE REDEMPTIONS
In 1998, the Board of Retirement, in the course of actions related to the Ventura Settlement, determined
that several additional pay elements should be included as Earnable Compensation. These additional pay
elements fall into two categories:
Ongoing Pay Elements – Those that are expected to be received relatively uniformly over a
member’s employment years; and
In-Service Redemption Elements – Those that are expected to be received only during the
member’s final average earnings pay period.
The first category is recognized in the actuarial calculations by virtue of being included in the current pay
of active members. The second category requires a separate actuarial assumption to anticipate its impact
on a member’s retirement benefit.
In this study, we have collected data for the last three years to estimate in-service redemptions for
non-PEPRA active members as a percentage of final average pay. The results are summarized in the
following table:
Actual Average
In-Service Redemptions for Non-PEPRA Members
Year General Tier 1 General Tier 2 Safety 2012 9.42% 3.42% 6.92% 2013 6.63% 3.84% 7.73% 2014 5.38% 3.04% 7.63%
Average 7.13% 3.42% 7.38% Current Assumptions 8.00% 3.50% 7.50% Proposed Assumption 7.50% 3.50% 7.25%
For determining the cost of the basic benefit (i.e., non-COLA component), the cost of this pay element is
currently recognized in the valuation as an employer only cost and does not affect member contribution
rates.
Based on the data in the above table, the in-service redemption assumption has been maintained for
General Tier 2 members and decreased for General Tier 1 members and Safety members.
MASTER PAGE NO. 116

-48-
I. AVERAGE ENTRY AGE (FOR MEMBER CONTRIBUTIONS)
The assumption for average entry age of active members is used in determining the rate at which
members who were hired after November 1974 contribute. The current assumption is age 36 for General
members and age 27 for Safety members. The actual average entry ages for all active members as of
June 30, 2014 is age 35.2 for General members and age 27.1 for Safety members.
Based on this experience we recommend that the average entry age for General members used for
determining member contribution rates be decreased from age 36 to age 35. For Safety members we
recommend that the average entry age used for determining member contribution rates be maintained at
age 27.
MASTER PAGE NO. 117

-49-
IV. COST IMPACT OF ASSUMPTION CHANGES
The tables below show the changes in the employer and member contribution rates due to the proposed
assumption changes as if they were applied in the June 30, 2014 actuarial valuation. Please note that the
rates shown below do not reflect the 50/50 sharing of Normal Cost for non-PEPRA Tiers. If all of the
proposed assumption changes (both economic and demographic) were implemented, the Plan’s average
employer rate would have increased by 3.45% of compensation. The average member rate would have
increased by 0.20% of compensation. The Plan’s UAAL would have increased by $224 million. The
results include the impact of the proposed change to an explicit administrative expense load that would
increase total costs by 0.7% of payroll or $5 million annually. As discussed in the economic assumptions
report, the cost associated with the administrative expense load has been allocated to both the employer
and the member based on the components of the total contribution rate (before expenses) for the member
and the employer.
Employer Contribution Rate Impact (% of Compensation)
Contributions General Tier 1
General Tier 2
PEPRA General Tier 2
General Tier 2C
PEPRA General Tier 2C Safety
PEPRA Safety Overall
Normal Cost 0.44% 0.30% 0.15% 0.44% 0.27% -0.30% 0.16% 0.20% UAAL 2.11% 1.21% 1.21% 2.11% 2.11% 5.66% 5.66% 2.70% Admin Expense 0.55% 0.55% 0.55% 0.55% 0.55% 0.55% 0.55% 0.55% Total 3.10% 2.06% 1.91% 3.10% 2.93% 5.91% 6.37% 3.45%
Employer Contribution Rate Impact (Estimated Annual Dollar Amounts in Thousands)
Contributions General Tier 1
General Tier 2
PEPRA General Tier 2
General Tier 2C
PEPRA General Tier 2C Safety
PEPRA Safety Overall
Total $305 $4,233 $222 $6,951 $689 $9,225 $237 $21,862
MASTER PAGE NO. 118

-50-
Member Contribution Rate Impact (% of Compensation)
Contributions General Tier 1
General Tier 2
PEPRA General Tier 2
General Tier 2C
PEPRA General Tier 2C Safety
PEPRA Safety Overall
Total 0.16% 0.10% 0.30% 0.10% 0.30% 0.45% 0.31% 0.20%
Member Contribution Rate Impact (Estimated Annual Dollar Amounts in Thousands)
Contributions General Tier 1
General Tier 2
PEPRA General Tier 2
General Tier 2C
PEPRA General Tier 2C Safety
PEPRA Safety Overall
Total $16 $209 $36 $228 $72 $719 $12 $1,292
If all of the proposed demographic assumption changes were implemented, the average employer rate
would have increased by 1.57% of compensation. The average member rate would have increased by
0.05% of compensation. Of the various demographic assumption changes, the most significant cost
impact is from the mortality assumption change.
If all of the proposed economic assumptions (recommended in a separate report) were implemented
(including the proposed change to an explicit administrative expense load), the average employer rate
would have increased by 1.88% of compensation and the average member rate would have been increased
by 0.15%. Of the various economic assumption changes, the most significant cost impact is from the
investment return assumption change from 7.75% net of administrative expenses to 7.50% gross of
administrative expenses.
Therefore, the estimated cost impact of all proposed assumption changes (both demographic and
economic) is 3.45% of compensation for the average employer rate, where the Normal Cost rate increased
by 0.20%, the UAAL amortization rate increased by 2.70% and the explicit administrative expense load is
0.55%. The average member rate would have increased by 0.20% of compensation, including the explicit
administrative load of 0.15%. The allocation of the explicit administrative expense load between
employers and members is discussed in the economic assumptions report.
As noted earlier, the above results do not include 50/50 sharing of Normal Cost for non-PEPRA Tiers. If
we include that provision, then the total increase in the Normal Cost of 0.25% would be shared 50/50
between the employers and the members (with the cost of the cessation of member contributions after 30
years of service allocated to the employer) and the allocation of the administrative expense load would be
slightly different. This would shift about 0.07% of the average cost increase from the employers to the
members.
MASTER PAGE NO. 119
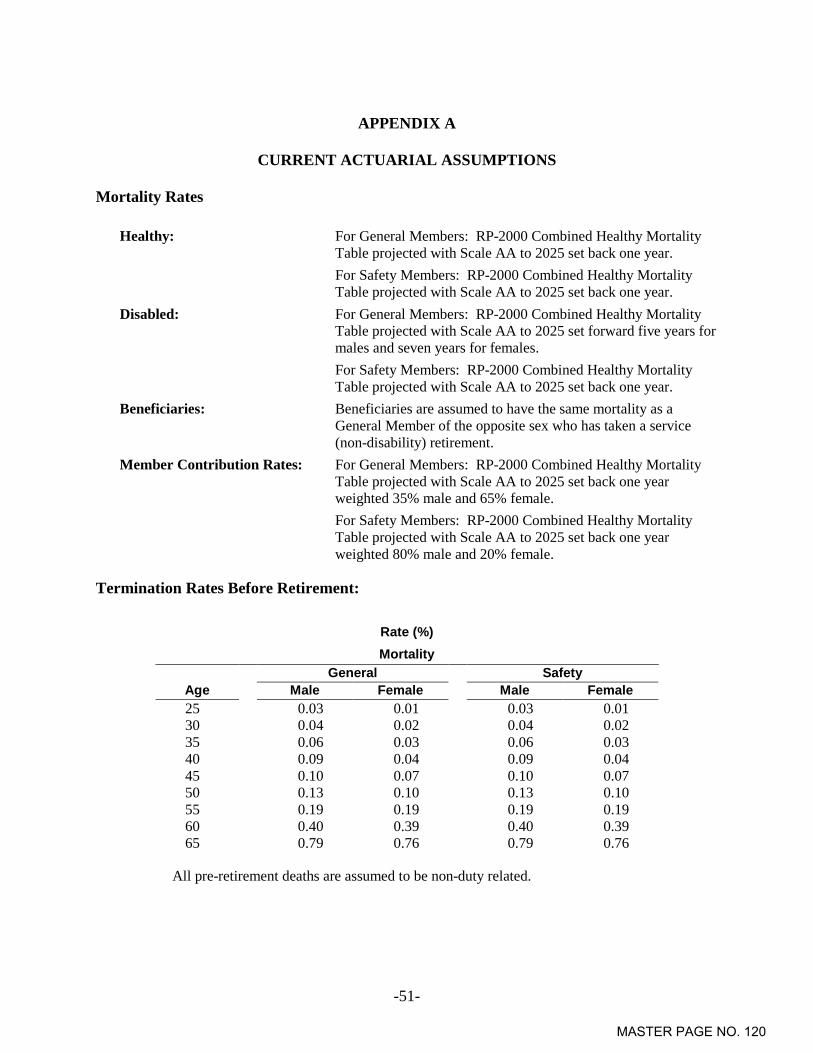
-51-
APPENDIX A
CURRENT ACTUARIAL ASSUMPTIONS
Mortality Rates
Healthy: For General Members: RP-2000 Combined Healthy Mortality Table projected with Scale AA to 2025 set back one year.
For Safety Members: RP-2000 Combined Healthy Mortality Table projected with Scale AA to 2025 set back one year.
Disabled: For General Members: RP-2000 Combined Healthy Mortality Table projected with Scale AA to 2025 set forward five years for males and seven years for females.
For Safety Members: RP-2000 Combined Healthy Mortality Table projected with Scale AA to 2025 set back one year.
Beneficiaries: Beneficiaries are assumed to have the same mortality as a General Member of the opposite sex who has taken a service (non-disability) retirement.
Member Contribution Rates: For General Members: RP-2000 Combined Healthy Mortality Table projected with Scale AA to 2025 set back one year weighted 35% male and 65% female.
For Safety Members: RP-2000 Combined Healthy Mortality Table projected with Scale AA to 2025 set back one year weighted 80% male and 20% female.
Termination Rates Before Retirement:
Rate (%) Mortality
General Safety Age Male Female Male Female 25 0.03 0.01 0.03 0.01 30 0.04 0.02 0.04 0.02 35 0.06 0.03 0.06 0.03 40 0.09 0.04 0.09 0.04 45 0.10 0.07 0.10 0.07 50 0.13 0.10 0.13 0.10 55 0.19 0.19 0.19 0.19 60 0.40 0.39 0.40 0.39 65 0.79 0.76 0.79 0.76
All pre-retirement deaths are assumed to be non-duty related.
MASTER PAGE NO. 120

-52-
Termination Rates Before Retirement (continued):
Rate (%)
Disability Age General(1) Safety(2)
25 0.02 0.14 30 0.04 0.26 35 0.08 0.48 40 0.13 0.90 45 0.21 1.16 50 0.40 1.98 55 0.56 3.40 60 0.69 4.60 65 0.90 0.00 70 1.00 0.00
(1) 40% of General disabilities are assumed to be duty disabilities and the other 60% are assumed to be ordinary disabilities.
(2) 90% of Safety disabilities are assumed to be duty disabilities and the other 10% are assumed to be ordinary disabilities.
MASTER PAGE NO. 121

-53-
Termination Rates Before Retirement (continued):
Rate (%)
Withdrawal (< 5 Years of Service) *
Years of Service General Safety 0 15.00 12.00 1 10.00 6.00 2 8.00 5.50 3 7.00 5.00 4 6.00 4.00
Withdrawal (5+ Years of Service) *
Age General Safety 20 6.00 4.00 25 6.00 4.00 30 5.70 3.40 35 4.90 2.40 40 3.90 1.40 45 2.90 0.70 50 2.20 0.20 55 1.70 0.00 60 1.20 0.00 65 1.00 0.00 70 0.00 0.00
* The greater of a refund of member contributions and a deferred annuity is valued when a member withdraws.
No withdrawal is assumed after a member is first assumed to retire.
MASTER PAGE NO. 122

-54-
Retirement Rates:
Rate (%)
Age
General Tier 1 and 2
PEPRA
General Tier 1 and 2
Safety
PEPRA Safety 40 0.00 0.00 1.00 0.00 41 0.00 0.00 1.00 0.00 42 0.00 0.00 1.00 0.00 43 0.00 0.00 1.00 0.00 44 0.00 0.00 1.00 0.00 45 0.00 0.00 1.00 0.00 46 0.00 0.00 1.00 0.00 47 0.00 0.00 1.00 0.00 48 0.00 0.00 1.00 0.00 49 0.00 0.00 1.00 0.00 50 3.00 0.00 2.00 4.00 51 3.00 0.00 2.00 2.00 52 4.00 2.00 4.00 5.00 53 4.00 2.00 6.00 8.00 54 6.00 3.00 18.00 18.00 55 6.00 5.00 25.00 20.00 56 7.00 5.00 20.00 20.00 57 8.00 6.00 20.00 18.00 58 10.00 7.00 18.00 18.00 59 10.00 8.00 25.00 30.00 60 14.00 10.00 25.00 30.00 61 18.00 12.50 30.00 30.00 62 22.00 20.00 40.00 50.00 63 20.00 20.00 50.00 50.00 64 25.00 20.00 50.00 50.00 65 35.00 25.00 100.00 100.00 66 35.00 30.00 100.00 100.00 67 35.00 30.00 100.00 100.00 68 25.00 30.00 100.00 100.00 69 20.00 30.00 100.00 100.00 70 20.00 50.00 100.00 100.00 71 20.00 50.00 100.00 100.00 72 20.00 50.00 100.00 100.00 73 20.00 50.00 100.00 100.00 74 40.00 50.00 100.00 100.00 75 100.00 100.00 100.00 100.00
MASTER PAGE NO. 123

-55-
Retirement Age and Benefit for Deferred Vested Members: For deferred vested members, we make the following retirement
assumption:
General Age: 58
Safety Age: 54
We assume that 50% and 65% of future General and Safety deferred vested members, respectively, will continue to work for a reciprocal employer. For reciprocals, we assume 4.50% compensation increases per annum.
Future Benefit Accruals: 1.0 year of service per year.
Unknown Data for Members: Same as those exhibited by members with similar known characteristics. If not specified, members are assumed to be male.
Definition of Active Members: All active members of VCERA as of the valuation date.
Percent Married: 70% of male members and 50% of female members are assumed to be married at pre-retirement death or retirement. There is no explicit assumption for children’s benefits.
Age of Spouse: Female (or male) spouses are 3 years younger (or older) than their spouses.
Net Investment Return: 7.75%, net of investment and administration expenses.
Member Contribution Crediting Rate: 3.25% (actual increase is based on projected long term ten-year
Treasury rate).
Consumer Price Index: Increase of 3.25% per year; retiree COLA increases due to CPI are subject to a 3.0% maximum change per year for General Tier 1 and Safety. For General Tier 2, SEIU members receive a fixed 2% cost-of-living adjustment, not subject to changes in the CPI, that applies to future service after March 2003.
In-Service Redemptions:
Non-PEPRA Formulas The following assumptions for in-service redemptions pay as a percentage of final average pay are used:
General Tier 1 8.00% General Tier 2 3.50% Safety 7.50%
For determining the cost of the basic benefit (i.e., non-COLA component), the cost of this pay element is currently recognized in the valuation as an employer only cost and does not affect member contribution rates.
PEPRA Formulas None
MASTER PAGE NO. 124
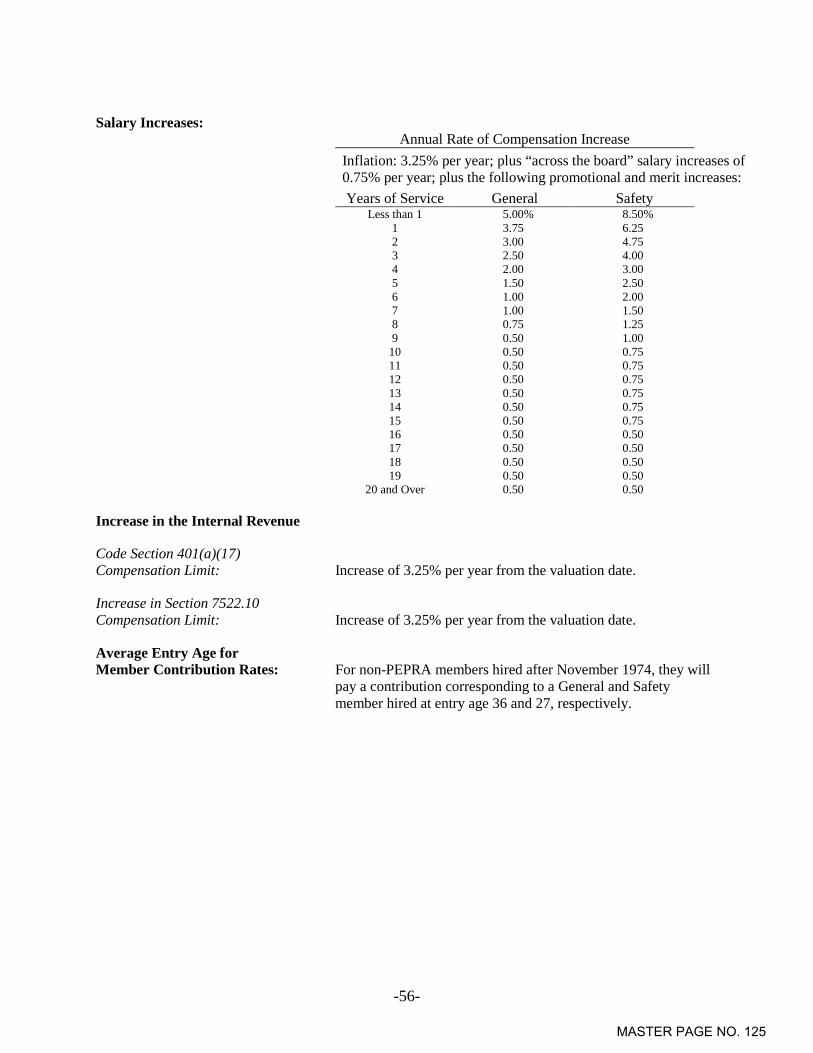
-56-
Salary Increases: Annual Rate of Compensation Increase
Inflation: 3.25% per year; plus “across the board” salary increases of 0.75% per year; plus the following promotional and merit increases: Years of Service General Safety
Less than 1 5.00% 8.50% 1 3.75 6.25 2 3.00 4.75 3 2.50 4.00 4 2.00 3.00 5 1.50 2.50 6 1.00 2.00 7 1.00 1.50 8 0.75 1.25 9 0.50 1.00
10 0.50 0.75 11 0.50 0.75 12 0.50 0.75 13 0.50 0.75 14 0.50 0.75 15 0.50 0.75 16 0.50 0.50 17 0.50 0.50 18 0.50 0.50 19 0.50 0.50
20 and Over 0.50 0.50
Increase in the Internal Revenue
Code Section 401(a)(17) Compensation Limit: Increase of 3.25% per year from the valuation date.
Increase in Section 7522.10 Compensation Limit: Increase of 3.25% per year from the valuation date.
Average Entry Age for Member Contribution Rates: For non-PEPRA members hired after November 1974, they will
pay a contribution corresponding to a General and Safety member hired at entry age 36 and 27, respectively.
MASTER PAGE NO. 125

-57-
APPENDIX B
PROPOSED ACTUARIAL ASSUMPTIONS
Mortality Rates
Healthy: For General Members: RP-2000 Combined Healthy Mortality Table projected with Scale BB to 2035 set back one year for males and set forward one year for females.
For Safety Members: RP-2000 Combined Healthy Mortality Table projected with Scale BB to 2035 set back three years.
Disabled: For General Members: RP-2000 Combined Healthy Mortality Table projected with Scale BB to 2035 set forward six years for males and eight years for females.
For Safety Members: RP-2000 Combined Healthy Mortality Table projected with Scale BB to 2035 set forward two years.
Beneficiaries: Beneficiaries are assumed to have the same mortality as a General Member of the opposite sex who has taken a service (non-disability) retirement.
Member Contribution Rates: For General Members: RP-2000 Combined Healthy Mortality Table projected with Scale BB to 2035 set back one year for males and set forward one year for female weighted one-third male and two-third female.
For Safety Members: RP-2000 Combined Healthy Mortality Table projected with Scale BB to 2035 set back three years weighted 80% male and 20% female.
Termination Rates Before Retirement:
Rate (%) Mortality
General Safety Age Male Female Male Female 25 0.03 0.02 0.03 0.02 30 0.04 0.03 0.03 0.02 35 0.06 0.05 0.05 0.03 40 0.09 0.07 0.08 0.05 45 0.13 0.11 0.11 0.08 50 0.18 0.17 0.16 0.12 55 0.29 0.25 0.24 0.18 60 0.48 0.39 0.41 0.27 65 0.77 0.72 0.64 0.44
All pre-retirement deaths are assumed to be non-duty related.
MASTER PAGE NO. 126

-58-
Termination Rates Before Retirement (continued):
Rate (%)
Disability Age General(1) Safety(2)
25 0.02 0.11 30 0.04 0.24 35 0.08 0.36 40 0.13 0.58 45 0.21 0.88 50 0.31 1.48 55 0.41 2.88 60 0.54 5.04 65 0.69 0.00 70 0.90 0.00
(1) 35% of General disabilities are assumed to be duty disabilities and the other 65% are assumed to be ordinary disabilities.
(2) 90% of Safety disabilities are assumed to be duty disabilities and the other 10% are assumed to be ordinary disabilities.
MASTER PAGE NO. 127

-59-
Termination Rates Before Retirement (continued):
Rate (%)
Withdrawal *
Years of Service General Safety
Less than 1 14.00 10.00
1 10.00 6.00
2 8.00 5.50
3 7.00 5.00
4 6.00 4.00
5 4.00 2.75
6 3.75 2.50
7 3.50 2.00
8 3.50 1.80
9 3.25 1.60
10 3.25 1.40
11 3.00 1.20
12 3.00 1.00
13 2.75 0.95
14 2.75 0.90
15 2.50 0.85
16 2.50 0.80
17 2.25 0.75
18 2.00 0.70
19 2.00 0.65
20 or more 2.00 0.60
* The greater of a refund of member contributions and a deferred annuity is valued when a member withdraws.
No withdrawal is assumed after a member is first assumed to retire.
MASTER PAGE NO. 128
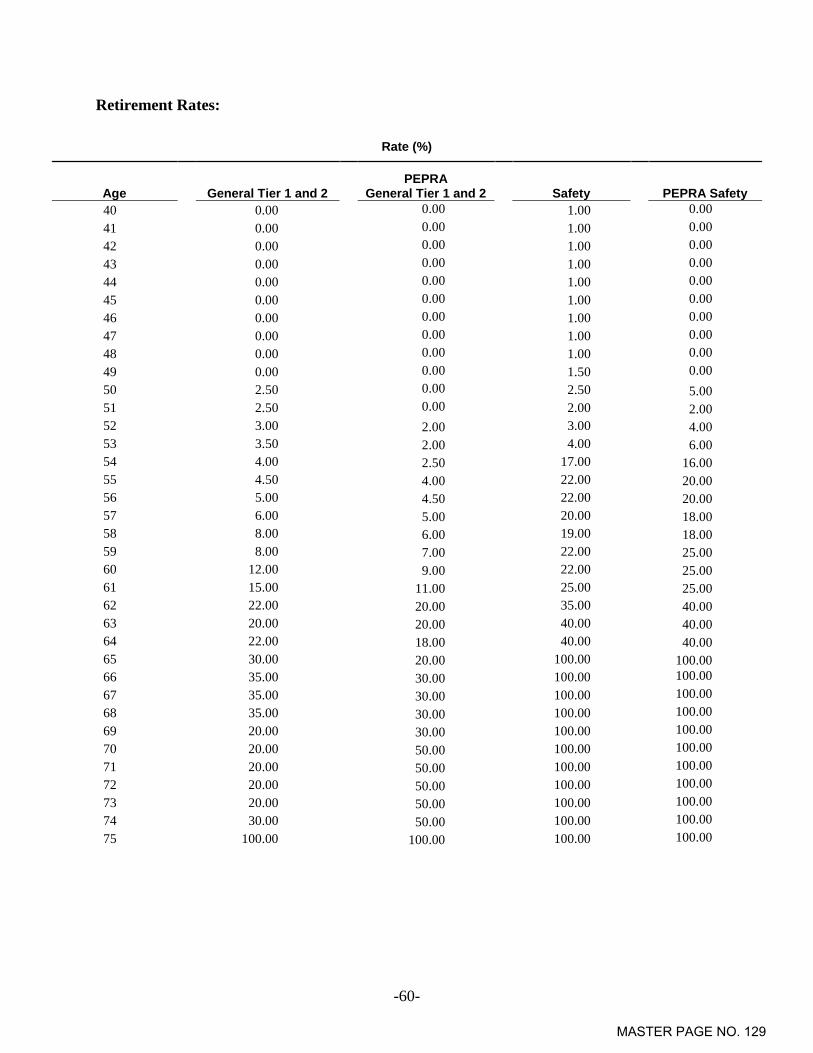
-60-
Retirement Rates:
Rate (%)
Age
General Tier 1 and 2
PEPRA
General Tier 1 and 2
Safety
PEPRA Safety 40 0.00 0.00 1.00 0.00 41 0.00 0.00 1.00 0.00 42 0.00 0.00 1.00 0.00 43 0.00 0.00 1.00 0.00 44 0.00 0.00 1.00 0.00 45 0.00 0.00 1.00 0.00 46 0.00 0.00 1.00 0.00 47 0.00 0.00 1.00 0.00 48 0.00 0.00 1.00 0.00 49 0.00 0.00 1.50 0.00 50 2.50 0.00 2.50 5.00 51 2.50 0.00 2.00 2.00 52 3.00 2.00 3.00 4.00 53 3.50 2.00 4.00 6.00 54 4.00 2.50 17.00 16.00 55 4.50 4.00 22.00 20.00 56 5.00 4.50 22.00 20.00 57 6.00 5.00 20.00 18.00 58 8.00 6.00 19.00 18.00 59 8.00 7.00 22.00 25.00 60 12.00 9.00 22.00 25.00 61 15.00 11.00 25.00 25.00 62 22.00 20.00 35.00 40.00 63 20.00 20.00 40.00 40.00 64 22.00 18.00 40.00 40.00 65 30.00 20.00 100.00 100.00 66 35.00 30.00 100.00 100.00 67 35.00 30.00 100.00 100.00 68 35.00 30.00 100.00 100.00 69 20.00 30.00 100.00 100.00 70 20.00 50.00 100.00 100.00 71 20.00 50.00 100.00 100.00 72 20.00 50.00 100.00 100.00 73 20.00 50.00 100.00 100.00 74 30.00 50.00 100.00 100.00 75 100.00 100.00 100.00 100.00
MASTER PAGE NO. 129

-61-
Retirement Age and Benefit for Deferred Vested Members: For deferred vested members, we make the following retirement
assumption:
General Age: 59
Safety Age: 54
We assume that 50% and 60% of future General and Safety deferred vested members, respectively, will continue to work for a reciprocal employer. For reciprocals, we assume 4.00% compensation increases per annum.
Future Benefit Accruals: 1.0 year of service per year.
Unknown Data for Members: Same as those exhibited by members with similar known characteristics. If not specified, members are assumed to be male.
Definition of Active Members: All active members of VCERA as of the valuation date.
Percent Married: 70% of male members and 55% of female members are assumed to be married at pre-retirement death or retirement. There is no explicit assumption for children’s benefits.
Age of Spouse: Female (or male) spouses are 3 years younger (or older) than their spouses.
Net Investment Return: 7.50%, net of investment expenses.
Administrative Expenses: 0.70% of payroll allocated to both employer and member based on the components of the total contribution rate (before expenses) for the employer and member.
Member Contribution Crediting Rate: 3.00% (actual increase is based on projected long term ten-year
Treasury rate).
Consumer Price Index: Increase of 3.00% per year; retiree COLA increases due to CPI are subject to a 3.0% maximum change per year for General Tier 1 and Safety. For General Tier 2, SEIU members receive a fixed 2% cost-of-living adjustment, not subject to changes in the CPI, that applies to future service after March 2003.
In-Service Redemptions:
Non-PEPRA Formulas The following assumptions for in-service redemptions pay as a percentage of final average pay are used:
General Tier 1 7.50% General Tier 2 3.50% Safety 7.25%
For determining the cost of the basic benefit (i.e., non-COLA component), the cost of this pay element is currently recognized
MASTER PAGE NO. 130
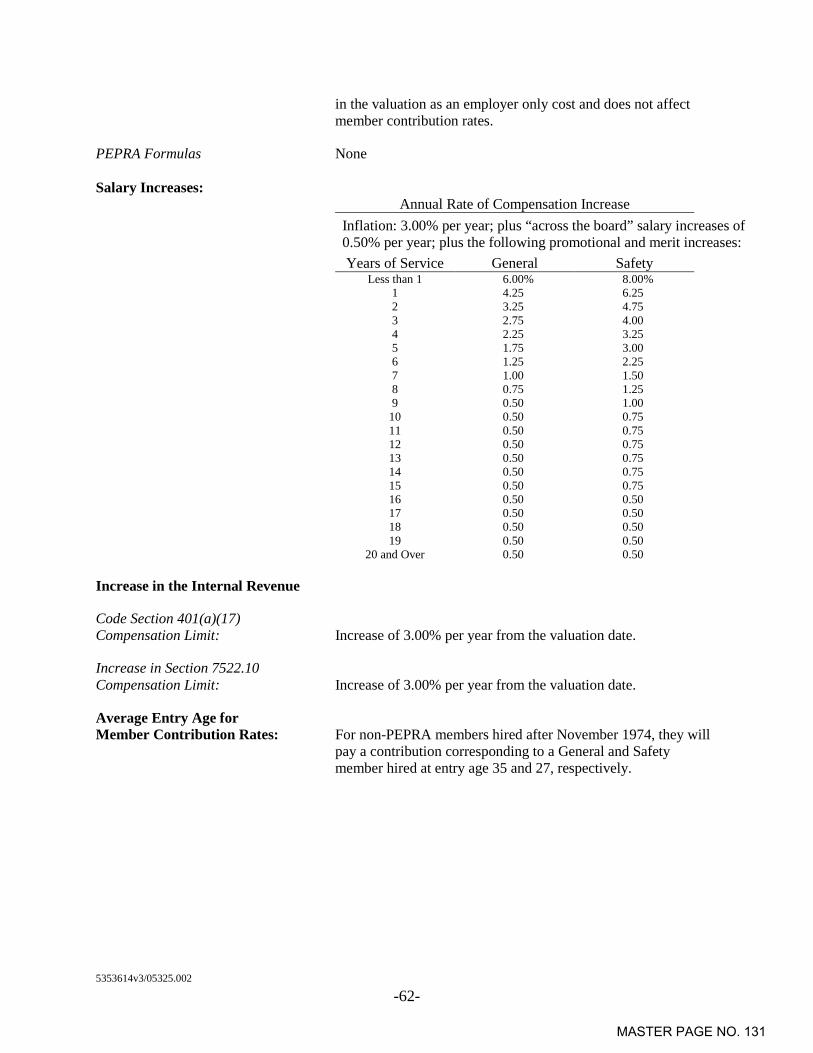
-62-
in the valuation as an employer only cost and does not affect member contribution rates.
PEPRA Formulas None Salary Increases:
Annual Rate of Compensation Increase Inflation: 3.00% per year; plus “across the board” salary increases of 0.50% per year; plus the following promotional and merit increases: Years of Service General Safety
Less than 1 6.00% 8.00% 1 4.25 6.25 2 3.25 4.75 3 2.75 4.00 4 2.25 3.25 5 1.75 3.00 6 1.25 2.25 7 1.00 1.50 8 0.75 1.25 9 0.50 1.00
10 0.50 0.75 11 0.50 0.75 12 0.50 0.75 13 0.50 0.75 14 0.50 0.75 15 0.50 0.75 16 0.50 0.50 17 0.50 0.50 18 0.50 0.50 19 0.50 0.50
20 and Over 0.50 0.50
Increase in the Internal Revenue
Code Section 401(a)(17) Compensation Limit: Increase of 3.00% per year from the valuation date.
Increase in Section 7522.10 Compensation Limit: Increase of 3.00% per year from the valuation date.
Average Entry Age for Member Contribution Rates: For non-PEPRA members hired after November 1974, they will
pay a contribution corresponding to a General and Safety member hired at entry age 35 and 27, respectively.
5353614v3/05325.002
MASTER PAGE NO. 131

100 Montgomery Street Suite 500 San Francisco, CA 94104-4308 T 415.263.8200 www.segalco.com
VENTURA COUNTY EMPLOYEES’ RETIREMENT ASSOCIATION Review of Economic Actuarial Assumptions for the June 30, 2015 Actuarial Valuation
COPYRIGHT © 2015 ALL RIGHTS RESERVED MARCH 2015
MASTER PAGE NO. 132

100 Montgomery Street Suite 500 San Francisco, CA 94104-4308 T 415.263.8200 www.segalco.com
Benefits, Compensation and HR Consulting. Member of The Segal Group. Offices throughout the United States and Canada
April 14, 2015
Board of Retirement Ventura County Employees’ Retirement Association 1190 South Victoria Avenue, Suite 200 Ventura, CA 93003-6572
Re: Review of Economic Actuarial Assumptions For the June 30, 2015 Actuarial Valuation
Dear Members of the Board:
We are pleased to submit this report of our review of the June 30, 2015 economic actuarial assumptions for the Ventura County Employees’ Retirement Association. This report includes our recommendations and the analysis supporting their development.
Please note that we have also reviewed the non-economic actuarial experience for the three-year period from July 1, 2011 to June 30, 2014. The non-economic actuarial assumption recommendations are provided in a separate report.
We are members of the American Academy of Actuaries and we meet the Qualification Standards of the American Academy of Actuaries to render the actuarial opinion herein.
We look forward to reviewing this report with you and answering any questions you may have.
Sincerely,
Paul Angelo, FSA, EA, MAAA, FCA Senior Vice President and Actuary
John Monroe, ASA, EA, MAAA Vice President and Actuary
AW/hy
5354675v4/05325.110
MASTER PAGE NO. 133

TABLE OF CONTENTS
Page
I. INTRODUCTION, SUMMARY, AND RECOMMENDATIONS ....................................1
II. BACKGROUND AND METHODOLOGY........................................................................4
III. ECONOMIC ASSUMPTIONS ...........................................................................................5
A. INFLATION .................................................................................................................5
B. INVESTMENT RETURN .............................................................................................7
C. SALARY INCREASE .................................................................................................22
MASTER PAGE NO. 134

-1-
I. INTRODUCTION, SUMMARY, AND RECOMMENDATIONS
To project the cost and liabilities of the pension fund, assumptions are made about all future events that
could affect the amount and timing of the benefits to be paid and the assets to be accumulated. Each year
actual experience is compared against the projected experience, and to the extent there are differences, the
future contribution requirement is adjusted.
If assumptions are changed, contribution requirements are adjusted to take into account a change in the
projected experience in all future years. There is a great difference in both philosophy and cost impact
between recognizing the actuarial deviations as they occur annually and changing the actuarial
assumptions. Taking into account one year’s gains or losses without making a change in the assumptions
in effect assumes that the experience is treated as temporary and that, over the long run, experience is
expected to return to what was originally assumed. Changing assumptions reflects a basic change in
thinking about the future, and it has a much greater effect on the current contribution requirements than
the gain or loss for a single year.
The use of realistic actuarial assumptions is important to maintain adequate funding, while fulfilling
benefit commitments to participants already retired and to those near retirement. The actuarial
assumptions do not determine the “actual cost” of the plan. The actual cost is determined solely by the
benefits and administrative expenses paid out, offset by investment income received. However, it is
desirable to estimate as closely as possible what the actual cost will be so as to permit an orderly method
for setting aside contributions today to provide benefits in the future, and to maintain equity among
generations of participants and taxpayers.
This study was undertaken in order to review the economic actuarial assumptions. The study was
performed in accordance with Actuarial Standard of Practice (ASOP) No. 27,1 “Selection of Economic
Assumptions for Measuring Pension Obligations.” This Standard of Practice puts forth guidelines for the
selection of the economic actuarial assumptions utilized in a pension plan actuarial valuation.
1 ASOP No. 27 was revised in September 2013 effective for measurement dates on or after September 30, 2014.
Since the recommendations developed herein are intended for use starting with the June 30, 2015 valuation, this study was performed in accordance with ASOP 27 as constituted after the 2013 revisions to the ASOP.
MASTER PAGE NO. 135

-2-
We are recommending changes in the investment return, inflation and “across the board” salary increase
assumptions. Our recommendations for the economic actuarial assumptions for the June 30, 2015
Actuarial Valuation are as follows:
Inflation – Future increases in the Consumer Price Index (CPI) which drives investment returns
and active member salary increases, as well as cost-of-living adjustments (COLAs) for retirees.
Recommendation: Reduce the assumed rate of price inflation from 3.25% to 3.00% per
annum.
Investment Return – The estimated average future net rate of return on current and future assets
of the Association as of the valuation date. This rate is used to discount liabilities.
Recommendation: Reduce the current investment return assumption from 7.75% per annum to
7.50% per annum. The 7.50% recommendation would be consistent with the Board’s past
practice of having a margin for adverse deviation under the risk adjusted model used by Segal.
We further recommend changing to an explicit treatment of administrative expenses in the
selection of an investment return assumption for use both in funding and in financial
reporting required by the Governmental Accounting Standards Board (GASB).
Individual Salary Increases – Increases in the salary of a member between the date of the
valuation to the date of separation from active service. This assumption has three components:
Inflationary salary increases,
Real “across the board” salary increases, and
Promotional and merit increases.
Recommendation: Reduce the current inflationary salary increase assumption from 3.25% to
3.00% and reduce the current real “across the board” salary increase assumption from 0.75%
to 0.50%. This means that the combined inflationary and real “across the board” salary
increases will decrease from 4.00% to 3.50%. Please note that the promotional and merit
increase assumption currently ranges from 0.50% to 8.00% and is a function of a member’s
years of service. The proposed promotional and merit increase assumptions are provided as
part of our triennial experience study of non-economic assumptions, along with the other
recommended non-economic assumptions for the June 30, 2015 valuation.
MASTER PAGE NO. 136

-3-
Section II provides some background on basic principles and the methodology used for the review of the
economic actuarial assumptions. A detailed discussion of each of the economic assumptions and reasons
behind the recommendations is found in Section III. The cost impact of these proposed changes is
included in our separate analysis of the “non-economic” assumptions for the June 30, 2015 valuation.
MASTER PAGE NO. 137

-4-
II. BACKGROUND AND METHODOLOGY
For this study, we analyzed “economic” assumptions only. Our analysis of the “non-economic”
assumptions for the June 30, 2015 valuation is provided in a separate report. The primary economic
assumptions are inflation, investment return and salary increases.
Economic Assumptions
Economic assumptions consist of:
Inflation – Increases in the price of goods and services. The inflation assumption reflects the basic return
that investors expect from securities markets. It also reflects the expected basic salary increase for active
employees and drives increases in the allowances of retired members.
Investment Return – Expected long term rate of return on the Association’s investments after expenses.
This assumption has a significant impact on contribution rates.
Salary Increases – In addition to inflationary increases, it is assumed that salaries will also grow by
“across the board” real pay increases in excess of price inflation. It is also assumed that employees will
receive raises above these average increases as they advance in their careers. These are commonly
referred to as promotional and merit increases. Payments to amortize any Unfunded Actuarial Accrued
Liability (UAAL) are assumed to increase each year by the price inflation rate plus any “across the board”
real pay increases that are assumed.
The setting of these assumptions is described in Section III.
MASTER PAGE NO. 138

-5-
III. ECONOMIC ASSUMPTIONS
A. INFLATION
Unless an investment grows at least as fast as prices increase, investors will experience a reduction in the
inflation-adjusted value of their investment. There may be times when “riskless” investments return more
or less than inflation, but over the long term, investment market forces will generally require an issuer of
fixed income securities to maintain a minimum return which protects investors from inflation.
The inflation assumption is long term in nature, so it is set using primarily historical information.
Following is an analysis of 15 and 30 year moving averages of historical inflation rates:
Historical Consumer Price Index – 1930 to 2014
(U.S. City Average - All Urban Consumers)
25th Percentile Median 75th Percentile
15-year moving averages 2.6% 3.4% 4.6%
30-year moving averages 3.2% 4.1% 4.9%
The average inflation rates have continued to decline gradually over the last several years due to the
relatively low inflationary period over the past two decades. Also, the later of the 15-year averages during
the period are lower as they do not include the high inflation years of the mid-1970s and early 1980s.
In the 2013 public fund survey published by the National Association of State Retirement Administrators,
the median inflation assumption used by 126 large public retirement funds in their 2012 valuations has
decreased to 3.00% from the 3.25% used in the 2011 valuations. In California, CalPERS and LACERA
have recently reduced their inflation assumptions to 2.75% and 3.00%, respectively.
VCERA’s investment consultant, New England Pension Consultants (NEPC), anticipates an annual
inflation rate of 3.25%. Note that, in general, the investment consultants’ time horizon for this assumption
is shorter than the time horizon we use for the actuarial valuation. We also note that the average inflation
rate used by a sample of nine investment advisory firms is 2.53%.
To find a forecast of inflation based on a longer time horizon, we referred to the 2014 report on the
financial status of the Social Security program. The projected average increase in the Consumer Price
Index (CPI) over the next 75 years under the intermediate cost assumptions used in that report was 2.70%.
We also compared the yields on the thirty-year inflation indexed U.S. Treasury bonds to comparable
MASTER PAGE NO. 139

-6-
traditional U.S. Treasury bonds. As of January 2015, the difference in yields is 1.92%, which provides a
measure of market expectations of inflation.
Based on all of the above information, we recommend that the current 3.25% annual inflation
assumption be reduced to 3.00% for the June 30, 2015 actuarial valuation.
Retiree Cost-of-Living Increases
We also recommend maintaining the current assumptions to value the post-retirement COLA benefit at
3.00% per year for all General Tier 1 and Safety members. Note that General Tier 2 members with COLA
provision are entitled to receive a fixed 2% COLA, not limited to actual changes in the CPI, that applies
to future service after March 2003. The current and proposed COLA assumptions are shown below:
Maximum COLA for all General
Tier 1 and Safety Members
Current Assumption
Proposed Assumption
3.00% 3.00% 3.00%
Note that in developing the COLA assumption, we also considered the results of a stochastic approach
that would attempt to account for the possible impact of low inflation that could occur before COLA
banks are able to be established for the member. Although the results of this type of analysis might justify
the use of a lower COLA assumption, we are not recommending that at this time. The reasons for this
conclusion include the following:
The results of the stochastic modeling are significantly dependent on assuming that lower levels of
inflation will persist in the early years of the projections. If this is not assumed, then the stochastic
modeling will produce results similar to our proposed COLA assumptions.
Using a lower long-term COLA assumption based on a stochastic analysis would mean that an
actuarial loss would occur even when the inflation assumption of 3.00% is met in a year. We
question the reasonableness of this result.
We do not see the stochastic possibility of COLAs averaging less than those predicted by the assumed
rate of inflation as a reliable source of cost savings that should be anticipated in our COLA assumptions.
Therefore, we continue to recommend setting the COLA assumptions based on the long-term annual
inflation assumption, as we have in prior years.
MASTER PAGE NO. 140

-7-
B. INVESTMENT RETURN
The investment return assumption is comprised of two primary components, inflation and real rate of
investment return, with adjustments for expenses and risk.
Real Rate of Investment Return
This component represents the portfolio’s incremental investment market returns over inflation. Theory
has it that, as an investor takes a greater investment risk, the return on the investment is expected to also
be greater, at least in the long run. This additional return is expected to vary by asset class and empirical
data supports that expectation. For that reason, the real rate of return assumptions are developed by asset
class. Therefore, the real rate of return assumption for a retirement system’s portfolio will vary with the
Board’s asset allocation among asset classes.
The following is the Association’s current target asset allocation and the assumed real rate of return
assumptions by asset class. The first column of real rate of return assumptions are determined by reducing
NEPC’s total return assumptions by their assumed 3.25% for inflation. The second column of returns
(except for Private Debt/Credit Strategies, Absolute Return, Real Assets and Private Equity) represents
the average of a sample of real rate of return assumptions. The sample includes the expected annual real
rate of returns provided to us by NEPC and by eight other investment advisory firms retained by Segal’s
California public sector clients. We believe these assumptions reasonably reflect a consensus forecast of
long term future real market returns.2
2 Note that, just as for the inflation assumption, in general the time horizon used by the investment consultants in
determining the real rate of return assumption is shorter than the time horizon encompassed by the actuarial valuation.
MASTER PAGE NO. 141

-8-
VCERA’s Target Asset Allocation and Assumed Arithmetic Real Rate of Return Assumptions by Asset Class and for the Portfolio
Asset Class Percentage of
Portfolio
NEPC’s Assumed Real
Rate of Return(1)
Average Real Rate of Return from a Sample of Consultants to Segal’s California Public
Sector Clients(2) Large Cap U.S. Equity 27.74% 5.58% 5.90%
Small Cap U.S. Equity 3.41% 6.39% 6.60%
Developed International Equity 14.73% 6.60% 6.95%
Emerging Market Equity 3.12% 8.80% 8.44%
U.S. Core Fixed Income 14.00% 0.97% 0.71%
Real Estate 7.00% 4.25% 4.65%
Private Debt/Credit Strategies 5.00% 6.01% 6.01%(3)
Absolute Return (Risk Parity)(4) 16.00% 4.13% 4.13%(3)
Real Assets (Master Limited Partnerships)(4) 4.00% 6.51% 6.51%(3)
Private Equity 5.00% 9.25% 9.25%(3)
Total Portfolio 100.00% 5.13% 5.26%
(1) Derived by reducing NEPC’s nominal rate of return assumptions by their assumed 3.25% inflation rate.
(2) These are based on the projected arithmetic real returns provided by the investment advisory firms serving the county retirement systems of Ventura, Alameda, Contra Costa, Sonoma, Mendocino, Kern, the LA City Employees’ Retirement System, LA Department of Water and Power and the LA Fire & Police Pensions. These return assumptions are gross of any applicable investment expenses.
(3) For these asset classes, NEPC’s assumption is applied in lieu of the average because there is a larger disparity in returns for these asset classes among the firms surveyed and using NEPC’s assumption should more closely reflect the underlying investments made specifically for VCERA.
(4) These are categorized as “Liquid Alternatives” when reported to VCERA by NEPC.
Please note that the above are representative of “indexed” returns and do not include any additional
returns (“alpha”) from active management. This is consistent with the revised Actuarial Standard of
Practice No. 27, Section 3.8.3.d, which states:
“Investment Manager Performance – Anticipating superior (or inferior) investment manager
performance may be unduly optimistic (or pessimistic). The actuary should not assume that
superior or inferior returns will be achieved, net of investment expenses, from an active investment
management strategy compared to a passive investment management strategy unless the actuary
MASTER PAGE NO. 142

-9-
believes, based on relevant supporting data, that such superior or inferior returns represent a
reasonable expectation over the measurement period.”
The following are some observations about the returns provided above:
1. The investment consultants to our California public sector clients have each provided us with
their expected real rates of return for each asset class, over various future periods of time.
However, in general, the returns available from investment consultants are projected over time
periods shorter than the durations of a retirement plan’s liabilities.
2. Using a sample average of expected real rate of returns allows the Association’s investment
return assumption to reflect a broader range of capital market information and should help
reduce year to year volatility in the investment return assumption.
3. Therefore, we recommend that the 5.26% portfolio real rate of return be used to determine the
Association’s investment return assumption. This is 0.05% lower than the return we used in
2012 to prepare the recommended investment return assumption. This difference is due to
changes in the Association’s target asset allocation (+0.33%) and changes in the real rate of
return assumptions provided to us by the investment advisory firms (-0.38%).
Association Expenses
For funding purposes, the real rate of return assumption for the portfolio needs to be adjusted for
investment expenses expected to be paid from investment income. As further discussed later in this
report, current practice for VCERA also adjusts for expected administrative expenses. The following table
provides these expenses in relation to the actuarial value of assets for the five years ending June 30, 2014.
MASTER PAGE NO. 143
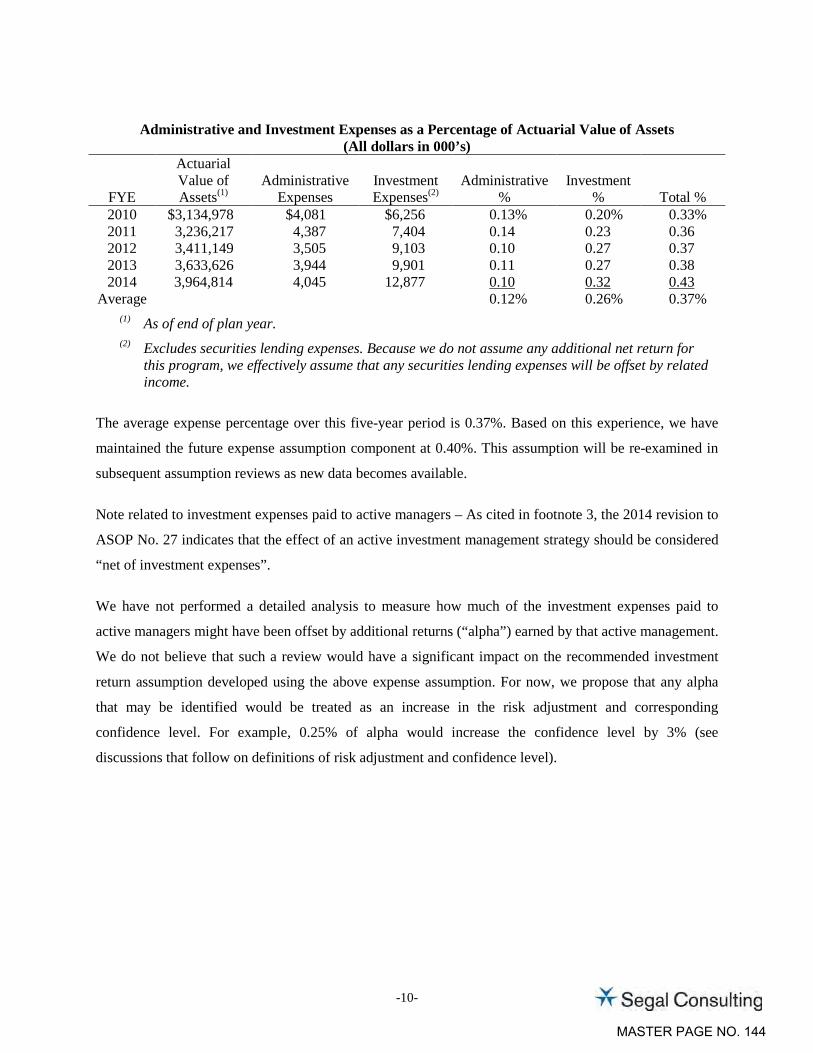
-10-
Administrative and Investment Expenses as a Percentage of Actuarial Value of Assets (All dollars in 000’s)
FYE
Actuarial Value of Assets(1)
Administrative
Expenses
Investment Expenses(2)
Administrative
%
Investment
%
Total % 2010 $3,134,978 $4,081 $6,256 0.13% 0.20% 0.33% 2011 3,236,217 4,387 7,404 0.14 0.23 0.36 2012 3,411,149 3,505 9,103 0.10 0.27 0.37 2013 3,633,626 3,944 9,901 0.11 0.27 0.38 2014 3,964,814 4,045 12,877 0.10 0.32 0.43
Average 0.12% 0.26% 0.37% (1) As of end of plan year. (2) Excludes securities lending expenses. Because we do not assume any additional net return for
this program, we effectively assume that any securities lending expenses will be offset by related income.
The average expense percentage over this five-year period is 0.37%. Based on this experience, we have
maintained the future expense assumption component at 0.40%. This assumption will be re-examined in
subsequent assumption reviews as new data becomes available.
Note related to investment expenses paid to active managers – As cited in footnote 3, the 2014 revision to
ASOP No. 27 indicates that the effect of an active investment management strategy should be considered
“net of investment expenses”.
We have not performed a detailed analysis to measure how much of the investment expenses paid to
active managers might have been offset by additional returns (“alpha”) earned by that active management.
We do not believe that such a review would have a significant impact on the recommended investment
return assumption developed using the above expense assumption. For now, we propose that any alpha
that may be identified would be treated as an increase in the risk adjustment and corresponding
confidence level. For example, 0.25% of alpha would increase the confidence level by 3% (see
discussions that follow on definitions of risk adjustment and confidence level).
MASTER PAGE NO. 144

-11-
Adjustment to Exclude Administrative Expenses in Developing Investment Return Assumption for use
in GASB Financial Reporting
In 2012, GASB adopted Statements 67 and 68 that replace Statements 25 and 27 for financial reporting
purposes. GASB Statements 67 and 68 are effective for plan year 2013/2014 for the Retirement
Association and fiscal year 2014/2015 for the employer.3
According to GASB, the investment return assumption for use in financial reporting purposes should be
based on the long-term expected rate of return on a retirement system’s investments and should be net of
investment expenses but not of administrative expenses (i.e., without reduction for administrative
expenses). As can be observed from the above development of the expense assumption, if the Board
wishes to develop a single investment return assumption for both funding and financial reporting
purposes, then it would be necessary to exclude the roughly 0.12% administrative expense from the above
development and to develop a separate treatment of administrative expenses.
The issues associated with eliminating the consideration of administrative expenses when developing the
investment return assumption used for funding, and the alternatives that are available to the Board in
developing the investment return assumption for use in GASB financial reporting purposes are provided
at the end of this Section. While we do recommend that the Board adopt an investment return for funding
that is gross of administrative expenses (as discussed in the end of this Section), the preliminary
discussion that follows has first been completed on a net of administrative expenses basis, to allow an
“apples to apples” comparison with the current assumption.
Risk Adjustment
The real rate of return assumption for the portfolio generally is adjusted to reflect the potential risk of
shortfalls in the return assumptions. The Association’s asset allocation also determines this portfolio risk,
since risk levels are driven by the variability of returns for the various asset classes and the correlation of
returns among those asset classes. This portfolio risk is incorporated into the real rate of return
assumption through a risk adjustment.
3 The new Statements (67 and 68) will require more rapid recognition for investment gains or losses and much
shorter amortization for actuarial gains or losses. Because of the more rapid recognition of those changes, retirement systems that have generally utilized the previous Statements (25 and 27) as a guideline to establish the employer’s contribution amounts for both funding and financial reporting purposes would now have to prepare two sets of cost results, one for contributions and one for financial reporting under the new Statements.
MASTER PAGE NO. 145

-12-
The purpose of the risk adjustment (as measured by the corresponding confidence level) is to increase the
likelihood of achieving the actuarial investment return assumption in the long term.4 The 5.26% expected
real rate of return developed earlier in this report was based on expected mean or average arithmetic
returns. This means there is a 50% chance of the actual return in each year being at least as great as the
average (assuming a symmetrical distribution of future returns). The risk adjustment is intended to
increase that probability. This is consistent with our experience that retirement plan fiduciaries would
generally prefer that returns exceed the assumed rate more often than not.
Three years ago, the Board adopted an investment return assumption of 7.75%. That return implied a risk
adjustment of 0.41%, reflecting a confidence level of 54% that the actual average return over 15 years
would not fall below the assumed return, assuming that the distribution of returns over that period follows
the normal statistical distribution.5
In our model, the confidence level associated with a particular risk adjustment represents the likelihood
that the actual average return would equal or exceed the assumed value over a 15-year period. For
example, if we set our real rate of return assumption using a risk adjustment that produces a confidence
level of 60%, then there would be a 60% chance (6 out of 10) that the average return over 15 years will be
equal to or greater than the assumed value. The 15-year time horizon represents an approximation of the
“duration” of the fund’s liabilities, where the duration of a liability represents the sensitivity of that
liability to interest rate variations.
If we use the same confidence level of 54% to set this year’s risk adjustment, based on the current long-
term portfolio standard deviation of 12.69% provided by NEPC, the corresponding risk adjustment would
be 0.34%. Together with the other investment return components, this produces a net investment return
assumption of 7.52%, which is lower than the current assumption of 7.75%.
Based on the general practice of using one-quarter percentage point increments for economic
assumptions, we evaluated the effect on the confidence level of an alternative investment return
assumption. In particular, a net investment return assumption of 7.50%, together with the other
investment return components, would produce a risk adjustment of 0.36%, which corresponds to a
confidence level of 54%.
4 This type of risk adjustment is sometimes referred to as a “margin for adverse deviation”. 5 Based on an annual portfolio return standard deviation of 13.50% provided by Hewitt Ennis Knupp in 2012.
Strictly speaking, future compounded long-term investment returns will tend to follow a log-normal distribution. However, we believe the Normal distribution assumption is reasonable for purposes of setting this type of risk adjustment.
MASTER PAGE NO. 146

-13-
As we have discussed in prior years, the risk adjustment model and associated confidence level is most
useful as a means for comparing how the Association has positioned itself relative to risk over periods of
time.6 The use of a 54% confidence level should be considered in context with other factors, including:
As noted above, the confidence level is more of a relative measure than an absolute measure,
and so can be reevaluated and reset for future comparisons.
The confidence level is based on the standard deviation of the portfolio that is determined and
provided to us by NEPC. The standard deviation is a statistical measure of the future volatility
of the portfolio and so is itself based on assumptions about future portfolio volatility and can be
considered somewhat of a “soft” number.
A lower assumed level of inflation should reduce the overall risk of failing to meet the
investment return assumption. Maintaining or even lowering the confidence level to some
extent could be justified as consistent with the change in the inflation assumption.
As with any model, the results of the risk adjustment model should be evaluated for
reasonableness and consistency. This is discussed in the later section on “Comparison with
Other Public Retirement Systems”.
Taking into account the factors above, our preliminary recommendation is to reduce the net investment
return assumption from 7.75% to 7.50%. As noted above, this return implies a 0.36% risk adjustment,
reflecting a confidence level of 54% that the actual average return over 15 years would not fall below the
assumed return.
6 In particular, it would not be appropriate to use this type of risk adjustment as a measure of determining an
investment return rate that is “risk-free.”
MASTER PAGE NO. 147

-14-
Preliminary Recommended Investment Return Assumption
The following table summarizes the components of the preliminary investment return assumption
developed in the previous discussion. For comparison purposes, we have also included similar values
from the last study.
Calculation of Net Investment Return Assumption
Assumption Component
June 30, 2015 Preliminary
Recommended Value
June 30, 2012 Adopted Value
Inflation 3.00% 3.25%
Plus Portfolio Real Rate of Return 5.26% 5.31%
Minus Expense Adjustment (0.40%) (0.40%)
Minus Risk Adjustment (0.36%) (0.41%)
Total 7.50% 7.75%
Confidence Level 54% 54%
Based on this analysis, our preliminary recommendation is that the investment return assumption
be reduced from 7.75% per annum to 7.50% per annum. Our final recommendation follows later
in this section after discussion regarding a change in how expected administration expenses are
handled.
Comparison with Other Public Retirement Systems
One final test of the recommended investment return assumption is to compare it against those used by
other public retirement systems, both in California and nationwide.
We note that a 7.50% investment return assumption is emerging as the common assumption among those
California public sector retirement systems that have studied this assumption recently. In particular two of
the largest California systems, CalPERS and LACERA, adopted a 7.50% earnings assumption. Note that
CalPERS uses a lower inflation assumption of 2.75% while LACERA uses an inflation assumption of
3.00%. However, five County employees retirement systems (Orange, Contra Costa, Fresno, Mendocino
and San Mateo) have recently adopted a 7.25% earnings assumption.
The following table compares the VCERA recommended net investment return assumptions against those
of the nationwide public retirement systems that participated in the National Association of State
Retirement Administrators (NASRA) 2013 Public Fund Survey:
MASTER PAGE NO. 148

-15-
Assumption VCERA NASRA 2013 Public Fund Survey
Low Median High
Net Investment Return 7.50% 6.50% 7.90% 8.50%
The detailed survey results show that of the systems that have an investment return assumption in the
range of 7.50% to 7.90%, almost half of those systems have used an assumption of 7.50%. The survey
also notes that several plans have reduced their investment return assumption during the last year, and
others are considering doing so. State systems outside of California tend to change their economic
assumptions slowly and so may lag behind emerging practices in this area.
In summary, we believe that both the risk adjustment model and other considerations indicate a lower
earnings assumption. The recommended assumption of 7.50% continues to provide for some risk margin
within the risk adjustment model as compared to three years ago and is consistent with the Association’s
current practice relative to other public systems.
MASTER PAGE NO. 149
-16-
Developing an Investment Return Assumption for use in Accounting and Financial Reporting under
GASB Statement 67 and 68
The Governmental Accounting Standards Board (GASB) has adopted Statements 67 and 68 that replace
Statements 25 and 27 for financial reporting purposes. We now discuss the issues and policy alternatives
available to VCERA in developing its investment return assumptions in a manner that will allow the Plan
to maintain consistency in its liability measurements for funding and financial reporting purposes.
Background
GASB Statement 67 governs the Plan’s financial reporting and is effective for plan year 2013/2014, while
GASB Statement 68 governs the employers’ financial reporting and is effective for fiscal year 2014/2015.
The new Statements specify requirements for measuring both the pension liability and the annual pension
expense incurred by the employers. The new GASB requirements are only for financial reporting and do
not affect how the Plan determines funding requirements for its employer. Nonetheless, it is important to
understand how the new financial reporting results will compare with the funding requirement results.
The comparison between funding and GASB financial reporting results will differ dramatically depending
on whether one is considering measures of the accumulated pension liability or measures of the current
year annual pension contribution/expense:
• When measuring pension liability GASB will use the same actuarial cost method (Entry Age method)
and the same type of discount rate (expected return on assets) as VCERA uses for funding. This
means that the GASB “Total Pension Liability” measure for financial reporting will be determined on
generally the same basis as VCERA’s “Actuarial Accrued Liability” measure for funding. This is a
generally favorable feature of the new GASB rules that should largely preclude the need to explain
why VCERA has two different measures of pension liability. We note that the same is generally true
for the “Normal Cost” component of the annual plan cost for both funding and financial reporting.
• When measuring annual pension expense, GASB will require more rapid recognition of investment
gains or losses and much shorter amortization of changes in the pension liability (whether due to
actuarial gains or losses, actuarial assumption changes or plan amendments). Because of GASB’s
more rapid recognition of those changes, retirement systems that have generally used the same
“annual required contribution” amount for both funding (contributions) and financial reporting
(pension expense) will now have to prepare and disclose two different annual cost results, one for
contributions and one for financial reporting under the new GASB Statements.
MASTER PAGE NO. 150

-17-
This situation will facilitate the explanation of why the funding and financial reporting results are
different: the liabilities and Normal Costs are generally the same, and the differences in annual costs are
due to differences in how changes in liability are recognized. However, there is one other feature that will
make the liability and Normal Cost measures different unless action is taken by VCERA.
Treatment of Expected Administrative Expenses when Measuring Liabilities
As noted above, according to GASB, the discount rate used for financial reporting purposes should be
based on the long-term expected rate of return on a retirement system’s investments, just as it is for
funding. However, GASB requires that this assumption should be net of investment expenses but not net
of administrative expenses (i.e., without reduction for administrative expenses). Currently, VCERA’s
investment return assumption used for the annual funding valuation is developed net of both investment
and administrative expenses.
While VCERA could continue to develop its funding investment return assumption net of both
investment and administrative expenses, that would mean that the Association would then have two
slightly different investment return assumptions, one for funding and one for financial reporting. To avoid
this apparent discrepancy and to maintain the consistency of liability and Normal Cost measures
described above, we believe that it would be preferable to use the same investment return assumption for
both funding and financial reporting purposes. This means that the assumption for funding purposes
would be developed on a basis that is net of only investment expenses, with an explicit assumption for
administrative expenses.
To review, using the same investment return assumption for both purposes would be easier for VCERA’s
stakeholders to understand and should result in being able to report VCERA’s Actuarial Accrued Liability
(AAL) for funding purposes as the Total Pension Liability (TPL) for financial reporting purposes.
Development of Investment Return Assumption For Funding on a Gross of Administrative
Expenses Basis so the Same Assumption Can Also Be Used for Financial Reporting (“Option A”)
If the Board wishes to develop a single investment return assumption for both funding and financial
reporting purposes, then it would be necessary to exclude the administrative expense component of about
0.12% from development of the 7.50% investment return preliminary recommendation. Under this
approach, because these economic assumptions are generally changed in ¼% increments, there would be
no change in the recommended investment return assumption as developed earlier in this report. Instead,
there would be an increase in the risk adjustment of 0.12%, with a corresponding increase in the
confidence level from 54% to 55%.
MASTER PAGE NO. 151

-18-
Under this approach, there would also be an explicit loading for administrative expenses. There are
various ways to set the explicit administrative expense load assumption, but ultimately the method should
result in an assumption that is approximately equivalent to about $5 million annually, or 0.7% of payroll.
This approach and our final recommendation for the investment return assumption is presented in the
following table.
Calculation of Net Investment Return Assumption
Assumption Component
June 30, 2015
Recommended Values if Used only for Funding
(Net of Admin. Expenses)
June 30, 2015 Recommended Values for both Funding and
Financial Reporting (Gross of Admin. Expenses)
Inflation 3.00% 3.00% Plus Portfolio Real Rate of Return 5.26% 5.26% Minus Expense Adjustment (0.40%) (0.28%) Minus Risk Adjustment (0.36%) (0.48%) Total 7.50% 7.50% Confidence Level 54% 55% Increase in combined Employer and Employee Contributions Due to Explicit Load for Administrative Expenses (Cost as % of Payroll)
Not Applicable
0.70% of pay
There is an additional complication associated with eliminating the administrative expenses in developing
the investment return assumption used for funding that relates to the allocation of administrative expenses
between the employers and employees:
1. Even though GASB requires the exclusion of the administrative expenses from the investment
return assumption, such expense would continue to accrue for a retirement system. For private
sector retirement plans, where the investment return is developed using an approach similar to that
required by GASB (i.e., without deducting administrative expenses), contribution requirements are
increased explicitly by the anticipated annual administrative expense. That approach is illustrated
in the table above.
2. Under VCERA’s current approach of subtracting the administrative expense in the development of
the investment return assumption, such annual administrative expense is funded implicitly by
effectively deducting it from future expected investment returns. Since an investment return
MASTER PAGE NO. 152

-19-
assumption net of investment and administrative expenses has been used historically to establish
both the employer’s and the employee’s contribution requirements, these administrative expenses
have been funded implicitly by both the employer and the employees.
3. A switch from the method described in (2) to the method described in (1) may require a new
discussion on how to allocate administrative expenses between employers and employees,
including possibly establishing a new method to allocate the anticipated annual administrative
expense between them. Under current practice, part of the implicit funding of administrative
expenses is in the Normal Cost and so is shared between the employer and the employees.
However, the rest of the implicit expense funding is in the (Unfunded) Actuarial Accrued Liability,
which is funded solely by the employers.
4. It is not straightforward to quantify precisely the current implicit sharing of administrative
expenses between employers and employees. This means that an exact reproduction of that
allocation on an explicit basis will be difficult to develop. This in turn means that VCERA would
need to develop a new basis for sharing the cost of administrative expenses, one that if desired,
approximately reproduces the current allocation. Alternatively, VCERA could decide to treat
administrative expenses as a loading applied only to the employer contribution rates, which is the
practice followed by private plans, both single employer and multi-employer.
5. As the Board is aware, legislative changes under AB 340 imposed major modifications to both the
level of benefits and the cost-sharing of the funding of those benefits for county employees’
retirement systems. Included in such modifications is the requirement (for future hires) to fund the
Normal Cost on a 50:50 basis between the employer and the employee. As noted in (3) above,
under current practice, part of the implicit funding of administrative expenses is in the Normal Cost
and so would be shared between the employer and the employees. This would not necessarily
continue when the administrative expense loading is developed separate from the Normal Cost.
If, as we recommend, the Board wishes to continue to develop a single investment return
assumption for both funding and financial reporting purposes, it is our recommendation that the
Board adopt a change in the funding of administrative expenses from the method described in (2)
above with an implicit allocation of administrative expenses to the method described in (1) above
with an explicit allocation of administrative expenses.
In addition, we recommend that the total explicit administrative expense load assumption be set at
0.70% of payroll, which is approximately equivalent to about 0.12% of assets or $5 million
MASTER PAGE NO. 153

-20-
annually. This assumption would be reviewed with each triennial experience study, along with the
other economic assumptions.
The more significant issues mentioned in (3), (4) and (5) above concern whether or not the costs
associated with the administrative expenses should continue to be allocated to both the employers and the
employees. Unless the Board wishes to charge administrative expenses only to the employers, we propose
a method whereby the costs associated with the explicit assumption for administrative expenses continue
to be allocated to both employers and employees. We recommend a straightforward way to do that in a
manner generally consistent with current practice, which is to allocate expenses based on the components
of the total contribution rate (before expenses) for employers and employees. These components would be
employee Normal Cost contributions, employer Normal Cost contributions and employer UAAL
contributions. Under this recommended approach, of the total administrative expenses of about $5
million or 0.70% of payroll, about $1.1 million or 0.15% of payroll would be allocated to the
employees and $3.9 million or 0.55% of payroll would be allocated to the employers in the
aggregate. This allocation would be based on the actual components in each valuation and could
change slightly each year.
Development of Investment Return Assumption for Funding on a Net of Administrative Expenses
Basis but use that Same Assumption for Financial Disclosure Development (“Option B”)
If the Board decides to leave the recommended investment return assumption of 7.50% on a net of
administrative expense basis for funding purposes, we believe there still is a way to use that same 7.50%
for financial reporting purposes under GASB. Under this approach, what appears to be the same 7.50%
assumption would actually be used as two slightly different assumptions: 7.50% net of administrative
expenses for funding, and 7.50% gross of administrative expenses for financial reporting. This would
indirectly result in an increase in the margin for adverse deviation or “confidence level” associated with
the use of the recommended 7.50% assumption from 54% as used for funding purposes to 55% only as
used for financial reporting purposes.
The Board had previously adopted this Option B on an interim basis last year for use in performing the
June 30, 2014 actuarial valuation and the June 30, 2014 GASB 67 report.
The following table summarizes the components of the investment return assumption under this approach,
using the recommended 7.50% assumption for both funding (net of administration expenses) and financial
reporting (gross of administration expenses), but with differing treatment of administrative expenses:
MASTER PAGE NO. 154

-21-
Calculation of Net Investment Return Assumption
Assumption Component
June 30, 2015 Recommended Values if Used only for Funding
(Net of Admin. Expenses)
June 30, 2015 Alternative Values for Financial Reporting
(Gross of Admin. Expenses)
Inflation 3.00% 3.00%
Plus Portfolio Real Rate of Return
5.26%
5.26%
Minus Expense Adjustment (0.40%) (0.28%)
Minus Risk Adjustment (0.36%) (0.48%)
Total 7.50% 7.50%
Confidence Level 54% 55%
Note that under both Option A and Option B the confidence level for financial reporting increases from
54% to 55% (because the risk adjustment increases from 0.36% to 0.48%). The difference is that under
Option A the same confidence level increase would apply for funding purposes, along with the addition of
an explicit loading on the contribution rates for administrative expenses.
MASTER PAGE NO. 155

-22-
C. SALARY INCREASE
Salary increases impact plan costs in two ways: (i) by increasing members’ benefits (since benefits are a
function of the members’ highest average pay) and future normal cost collections; and (ii) by increasing
total active member payroll which in turn generates lower UAAL contribution rates. These two impacts
are discussed separately below.
As an employee progresses through his or her career, increases in pay are expected to come from three
sources:
1. Inflation – Unless pay grows at least as fast as consumer prices grow, employees will experience a
reduction in their standard of living. There may be times when pay increases lag or exceed inflation,
but over the long term, labor market forces may require an employer to maintain its employees’
standards of living.
As discussed earlier in this report, we are recommending that the assumed rate of inflation be
reduced from 3.25% to 3.00%. This inflation component is used as part of the salary increase
assumption.
2. Real “Across the Board” Pay Increases – These increases are typically termed productivity increases
since they are considered to be derived from the ability of an organization or an economy to produce
goods and services in a more efficient manner. As that occurs, at least some portion of the value of
these improvements can provide a source for pay increases. These increases are typically assumed to
extend to all employees “across the board.” The State and Local Government Workers Employment
Cost Index produced by the Department of Labor provides evidence that real “across the board” pay
increases have averaged about 0.5% - 0.7% annually during the last ten to twenty years.
We also referred to the annual report on the financial status of the Social Security program published
in July 2014. In that report, real “across the board” pay increases are forecast to be 1.1% per year
under the intermediate assumptions.
The real pay increase assumption is generally considered a more “macroeconomic” assumption, that
is not necessarily based on individual plan experience. However, recent salary experience with public
systems in California as well as anecdotal discussions with plans and plan sponsors indicate lower
future real wage growth expectations for public sector employees.
MASTER PAGE NO. 156
-23-
Considering these factors, we recommend reducing the real “across the board” salary increase
assumption from 0.75% to 0.50%. This means that the combined inflation and “across the
board” salary increase assumption will decrease from 4.00% to 3.50%.
3. Promotional and Merit Increases – As the name implies, these increases come from an employee’s
career advances. This form of pay increase differs from the previous two, since it is specific to the
individual. For VCERA, there are service-specific merit and promotional increases. These
assumptions have been reviewed as part of our triennial experience study as of June 30, 2015.
Recommended promotional and merit assumptions are provided as part of our triennial
experience analysis.
All three of these forces will be incorporated into a salary increase assumption which is applied in the
actuarial valuation to project future benefits and future normal cost contribution collections.
Active Member Payroll
Projected active member payrolls are used to develop the UAAL contribution rate. Future values are
determined as a product of the number of employees in the workforce and the average pay for all
employees. The average pay for all employees increases only by inflation and real “across the board” pay
increases. The promotional and merit increases are not an influence, because this average pay is not
specific to an individual.
We recommend that the active member payroll increase assumption be decreased from 4.00% to
3.50% annually, consistent with the combined inflation plus real “across the board” salary increase
assumptions.
5354675v4/05325.110
MASTER PAGE NO. 157

900 Veterans Blvd. | Ste. 340 | Redwood City, CA 94063-1741 | TEL: 650.364.7000 | www.nepc.com
CAMBRIDGE | ATLANTA | CHARLOTTE | CHICAGO | DETROIT | LAS VEGAS | SAN FRANCISCO
To: Ventura County Employees’ Retirement Association
From: Dan LeBeau, Allan Martin, and Tony Ferrara, CAIA
Date: May 11, 2015
Subject: VCERA Securities Lending Program Update
Background The Ventura County Employees’ Retirement Association (the ‘Plan’) currently participates in a securities lending program offered by the Plan’s custodian bank, State Street Corporation, and has since 1997. The Quality D Short Term Investment Fund (STIF) is the pool that is used for investment of the cash collateral received from borrowers. In the wake of the global financial crisis, the Quality D pool was split into two pieces, one of which included securities trading at par with short-term maturities (the Liquidity pool), and a second (the Duration pool) that included longer dated maturities of asset-backed securities not trading at par. To date, more than 90% of the Duration pool investments have matured at par. As of May 7, 2015, the NAV of the Duration pool was $0.9645, which is an increase from the $0.95 valuation seen in the wake of the global financial crisis, but still below the $1.00 NAV that cash collateral pools are required to maintain to provide the liquidity necessary to allow investors to enter and exit without impacting other investors in the pool. The fact that the pool is trading below $1.00 is a direct result of the de-leveraging event that occurred in late 2008 and early 2009, as investors were forced to sell securities at significant discounts to meet cash flow needs. The longer dated securities that remain in the Duration pool are causing a current collateral deficiency of approximately $200,000, or less than one half of 0.01% of the Plan’s total assets. Historically, the Plan’s securities lending program generated income that was used to offset Plan expenses, and since 2001, the program has earned approximately $7.2 million for the Plan. Exhibit 1 on the following page shows the annual earnings from 2010 through 2014. Note that the program averaged $240,000 in annual earnings over this five-year period (approximately $1.2 million in total), with the peak coming in 2010. The majority of the $7.2 million in income was earned from 2001 – 2009. The decline in income over the past several years is the result of the Plan migrating away from separately managed accounts into commingled funds, which by their nature are not lendable.
MASTER PAGE NO. 158

Exhibit 1
Source: State Street; current revenue split is 70% to VCERA/30% to State Street Historically, the Plan had more of its assets invested via separately managed accounts, which provided a significant lendable asset base. Today, the lendable base of assets, or those assets eligible to be lent, is approximately $768 million or ~18% of Plan assets. However, two of the portfolios that are eligible to lend securities (Loomis Sayles Global Fixed Income and PIMCO Global Fixed Income) have been recommended for termination, and after that is complete, the lendable asset base will be approximately $550 million or ~13% of Plan assets. As of March 31, 2015, there was approximately $76 million in assets out on loan (approximately 10% of the lendable asset base), and the termination of the global fixed income asset class will reduce the amount of assets out on loan by approximately $28 million (37%), resulting in a reduction in income of approximately $36,000/annum, bringing expected annual earnings to approximately $100,000/annum. Outlook for Securities Lending Program Going Forward The Plan invested a large portion of its equity and fixed income allocations via separately managed portfolios in the past, which provided a larger asset base for lending. As the Plan has evolved, allocations to traditional equities and fixed income strategies have changed, and the portfolios that currently comprise those areas are now mostly commingled investment vehicles, reducing the asset base for lending and the potential for income generation. It should be noted that several of the Plan’s investments via commingled investment vehicles do participate in securities lending within the vehicle itself. Referring back to Exhibit 1, if one projects the 2015 income to be reduced by approximately $36,000/annum, the expected income for VCERA is approximately $100,000/annum, which is considerably less than the average $240,000 the Plan has earned annually since 2010. Additionally, the low level of assets available for lending going forward eliminates the possibility of exploring a separately managed collateral pool for the Plan. State Street only offers separately managed collateral pool management for significant pools of assets. The only option available to the Plan at the proposed level of assets is a fund managed similar to a 2a-7 money market fund, further reducing the expected income going forward. Securities lending income is often thought of as an offset to administrative fees for pension plans. Going forward, the Board should consider the level of income that is expected to be earned relative to the time commitment of Staff to administer and monitor the program. It is also important to note that the Plan would have to take its pro-rata share of the Duration
VCERA Securities Lending Income History
2014 2013 2012 2011 2010Gross Earnings 195,676 352,795 438,569 676,128 713,289Borrower Rebates 4,968 76,539 75,708 263,158 235,345Fees Paid to Agent 57,237 82,905 108,885 123,919 143,407Net Earnings 133,471 193,352 253,977 289,052 334,537
Fiscal Year
2
MASTER PAGE NO. 159
pool investments if it wished to exit the securities lending program at this time. These assets could be moved to an existing VCERA fixed income manager or State Street could be instructed to sell the investments. Based on current pricing of the investments, VCERA would need to inject approximately $200,000 (the current collateral deficiency resulting from the $0.9645 NAV of the Duration pool) to pay borrowers back the collateral pledged for loans from the Plan. Going forward, VCERA may elect to reserve securities lending income to offset any potential trading loss associated with the liquidation of Duration pool investments. Conclusion While securities lending offers a relatively low risk cash flow, it does represent an investment decision, and as such should be evaluated in a risk and return framework. In the long run, NEPC believes that securities lending is a viable market activity that can provide incremental earnings to clients who have considerable assets invested via separately managed portfolios. The Plan’s securities lending program has earned higher income historically, but going forward, income estimates are much lower due to the Plan’s change in structure and increased investment in commingled investment vehicles. In the near-term, in the absence of another liquidity crisis, the value of the Duration pool will return to $1.00 over time, and the Plan’s on-going participation in the securities lending program would allow the Plan to avoid the need to pay the collateral deficiency to make borrowers whole.
3
MASTER PAGE NO. 160

Ventura County Employees’ Retirement Association State Street Securities Finance Program Review May 18, 2015
MASTER PAGE NO. 161

Agenda
2
• Introduction to Securities Lending
• VCERA Performance
• Collateral Pool Review
MASTER PAGE NO. 162
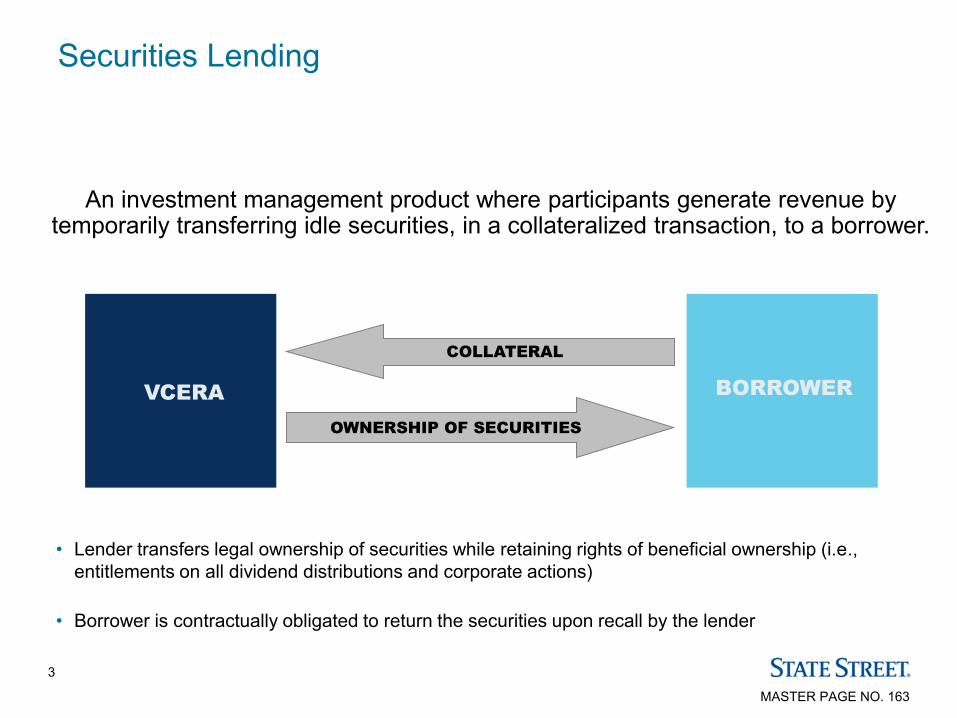
Securities Lending
3
An investment management product where participants generate revenue by temporarily transferring idle securities, in a collateralized transaction, to a borrower.
BORROWER
OWNERSHIP OF SECURITIES
COLLATERAL
BORROWER VCERA
• Lender transfers legal ownership of securities while retaining rights of beneficial ownership (i.e., entitlements on all dividend distributions and corporate actions)
• Borrower is contractually obligated to return the securities upon recall by the lender
MASTER PAGE NO. 163

Fundamentals of Securities Finance One Day Sample Transaction Diagram
4
Yield – Rebate = Total Spread
0.30% - 0.05% = 0.25% (25 bps)
Collateral delivered at 102% $10,200,000
Loaned securities (XYZ Corp.)
50%
50%
Yield – Fed Funds Rate = Investment Spread
0.30% - 0.15% = 0.15% (15 bps)
Fed Funds Rate – Rebate = Demand Spread
0.15% - 0.05% = 0.10% (10 bps)
Morgan Stanley
Client
Securities Finance
Rebate: 0.05% (0.05%/360 * $10,200,000)
Interest Due: $14
$85 - $14 = $71
$35.50
$35.50
Morgan Stanley
Collateral Fund Collateral yield: 0.30%
Earnings: $85
State Street
$10,200,000 delivered to SSgA
Collateral Yield and Rebate Rate are annualized using a 360 – day basis. MASTER PAGE NO. 164

Fundamentals of Securities Lending How are Earnings Generated?
5
Cash collateral is posted by the borrower at the inception of the lending transaction
State Street pays interest (the “rebate”) on the cash to the borrower at a rate that reflects the supply/demand characteristics of the loaned security
State Street invests this cash collateral according to the client’s investment guidelines
The difference between the yield on the investment of the cash and the interest paid to the borrower represents the earnings or “spread”
MASTER PAGE NO. 165

VCERA Performance
6
MASTER PAGE NO. 166
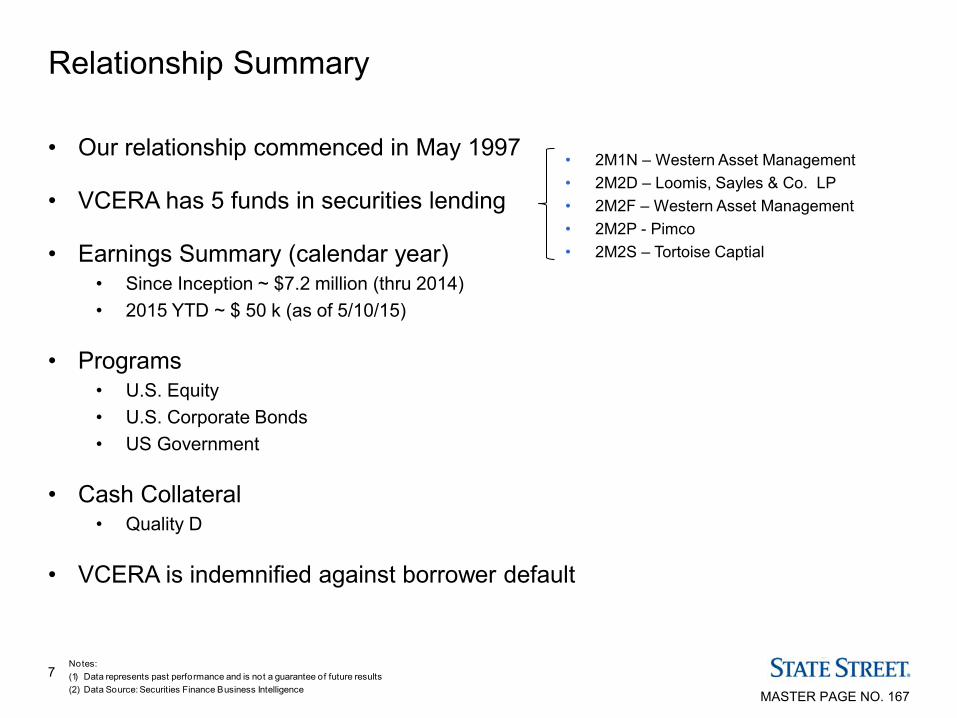
Relationship Summary
7
• Our relationship commenced in May 1997
• VCERA has 5 funds in securities lending
• Earnings Summary (calendar year) • Since Inception ~ $7.2 million (thru 2014) • 2015 YTD ~ $ 50 k (as of 5/10/15)
• Programs • U.S. Equity • U.S. Corporate Bonds • US Government
• Cash Collateral • Quality D
• VCERA is indemnified against borrower default
• 2M1N – Western Asset Management • 2M2D – Loomis, Sayles & Co. LP • 2M2F – Western Asset Management • 2M2P - Pimco • 2M2S – Tortoise Captial
Notes:(1) Data represents past performance and is not a guarantee of future results(2) Data Source: Securities Finance Business Intelligence MASTER PAGE NO. 167

VCERA’s Securities Lending Performance
8
Ventura County Employees' Retirement Association
FY 2012 FY 2013 FY 2014 FYTD 2015Average Lendable ($) 516,751,388 401,002,866 436,258,771 507,012,696 Average On Loan ($) 110,635,811 83,525,670 54,867,910 60,681,649 Utilization 21.4% 20.8% 12.6% 12.0%
Earnings by Program ($)
US Equity & Corp. Bond 120,568 118,240 93,505 61,182 US Government & Agency 133,404 70,991 32,331 22,280 Non-US Fixed 4 4,121 7,635 3,950 Total Earnings 253,976 193,352 133,471 87,413
Components of Spread (bps)
Demand Spread 6 10 16 10 Reinvestment Spread 26 22 18 17 Net Spread 32 32 34 27
Return to Lendable (bps) 4.9 4.8 3.1 2.3
Notes:(1) FYTD 2015 Data includes July 2014 - M arch 2015(2) Risk-Free rate used for spread calculat ions is Fed Funds Open(3) Data represents past performance and is not a guarantee of future results(4) Data Source: Securit ies Finance Business Intelligence
MASTER PAGE NO. 168

Lendable and On Loan Trend Q1 2012 – Q1 2015
9 Notes:(1) Data represents past performance and is not a guarantee of future results(2) Data Source: Securities Finance Business Intelligence
-
100,000,000
200,000,000
300,000,000
400,000,000
500,000,000
600,000,000
On Loan Balance Lendable Assets
MASTER PAGE NO. 169

Program Update
10
MASTER PAGE NO. 170

Source: Securities Finance Business Intelligence
Large and Diverse Program
11
Assets Available for Loan Approximately $3.3 trillion
As of March 31, 2015
On Loan Balances Approximately $353 billion
Currency reflected in U.S. dollars
10%
58%
6%
25%
US GovernmentUS Corp Bond & EquityNon-US Fixed IncomeNon-US Corp Bond & Equity
34%
38%
15%
14%
US GovernmentUS Corp Bond & EquityNon-US Fixed IncomeNon-US Corp Bond & Equity
MASTER PAGE NO. 171

Global Presence
• Approximately 314 active agency and principal clients worldwide
• Approximately 126 borrower relationships
• Lending across more than 30 international markets
• 9 regional locations with 5 trading desks and 3 full service operations centers
• Approximately 236 employees dedicated specifically to securities lending activities
12
As of March 31, 2015
• Full Service Center • Relationship Management Office • Relationship Management and Trading Office • Relationship Management and Operations
• Boston, Massachusetts (World Headquarters) • Los Angeles, California • Toronto, Ontario
• Dublin, Ireland • London, England
Europe/Middle-East/Africa
• Hong Kong, China • Sydney, Australia • Tokyo, Japan • Singapore, Singapore
Asia/Pacific
The Americas
MASTER PAGE NO. 172

Collateral Pool
13
MASTER PAGE NO. 173

Quality Investment Fund D
GLSTND-1617
FC14 – Quality D Summary Characteristics
Corporate Obligation
4.59%
Certificate of Deposit
48.48%
ABCP 17.83%
Commercial Paper 5.87%
Repurchase Agreement 13.99%
Time Deposit 3.66%
Long-term Ratings % of Fund
AAA — AA 11.84 A 26.20 BBB+ — BBB — BBB- — BB+ — BB — BB- — Short-term Ratings % of Fund A-1+/P-1 6.24 A-1/P-1 47.51 SPLIT — Other 8.22
As of March 31, 2015
1-Day Yield1 0.28% Par Position + Uninvested Cash (in millions) 10,847.94 Floating Rate 48.13 Foreign Issuers2 17.92 Weighted Average Maturity (WAM)3 38 Weighted Average Life (WAL)4 136 Fund Price as of 3/31/15 1.00 Number of Holdings 73
Liquidity Schedule % of Fund
Next Business Day (1 Day) 16.03 2–7 Days Liquidity 1.15 8–14 Days Liquidity 1.43 15–21 Days Liquidity 0.55 22–28 Days Liquidity 3.69 29–35 Days Liquidity 1.85 36–60 Days Liquidity 6.00 61–90 Days Liquidity 15.61 Greater than 90 Days Liquidity 53.67 90 Day Liquidity 46.33
Bank Note 5.59%
Source: SSgA, Bloomberg. Ratings are from Bloomberg and are S&P. Past performance is not a guarantee of future results. 1 1 Day yield does not include Management Fees 2 All YCD's and Repo are being reported as Domestic and thus not included in the % Foreign Issuers 3 Weighted Average Maturity (WAM): aggregation of WAM of underlying securities in fund defined as (1) Floating rate securities: Next Reset Date - Current Date; (2) Fixed Rate: Maturity Date - Current Date defined in days 4 Weighted Average Life (WAL): aggregation of WAL of underlying securities in fund defined as (1) Floating rate securities: Expected Maturity Date - Current Date; (2) Fixed Rate: Expected Maturity Date - Current Date (defined in days) This material is for your private information and may not be further disseminated without the express written consent of State Street Global Advisors. The views expressed are the views of the Global Cash Team through the period noted therein and are subject to change based on market and other conditions. Sector information/security type is an internal characterization created and applied by SSgA analysts for internal surveillance based on market convention and security characteristics. Sector information/security type designations may vary according to analyst or security characteristics, and they should not be construed as formal statements or interpretations of asset classes or sectors. All views may be impacted by the present market environment and risks including downgrades, extension risk, volatility, deviations from expected performance or other risks. This information is based on our internal research and third party sources. We make no representations or assurances that the information is complete or accurate, or that the underlying securities will perform as originally anticipated. All material has been obtained from sources believed to be reliable, but its accuracy is not guaranteed. All information is subject to change without notice. This information does not constitute an offer to sell or a solicitation of an offer to buy any security. No security may be sold nor may offers be accepted to buy except in accordance with the provisions of applicable securities laws and regulations. The information we provide does not constitute investment advice and it should not be relied on as such. It does not take into account any investor’s particular investment objectives, strategies, tax status or investment horizon. We encourage you to consult your tax or financial advisor. This email and any attachments are being sent by the Global Cash Team and may be privileged, confidential or proprietary. It is intended exclusively for the individual or entity to which it is addressed. If you are not the intended recipient, please notify the sender immediately by email, do not use or share the contents of this message and any attachments and delete all copies thereof. Subject to applicable law, SSGA reserves the right to access, monitor, review and retain electronic communications (EC), including but not limited to personal/private EC traveling through its networks/systems. SSGA will use this right reasonable and proportionately, when necessary and for legitimate reasons. The laws governing each sender/recipient may impact the handling of EC, and EC may be archived, supervised and produced in locations different than yours. This email should not be considered to be secure and therefore you should not provide any personal information, such as social security number, date of birth or other personal or financial information. IRS Circular 230 Disclosure: Please be advised that any discussion of US tax matters contained within this communication (including any attachments) is not intended or written to be used and cannot be used for the purpose of (i) avoiding US tax related penalties, or (ii) promoting, marketing or recommending to another party any transaction or matter addressed herein. Investing involves risk including the risk of loss of principal. The whole or any part of this work may not be reproduced, copied or transmitted or any of its contents disclosed to third parties without SSgA's express written consent. Characteristics are as of the date indicated, are subject to change, and should not be relied upon as current thereafter. Investments in asset backed and mortgage backed securities are subject to prepayment risk which can limit the potential for gain during a declining interest rate environment and increases the potential for loss in a rising interest rate environment.
14 MASTER PAGE NO. 174

Quality D Duration
GLSTND-1617
Source: SSGA, Bloomberg. Ratings are from Bloomberg and are S&P. Past performance is not a guarantee of future results. 1 1-Day yield does not include Management Fees 2 All YCD's and Repo are being reported as Domestic and thus not included in the % Foreign Issuers 3 Weighted Average Maturity (WAM): aggregation of WAM of underlying securities in fund defined as (1) Floating rate securities: Next Reset Date - Current Date; (2) Fixed Rate: Maturity Date - Current Date defined in days 4 Weighted Average Life (WAL): aggregation of WAL of underlying securities in fund defined as (1) Floating rate securities: Expected Maturity Date - Current Date; (2) Fixed Rate: Expected Maturity Date - Current Date (defined in days) This material is for your private information and may not be further disseminated without the express written consent of State Street Global Advisors. The views expressed are the views of the Global Cash Team through the period noted therein and are subject to change based on market and other conditions. Sector information/security type is an internal characterization created and applied by SSGA analysts for internal surveillance based on market convention and security characteristics. Sector information/security type designations may vary according to analyst or security characteristics, and they should not be construed as formal statements or interpretations of asset classes or sectors. All views may be impacted by the present market environment and risks including downgrades, extension risk, volatility, deviations from expected performance or other risks. This information is based on our internal research and third party sources. We make no representations or assurances that the information is complete or accurate, or that the underlying securities will perform as originally anticipated. All material has been obtained from sources believed to be reliable, but its accuracy is not guaranteed. All information is subject to change without notice. This information does not constitute an offer to sell or a solicitation of an offer to buy any security. No security may be sold nor may offers be accepted to buy except in accordance with the provisions of applicable securities laws and regulations. The information we provide does not constitute investment advice and it should not be relied on as such. It does not take into account any investor’s particular investment objectives, strategies, tax status or investment horizon. We encourage you to consult your tax or financial advisor. This email and any attachments are being sent by the Global Cash Team and may be privileged, confidential or proprietary. It is intended exclusively for the individual or entity to which it is addressed. If you are not the intended recipient, please notify the sender immediately by email, do not use or share the contents of this message and any attachments and delete all copies thereof. Subject to applicable law, SSGA reserves the right to access, monitor, review and retain electronic communications (EC), including but not limited to personal/private EC traveling through its networks/systems. SSGA will use this right reasonable and proportionately, when necessary and for legitimate reasons. The laws governing each sender/recipient may impact the handling of EC, and EC may be archived, supervised and produced in locations different than yours. This email should not be considered to be secure and therefore you should not provide any personal information, such as social security number, date of birth or other personal or financial information. IRS Circular 230 Disclosure: Please be advised that any discussion of US tax matters contained within this communication (including any attachments) is not intended or written to be used and cannot be used for the purpose of (i) avoiding US tax related penalties, or (ii) promoting, marketing or recommending to another party any transaction or matter addressed herein. Investing involves risk including the risk of loss of principal. The whole or any part of this work may not be reproduced, copied or transmitted or any of its contents disclosed to third parties without SSGA's express written consent. Characteristics are as of the date indicated, are subject to change, and should not be relied upon as current thereafter. Investments in asset backed and mortgage backed securities are subject to prepayment risk which can limit the potential for gain during a declining interest rate environment and increases the potential for loss in a rising interest rate environment.
FC4J – Quality D Duration Summary Characteristics
Long-term Ratings % of Fund
AAA 10.92 AA 26.79 A 53.06 BBB+ — BBB 1.18 BBB- — BB+ — BB — BB- — Short-term Ratings % of Fund A-1+/P-1 — A-1/P-1 — SPLIT — Other 8.06
As of March 31, 2015
1-Day Yield1 0.49% Par Position + Uninvested Cash (in millions) 474.10 Floating Rate 99.01 Foreign Issuers2 71.79 Weighted Average Maturity (WAM)3 43 Weighted Average Life (WAL)4 2,131 Fund Price as of 3/31/15 0.97 Number of Holdings 28
Liquidity Schedule % of Fund Next Business Day (1 Day) 1.00 2–7 Days Liquidity 0.00 8–14 Days Liquidity 0.00 15–21 Days Liquidity 0.00 22–28 Days Liquidity 0.00 29–35 Days Liquidity 0.00 36–60 Days Liquidity 0.00 61–90 Days Liquidity 1.18 Greater than 90 Days Liquidity 97.82 90 DAY LIQUIDITY 2.18
Asset-Backed 99.01%
Money Market Fund 1.00%
15 MASTER PAGE NO. 175

16
Quality D Collateral Pool Allocation • December 31, 2010 collateral pool allocation
• Liquidity Pool ~ $152.9 (68.9%) • Duration Pool ~ $ 69.0 (31.1%)
• December 31, 2011 allocation • Liquidity Pool ~ $ 64.7 (73.7%) • Duration Pool ~ $ 23.0 (26.3%)
• December 31, 2012 allocation • Liquidity Pool ~ $ 58.9 (85.6%) • Duration Pool ~$ 9.8 (14.4%)
• December 31, 2013 allocation • Liquidity Pool ~ $ 43.5 (84.7%) • Duration Pool ~ $ 7.8 ( 5.36%)
• December 31, 2014 collateral pool allocation • Liquidity Pool ~ $ 47.9 (89.3%) • Duration Pool ~ $ 5.7 (10.7%)
• April 30, 2014 collateral pool allocation • Liquidity Pool ~ $ 64.3 (92.5%) • Duration Pool ~ $ 5.2 ( 7.5%)
• The Quality D duration fund has received over $9.0 b in maturities and pay-downs
• The collateral pools have not experienced any defaults
16
MASTER PAGE NO. 176

Information Classification: Limited Access
17
Important Disclosures
This communication is not intended for retail clients, nor for distribution to, and may not be relied upon by, any person or entity in any jurisdiction or country where such distribution or use would be contrary to applicable law or regulation. This publication or any portion hereof may not be reprinted, sold or redistributed without the prior written consent of State Street Bank and Trust Company. This document is a general marketing communication. It is not intended to suggest or recommend any investment or investment strategy, does not constitute investment research, nor does it purport to be comprehensive or intended to replace the exercise of an investor’s own careful independent review regarding any investment decision. This document is confidential and is intended for distribution to professional investors only. This document and the information herein does not constitute investment, legal, or tax advice and is not a solicitation to buy or sell securities nor is it intended to constitute a binding contractual arrangement or commitment by State Street of any kind. The information provided does not take into account any particular investment objectives, strategies, investment horizon or tax status. The views expressed herein are the views of State Street Global Markets as of the date specified and are subject to change based on market and other conditions. The information provided herein has been obtained from sources believed to be reliable at the time of publication, nonetheless, we make no representations or assurances that the information is complete or accurate, and you should not place any reliance on said information. State Street Bank and Trust Company hereby disclaims all liability, whether arising in contract, tort or otherwise, for any losses, liabilities, damages, expenses or costs arising, either direct or consequential, from or in connection with any use of this document and/or the information herein. This document may contain statements deemed to be forward-looking statements. These statements are based on assumptions, analyses and expectations of State Street Global Markets in light of its experience and perception of historical trends, current conditions, expected future developments and other factors it believes appropriate under the circumstances. All information is subject to change without notice. Clients should be aware of the risks of participating in securities lending, which may include counterparty, collateral, investment loss, tax and accounting risks. A securities lending program description and risks statement is available. Past performance is no guarantee of future results. This document has not been prepared in accordance with the legal requirements designed to promote the independence of investment research and is not subject to any prohibition on dealing ahead of investment research. State Street Global Markets is the marketing name and a registered trademark of State Street Corporation, used for its financial markets business and that of its affiliates. Products and services may not be available in all jurisdictions.
MASTER PAGE NO. 177

18
THANK YOU!
MASTER PAGE NO. 178

To: Ventura County Employees’ Retirement Association (“VCERA”) Board
From: Dan LeBeau, Allan Martin, and Tony Ferrara, CAIA
Date: May 14, 2015
Subject: Global Tactical Asset Allocation Manager Search
Recommendation NEPC recommends the Ventura County Employees’ Retirement Association (“VCERA” or the “Plan”) give consideration to investing approximately $130 million in the PIMCO All Asset All Authority and Bridgewater Optimal strategies, and approximately $175 million in the Standard Life Global Absolute Return Strategy (GARS), to manage the Plan’s recently approved 10% target allocation to global tactical asset allocation (“GTAA”) strategies. Background At the Board meeting held in February, the Board approved new long-term asset allocation targets that included a 10% allocation to GTAA strategies. As of March 31, 2015, this equates to approximately $435 million. The recommendations detailed on the following pages seek to implement the allocation in the most cost conscious and efficient manner, recognizing current limitations of VCERA staff resources and the desire to implement in a timely manner. Summary of Managers Profiled PIMCO All Asset All Authority: NEPC FPL Strategy. The PIMCO All Asset All Authority Fund is focused on capturing opportunities for mean reversion in asset class prices while utilizing Research Affiliate’s proprietary fundamental based quantitative asset allocation model. The quantitative asset allocation model identifies mis-pricings in global capital markets and the risk/return potential of underlying PIMCO investment strategies. In addition, Research Affiliate’s unique business cycle model informs the Fund’s positioning based on expected cyclical economic trends. The cumulative output of these models is a portfolio with a focus on real returns and high expected Sharpe Ratios that historically has mitigated large market downturns. Standard Life Global Absolute Return Strategy GTAA: NEPC FPL Strategy. Standard Life’s Global Absolute Return Strategy (GARS) seeks underlying investment strategies that are highly liquid and scalable to a multi-billion dollar portfolio. The strategy is benchmark agnostic and includes all global assets and instruments that meet their liquidity criteria. Investment themes include but are not limited to market betas such as equity, credit, and interest rates, relative value positions such as alpha overlays, and directional trades which may include currency positions. GARS is a multi-asset strategy with both traditional and
900 Veterans Blvd. | Ste. 340 | Redwood City, CA 94063-1741 | TEL: 650.364.7000 | www.nepc.com
BOSTON | ATLANTA | CHARLOTTE | CHICAGO | DETROIT | LAS VEGAS | SAN FRANCISCO
MASTER PAGE NO. 179

non-traditional return sources and targets a return of cash plus 5% with a desired volatility of half to a third of that of public equities.
Bridgewater Optimal Portfolio: Neutral rating for the strategy pending approval from the NEPC Due Diligence Committee. Bridgewater’s Optimal Portfolio is a new strategy that combines the beta portfolio of the All Weather strategy and the fundamental-based, systematic alpha models that represent the foundation for the Pure Alpha and Pure Alpha Major Market strategies. The alpha signals for the Optimal Portfolio differ from the signals used for the Pure Alpha strategies and are ideally structured to be negatively correlated to the strategic All Weather beta portfolio. The Optimal Portfolio alpha signals are tailored to complement the beta portfolio of All Weather and generally are initiated as short risk premium trades, which are designed to both increase return and reduce portfolio risk. While both the All Weather and Pure Alpha strategies are rated as preferred strategies by NEPC Research, we are initiating a Neutral rating for the Optimal Portfolio. The neutral rating is largely due to the lack of a live track record for the Optimal Portfolio. The concept of the Optimal Portfolio is intuitively appealing as the benefits of combining negatively correlated or uncorrelated alpha positions with a strategic beta allocation are undeniable. However, we believe it is prudent to assess the intuitive attractiveness of this approach by verifying it through live performance and validating Bridgewater’s ability to effectively blend these two return streams as their philosophy historically had been quite strident in preserving the distinct separation of alpha and beta.
Manager Selection Process The process began with a review of our Focused Placement List for GTAA strategies. NEPC Focused Placement List (FPL) Strategies are those strategies that have been vetted by the respective research analyst/consultant and NEPC’s Due Diligence Committee, and subsequently approved for broad application across NEPC’s client base. FPL strategies represent the highest conviction managers with whom we have thoroughly reviewed and believe have investment theses that present a competitive advantage in their respective areas of opportunity. Note that NEPC does not receive any compensation from investment managers as a result of their inclusion on our FPL, nor does inclusion on the FPL guarantee that the investment manager will ultimately be awarded a mandate with an NEPC client. FPLs are continuously monitored throughout the year, and officially updated once per year. Currently, NEPC’s FPL for GTAA strategies includes 9 managers representing 14 different strategies. In addition to the list of managers on our FPL, we also evaluated strategies offered by the Plan’s existing managers in an effort to limit the number of managers employed by VCERA and explore any potential fee discounts resulting from multiple mandates. The result was the addition of the Bridgewater Optimal Portfolio, which has not been approved for broad distribution across our client base, but has been rated by our research group as neutral. Since the underlying strategies used to construct the Optimal Portfolio (All Weather and Pure Alpha) are rated as preferred strategies by NEPC, we are comfortable recommending the Optimal Portfolio despite the neutral rating by research. Finally, we received a request to consider one additional manager that is not included on our FPL list currently. After considerable analysis, we opted to not move forward with this manager.
2
MASTER PAGE NO. 180

After consideration of the aforementioned strategies, we had several internal discussions with our Director of Asset Allocation and GTAA Research Consultant to consider his view of the GTAA landscape, VCERA’s current asset allocation and risk tolerance, and discuss potential manager combinations. During these discussions, we were able to narrow the list of potential managers to four strategies for consideration. Once the list was narrowed to four strategies, additional analysis was conducted to determine the best “fit”, or combination of managers to fill the allocation. We used our proprietary active risk budgeting analysis to analyze each manager’s alpha contribution net of beta exposure as we recognize that beta exposure changes over time. Active Risk Budgeting is a tool that helps us understand the alpha structure within an asset class construct (across a group of managers). This helps to understand the contribution to active risk by each manager and the interaction of various manager strategies. We do not believe this analysis should be used on a stand-alone basis, but it is a useful complement to the qualitative analysis conducted on active investment strategies. The result of the analysis is that a mix of 40% Standard Life, 30% PIMCO, and 30% Bridgewater provides the best diversification from an active risk standpoint, and also results in a more evenly balanced contribution to active risk than the other mixes that were considered. In addition, this mix resulted in the lowest correlation with VCERA’s Total Plan returns over the time period examined (Correlation = 0.74).
Alpha CorrelationsPIMCO - All
Asset All Authority
SLI - GARSBridgewater -
Optimal Portfolio
PIMCO - All Asset All Authority 1.00 0.13 0.00
SLI - GARS 0.13 1.00 0.00
Bridgewater - Optimal Portfolio 0.00 0.00 1.00
3
MASTER PAGE NO. 181

*Using net of fee data from Jan. 2008-Dec. of 2014. Bridgewater results are simulated using returns of the All-Weather strategy and Pure Alpha strategies. Finally, we looked at the effect on manager fees that VCERA would pay as a result of funding these three new mandates, considering the source of funding. The overall effect would be an increase of about 7 basis points (0.07%), or approximately $3 million at the Total Plan level. See the respective proposed management fees in the table below.
Firm/Product Vehicle Proposed Reported Fee Reported Fee in (bps)
Global Asset Allocation Bridgewater - BOP Separate Account 1,300,000 100
PIMCO - All Asset All Auth Mutual Fund 1,599,000 123
SLI Ltd - GARS GTAA Separate Account 1,260,000 72 Conclusion NEPC recommends the Plan give consideration to retaining PIMCO, Bridgewater, and Standard Life to manage the Fund’s allocation to GTAA strategies. The proposed allocation would be approximately $130 million to PIMCO and Bridgewater, and $175 million to Standard Life, accounting for the entire 10% target allocation, or approximate $435 million.
PIMCO - All Asset All Authority
30%
SLI - GARS40%
Bridgewater -Optimal Portfolio
30%
Active Portfolio - Dollar Allocation
PIMCO - All Asset All Authority
39%
SLI - GARS38%
Bridgewater -Optimal Portfolio
23%
Active Portfolio - Risk Allocation
4
MASTER PAGE NO. 182

Appendix – Data as of December 31, 2014
Net of Fee Performance Data as of 12/31/2014
*Conservative Blended: 40% Barclays Capital Aggregate, 30% Barclays Capital 1-10 Year TIPS, 10% S&P 500, 10% Barclays Capital High Yield and 10% JPM EMBI+
*Conservative Blended: 40% Barclays Capital Aggregate, 30% Barclays Capital 1-10 Year TIPS, 10% S&P 500, 10% Barclays Capital High Yield and 10% JPM EMBI+
5
MASTER PAGE NO. 183

*Conservative Blended: 40% Barclays Capital Aggregate, 30% Barclays Capital 1-10 Year TIPS, 10% S&P 500, 10% Barclays Capital High Yield and 10% JPM EMBI+
*Conservative Blended: 40% Barclays Capital Aggregate, 30% Barclays Capital 1-10 Year TIPS, 10% S&P 500, 10% Barclays Capital High Yield and 10% JPM EMBI+
6
MASTER PAGE NO. 184

One Glendinning PlaceWestport, CT 06880
(203) 226-3030www.bwater.com
Optimal Portfolio Strategy
May 18, 2015
Presented to:
MASTER PAGE NO. 185

- 2 -
BRIDGEWATER OVERVIEW
Institutional investment manager, founded in 1975
Deep fundamental understanding of markets
Consistency of people, process, and risk controls
Focused approach to constructing portfolios
Managing Pure Alpha for 24 years
Managing All Weather for 19 years
Launched Optimal Portfolio in 2015
MASTER PAGE NO. 186
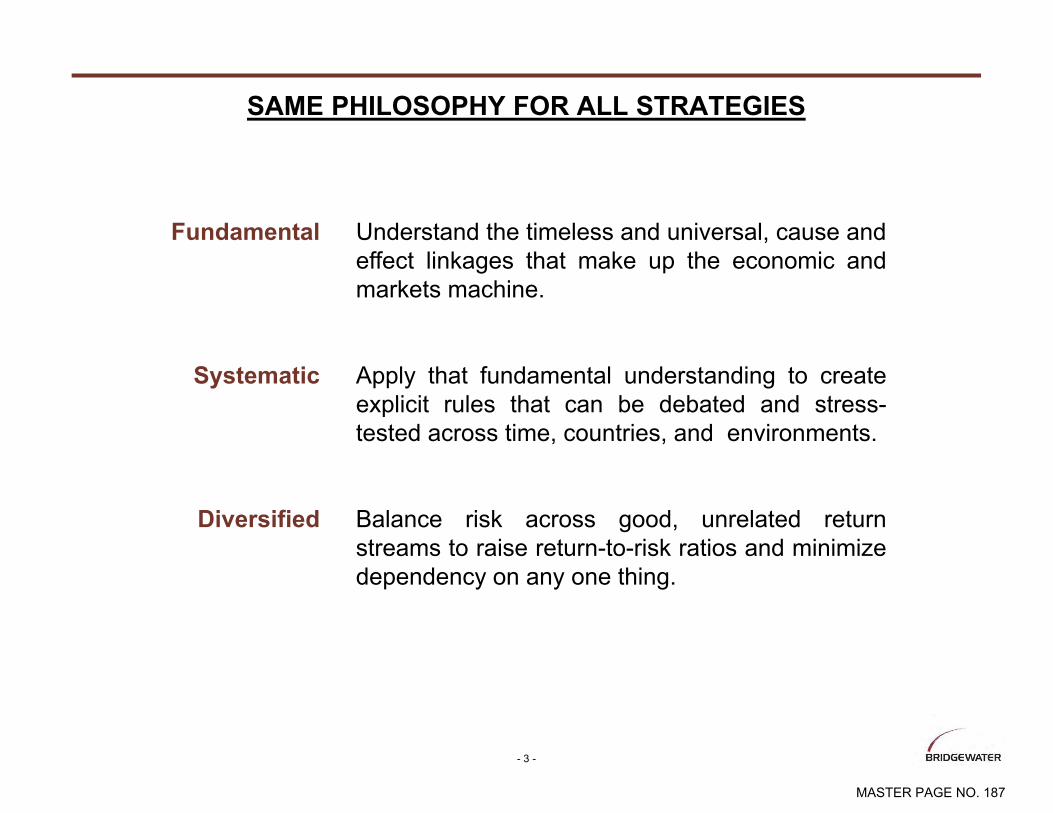
- 3 -
SAME PHILOSOPHY FOR ALL STRATEGIES
Understand the timeless and universal, cause andeffect linkages that make up the economic andmarkets machine.
Apply that fundamental understanding to createexplicit rules that can be debated and stress-tested across time, countries, and environments.
Balance risk across good, unrelated returnstreams to raise return-to-risk ratios and minimizedependency on any one thing.
Fundamental
Systematic
Diversified
MASTER PAGE NO. 187

- 4 -
ALL WEATHER HAS A LONG AND CONSISTENT TRACK RECORD
Strategic asset allocation (“beta”).
Balances asset classes with opposing sensitivities to surprises in the
economic environment (growth and inflation).
That creates an efficiency that allows for better than equity-like returns for
about 1/3 less risk.
Past performance is not indicative of future results. Please review the “Important Disclosures and Other Information” located at the end of this presentation.
0%
20%
40%
60%
80%
100%
120%
140%
160%
180%
96 97 98 99 00 01 02 03 04 05 06 07 08 09 10 11 12 13 14 15
Environmentally Balanced Portfolio All Weather Strategy Cumulative Total Return (Net of Fees, ln)
Total Return 8.7%Excess Return 6.1%Standard Deviation 10.4%Ratio 0.59
Performance (annualized)
Performance shown through April 2015.
Growth Inflation
Rising
Falling
Risk Premiums & Discount Rates
25% of RiskEquities CommoditiesCorporate CreditEM Credit
25% of RiskBreakeven InflationIL BondsCommoditiesEM Credit
25% of RiskNominal BondsIL Bonds
25% of RiskNominal BondsEquities
MASTER PAGE NO. 188

- 5 -
BRIDGEWATER HAS A LONG TRACK RECORD OF BEATING THE MARKETS WITH TACTICAL VIEWS (“ALPHA”)
Using a time tested collection of tactical views to generate high, consistent, and very diversifying returns.
Proven risk management through multiple crises.
European ERM
Mexican Peso Crisis
Yen Crisis
Asian Crisis
Long-Term Capital Failure
Tech Bubble and September 11th
Credit and Banking Crisis
European SovereignDebt Crisis
0.0
0.5
1.0
1.5
2.0
2.5
1991 1993 1995 1997 1999 2001 2003 2005 2007 2009 2011 2013 2015
Cum
ulat
ive
Log
Ret
urn
Pure Alpha Strategy @ 12% Target Volatility (Net of Fees Total Return)
AnnualizedTotal Return 9.9% Excess Return 6.9% Standard Deviation 10.1% Ratio 0.69
Performance is net of fees and estimated through Apr 2015. Standard deviation is calculated using gross of fees performance. Information ratio is calculated using the annualized standard deviation of gross of fees performance.Past results are not necessarily indicative of future results. HYPOTHETICAL OR SIMULATED PERFORMANCE RESULTS HAVE CERTAIN INHERENT LIMITATIONS. UNLIKE AN ACTUAL PERFORMANCE RECORD, SIMULATEDRESULTS DO NOT REPRESENT ACTUAL TRADING OR THE COSTS OF MANAGING THE PORTFOLIO. ALSO, SINCE THE TRADES HAVE NOT ACTUALLY BEEN EXECUTED, THE RESULTS MAY HAVE UNDER OR OVERCOMPENSATED FOR THE IMPACT, IF ANY, OF CERTAIN MARKET FACTORS, SUCH AS LACK OF LIQUIDITY. SIMULATED TRADING PROGRAMS IN GENERAL ARE ALSO SUBJECT TO THE FACT THAT THEY AREDESIGNED WITH THE BENEFIT OF HINDSIGHT. NO REPRESENTATION IS BEING MADE THAT ANY ACCOUNT WILL OR IS LIKELY TO ACHIEVE PROFITS OR LOSSES SIMILAR TO THOSE SHOWN. Please review the“Important Disclosures and Other Information” located at the end of this presentation.
1 2 3 45
6-10
16-17
13-15
18-23
24-26
27
28
31
32-545556-82
83-85
86
87
88-94
95-103
105-114
115
116-122
123-124125-127
128-134
29-30
Nominal Interest Rates (Directional)
DevelopedCurrencies
Emerging Currencies
Commodities
Equities
Sovereign and Corporate Credit
Inflation-LinkedBonds
Nominal Interest Rates (Spread)
11-12
104
Diversification of Active Opportunities Pure Alpha Performance
MASTER PAGE NO. 189

- 6 -
All Weather
Nominal Interest Rates (Directional)
1-8
Nominal Interest Rates (Spread)
9-12
Equities (Directional)
13-22
Equities (Spread)
23-32
Equities vs. Bonds (Spread)
33-37
Sovereign& CorpCredit38-40
Commodities41-56
Emerging Currencies
57-63
Developed Currencies
64-77
Please review the “Important Disclosures and Other Information” located at the end of this presentation.
OPTIMAL PORTFOLIO COMBINES BRIDGEWATER’S ALL WEATHER WITH TAILORED TACTICAL VIEWS
We expect over time that about half of the portfolio’s risk will come from All Weather and about half will come from the tailored tactical views.
Over the long term, we expect the portfolio to produce roughly an 8% net of fees total return and to be very diversifying to markets and managers.
Tailored AlphasGrowth Inflation
Rising
Falling
Risk Premiums & Discount Rates
25% of RiskEquities CommoditiesCorporate CreditEM Credit
25% of RiskBreakeven InflationIL BondsCommoditiesEM Credit
25% of RiskNominal BondsIL Bonds
25% of RiskNominal BondsEquities
MASTER PAGE NO. 190

- 7 -
-100%
0%
100%
200%
300%
400%
500%
1991 1995 1999 2003 2007 2011 2015 2019
HISTORY OF DELIVERING ON EXPECTATIONSBridgewater Pure Alpha Strategy 12% Volatility
Gross Cumulative Alpha vs. Expectations (ln)
-50%
0%
50%
100%
150%
200%
250%
300%
1996 1999 2002 2005 2008 2011 2014 2017 2020
Bridgewater All Weather Strategy 10% VolatilityGross Cumulative Excess Return vs. Expectations (ln)
Bridgewater Optimal Portfolio Strategy 10% VolatilityGross Cumulative Excess Return vs. Expectations (ln)
-50%
0%
50%
100%
150%
200%
250%
2015 2018 2021 2024 2027 2030
Dec '91 - Apr '15 Actual Expected
Excess Return 11.8% 12.0%Volatility 10.1% 12.0%Ratio 1.17 1.00
Jun '96 - Apr '15 Actual Expected
Excess Return 6.7% 6.5%Volatility 10.4% 10.0%Ratio 0.64 0.65
Feb '15 - Apr '15 Actual (3month)
Expected (Ann.)
Excess Return 2.4% 9.0%Volatility - 10.0%Ratio - 0.90
HYPOTHETICAL OR SIMULATED PERFORMANCE RESULTS HAVE CERTAIN INHERENT LIMITATIONS. UNLIKE AN ACTUAL PERFORMANCE RECORD, SIMULATED RESULTS DO NOT REPRESENT ACTUAL TRADING ORTHE COSTS OF MANAGING THE PORTFOLIO. ALSO, SINCE THE TRADES HAVE NOT ACTUALLY BEEN EXECUTED, THE RESULTS MAY HAVE UNDER OR OVER COMPENSATED FOR THE IMPACT, IF ANY, OF CERTAINMARKET FACTORS, SUCH AS LACK OF LIQUIDITY. SIMULATED TRADING PROGRAMS IN GENERALARE ALSO SUBJECT TO THE FACT THAT THEY ARE DESIGNED WITH THE BENEFIT OF HINDSIGHT. NOREPRESENTATION IS BEING MADE THAT ANY ACCOUNT WILL OR IS LIKELY TO ACHIEVE PROFITS OR LOSSES SIMILAR TO THOSE SHOWN. Past performance is not indicative of future results. Please review the “ImportantDisclosures and Other Information” located at the end of this presentation.
MASTER PAGE NO. 191

- 8 -
ADDING TAILORED ALPHA CREATES A STRAIGHTER LINE
Performance shown through April 2015. Please note the returns shown for the Beta Component prior to February 2015 are simulated using the All Weather Asset Mix (see All Weather Asset Mix Disclosure). Please note the returnsshown for Optimal Portfolio are simulated prior to February 2015 using the Optimal Portfolio Simulation (see Optimal Portfolio Simulation Disclosure). It is expected that the simulated performance will periodically change as a function ofboth refinements to our simulation methodology and the underlying market data. HYPOTHETICAL OR SIMULATED PERFORMANCE RESULTS HAVE CERTAIN INHERENT LIMITATIONS. UNLIKE AN ACTUAL PERFORMANCERECORD, SIMULATED RESULTS DO NOT REPRESENT ACTUAL TRADING OR THE COSTS OF MANAGING THE PORTFOLIO. ALSO, SINCE THE TRADES HAVE NOT ACTUALLY BEEN EXECUTED, THE RESULTS MAY HAVEUNDER OR OVER COMPENSATED FOR THE IMPACT, IF ANY, OF CERTAIN MARKET FACTORS, SUCH AS LACK OF LIQUIDITY. SIMULATED TRADING PROGRAMS IN GENERAL ARE ALSO SUBJECT TO THE FACT THATTHEY ARE DESIGNED WITH THE BENEFIT OF HINDSIGHT. NO REPRESENTATION IS BEING MADE THAT ANY ACCOUNT WILL OR IS LIKELY TO ACHIEVE PROFITS OR LOSSES SIMILAR TO THOSE SHOWN. Pastperformance is not indicative of future results. Please review the “Important Disclosures and Other Information” located at the end of this presentation.
-50%
-25%
0%
25%
50%
75%
100%
1970 1972 1974 1976 1978 1980 1982 1984 1986 1988 1990 1992 1994 1996 1998 2000 2002 2004 2006 2008 2010 2012 2014
Beta Component at 10% Risk Excess Return Drawdown Tailored Alpha Component at 10% Risk Excess Return During All Weather Drawdown
Past Five Years Past Ten Years Since 1970-0.5 -0.8 -0.5
Monthly Correlation of Beta to Tailored Alpha
Optimal Portfolio(net of fees)
Total Return 15.1%Excess Return 9.7%Volatility 9.6%Ratio 1.0
-100%
0%
100%
200%
300%
400%
500%
600%
1970 1972 1974 1976 1978 1980 1982 1984 1986 1988 1990 1992 1994 1996 1998 2000 2002 2004 2006 2008 2010 2012 2014
Cumulative Excess Returns (Gross, ln)Optimal Portfolio Beta Component Tailored Alpha Component Straight Line Ideal
MASTER PAGE NO. 192

- 9 -
OPTIMAL PORTFOLIO VS. GLOBAL 60/40 PORTFOLIO
Performance shown through 4/30/2015. Please note the returns shown for Optimal Portfolio are simulated prior to February 2015 using the Optimal Portfolio Simulation (see Optimal Portfolio Simulation Disclosure). The global 60/40 iscomprised of 60% global equities and 40% global nominal government bonds. It is expected that the simulated performance will periodically change as a function of both refinements to our simulation methodology and the underlyingmarket data. HYPOTHETICAL OR SIMULATED PERFORMANCE RESULTS HAVE CERTAIN INHERENT LIMITATIONS. UNLIKE AN ACTUAL PERFORMANCE RECORD, SIMULATED RESULTS DO NOT REPRESENT ACTUALTRADING OR THE COSTS OF MANAGING THE PORTFOLIO. ALSO, SINCE THE TRADES HAVE NOT ACTUALLY BEEN EXECUTED, THE RESULTS MAY HAVE UNDER OR OVER COMPENSATED FOR THE IMPACT, IF ANY,OF CERTAIN MARKET FACTORS, SUCH AS LACK OF LIQUIDITY. SIMULATED TRADING PROGRAMS IN GENERALARE ALSO SUBJECT TO THE FACT THAT THEY ARE DESIGNED WITH THE BENEFIT OF HINDSIGHT. NOREPRESENTATION IS BEING MADE THAT ANY ACCOUNT WILL OR IS LIKELY TO ACHIEVE PROFITS OR LOSSES SIMILAR TO THOSE SHOWN. Past performance is not indicative of future results. Please review the “ImportantDisclosures and Other Information” located at the end of this presentation.
-100%
0%
100%
200%
300%
400%
500%
600%
700%
70 72 74 76 78 80 82 84 86 88 90 92 94 96 98 00 02 04 06 08 10 12 14
Cumulative Net of Fees Total Return (ln)Global 60/40 Portfolio Optimal Portfolio
-35%
-30%
-25%
-20%
-15%
-10%
-5%
0%
70 72 74 76 78 80 82 84 86 88 90 92 94 96 98 00 02 04 06 08 10 12 14
Drawdowns (Net of Fees Total Return)Global 60/40 Portfolio Optimal Portfolio
Total Return 9.3% 15.1%Excess Return 3.9% 9.7%
(Annualized) Global 60/40 Portfolio Optimal Portfolio Performance
Standard Deviation 8.6%Sharpe Ratio 0.46
9.6%1.01
MASTER PAGE NO. 193

- 10 -
-50%
0%
50%
100%
150%
200%
250%
300%
350%
400%
450%
500%
1970 1975 1980 1985 1990 1995 2000 2005 2010 2015
Cumulative Total Returns (ln)
Global 60/40 with 1% Optimal Portfolio (net) with 5% Optimal Portfolio (net) with 10% Optimal Portfolio (net)
IMPACT OF INCREMENTALLY SHIFTING TO OPTIMAL PORTFOLIO
Performance shown through April 2015. Please note the returns shown for Optimal Portfolio are simulated prior to March 2015 using the Optimal Portfolio Simulation (see Optimal Portfolio Simulation Disclosure).The global 60/40 iscomprised of 60% global equities and 40% global nominal government bonds. It is expected that the simulated performance will periodically change as a function of both refinements to our simulation methodology and the underlyingmarket data. HYPOTHETICAL OR SIMULATED PERFORMANCE RESULTS HAVE CERTAIN INHERENT LIMITATIONS. UNLIKE AN ACTUAL PERFORMANCE RECORD, SIMULATED RESULTS DO NOT REPRESENT ACTUALTRADING OR THE COSTS OF MANAGING THE PORTFOLIO. ALSO, SINCE THE TRADES HAVE NOT ACTUALLY BEEN EXECUTED, THE RESULTS MAY HAVE UNDER OR OVER COMPENSATED FOR THE IMPACT, IF ANY,OF CERTAIN MARKET FACTORS, SUCH AS LACK OF LIQUIDITY. SIMULATED TRADING PROGRAMS IN GENERALARE ALSO SUBJECT TO THE FACT THAT THEY ARE DESIGNED WITH THE BENEFIT OF HINDSIGHT. NOREPRESENTATION IS BEING MADE THAT ANY ACCOUNT WILL OR IS LIKELY TO ACHIEVE PROFITS OR LOSSES SIMILAR TO THOSE SHOWN. Past performance is not indicative of future results. Please review the “ImportantDisclosures and Other Information” located at the end of this presentation.
Global 60/40 Portfolio
with 1% Optimal Portfolio (net)
with 5% Optimal Portfolio (net)
with 10% Optimal Portfolio (net)
Total Return 9.3% 9.4% 9.6% 9.9%Excess Return 3.9% 4.0% 4.3% 4.6%Volatility 8.6% 8.5% 8.4% 8.3%Ratio 0.46 0.47 0.51 0.55
ImprovementExcess Return +6 bps +31 bps +62 bpsVolatility -6 bps -17 bps -29 bpsRatio +0.01 +0.05 +0.09
MASTER PAGE NO. 194

- 11 -
Appendix
MASTER PAGE NO. 195

- 12 -
OPTIMAL PORTFOLIO FEES AND TERMS
The Optimal Portfolio fee is 1% fixed + 10% of profits.
– In addition, we expect that Administration, Middle and Back office expenses will fall in between the current negotiated rate levels for our other strategies, at approximately 7-9bps. Other expenses (e.g., custodian, professional, miscellaneous) will also be similar to our other funds, at approximately 1-2 bps.
There is a 90 day notice period on redemptions. Consistent with the long-term nature of the strategy, Bridgewater will pay at least 1/3 of the total client holdings on the dealing day after the notice period (ie, three months), another 1/3 after six months, and the balance after nine months.
*Professional fees include legal, audit, tax, and financial statement preparation fees.
MASTER PAGE NO. 196

- 13 -
All Weather Account Review
MASTER PAGE NO. 197

- 14 -
Note: AUM is estimated as of May 1, 2015.Please review the “Important Disclosures and Other Information” located at the end of this presentation.
Strategy Overview: Bridgewater’s optimal beta portfolio, risk-balanced across economic environments.
Objective: Earn the highest return-to-risk ratio for a strategic asset mix.
Approach: Collect the market risk premium embedded across assets as consistently as possible by:- Adjusting assets to a common level of risk.- Combining assets with opposing sensitivities to shifts in the environment (growth and inflation).
$288 million.Size:
ALL WEATHER MANDATE SUMMARY
Growth Inflation
Rising
Falling
Risk Premiums & Discount Rates
25% of RiskEquities CommoditiesCorporate CreditEM Credit
25% of RiskBreakeven InflationIL BondsCommoditiesEM Credit
25% of RiskNominal BondsIL Bonds
25% of RiskNominal BondsEquities
MASTER PAGE NO. 198

- 15 -Please review the “Important Disclosures and Other Information” located at the end of this presentation.
*Performance is shown for the full year for the All Weather Strategy (black text), and for the partial year for the client’s specific account (bold red text). Summary statistics for the All Weather Strategy are based on the full history of the strategy,and may differ from the performance of your specific account or investment. PAST RESULTS ARE NOT NECESSARILY INDICATIVE OF FUTURE RESULTS.
Performance is estimated through April 30, 2015. Standard deviation is calculated using gross of fees performance.
Excess + Return on Cash = Total Return
1996 17.2 % 3.1 % 20.4 %1997 9.4 % 5.6 % 15.0 %1998 -7.3 % 5.5 % -1.8 %1999 10.5 % 5.1 % 15.6 %2000 3.6 % 6.3 % 9.9 % Cumulative Return 384.6%2001 -9.8 % 3.8 % -6.0 % Annual Return 8.7%2002 8.5 % 1.7 % 10.2 % Annual StDev 10.4%2003 15.6 % 1.1 % 16.7 %2004 16.3 % 1.4 % 17.7 %2005 12.2 % 3.3 % 15.5 %2006 -3.9 % 5.0 % 1.2 %2007 6.8 % 5.0 % 11.8 %2008 -22.0 % 1.9 % -20.2 %2009 9.2 % 0.2 % 9.4 %2010 17.5 % 0.1 % 17.6 %2011 18.0 % 0.1 % 18.1 % Cumulative Return 15.4%2012 14.5 % 0.2 % 14.7 % Annual Return 8.5%2013 -4.0 % / 1.9 %* 0.1 % / 0.0 %* -3.9 % / 2.0 %* Annual StDev 6.2%2014 7.5 % 0.1 % 7.6 %
2015 YTD 5.1 % 0.0 % 5.2 %
Bridgewater All Weather StrategyJun 1996 - Apr 2015
Net of Fees Performance Summary
Ventura County Employees' Retirement Association
Aug 2013 - Apr 2015
PERFORMANCE SUMMARY
Inception of the mandate was August 2013. Inception of the strategy was June 1996.
MASTER PAGE NO. 199

- 16 -
Important Disclosures and Other Information
Please read carefully the following important disclosures and other information as they provide additional information relevant to understanding the assumptions, research andperformance information presented herein. Additional information is available upon request except where the proprietary nature of the information precludes its dissemination.
MASTER PAGE NO. 200

- 17 -
IMPORTANT DISCLOSURESThis presentation contains proprietary information regarding Bridgewater Associates, LP (“Bridgewater”) and the strategies Bridgewater manages and is being furnished on a confidential basis to a limitednumber of sophisticated prospective investors for the purpose of evaluating an investment with Bridgewater. By accepting this presentation, the prospective investor agrees that it (and each employee,representative or other agent of such prospective investor) will use the information only to evaluate its potential interest in a fund or strategy described herein and for no other purpose and will not divulge anysuch information to any other party. No part of this presentation may be (i) copied, photocopied or duplicated in any form by any means or (ii) redistributed without the prior written consent of Bridgewater.Notwithstanding anything to the contrary, a prospective investor, and each employee, representative or other agent of such prospective investor, may disclose to any and all persons, without limitation of anykind, the U.S. federal and state income tax treatment and tax structure of a fund described herein (and any of the transactions contemplated hereby) and all materials of any kind (including opinions or othertax analyses) that are provided to a prospective investor relating to such U.S. federal and state income tax treatment and tax structure.
This presentation has been prepared solely for informational purposes and is not an offer to buy or sell or a solicitation of an offer to buy or sell any security or to participate in any trading strategy. Any suchoffering, will be made pursuant to a definitive offering memorandum (the “OM”) which will contain the terms and risks of making an investment with Bridgewater in the relevant fund and other materialinformation not contained herein and which will supersede this information in its entirety. In the event of any discrepancy between the information shown in this presentation and the OM, the OM will prevail.Investors should not construe the contents of this presentation as legal, tax, accounting, investment or other advice. Any decision to invest in a Bridgewater fund or strategy described herein should be madeafter carefully reviewing the OM (including the risks described therein) and all other related documents, conducting such investigations as the prospective investor deems necessary and consulting suchinvestor’s own investment, legal, accounting and tax advisors in order to make an independent determination of the suitability and consequences of an investment in such fund or strategy. Information only forSwiss qualified investors pursuant to Art 10.3 of the Collective Investment Schemes Act (CISA): Representative in Switzerland: UBS Fund Management (Switzerland) AG, Aeschenplatz 6, CH-4052 Basel.Paying Agent in Switzerland: UBS AG, Aeschenvorstadt 1, CH-4051 Basel and Bahnhofstrasse 45, CH-8001 Zurich. The offering memorandum, subscription documents and the financial statements of aninvestment fund offered to Swiss qualified investors are available free of charge from the Representative in Switzerland.
An investment in any Bridgewater fund or strategy involves significant risks and there can be no assurance that any fund or strategy will achieve its investment objective or any targets or that investors willreceive any return of their capital. An investment in any Bridgewater fund or strategy is suitable only for sophisticated investors and requires the financial ability and willingness to accept the high risksinherent in such an investment (including the risk of loss of their entire investment) for an indefinite period of time. Past performance is not indicative of future results.
This presentation and the OM will only be made available to persons or entities who are “accredited investors” under the Securities Act of 1933, as amended, and “qualified purchasers” under the InvestmentCompany Act of 1940, as amended.
The distribution of this presentation and the OM may be restricted by law in certain jurisdictions, and it is the responsibility of persons into whose possession this presentation or the OM comes to informthemselves about, and observe, any such restrictions.
Certain information contained herein constitutes forward-looking statements (including projections, targets, hypotheticals, ratios, estimates, returns, performance, opinions, activity and other events containedor referenced herein), which can be identified by the use of terms such as “may,” “will,” “should,” “expect,” “anticipate,” “project,” “estimate,” “intend,” “continue” or “believe” or other variations (or the negativesthereof) thereof. Due to various risks, assumptions, uncertainties and actual events, including those discussed herein and in the OM, actual results, returns or performance may differ materially from thosereflected or contemplated in such forward-looking statements. As a result, prospective investors should not rely on such forward-looking statements in making their investment decisions. Any forward-lookingstatements contained herein reflect Bridgewater’s current judgment and assumptions which may change in the future, and Bridgewater has no obligation to update or amend such forward-looking statements.
HYPOTHETICAL OR SIMULATED PERFORMANCE RESULTS HAVE CERTAIN LIMITATIONS. UNLIKE AN ACTUAL PERFORMANCE RECORD, SIMULATED RESULTS DO NOT REPRESENTACTUAL TRADING. ALSO, SINCE THE TRADES HAVE NOT BEEN EXECUTED, THE RESULTS MAY HAVE UNDER-OR-OVER COMPENSATED FOR THE IMPACT, IF ANY, OF CERTAIN MARKETFACTORS, SUCH AS LACK OF LIQUIDITY. SIMULATED TRADING PROGRAMS IN GENERAL ARE ALSO SUBJECT TO THE FACT THAT THEY ARE DESIGNED WITH THE BENEFIT OF HINDSIGHT.NO REPRESENTATION IS BEING MADE THAT ANY ACCOUNT WILL OR IS LIKELY TO ACHIEVE PROFIT OR LOSSES SIMILAR TO THOSE SHOWN.
Any tables, graphs or charts relating to past performance, whether hypothetical, simulated or actual, included in this presentation are intended only to illustrate the performance of indices, strategies, orspecific accounts for the historical periods shown. When creating such tables, graphs and charts, Bridgewater may incorporate assumptions on trading, positions, transactions costs, market impactestimations and the benefit of hindsight. For example, transaction cost estimates used in simulations are based on historical measured costs and/or modeled costs, and attribution is derived from a process ofattributing positions held at a point in time to specific market views and is inherently imprecise. Such tables, graphs and charts are not intended to predict future performance and should not be used as abasis for making any investment decision. Bridgewater has no obligation to update or amend such tables, graphs or charts.
Statements regarding target performance or target ratios related to assumed risk budgets, liabilities, volatility, target volatility, tracking error or other targets should not be considered a guarantee that suchresults can or will be achieved. For example, Bridgewater may adjust returns to match, for instance, the annualized standard deviation of two or more return series but this adjustment does not suggest thatthe returns or assets are similar with respect to other aspects of the risk such as liquidity risk. Any statements with respect to the ability to risk match or risk adjust in the future are not a guarantee that therealized risks will be similar and material divergences could occur. All performance and risk targets contained herein are subject to revision by Bridgewater and are provided solely as a guide to currenttargets.
MASTER PAGE NO. 201

- 18 -
IMPORTANT DISCLOSURESDiscussions related to the risk controlling capabilities of low risk portfolios, diversification, passive investing, risk management, risk adjusting, and any other risk control theories, statements, measures,calculations and policies contained herein should not be construed as a statement that Bridgewater has the ability to control risk or that the investments or instruments discussed are low risk. Active tradingcomes with a monetary cost and high risk and there is no guarantee the cost of trading will not have a materially adverse impact on any account, fund, portfolio or other structure. Bridgewater managesaccounts, funds and strategies not referred to herein. Additionally, even where accounts, funds or strategies are traded similarly, performance may materially diverge based on, among other factors, timing,the approved instruments, markets, and target risk for each strategy or market. The price and value of the investments referred to in this presentation and the income, if any, derived therefrom may fluctuate.
Statistical and mathematical measures of performance and risk measures based on past performance, market assumptions or any other input should not be relied upon as indicators of future results. WhileBridgewater believes the assumptions and possible adjustments it may make in making the underlying calculations are reasonable, other assumptions, methodologies and adjustments could have been madethat are reasonable and would result in materially different results, including materially lower results. Where shown, targeted performance and the abilities and capabilities of the active and passivemanagement approaches discussed herein are based on Bridgewater’s analysis of market data, quantitative research of the underlying forces that influence asset classes as well as management policies andobjectives, all of which are subject to change. The material contained herein may exhibit the potential for attractive returns, however it also involves a corresponding high degree of risk. Targetedperformance, whether mathematically based or theoretical, is considered hypothetical and is subject to inherent limitations such as the impact of concurrent economic or geo-political elements, forces ofnature, war and other factors not addressed in the analysis, such as lack of liquidity. There is no guarantee that the targeted performance for any fund or strategy shown herein can or will be achieved. Abroad range of risk factors, individually or collectively, could cause a fund or strategy to fail to meet its investment objectives and/or targeted returns, volatilities or correlations.
Where shown, information related to markets traded may not necessarily indicate the actual historical or current strategies of Bridgewater. Markets listed may or may not be currently traded and are subject tochange without notice. Markets used for illustrative purposes may not represent the universe of markets traded or results available and may not include actual trading results of Bridgewater. Other markets ortrading, not shown herein, may have had materially different results. Attribution of performance or designation of markets and the analysis of performance or other performance with respect to scenarioanalysis or the determination of biases is based on Bridgewater’s analysis. Statements made with respect to the ability of Bridgewater, a fund, a strategy, a market or instrument to perform in relation to anyother market, instrument or manager in absolute terms or in any specific manner in the future or any specified time period are not a guarantee of the desired or targeted result.
Bridgewater research utilizes data and information from public, private and internal sources, including data from actual Bridgewater trades. Sources include, the Australian Bureau of Statistics,Altos Research LLC, Asset International, Inc., Barclays Capital Inc., Bloomberg Finance L.P., CEIC Data Company Ltd., Consensus Economics Inc., Credit Market Analysis Ltd., CrimsonHexagon, Inc., Corelogic, Inc., Dealogic LLC, Ecoanalitica, Emerging Portfolio Fund Research, Inc., Factset Research Systems, Inc., The Financial Times Limited, Fundata Canada, Inc.,GaveKal Research Ltd., Global Financial Data, Inc., Haver Analytics, Inc., Investment Company Institute, International Energy Agency, Investment Management Association, InternationalMonetary Fund, Intercontinental Exchange (ICE), IHS, Inc., Markit Economics Limited, Mergent, Inc., Metals Focus Ltd, Moody’s Analytics, Inc., MSCI, Inc., National Bureau of EconomicResearch, Organisation for Economic Co-operation and Development, Paramita Tecnologia Consultoria Financeira LTDA, Property and Portfolio Research, Inc., RealtyTrac, Inc., RP Data Ltd,Rystad Energy, Inc., State Street Bank and Trust, Sentix Gmbh, Standard & Poor’s Financial Services LLC, Thomson Reuters, Tokyo Stock Exchange, TrimTabs Investment Research, Inc.,United Nations, US Department of Commerce, World Bureau of Metal Statistics, World Economic Forum, WIND Information (Hong Kong) Co., Ltd. and Wood Mackenzie Limited. While weconsider information from external sources to be reliable, we do not assume responsibility for its accuracy.
None of the information related to a fund or strategy that Bridgewater may provide is intended to form the basis for any investment decision with respect to any retirement plan’s assets. Any informationBridgewater provides should be independently and critically evaluated based on whatever other sources deemed appropriate, including legal and tax advice; it is also not intended to be impartial investmentinformation or advice as Bridgewater may recommend one or more Bridgewater products in connection with such information, which would result in additional fees being paid to Bridgewater. Bridgewater’sstatus as an ERISA fiduciary with respect to the management of any existing or future Bridgewater product(s) in which you invest would be (or continue to be) set forth in that product’s applicable governinginstruments. You are responsible for ensuring that your decision to invest in any Bridgewater product does not violate the fiduciary or prohibited transaction rules of ERISA, the U.S. Internal Revenue Code orany applicable laws or regulations that are similar.
This presentation was written in connection with the promotion or marketing of a Bridgewater fund or strategy, and it was not intended or written to be used and cannot be used by any person for the purposeof avoiding penalties that may be asserted under the U.S. Internal Revenue Code.
All amounts and percentages in this presentation are approximate and have been rounded for presentation purposes.
Statements in this presentation are made as of the date appearing on this presentation. Neither the delivery of this presentation or the OM shall at any time under any circumstances create an implication thatthe information contained herein is correct as of any time subsequent to such date. Bridgewater has no obligation to inform potential or existing investors when information herein is stale, deleted, modified orchanged.
MASTER PAGE NO. 202

- 19 -
IMPORTANT DISCLOSURESBridgewater research utilizes (in whole and in part) data and information from public, private, and internal sources. Some internally generated information may be considered theoretical innature and subject to inherent limitations associated therein, including but not limited to, an ability to find appropriate inputs. External sources include the Australian Bureau of Statistics,International Energy Agency, Investment Management Association, International Monetary Fund, National Bureau of Economic Research, Organisation for Economic Co-operation andDevelopment, United Nations, US Department of Commerce, World Bureau of Metal Statistics, World Economic Forum, as well as information companies such as Asset International, Inc., BBALibor Limited, Bloomberg Finance L.P., CEIC Data Company Ltd., Consensus Economics Inc., Credit Market Analysis Ltd., Crimson Hexagon, Inc., Dealogic LLC, Ecoanalitica, EmergingPortfolio Fund Research, Inc., Global Financial Data, Inc., Global Trade Information Services, Inc., Haver Analytics, Inc., Markit Economics Limited, Mergent, Inc., Moody’s Analytics, Inc.,MSCI, Paramita Tecnologia Consultoria Financeira LTDA, Property and Portfolio Research, Inc., RealtyTrac, Inc., RP Data Ltd., SNL Financial LC, Standard and Poor’s, Thomson Reuters,TrimTabs Investment Research, Inc. and Wood Mackenzie Limited. While we consider information from external sources to be reliable, we do not independently verify information obtained fromexternal sources and we make no representation or warranty as to the accuracy, completeness or reliability of such information.
The views expressed herein are solely those of Bridgewater and are subject to change without notice. In some circumstances Bridgewater submits performance information to indices, such asDow Jones Credit Suisse Hedge Fund index, which may be included in this material. You should assume that Bridgewater has a significant financial interest in one or more of the positionsand/or securities or derivatives discussed. Bridgewater’s employees may have long or short positions in and buy or sell securities or derivatives referred to in this material. Those responsiblefor preparing this material receive compensation based upon various factors, including, among other things, the quality of their work and firm revenues.
This material is for informational and educational purposes only and is not an offer to sell or the solicitation of an offer to buy the securities or other instruments mentioned. Any such offeringwill be made pursuant to a definitive offering memorandum. This material does not constitute a personal recommendation or take into account the particular investment objectives, financialsituations, or needs of individual investors which are necessary considerations before making any investment decision. Investors should consider whether any advice or recommendation in thisresearch is suitable for their particular circumstances and, where appropriate, seek professional advice, including legal, tax, accounting, investment or other advice.
The information provided herein is not intended to provide a sufficient basis on which to make an investment decision and investment decisions should not be based on simulated, hypotheticalor illustrative information that have inherent limitations. Unlike an actual performance record, simulated or hypothetical results do not represent actual trading or the actual costs of managementand may have under or over compensated for the impact of certain market risk factors. Bridgewater makes no representation that any account will or is likely to achieve returns similar to thoseshown. The price and value of the investments referred to in this research and the income therefrom may fluctuate.
Every investment involves risk and in volatile or uncertain market conditions, significant variations in the value or return on that investment may occur. Investments in hedge funds are complex,speculative and carry a high degree of risk, including the risk of a complete loss of an investor’s entire investment. Past performance is not a guide to future performance, future returns are notguaranteed, and a complete loss of original capital may occur. Certain transactions, including those involving leverage, futures, options, and other derivatives, give rise to substantial risk andare not suitable for all investors. Fluctuations in exchange rates could have material adverse effects on the value or price of, or income derived from, certain investments.
This information is not directed at or intended for distribution to or use by any person or entity located in any jurisdiction where such distribution, publication, availability or use would be contraryto applicable law or regulation or which would subject Bridgewater to any registration or licensing requirements within such jurisdiction.
No part of this material may be (i) copied, photocopied or duplicated in any form by any means or (ii) redistributed without the prior written consent of Bridgewater ® Associates, LP.
MASTER PAGE NO. 203

- 20 -
OPTIMAL PORTFOLIO SIMULATION DISCLOSURE
Past results are not necessarily indicative of future results. It is expected that the simulatedperformance will periodically change as a function of both refinements to our simulation methodologyand the underlying market data. HYPOTHETICAL OR SIMULATED PERFORMANCE RESULTSHAVE CERTAIN INHERENT LIMITATIONS. UNLIKE AN ACTUAL PERFORMANCE RECORD,SIMULATED RESULTS DO NOT REPRESENT ACTUAL TRADING OR THE COSTS OFMANAGING THE PORTFOLIO. ALSO, SINCE THE TRADES HAVE NOT ACTUALLY BEENEXECUTED, THE RESULTS MAY HAVE UNDER OR OVER COMPENSATED FOR THE IMPACT,IF ANY, OF CERTAIN MARKET FACTORS, SUCH AS LACK OF LIQUIDITY. SIMULATEDTRADING PROGRAMS IN GENERAL ARE ALSO SUBJECT TO THE FACT THAT THEY AREDESIGNED WITH THE BENEFIT OF HINDSIGHT. NO REPRESENTATION IS BEING MADE THATANY ACCOUNT WILL OR IS LIKELY TO ACHIEVE PROFITS OR LOSSES SIMILAR TO THOSESHOWN.
Optimal Portfolio Simulation Performance Disclosure:The simulated performance for Optimal Portfolio Strategy was derived by applying Bridgewater's currentactive investment systems and portfolio construction logic to historical market returns across the substrategies and markets selected for Optimal Portfolio Strategy and using the relative weightings selected forOptimal Portfolio Strategy. We use actual market returns when available and otherwise use BridgewaterAssociates' proprietary estimates, based on other available data and our fundamental understanding of assetclasses. In certain cases, market data for an exposure which otherwise would exist in the simulation may beomitted if the relevant data is unavailable, deemed unreliable, immaterial or accounted for using proxies.Examples of markets omitted or accounted for using proxies for part of the simulation period include, but arenot limited to, emerging market equities, emerging market debt, and certain commodities. There is noguarantee that the mix and weightings of markets traded for Optimal Portfolio Strategy will not change in thefuture.
Simulated asset returns are subject to considerable uncertainty and potential error, as there is a greatdeal that cannot be known about how assets would have performed in the absence of actual market returns.The Optimal Portfolio Strategy simulation is an approximation of our actual process but not an exactreplication, and may have differences including but not limited to the precise mix of markets used and theweights applied to those markets. It is expected that the simulated performance will periodically change as afunction of changes to our simulation methodology, investment systems, portfolio construction logic, and theunderlying market data. Transaction costs are accounted for and are estimates themselves based onhistorical measured costs and or modeled costs. Actual transaction costs experienced could have been higheror lower than those reflected in the simulation. For total returns shown a proxy for the return on US dollarcash is added to the simulation. Where noted, the Optimal Portfolio Strategy Net of Fees returns have beencalculated using the expected standard fee schedule for a minimum size account, which are the highest feeswe would charge an account.
No claim is being made of the Optimal Portfolio Strategy’s ability to perform in absolute terms or relative toany market return in the future, during market events not represented or during market events occurring in thefuture. Market conditions and events vary considerably, are unpredictable and can have unforeseen impactsresulting in materially adverse performance results.
Optimal Portfolio SimulationTotal Return in USD
Last 1 Year 6.2%Last 3 Years 6.9%Last 5 Years 9.6%
Last 10 Years 9.5%Annualized Returns (Feb-70 through Jan-15)
Annualized Total Return 15.1%Standard Deviation 9.7%
Ratio 1.0
Optimal Portfolio Simulation Performance (Net of Fees)
Net Since Inception Feb-70 through Jan-15
MASTER PAGE NO. 204

- 21 -
BRIDGEWATER OPTIMAL PORTFOLIO STRATEGY 10% VOLATILITY PERFORMANCE DISCLOSURE
Past results are not necessarily indicative of future results.
Bridgewater Optimal Portfolio Strategy 10% Volatility Performance Disclosure:Performance from February 2015 to present is the actual returns of the Optimal Portfolio account.
Gross of fees performance is gross of management fees and performance fees only and includes reinvestment of interest, gains and losses.
Net of fees performance has been calculated by applying our standard Optimal Portfolio strategy fee schedule, which are the highest fees charged. Investment advisory fees are described in Bridgewater's ADV Part 2A.
No representation is being made that any account will or is likely to achieve returns similar to those shown. Trading in futures is risky and can result in losses as well as profits. PAST RESULTS ARE NOT NECESSARILY INDICATIVE OF FUTURE RESULTS. Performance as of the current month is estimated and subject to change.
Optimal Portfolio StrategyTotal Return in USD
Last 1 Year 1.9%Last 3 Years --Last 5 Years --
Last 10 Years --Returns (Feb-15 through Apr-15)
Optimal Portfolio Strategy Performance (Net of Fees)
MASTER PAGE NO. 205

- 22 -
ALL WEATHER STRATEGY DISCLOSURE
Past results are not necessarily indicative of future results.
Bridgewater All Weather Strategy Performance Disclosure:For the period June 1996 (the inception of the strategy) through August 2001 the performance is based on thetotal return of the Bridgewater All Weather strategy as implemented for Bridgewater's principals and theiraffiliates and was not fully hedged to the US Dollar. The All Weather strategy is structured to be fully hedged,and the performance reflected after August 2001 includes these hedging transactions. For the period ofAugust 2001 through present the performance shown is the actual total returns of the longest running fullyfunded All Weather account. For the entire history excess returns are calculated by subtracting anapproximation of a U.S. cash rate from the total returns described above. Of note, the All Weather strategy’starget leverage, volatility and return, as well as the asset mix varied from June 1996 to July 2005. FromAugust 2005 through the present the strategy has targeted 10% volatility. Bridgewater manages additional AllWeather portfolios not included in this performance history.
Gross of fees performance is gross of management fees and includes the reinvestment of interest, gains, andlosses. Returns will be reduced by the investment advisory fees and any other expenses that may be incurredin the management of the account.
Net of fees performance has been calculated using our standard fee schedule for a minimum size account,which are the highest fees we have or would currently charge an account. Investment advisory fees aredescribed in Bridgewater’s ADV Part 2A.
No representation is being made that any account will or is likely to achieve returns similar to those shown.Trading in futures is risky and can result in losses as well as profits. PAST RESULTS ARE NOTNECESSARILY INDICATIVE OF FUTURE RESULTS. Performance as of the current month is estimated andsubject to change.
All WeatherTotal Return in USD
Last 1 Year 7.1%Last 3 Years 5.6%Last 5 Years 10.1%
Last 10 Years 6.7%Annualized Returns (Jun-96 through Apr-15)
Annualized Return 8.7%Standard Deviation 10.4%
Sharpe Ratio 0.59
All Weather Strategy Performance (Net of Fees)
Net Since Inception Jun-96 through Apr-15
MASTER PAGE NO. 206
- 23 -
All WeatherTotal Return in USD
Last 1 Year 6.9%Last 3 Years 6.6%Last 5 Years 8.5%
Last 10 Years 8.5%Annualized Returns (Jun-96 through Apr-15)
Annualized Return 9.7%Standard Deviation 9.5%
Sharpe Ratio 0.75
All Weather Asset Mix Performance (Net of Fees)
Net Since Inception Jun-96 through Apr-15
All Weather Asset Mix Disclosure:Where shown, simulated returns for All Weather are created using the All Weather asset mix. The All Weatherasset mix performance is simulated by applying All Weather asset mix weights, which are determined byBridgewater's proprietary process for building an environmentally balanced portfolio, to historical marketreturns. We use actual market returns when available and otherwise use Bridgewater Associates' proprietaryestimates, based on other available data and our fundamental understanding of asset classes. In certaincases, market data for an exposure which otherwise would exist in the simulation may be omitted if therelevant data is unavailable, deemed unreliable, immaterial or accounted for using proxies. In the case ofmitted markets, other markets in the same asset class, which represent the vast majority of our positions ineach asset class, are scaled to represent the full asset class position. Examples of omitted markets include,but are not limited to, non-U.S. markets prior to 1970, emerging market equities, some inflation-linked bondmarkets and certain commodities.
Simulated asset returns are subject to considerable uncertainty and potential error, as there is a greatdeal that cannot be known about how assets would have performed in the absence of actual market returns.The All Weather asset mix simulation is an approximation of our actual process but not an exact replication,and may have differences including but not limited to the precise mix of markets used and the weights appliedto those markets. It is expected that the simulated performance will periodically change as a function of bothrefinements to our simulation methodology (including the addition/removal of asset classes) and theunderlying market data. There is no guarantee that previous results would not be materially different. Futurestrategy changes could materially change previous simulated return in order to reflect the changes accuratelyacross time.
Transaction costs are accounted for and are estimates themselves based on historical measured costs and/ormodeled costs. Actual transaction costs experienced could have been higher or lower than those reflected inthe simulation. Where noted, the All Weather Asset Mix Net of Fees returns have been calculated using ourstandard fee schedule for a minimum size account, which are the highest fees we have or would currentlycharge an account. Investment advisory fees are described in Bridgewater’s ADV Part 2A. No claim is beingmade of the All Weather Asset Mix’s ability to perform in absolute terms or relative to any market return in thefuture, during market events not represented or during market events occurring in the future. Marketconditions and events vary considerably, are unpredictable and can have unforeseen impacts resulting inmaterially adverse performance results.
Past results are not necessarily indicative of future results. It is expected that the simulated performance will periodicallychange as a function of both refinements to our simulation methodology and the underlying market data. WHERE SHOWN,HYPOTHETICAL OR SIMULATED PERFORMANCE RESULTS HAVE CERTAIN INHERENT LIMITATIONS. UNLIKE ANACTUAL PERFORMANCE RECORD, SIMULATED RESULTS DO NOT REPRESENT ACTUAL TRADING OR THECOSTS OF MANAGING THE PORTFOLIO. ALSO, SINCE THE TRADES HAVE NOT ACTUALLY BEEN EXECUTED,THE RESULTS MAY HAVE UNDER OR OVER COMPENSATED FOR THE IMPACT, IF ANY, OF CERTAIN MARKETFACTORS, SUCH AS LACK OF LIQUIDITY. SIMULATED TRADING PROGRAMS IN GENERAL ARE ALSO SUBJECTTO THE FACT THAT THEY ARE DESIGNED WITH THE BENEFIT OF HINDSIGHT. NO REPRESENTATION IS BEINGMADE THAT ANY ACCOUNT WILL OR IS LIKELY TO ACHIEVE PROFITS OR LOSSES SIMILAR TO THOSE SHOWN.
ALL WEATHER ASSET MIX DISCLOSURE
MASTER PAGE NO. 207

- 24 -
PURE ALPHA STRATEGY PERFORMANCE DISCLOSURES
Pure AlphaTotal Return in USD
Last 1 Year 8.4%Last 3 Years 5.1%Last 5 Years 10.0%
Last 10 Years 7.9%Annualized Returns (Dec-91 through Apr-15)
Annualized Total Return 9.9%Standard Deviation 10.1%
Information Ratio 0.69
Net Since Inception Dec-91 through Apr-15
Pure Alpha Strategy Performance (Net of Fees)
Past results are not necessarily indicative of future results. Standard deviation is calculated using gross offees performance. Information ratio is calculated using the annualized standard deviation of gross of feesperformance. HYPOTHETICAL OR SIMULATED PERFORMANCE RESULTS HAVE CERTAIN INHERENTLIMITATIONS. UNLIKE AN ACTUAL PERFORMANCE RECORD, SIMULATED RESULTS DO NOTREPRESENT ACTUAL TRADING OR THE COSTS OF MANAGING THE PORTFOLIO. ALSO, SINCE THETRADES HAVE NOT ACTUALLY BEEN EXECUTED, THE RESULTS MAY HAVE UNDER OR OVERCOMPENSATED FOR THE IMPACT, IF ANY, OF CERTAIN MARKET FACTORS, SUCH AS LACK OFLIQUIDITY. SIMULATED TRADING PROGRAMS IN GENERAL ARE ALSO SUBJECT TO THE FACTTHAT THEY ARE DESIGNED WITH THE BENEFIT OF HINDSIGHT. NO REPRESENTATION IS BEINGMADE THAT ANY ACCOUNT WILL OR IS LIKELY TO ACHIEVE PROFITS OR LOSSES SIMILAR TOTHOSE SHOWN.
Bridgewater Pure Alpha Strategy 12% Volatility Performance Disclosure:The performance history provided is based on actual Bridgewater Pure Alpha accounts. Returns since thestrategy’s inception in December 1991 through April 1999 are based on the actual performance of a partiallyfunded account (where interest income has been removed to arrive at the excess returns), and are adjusted toinclude the imputed interest return on the full notional value using the US repo rate. Returns from May 1999through present are the actual returns of the longest running fully funded Pure Alpha account with a targettracking error of 12%, an approximation of an United States cash benchmark, and fully unconstrained activemanagement guidelines. Bridgewater manages additional Pure Alpha portfolios not included in thisperformance history.
Gross of fees performance is gross of management and performance fees only and includes the reinvestmentof interest, gains, and losses.
Where shown, from December 1991 through April 1999, net of fees returns have been calculated using thecumulative gross return of the Strategy starting in December 1991 and applying our standard Pure Alpha feeschedule, which are the highest fees charged. From December 1991 through April 1999, using a monthly highwater concept (and after April 1999 a quarterly high water concept) deduction of incentive fees may vary andmay be higher or lower than the fees actually charged to the account for the same time period. These returnsreflect all fees (which are at our Pure Alpha standard rates), expenses and interest actually charged orcredited to the account. Investment advisory fees are described in Bridgewater’s ADV Part 2A.
No representation is being made that any account will or is likely to achieve returns similar to thoseshown. Trading in futures is risky and can result in losses as well as profits. PAST RESULTS ARE NOTNECESSARILY INDICATIVE OF FUTURE RESULTS. Performance as of the current month is estimated andsubject to change.
MASTER PAGE NO. 208

Your Global Investment Authority
An Introduction to PIMCO’s All Asset All Authority Fund
Ventura County Employees Retirement Association
18 May 2015
For institutional investor use only
MASTER PAGE NO. 209

pg 1Your Global Investment AuthorityYour Global Investment Authority
Disclosures
Investors should consider the investment objectives, risks, charges and expenses of the funds carefully before investing. This and other information
are contained in the fund’s prospectus and summary prospectus, if available, which may be obtained by contacting your investment professional or
PIMCO representative or by visiting www.pimco.com/investments. Please read them carefully before you invest or send money.
PIMCO Investments LLC
MASTER PAGE NO. 210

pg 2Your Global Investment AuthorityYour Global Investment Authority
Biographical information
Robert Arnott
Mr. Arnott is the founder and chairman of Research Affiliates, a subadvisor to PIMCO. In 2002,
he established Research Affiliates as a research-intensive asset management firm that focuses on innovative asset allocation and alternative indexation
products. He previously served as chairman of First Quadrant, as president of TSA Capital Management (now part of Analytic Investors), and as vice
president at The Boston Company. He also was global equity strategist at Salomon Brothers. He has published more than 100 articles in journals such as the
Journal of Portfolio Management, the Harvard Business Review and the Financial Analysts Journal, where he also served as editor in chief from 2002 through
2006. He graduated summa cum laude from the University of California, Santa Barbara, in 1977 in economics, applied mathematics and computer science.
David J. Blair, CFA
Mr. Blair is a senior vice president and account manager in the Newport Beach office. He was a member of PIMCO's municipal portfolio management team
from 2006-2010 and was previously a credit analyst for 10 years at Nuveen Investments, focusing on high yield California bonds, primarily in the land-
secured sector, as well as utilities, multi-family housing and toll road bonds. Mr. Blair was also an auditor and certified public accountant at Arthur Andersen
for three years. He has 21 years of investment experience and holds an MBA from the University of Chicago Graduate School of Business. He holds an
undergraduate degree from the University of California, Santa Barbara.
Mark A. Romano, CFA
Mr. Romano is an executive vice president and an account manager in the Newport Beach office focusing on investment consulting firms, clients and
developing new client relationships. Prior to joining PIMCO in 1997, he was with Wells Fargo’s institutional money management group. Prior to that,
Mr. Romano was director of fixed income and a portfolio manager for the Pacifica family of mutual funds; he also invested assets for pension plans,
foundations, financial institutions, corporations and trust accounts. In addition, Mr. Romano reported the daily business news for the San Diego ABC-TV
affiliate. He has 33 years of investment experience and holds an MBA from San Diego State University. He earned an undergraduate degree in accounting
from Shippensburg University, Pennsylvania.
MASTER PAGE NO. 211

pg 3Your Global Investment AuthorityYour Global Investment Authority
Agenda
1. PIMCO All Asset All Authority Fund philosophy and process
2. Performance and risk
3. Additional information
– Understanding recent performance
– Historical and current allocations
– Attractive return potential with low equity risk
– Comparison to PIMCO All Asset Fund
– PIMCO AUM by strategy
!mk_AAAA_LF
MASTER PAGE NO. 212

pg 4Your Global Investment AuthorityYour Global Investment Authority
PIMCO All Asset All Authority Fund: A compelling asset allocation strategy
The PIMCO All Asset All Authority Fund seeks to deliver multiple concurrent benefits to investors:
� Attractive level of total returns
� Explicit orientation towards inflation hedging
� Diversification away from equity risk
� Modest volatility
� Daily liquidity
Refer to Appendix for additional investment strategy and risk information
all_asset_phil_40a
MASTER PAGE NO. 213

pg 5Your Global Investment AuthorityYour Global Investment Authority
Review of All Asset All Authority’s role in an investor’s portfolio
Issue
Response
Original 2002 rationale is now more relevant than ever:
� Conventional stock/bond allocations may not provide adequate returns
� High equity allocations drive need for risk diversification
� Institutions and individuals alike must earn returns that exceed future inflation
� Conventional balanced strategies would be devastated by renewed inflation
PIMCO All Asset All Authority FundInception: 31 October 2003Size: $17.5 billion
All_asset_phil_29
Fund structure PIMCO RESEARCH AFFILIATES
All_asset_phil_37
� A global leader in active investment management across liquid asset classes
� 260+ portfolio managers, 60+ analysts
� AUM $1.6 trillion¹, founded 1971
� Role: Active manager of suite of underlying funds
� A global leader in research-driven asset allocation investment strategies
� 33 investment professionals (3 portfolio managers, 30 researchers, 2 product specialists)
� AUM $171.4 billion, founded by Rob Arnott in 2002
� Role: Sub-advisor on tactical asset allocation decisions
As of 31 March 2015¹ Effective 31 March 2012, PIMCO began reporting the assets managed on behalf of its parent’s affiliated companies as part of its assets under management. PIMCO manages $1.59 trillion in
assets, including $1.19 trillion in third-party client assets as of 31 March 2015. Refer to Appendix for additional risk information.
MASTER PAGE NO. 214

pg 6Your Global Investment AuthorityYour Global Investment Authority
Tactically managing to multiple long-term investment characteristics
The PIMCO All Asset All Authority investment process seeks to achieve these long-term characteristics by:
� Considering a very broad and globally diversified opportunity set
� Incorporating excess return potential from active PIMCO management
� Tactically allocating using a value-oriented, contrarian investment process
* Consumer Price Index (CPI) + 6.5% represents the long-term secondary benchmark of the strategy through a full business cycleRefer to Appendix for additional risk and secondary benchmark information.
CPI + 6.5% annualized*
(over a business cycle)
Modest volatility(volatility in between that of stocks and bonds)
all_asset_phil_34b
3rd Pillar Focus(Diversification & Real Return Orientation)
MASTER PAGE NO. 215

pg 7Your Global Investment AuthorityYour Global Investment Authority
Understanding All Authority’s “3rd Pillar” focus
As of 31 March 2015For Illustrative Purposes Only.Refer to Appendix for additional portfolio structure and risk information.
Diversifying and inflation-related
assets, 10%
U.S. equities, 55%
U.S. bonds, 35%
EM equity
Inflation-related
AlternativesGlobal & EM bonds
Global credit80%
U.S. equities andU.S. bonds, 20%
1cs_AAF_review_22
� Real return focus
� Tactical flexibility
� Risk diversified across multiple sectors
Third pillar focused portfolio*
� Nominal return focused
� Rigid benchmark orientation
� Risk concentrated in equities
Conventional balanced portfolio
MASTER PAGE NO. 216

pg 8Your Global Investment AuthorityYour Global Investment Authority
As of 31 March 2015* TIPS: Treasury Inflation Protected Securities; REITs: Real Estate Investment Trusts1 Allocations are shown based on net assets (assets net of leverage) in order to better visually illustrate the use of tactical leverage and inverse S&P 500 exposure. Prospectus allocation limits
are based on percent of Gross Assets. For historical allocations as a percent of Gross Assets refer to the “All Asset All Authority Fund: Historical Allocations” table within this presentation.Refer to Appendix for additional portfolio structure and risk information.
all_asset_stru_01d
-40
-20
0
20
40
60
80
100
120
140
160Pe
rcen
t o
f ne
t as
sets
1 (%
)
Gross exposure
'03 '04 '06 '07 '08 '09 '10 '11 '13 '14
Emerging markets equities
Commodities and REITs
Inflation-linked bonds
Emerging markets bonds
Global bonds
Credit
Alternative strategies
U.S. Long maturity bondsU.S. Core bondsShort-term bondsDeveloped ex-U.S. equities
U.S. equities, net short
Third pillar Average: 85%Current: 103%
First pillar Average: -1%Current: -5%
Second pillar Average: 15%Current: 6%
PIMCO All Asset All Authority’s historical allocations:Third Pillar assets are the “core”
MASTER PAGE NO. 217

pg 9Your Global Investment AuthorityYour Global Investment Authority
� RAE Fundamental PLUS EMG � RAE Low Volatility PLUS EMG� EqS Emerging Markets
� RAE Fundamental PLUS Int’l� RAE Low Volatility PLUS Int’l� EqS® Dividend� EqS Pathfinder®
� StocksPLUS® Int’l (Unhedged)� StocksPLUS® Int’l (Hedged)
All Asset All Authority provides access to a broad opportunity set
all_asset_phil_35d
� RAE Fundamental PLUS � RAE Fundamental PLUS Small � RAE Low Volatility PLUS � StocksPLUS® � StocksPLUS® Absolute Return� StocksPLUS® Small � StocksPLUS® Short (AAAAF Only)
U.S. Equity Strategies:
� Government Money Market� Low Duration� Short Term� Low Duration ETF
Short-term Bond Strategies:
� Total Return Fund� Investment Grade Corporate Bond Fund
U.S. Core Bond Strategies
Developed ex- U.S. Equity Strategies:
� CommoditiesPLUS® Strategy� CommodityRealReturn Strategy � RealEstateRealReturn Strategy � Real Return � Real Return Asset � Global Advantage® Inflation-Linked Bond Strategy
Inflation Related Strategies:
� Emerging Markets Currency � Emerging Local Bond� Emerging Markets Bond � Emerging Markets Corporate Bond
Emerging Market Bond Strategies:
� RAE Fundamental Advantage PLUS � RAE Worldwide Fundamental Advantage PLUS� RAE Worldwide Long/Short PLUS � Unconstrained Bond � Credit Absolute Return� EqS® Long/Short� Mortgage Opportunities� TRENDS Managed Futures Strategy
Alternative Strategies:
� Floating Income� High Yield � High Yield Spectrum � Income Fund� Senior Floating Rate� Diversified Income
Credit Strategies:
Emerging Market Equity Strategies:
� Foreign Bond (Unhedged) � Global Advantage® Strategy � Global Bond (Unhedged)
Global Bond Strategies:
� Long-Term U.S. Government� Long Duration Total Return � Long-Term Credit
U.S. Long Maturity Bond Strategies
As of 31 March 2015Key guidelines:Exposure to Inflation Related Strategies normally will not exceed 75%Exposure to U.S. Equity Strategies normally will not exceed 50%Exposure to Non-U.S. Equity Strategies normally will not exceed 33 1/3%Exposure to U.S. and Non-U.S. Equity Strategies normally will not exceed 66 2/3%. (Less allocation to StocksPLUS® AR Short Strategy Fund)Exposure to Short Strategies, which seek to gain a negative exposure to an asset class , normally will not exceed 20%May employ leverage up to 1/3 of total assets. Max guidelines are as a percentage of gross assets.Refer to Appendix for additional risk information.
MASTER PAGE NO. 218

pg 10Your Global Investment AuthorityYour Global Investment Authority
PIMCO All Asset All Authority investment process: Value-oriented, contrarian and real return focused
Business cycle dependent valuations and risk measures
Refer to Appendix for additional investment strategy and risk information.
Inputs Importance
� Current return stats� Economic growth data� Inflation expectations� Sector-specific data
30–40%
� Returns vs. benchmarks for underlying funds
15–25%
� Current and historical valuation indicators for stocks, bonds, cash
15–25%
� Risk characteristics and correlations within the business cycle
10–20%
� Qualitative input on financial, economic or geopolitical events
PIMCO All Asset Fund target allocations
Procedure
Long-term real return = yield + income growth – inflation (valuation change held constant)
THE “BUILDING BLOCKS MODEL”
Estimate PIMCO alpha based on historical consistency and level of alpha for each PIMCO PM
PIMCO MANAGER VALUE-ADDED
Compare current valuation to historical and cross-sectional to assess price impact of valuation change
RISK PREMIUM ANALYSIS
Incorporate appropriate correlations and volatilities, Seek to maximize risk-adjusted real return
PORTFOLIO CONSTRUCTION
Research Affiliates and PIMCO investment professionals meet monthly
“WHAT ARE THE MODELS MISSING?”
Long-termWhat to own
Intermediate-termWhen to trade
all_asset_phil_18c
What insights are not “in the data”5–15%
MASTER PAGE NO. 219

pg 11Your Global Investment AuthorityYour Global Investment Authority
PIMCO All Asset All Authority Fund performance
As of 31 March 20151 Note: Partial performance for 2003 is due to a 31 October 2003 inception date of the All Asset All Authority Fund2 The 60/40 mix is comprised of 60% S&P 500 and 40% Barclays U.S. Aggregate Index
Performance is shown for the institutional classRefer to Appendix for additional performance and fee, index, risk and secondary benchmark information.
Performance quoted represents past performance. Past performance is not a guarantee or a reliable indicator of future results. Current performance may be lower or higher than performance shown. Investment return and principal value will fluctuate, so that fund shares may be worth more or less than their original cost when redeemed. Performance data current to the most recent month-end is available at www.pimco.com/investments or by calling 888.87.PIMCO.
retu_791_avg_02
PIMCO All Asset All Authority FundSince
inception
31 Oct '03 10 yrs. 5 yrs. 3 yrs. 1 yr. 6 mos. 3 mos.
After fees (%) 5.99 5.32 3.89 0.41 -4.80 -4.77 -0.32
S&P 500 Index (%) 8.32 8.01 14.47 16.11 12.73 5.93 0.95
CPI + 6.5 (%) 8.65 8.52 8.14 7.49 6.48 2.42 1.37
60/40 mix (%)² 7.15 7.06 10.60 10.88 10.00 5.02 1.30
4.68
11.89
6.72
3.09
9.99
-6.92
19.35
10.67
3.01
17.66
-5.47
-2.35-0.32
-10
-5
0
5
10
15
20
25
Nov –Dec '03¹
'04 '05 '06 '07 '08 '09 '10 '11 '12 '13 '14 '15YTD
Ret
urn
(%
)
PIMCO All Asset All Authority Fund annual performance (after fees)
MASTER PAGE NO. 220

pg 12Your Global Investment AuthorityYour Global Investment Authority
PIMCO All Asset All Authority Fund performance
As of 30 April 2015* Due to lag in release, performance is as of 31 March 20151 Note: Partial performance for 2003 is due to a 31 October 2003 inception date of the All Asset All Authority Fund
Performance is shown for the institutional classRefer to Appendix for additional performance and fee, index, risk and secondary benchmark information.
Performance quoted represents past performance. Past performance is not a guarantee or a reliable indicator of future results. Current performance may be lower or higher than performance shown. Investment return and principal value will fluctuate, so that fund shares may be worth more or less than their original cost when redeemed. Performance data current to the most recent month-end is available at www.pimco.com/investments or by calling 888.87.PIMCO.
retu_791_avg_02
PIMCO All Asset All Authority Fund
S.I. YTD
31 Oct '03 10 yrs. 5 yrs. 3 yrs. 1 yr. 6 mos. 3 mos. 30 Apr '15
After fees (%) 6.25 5.42 4.08 1.16 -2.81 -2.01 2.30 2.97
S&P 500 Index (%) 8.34 8.32 14.33 16.73 12.98 4.40 5.07 1.92
CPI + 6.5 (%) 8.65 8.52 8.14 7.49 6.48 2.42 1.37 1.37
4.68
11.89
6.72
3.09
9.99
-6.92
19.35
10.67
3.01
17.66
-5.47
-2.35
2.97
-10
-5
0
5
10
15
20
25
Nov –Dec '03¹
'04 '05 '06 '07 '08 '09 '10 '11 '12 '13 '14 '15YTD
Ret
urn
(%
)
PIMCO All Asset All Authority Fund annual performance (after fees)
*
MASTER PAGE NO. 221

pg 13Your Global Investment AuthorityYour Global Investment Authority
All Asset’s long-term performance is consistent with 60/40, but has provided diversification versus 60/40 along the way
$50
$100
$150
$200
$250
$300
Oct '04 Jun '05 Feb '06 Oct '06 Jun '07 Feb '08 Oct '08 Jun '09 Feb '10 Oct '10 Jun '11 Feb '12 Oct '12 Jun '13 Feb '14 Oct '14
Gro
wth
of
$100
All Asset All Authority 60% S&P 500 / 40% BCAG
-30%
-20%
-10%
0%
10%
20%
Oct '04 Aug '05 Jun '06 Apr '07 Feb '08 Dec '08 Oct '09 Aug '10 Jun '11 Apr '12 Feb '13 Dec '13 Oct '14
Tra
ilin
g 1
-yr
retu
rn d
iffe
ren
ce (
%)
Trailing 1yr return difference
As of 31 March 2015SOURCE: PIMCOPerformance is net of feesRefer to Appendix for additional performance and fee, index, and risk information.
All Asset All Authority outperforming 60/40
60/40 outperforming All Asset All Authority
Performance quoted represents past performance. Past performance is not a guarantee or a reliable indicator of future results. Current performance may be lower or higher than performance shown. Investment return and principal value will fluctuate, so that fund shares may be worth more or less than their original cost when redeemed. Performance data current to the most recent month-end is available at www.pimco.com/investments or by calling 888.87.PIMCO.
MASTER PAGE NO. 222

pg 14Your Global Investment AuthorityYour Global Investment Authority
2.55%
1.76%2.09%
0.0%
0.5%
1.0%
1.5%
2.0%
2.5%
3.0%
3.5%
1997 1999 2001 2003 2005 2007 2009 2011 2013 2015
10 Year BEI Average10yr breakeven inflation
From March 1997-March 2015SOURCE: Research Affiliates based on data from Bloomberg and St. Louis FedNOTE: Breakeven inflation is the difference between TIPS and Treasury yieldsThird pillar composite is an equally-weighted blend of U.S. high yield (Barclays U.S. Corporate High Yield Index), Long U.S. TIPS (Barclays U.S. Treasury Inflation Notes: 10+ Year Index), EM local bonds (JPMorgan Government Bond Index-Emerging Markets Global Diversified Index (Unhedged)), EM equities (MSCI EM Index), REITs (Dow Jones U.S. Select REIT Total Return Index), and diversified commodities (DJ-UBS Commodity TR Index)
� Inflation expectations fell over the past two years driven in part by falling oil prices
� Rising inflation expectations from lows in January provide a tailwind for third pillar assets in 2015
� Historically, third pillar asset returns have been positively correlated with changes in breakeven inflation
-50%
-40%
-30%
-20%
-10%
0%
10%
20%
30%
40%
50%
60%
-2.0% -1.0% 0.0% 1.0% 2.0%
12 m
on
th “
thir
d p
illar
" re
turn
s
12 month changes in 10yr breakeven inflation
2013
2014
2012
ρ = 0.78
Changes in 10yr breakeven inflation and “third pillar” returns
1cs_All_asset_review_36
Inflation expectations, which had fallen for two years, may offer a tailwind to third pillar assets going forward
MASTER PAGE NO. 223

pg 15Your Global Investment AuthorityYour Global Investment Authority 1cs_AAF_outlook_05
As of 31 March 2015SOURCE: Research Affiliates, LLC, based on data building blocks, mean reversion and business cycle models.The asset classes shown above are represented by the following indexes: U.S. Equities represented by S&P 500; Developed ex U.S. Equities represented by MSCI EAFE; Long U.S. Treasuries represented by Barclays U.S. Treasury Long; U.S. Core Fixed Income represented by Barclays U.S. Aggregate; U.S. Investment Grade Credit represented by Barclays U.S. Interim Credit; U.S. high yield represented by Barclays U.S. Corporate High Yield; U.S. TIPS represented by Barclays U.S. Treasury U.S. TIPS, U.S. REITS represented by FTSE NAREIT; EM local bonds represented by JPM GBI-EM; EM equities represented by MSCI EM; and Commodities represented by DJ-UBS Commodity TR Index.Refer to Appendix for additional forecast, outlook and risk information.
Long-term real return estimates for major asset classes Third pillar Second pillar First pillar
� Most third pillar assets are attractively priced, after anemic recent results, while US stocks and bonds are not
� The dark side of a major bull market? Those asset classes are priced to offer weak future returns
Research Affiliates’ current long-term real return estimatesThe highest return potential is outside of U.S. stocks and bonds
US Equities
Developed ex-US
Equities
US Small EquitiesLong US
Treasuries
US Core
Fixed Income
US IG
Credit
Cash
Bank Loans
EM External Debt
EM Currency
US High Yield
US TIPSUS REITs
EM Local Bonds
EM Equities
Commodities
-1%
0%
1%
2%
3%
4%
5%
6%
7%
8%
9%
10%
-1% 3% 7% 11% 15% 19% 23% 27%
Long
-Ter
m R
eal E
xpec
ted
Ret
urns
Volatility
MASTER PAGE NO. 224

pg 16Your Global Investment AuthorityYour Global Investment Authority
All Asset All Authority has a strong track record of diversification relative to a more traditional balanced strategy despite recent performance headwinds
� Since inception, All Asset All Authority has delivered attractive returns while offering diversification relative to a traditional balances strategy
� The historical diversification benefits were most pronounced in years when traditional balanced strategies sold off significantly
60/40 outperforms
All Asset outperforms
All Asset All
Authority
(after fees)
60% S&P 500/
40% BCAGG
0
2
4
6
8
10
12
14
0 5 10 15
Ann
ualiz
ed r
etur
ns (
%)
Annualized volatility (%)
Historical risk and return since inception
-40
-30
-20
-10
0
10
20
30
40
-40 -30 -20 -10 0 10 20 30 40
All
Ass
et A
ll A
utho
rity
(af
ter
fees
)
60% S&P 500 40% BCAGG
Rolling 12m returns since inception
Diversification benefit most pronounced when
60/40 is failing!
Performance quoted represents past performance. Past performance is not a guarantee or a reliable indicator of future results. Current performance may be lower or higher than performance shown. Investment return and principal value will fluctuate, so that fund shares may be worth more or less than their original cost when redeemed. Performance data current to the most recent month-end is available at www.pimco.com/investments or by calling 888.87.PIMCO.
As of 31 March 2015Refer to Appendix for additional fee, index, and risk information
MASTER PAGE NO. 225
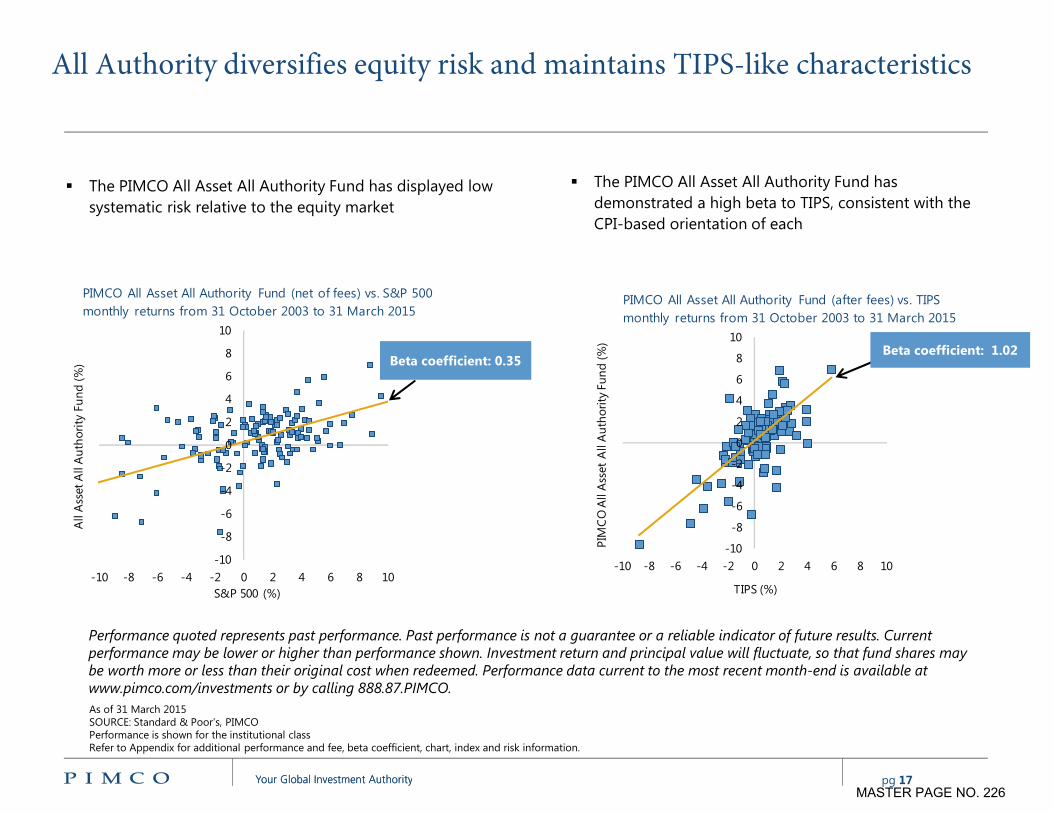
pg 17Your Global Investment AuthorityYour Global Investment Authority
All Authority diversifies equity risk and maintains TIPS-like characteristics
� The PIMCO All Asset All Authority Fund has displayed low systematic risk relative to the equity market
As of 31 March 2015SOURCE: Standard & Poor’s, PIMCOPerformance is shown for the institutional classRefer to Appendix for additional performance and fee, beta coefficient, chart, index and risk information.
all_asset_review_24b
Beta coefficient: 0.35Beta coefficient: 0.35
-10
-8
-6
-4
-2
0
2
4
6
8
10
-10 -8 -6 -4 -2 0 2 4 6 8 10
All
Ass
et A
ll A
uth
ori
ty F
un
d (
%)
S&P 500 (%)
PIMCO All Asset All Authority Fund (net of fees) vs. S&P 500
monthly returns from 31 October 2003 to 31 March 2015
Performance quoted represents past performance. Past performance is not a guarantee or a reliable indicator of future results. Current performance may be lower or higher than performance shown. Investment return and principal value will fluctuate, so that fund shares may be worth more or less than their original cost when redeemed. Performance data current to the most recent month-end is available at www.pimco.com/investments or by calling 888.87.PIMCO.
� The PIMCO All Asset All Authority Fund has demonstrated a high beta to TIPS, consistent with the CPI-based orientation of each
-10
-8
-6
-4
-2
0
2
4
6
8
10
-10 -8 -6 -4 -2 0 2 4 6 8 10
PIM
CO
All
Ass
et A
ll A
uth
ori
ty F
un
d (
%)
TIPS (%)
PIMCO All Asset All Authority Fund (after fees) vs. TIPS
monthly returns from 31 October 2003 to 31 March 2015
Beta coefficient: 1.02Beta coefficient: 1.02
MASTER PAGE NO. 226

pg 18Your Global Investment AuthorityYour Global Investment Authority
PIMCO All Asset All Authority Fund: A compelling asset allocation strategy
� Total return potential
� Inflation hedging
� Diversification from equity risk
� Seeks modest volatility
� Daily liquidity
Refer to Appendix for additional risk information.
Demonstrated track record delivering these benefits
all_asset_phil_41a
MASTER PAGE NO. 227

pg 19Your Global Investment AuthorityYour Global Investment Authority
Additional information
all_asset_app_01P309 MASTER PAGE NO. 228

pg 20Your Global Investment AuthorityYour Global Investment Authority
Annual return comparison: PIMCO All Asset All Authority Fund
As of 31 March 2015Note: Insufficient 2003 data due to 31 October 2003 inception of the All Asset All Authority Fund. Investment Grade Bonds are represented by the Barclays Credit Investment Grade Index, TIPS 1–10Yr are represented by the Barclays TIPS 1–10Yr index, U.S. Aggregate Bonds are represented by the Barclays U.S. Aggregate Index, T-Bills are represented by the Citigroup 3-Month T-Bills Index.Performance is shown for the institutional class.Refer to Appendix for additional performance and fee, chart, index and risk information.
AAAA_review_04
Performance quoted represents past performance. Past performance is not a guarantee or a reliable indicator of future results. Current performance may be lower or higher than performance shown. Investment return and principal value will fluctuate, so that fund shares may be worth more or less than their original cost when redeemed. Performance data current to the most recent month-end is available at www.pimco.com/investments or by calling 888.87.PIMCO.
All Asset All Authority (after fees)
11.89%
All Asset All Authority (after fees)
6.72%
S&P 500 15.79%
TIPS 1-10yr 11.45%
U.S. aggregate
bonds 5.24%
S&P 500 26.46%
S&P 500 15.06%
TIPS 1-10yr 8.93%
All Asset All Authority (after fees)
17.66%
S&P 500 32.39%
S&P 500 13.69%
S&P 500 8.31%
S&P 500 10.88%
S&P 500 4.91%
T-bills 4.76%
All Asset All Authority(after fees)
9.99%
T-bills 1.80%
All Asset All Authority (after fees)
19.35%
All Asset All Authority(after fees)
10.67%
Investment grade bonds
8.35%
S&P 500 16.00%
T-Bills 0.05%
Investment grade bonds
7.53%
All Asset All Authority (after fees)
5.99%
TIPS 1-10yr 7.10%
T-bills 3.00%
U.S. aggregate
bonds 4.33%
U.S. aggregate
bonds 6.97%
TIPS 1-10yr -2.43%
Investment grade bonds
16.04%
Investment grade bonds
8.47%
U.S. aggregate
bonds 7.84%
Investment grade bonds
9.37%
Investment grade bonds
-2.01%
U.S. aggregate
bonds 5.97%
Investment grade bonds
5.58%
Investment grade bonds
5.24%
U.S. aggregate
bonds 2.43%
Investment grade bonds
4.26%
S&P 500 5.49%
Investment grade bonds
-3.08%
TIPS 1-10yr 12.02%
U.S. aggregate
bonds 6.54%
All Asset All Authority (after fees)
3.01%
TIPS 1-10yr 5.04%
U.S. aggregate
bonds -2.02%
TIPS 1-10 yr 0.91%
U.S. aggregate
bonds 4.76%
U.S.aggregate
bonds 4.34%
Investment grade bonds
1.96%
All Asset All Authority(after fees)
3.09%
Investment grade bonds
5.11%
All Asset All Authority(after fees)
-6.93%
U.S. aggregate
bonds 5.93%
TIPS 1-10yr 5.22%
S&P 500 2.11%
U.S. aggregate
bonds 4.21%
All Asset All Authority (after fees)
-5.47%
T-Bills 0.03%
TIPS 1-10 yr 4.04%
T-bills 1.25%
TIPS 1-10yr 1.87%
TIPS 1-10yr 1.56%
T-bills 4.74%
S&P 500 -37.00%
T-bills 0.16%
T-bills 0.13%
T-bills 0.08%
T-bills 0.07%
TIPS 1-10 yr -5.58%
All Asset All Authority (after fees)
-2.35%
T-Bills 1.41%
2004 2005 2006 2007 2008 2009 2010 2011 2012 2013 2014Since
inception
MASTER PAGE NO. 229

pg 21Your Global Investment AuthorityYour Global Investment Authority
Asset class returns have low correlations: This is an opportunity for active reallocation
Barclays
U.S. TIPS
from
31 Jan '97
Dow Jones
UBS
Commodity
Total
Return
from
31 Dec '90
Citigroup
3-Month
T-Bill from
31 Dec '90
Barclays
Long-Term
Treasury
from
31 Jan '91
Barclays
U.S.
Aggregate
from
31 Dec '90
JPMorgan
Gov't Bond
Non-U.S.
Hedged
from
31 Dec '90
Barclays
Credit
Investment
Grade as of
31 Dec '90
BofA ML
U.S. High
Yield, BB-B
Rated
from
31 Dec '92
JPMorgan
Emerging
Markets +
from
31 Dec '93
S&P 500
from
31 Dec '90
MSCI
EAFE
Hedged
from
31 Dec '90
DJ U.S.
Select REIT
Total
Return
from
31 Dec '90
BAGG(40%)
/ S&P
500(60%)
from
31 Dec '90
1.0
0.3 1.0
0.0 0.1 1.0
0.6 -0.1 0.0 1.0
0.8 0.0 0.1 0.9 1.0
0.5 -0.1 0.2 0.7 0.7 1.0
0.7 0.2 0.0 0.7 0.9 0.6 1.0
0.3 0.3 -0.1 -0.1 0.2 0.0 0.5 1.0
0.5 0.3 0.0 0.1 0.3 0.1 0.5 0.6 1.0
0.0 0.3 0.0 -0.2 0.0 -0.1 0.2 0.6 0.5 1.0
0.1 0.5 0.0 -0.2 0.0 -0.1 0.3 0.6 0.6 0.8 1.0
0.2 0.3 0.0 0.0 0.2 0.0 0.3 0.6 0.4 0.5 0.5 1.0
0.1 0.3 0.0 0.0 0.2 0.0 0.4 0.6 0.6 1.0 0.8 0.5 1.0
4.3% 10.9% 0.4% 7.1% 2.6% 2.1% 3.7% 5.7% 9.0% 10.5% 11.7% 14.5% 6.4%
Barclays Long-Term Treasury
Barclays U.S. Aggregate
JPMorgan Gov't Bond Non-U.S. Hedged
Barclays Credit Investment Grade
Barclays U.S. TIPS
Dow Jones UBS Commodity Total Return
Citigroup 3-Month T-Bill
DJ U.S. Select REIT Total Return
BAGG(40%) / S&P 500(60%)
Annualized standard deviations
BofA ML U.S. High Yield, BB-B Rated
JPMorgan Emerging Markets +
S&P 500
MSCI EAFE hedged
As of 31 March 2015SOURCE: Bloomberg, JPMorgan, Barclays, BofA Merrill Lynch, PIMCO
* For indexes incepted after 31 Dec '90, maximum history is based on the inception date of the newer index in each correlated pairingRefer to Appendix for additional correlation and index information.
real_return_review_84
Average cross correlation: 0.4
Correlations based on maximum history indices*
MASTER PAGE NO. 230

pg 22Your Global Investment AuthorityYour Global Investment Authority
All Asset All Authority is used in various ways by investors
Global tactical allocation strategy
Attractive total return potential+ low equity beta
CPI + 6.5%secondary benchmarks
Bond-like correlation and volatility
Liquid alternative* / absolute return strategy
Inflation protection / real return strategy
Core holding or diversifying satellite
Fixed income alternative
All Asset All Authority characteristics Investor use
* PIMCO’s liquid alternative strategies are without the principal lock-ups of traditional private equity funds and hedge funds and include separate accounts whose holdings can be liquidated at a client’s request subject to current market conditions, mutual funds that can be liquidated at NAV on a daily basis and ETFs that can be liquidated on the secondary market under normal market conditions. There is no guarantee that a security will be able to be liquidated in a timely fashion or when it would be most advantageous to do so.Refer to Appendix for additional portfolio structure and risk information.
all_asset_phil_42a MASTER PAGE NO. 231

pg 23Your Global Investment AuthorityYour Global Investment Authority
Understanding recent performance
all_asset_app_06P309 MASTER PAGE NO. 232

pg 24Your Global Investment AuthorityYour Global Investment Authority
As of 31 March 2015SOURCE: PIMCOThird pillar composite is an equally-weighted blend of U.S. high yield (Barclays U.S. Corporate High Yield Index), Long U.S. TIPS (Barclays U.S. Treasury Inflation Notes: 10+ Year Index), EM local bonds (JPMorgan Government Bond Index-Emerging Markets Global Diversified Index (Unhedged)), EM equities (MSCI EM Index), REITs (Dow Jones U.S. Select REIT Total Return Index), and diversified commodities (DJ-UBS Commodity TR Index)
1cs_All_asset_review_34
-10%
0%
10%
20%
30%
40%
50%
60%
Dec '12 Mar '13 Jun '13 Sep '13 Dec '13 Mar '14 Jun '14 Sep '14 Dec '14 Mar '15
Cu
mu
lati
ve re
turn
s (%
)
S&P 500 BCAG Third pillar composite
2013 2014 Q1 '15
S&P 500: +32.4%
S&P 500: +13.7%
S&P 500: +1.0%
BCAG: -2.0%
Third pillar composite: -5.0%
BCAG: +6.0%
Third pillar composite: +3.0%
BCAG: +1.6%
Third pillar composite: +0.3%
The large divergence of U.S. stocks from other asset classes during 2013-2014 has diminished in 2015
� QE3 led to strong gains in U.S. stocks versus other asset classes; S&P 500 gained 51% in 2013-2014, far outpacing other markets
� This effect has diminished in 2015 as the Fed ended QE3 and discussed the potential for near-term rate hikes
MASTER PAGE NO. 233

pg 25Your Global Investment AuthorityYour Global Investment Authority
0%
10%
20%
30%
40%
50%
60%
S&P 500 BCAG Third pillar composite
QE 1 (17 months)
(25 Nov 2008 – 31 Mar 2010)
0%
10%
20%
30%
40%
50%
60%
S&P 500 BCAG Third pillar composite
QE 2 (11 months)
(27 Aug 2010 – 30 Jun 2011)
0%
10%
20%
30%
40%
50%
60%
S&P 500 BCAG Third pillar composite
Operation Twist (9 months)
(21 Sep 2011 – 20 Jun 2012)
0%
10%
20%
30%
40%
50%
60%
S&P 500 BCAG Third pillar composite
QE 3 (27 months)
(31 Aug 2012 – 29 Oct 2014)
As of 31 March 2015SOURCE: PIMCORefer to Appendix for additional index and risk information.Third pillar composite is an equally-weighted blend of U.S. high yield (Barclays U.S. Corporate High Yield Index), Long U.S. TIPS (Barclays U.S. Treasury Inflation Notes: 10+ Year Index), EM local bonds (JPMorgan Government Bond Index-Emerging Markets Global Diversified Index (Unhedged)), EM equities (MSCI EM Index), REITs (Dow Jones U.S. Select REIT Total Return Index), and diversified commodities (DJ-UBS Commodity TR Index)
Cu
mu
lati
ve r
etu
rns
(%)
Cu
mu
lati
ve r
etu
rns
(%)
Cu
mu
lati
ve r
etu
rns
(%)
Cu
mu
lati
ve r
etu
rns
(%)
42% return differential
1cs_All_asset_review_35
During QE3, U.S. stocks outpaced other asset classes significantly more than in prior QE periods
MASTER PAGE NO. 234

pg 26Your Global Investment AuthorityYour Global Investment Authority
From 1998–2014SOURCE: Research Affiliates based on data from BloombergThird pillar composite is an equally-weighted blend of U.S. high yield (Barclays U.S. Corporate High Yield Index), Long U.S. TIPS (Barclays U.S. Treasury Inflation Notes: 10+ Year Index), EM local bonds (JPMorgan Government Bond Index-Emerging Markets Global Diversified Index (Unhedged)), EM equities (MSCI EM Index), REITs (Dow Jones U.S. Select REIT Total Return Index), and diversified commodities (DJ-UBS Commodity TR Index)
Expectations for the “third pillar” in different environments
1cs_AAF_review_28
Cale
nd
ar
year
S&
P 5
00
retu
rnCalendar year change in inflation expectations
0.75%0.50%-0.50%-0.75% 0.00%
Disinflationary bull markets
Average calendar year returns:First and second pillar = 16.4%Third pillar = -3.2%Years: ‘98, ‘13, ‘14
Expectation:Third pillar underperformance on a relative basis
Reflationary bull markets
Average calendar year returns:First and second pillar = 13.7%Third pillar = 22.0%Years: ‘99, ‘03, ‘04, ‘09, ‘12
Expectation:Third pillar outperformance on both relative and absolute basis
Reflationary bear markets
Average calendar year returns:*No observations since 1998*
Expectation:Infrequent but magnitude of third pillar relative outperformance is large
Disinflationary bear markets
Average calendar year returns:First and second pillar = -11.5%Third pillar = -10.4%Years: ‘00 and ‘08
Expectation:Third pillar relative outperformance, particularly with value orientation
Neutral Markets ∆ in inflation expectations between -0.25% and 0.25%
Average Calendar Year ReturnsFirst and second pillar = 3.5%Third Pillar = 10.0%Years: ‘01, ‘02, ‘06, ‘07, ‘10
Expectation:Third pillar as diversifying return driver
MASTER PAGE NO. 235

pg 27Your Global Investment AuthorityYour Global Investment Authority
Historical and current allocations
all_asset_app_03P309 MASTER PAGE NO. 236

pg 28Your Global Investment AuthorityYour Global Investment Authority
Leverage in All Asset All Authority is being used to emphasize diversifying sectors while also seeking to hedge overall volatility and equity risk
all_asset_review_26
As of 31 March 20151 Volatility measured by rolling 3-month standard deviation of daily returns2 Measured against S&P 500 using rolling 3-month daily returns
Refer to Appendix for additional portfolio and risk information.
1.1%
-19.3%
-0.2%
0.5%
1.0%
2.2%
7.8%
6.6%
-25% -20% -15% -10% -5% 0% 5% 10%
U.S. equities
U.S. core and longmaturity bond strategies
Alternative (low beta)strategies
Inflation related strategies
Short-term strategies
EM and global bond
Credit
Global equities
Current allocation mix: All Asset All Authority minus All Asset
0
5
10
15
20
25
'07 '08 '09 '10 '11 '12 '13 '14 '15
Vo
lati
lity
(%)1
Total volatility has been nearly identical
despite differences in holdings
All Asset All AuthorityAll Asset
-0.2
0.0
0.2
0.4
0.6
'07 '08 '09 '10 '11 '12 '13 '14 '15Eq
uit
y b
eta2
Leverage in All Asset All Authority Fund has
been used to diversify exposure away from
equity risk
All Asset All Authority
All Asset
MASTER PAGE NO. 237

pg 29Your Global Investment AuthorityYour Global Investment Authority
PIMCO All Asset All Authority Fund: Historical exposures (Page 1 of 2)
1cs_AAAA_structure_02
Dec '03 Dec '04 Dec '05 Dec '06 Dec '07 Dec '08 Dec '09 Dec '10 Dec '11 Dec '12 Dec '13 Dec '14 Mar '15
Third Pillar 74.8% 77.8% 66.7% 88.8% 74.3% 85.2% 61.8% 85.2% 110.4% 96.3% 107.6% 94.9% 103.2%
Emerging Markets Equities 0.0% 0.0% 0.0% 0.0% 0.0% 0.1% 1.4% 2.7% 9.3% 7.7% 12.7% 17.0% 16.7%
Fundamental PLUS EMG Fund - - - - - 0.1% 1.4% 2.7% 9.1% 7.6% 12.5% 6.2% 6.4%
Low Volatility PLUS EMG Fund - - - - - - - - - - 0.0% 10.8% 10.4%
EqS Emerging Markets Fund - - - - - - - - 0.2% 0.1% 0.1% 0.0% -
Commodities and REITs 7.9% 14.4% 3.7% 16.3% 5.4% 7.9% 7.0% 12.4% 19.0% 6.5% 10.8% 10.7% 9.9%
CommoditiesPLUS™ Strategy Fund - - - - - - - 4.0% 7.3% 5.2% 5.2% 4.6% 4.1%
CommodityRealReturn Strategy Fund® 2.6% 8.8% 1.5% 16.1% 4.5% 3.3% 6.7% 5.6% 6.4% 0.6% 1.9% 3.3% 3.3%
RealEstateRealReturn Strategy Fund 5.3% 5.7% 2.2% 0.2% 0.8% 4.7% 0.2% 2.8% 5.3% 0.7% 3.7% 2.8% 2.6%
Emerging Markets Bonds 7.4% 16.4% 16.0% 20.4% 18.4% 23.6% 6.2% 8.2% 23.9% 26.3% 25.4% 22.7% 22.9%
Emerging Local Bond Fund - - - - 5.4% 8.9% 1.4% 2.6% 8.1% 8.9% 8.5% 10.6% 10.7%
Emerging Markets Currency Fund - - 9.8% 14.9% 6.6% 6.4% 2.9% 5.1% 11.0% 9.8% 9.4% 10.2% 11.6%
Emerging Markets Bond Fund 7.4% 16.4% 6.1% 5.6% 6.5% 8.2% 1.8% 0.6% 4.8% 6.0% 5.6% 1.3% 0.4%
Emerging Markets Corporate Bond Fund - - - - - - - - - 1.6% 1.9% 0.6% 0.2%
Credit 9.4% 21.3% 10.9% 37.8% 30.2% 23.0% 6.9% 23.5% 37.4% 38.1% 30.6% 20.7% 22.8%
High Yield Fund 1.5% 6.6% 4.1% 2.0% 5.7% 6.5% 2.4% 5.8% 10.0% 9.8% 6.1% 2.4% 3.1%
High Yield Spectrum Fund - - - - - - - 1.2% 4.0% 5.1% 4.3% 4.6%
Income Fund - - - - 2.6% 3.0% 1.6% 7.0% 8.0% 8.4% 9.5% 7.5% 8.2%
Diversified Income Fund - - - 2.5% 7.3% 1.7% 1.0% 2.0% 4.8% 5.8% 3.6% 0.1% 0.0%
Floating Income Fund - 10.0% 6.7% 33.3% 10.3% 3.4% 0.9% 4.7% 8.3% 4.9% 3.0% 0.1% 0.1%
Senior Floating Rate Fund - - - - - - - - 0.6% 3.6% 3.3% 6.2% 6.7%
Convertible Fund - 2.8% 0.1% 0.1% 4.3% 8.4% 1.0% 4.0% 4.4% 1.6% - - -
European Convertible Fund 7.9% 1.9% - - - - - - - - - - -
Global Bonds 0.0% 8.7% 1.4% 0.0% 3.7% 0.6% 2.2% 2.6% 2.7% 4.3% 1.0% 0.5% 0.6%
Foreign Bond Fund (Unhedged) - 8.7% 1.3% - 3.6% 0.6% 0.3% 1.1% 1.1% 1.8% 0.0% 0.4% 0.5%
Global Advantage Strategy Fund - - - - - - 1.9% 1.5% 1.6% 2.5% 1.0% 0.1% 0.2%
Global Bond Fund (Unhedged) - - 0.0% 0.0% 0.0% 0.0% - - - - - - -
Inflation-Linked Bonds 50.0% 16.9% 34.8% 14.2% 16.6% 26.0% 26.4% 10.1% 6.5% 0.5% 0.5% 3.3% 7.6%
Real Return Fund 28.3% 9.4% 16.6% 7.0% 7.7% 1.1% 6.3% 1.6% 0.4% 0.1% 0.0% 1.8% 1.4%
Real Return Asset Fund 21.7% 7.5% 18.3% 7.2% 8.9% 24.9% 20.1% 8.6% 6.2% 0.3% 0.5% 1.4% 6.1%
Global Advantage® Inflation-Linked Bond ETF - - - - - - - - - 0.1% 0.1% 0.1% 0.1%
Alternative Strategies 0.0% 0.0% 0.0% 0.0% 0.0% 4.0% 11.8% 25.6% 11.5% 12.9% 26.6% 19.9% 22.6%
Unconstrained Bond Fund - - - - - - - 11.0% 5.8% 5.6% 7.5% 3.1% 3.3%
Credit Absolute Return Fund - - - - - - - - 0.2% 0.7% 4.5% 1.1% 1.0%
Mortgage Opportunities Fund - - - - - - - - - - 0.6% 0.9% 0.8%
TRENDS Managed Futures Strategy Fund - - - - - - - - - - - 0.3% 0.3%
EqS Long/Short Fund - - - - - - - - - 0.4% 0.5% 0.6% 0.6%
Worldwide Long/Short PLUS Fund - - - - - - - - - - - 3.3% 6.8%
Fundamental Advantage PLUS Fund - - - - - 4.0% 11.8% 14.6% 5.5% 5.5% 6.3% 2.9% 5.8%
Worldwide Fundamental Advantage PLUS Fund - - - - - - - - - 0.8% 7.2% 7.7% 4.1%
* Fund liquidated on 1 August 2011 and is no longer available for investing after this date.Refer to Appendix for additional investment strategy, portfolio structure and risk information.
MASTER PAGE NO. 238

pg 30Your Global Investment AuthorityYour Global Investment Authority
PIMCO All Asset All Authority Fund: Historical exposures (Page 2 of 2)
1cs_AAAA_structure_02
* Fund liquidated on 1 August 2011 and is no longer available for investing after this date.** The StocksPLUS® Short Fund is shown as a negative allocation on this report because the Fund provides short exposure to the S&P 500 Index
Refer to Appendix for additional investment strategy , portfolio structure and risk information.
Dec '03 Dec '04 Dec '05 Dec '06 Dec '07 Dec '08 Dec '09 Dec '10 Dec '11 Dec '12 Dec '13 Dec '14 Mar '15
Second Pillar 3.8% 15.6% 24.0% 1.9% 5.7% 15.0% 38.7% 18.6% 8.2% 13.9% 3.4% 14.5% 5.8%
US Long Maturity Bonds 0.0% 1.9% 12.8% 0.6% 3.3% 0.4% 13.2% 2.8% 3.6% 6.5% 3.3% 4.2% 0.5%
Long-Term US Government Fund - 1.9% 12.8% 0.6% 3.3% 0.3% 4.3% 0.1% 1.3% 2.3% 0.6% 0.9% 0.0%
Long Term Credit Fund - - - - - - 4.6% 2.2% 1.4% 1.7% 2.2% 1.6% 0.2%
Long Duration Total Return Fund - - - - - 0.1% 4.2% 0.6% 0.9% 2.4% 0.5% 1.7% 0.3%
US Core Bonds 1.7% 13.7% 11.2% 0.5% 0.3% 14.6% 23.9% 14.0% 4.5% 6.9% 0.3% 5.0% 3.5%
Total Return Fund - 5.4% 10.9% 0.5% 0.3% 0.4% 14.5% 10.1% 0.1% 3.3% 0.1% 2.8% 1.4%
Investment Grade Corporate Bond Fund - - - - - 14.1% 9.4% 3.8% 4.4% 3.6% 0.2% 2.1% 2.1%
Mortgage-Backed Securities Fund - - 0.2% 0.0% 0.0% - - - - - - - -
GNMA Fund 1.7% 8.2% 0.1% - 0.0% - - - - - - - -
Short-Term Bonds 2.2% 0.0% 0.0% 0.8% 2.1% 0.1% 1.6% 1.8% 0.1% 0.5% -0.2% 5.4% 1.8%
Low Duration Fund 2.2% 0.0% 0.0% 0.8% 2.1% 0.1% 1.6% 1.6% 0.0% 0.3% 0.1% 3.8% 0.8%
Low Duration Exchange Traded Fund - - - - - - - - - - - 0.3% 0.3%
Short Term Fund - - - - 0.0% 0.0% 0.0% 0.3% 0.0% 0.0% 0.0% 0.0% -
Government Money Market Fund 1.5% 0.9%
Net Cash Equivalents - - - - - - - - - 0.2% -0.3% -0.3% -0.1%
First Pillar 32.9% 30.0% -1.7% -1.4% -8.5% 8.5% -12.2% -15.9% 3.6% -6.8% -6.3% -2.4% -4.6%
Developed ex-US Equities 8.1% 12.4% 7.6% 9.1% 6.5% 0.0% 0.0% 0.8% 5.5% 7.5% 11.8% 11.3% 10.5%
Fundamental PLUS International Fund - - - - - - - - 1.6% 5.4% 8.0% 3.2% 2.6%
Low Volatility PLUS International Fund - - - - - - - - - - 0.0% 6.9% 6.7%
StocksPLUS® International Fund (USD-Hedged) - - - - - - - 0.1% 0.4% 0.1% 0.2% 0.0% -
StocksPLUS® International Fund (Unhedged) - - - - - - - 0.3% 0.2% 0.1% - - -
EqS Dividend Fund 0.1% 0.1% 0.1% 0.0% -
EqS Pathfinder Fund - - - - - - - 0.4% 3.2% 1.8% 3.5% 1.2% 1.2%
European StocksPLUS® AR Strategy Fund 5.6% 3.3% - 0.6% 1.1% - - - - - - - -
Far East (ex-Japan) StocksPLUS® TR Strategy Fund 1.2% 4.0% 2.8% 2.1% 2.7% - - - - - - - -
Japanese StocksPLUS® TR Strategy Fund 1.2% 5.1% 4.8% 6.4% 2.7% - - - - - - - -
US Equities, Net Short 24.8% 17.7% -9.2% -10.6% -15.0% 8.5% -12.2% -16.7% -1.9% -14.3% -18.1% -13.8% -15.1%
Fundamental PLUS Fund - - 7.7% 4.4% 2.8% 4.1% 0.4% 0.2% 1.3% 0.2% 0.0% 0.7% 0.5%
Low Volatility PLUS Fund - - - - - - - - - - 0.0% 2.8% 2.5%
Fundamental PLUS Small Fund - - - - - - - - 1.4% 0.9% 1.2% 0.8% 0.8%
Fundamental IndexPLUS™ - - - 3.7% 3.7% 0.0% 0.0% 0.0% - - - - -
StocksPLUS® Fund 5.7% 6.1% - 0.8% 0.2% 0.1% 0.0% 0.0% 0.1% 0.0% 0.0% 0.0% -
StocksPLUS® Absolute Return Fund 19.0% 11.6% 0.0% 0.0% 0.2% 0.1% 0.1% 0.0% 0.1% 0.1% 0.0% 0.0% -
StocksPLUS® Small Fund - - - - 0.3% 4.2% 0.2% 0.9% 0.5% 0.3% 0.0% 0.0% -
StocksPLUS® Short Fund** - - -17.0% -19.4% -22.3% 0.0% -12.9% -17.8% -5.3% -15.7% -19.3% -18.0% -19.0%
Leverage versus Net Assets 1.11x 1.23x 1.23x 1.28x 1.16x 1.09x 1.14x 1.24x 1.33x 1.35x 1.43x 1.43x 1.42x
MASTER PAGE NO. 239

pg 31Your Global Investment AuthorityYour Global Investment Authority
Attractive return potential with historically low equity risk
all_asset_app_03bP309 MASTER PAGE NO. 240
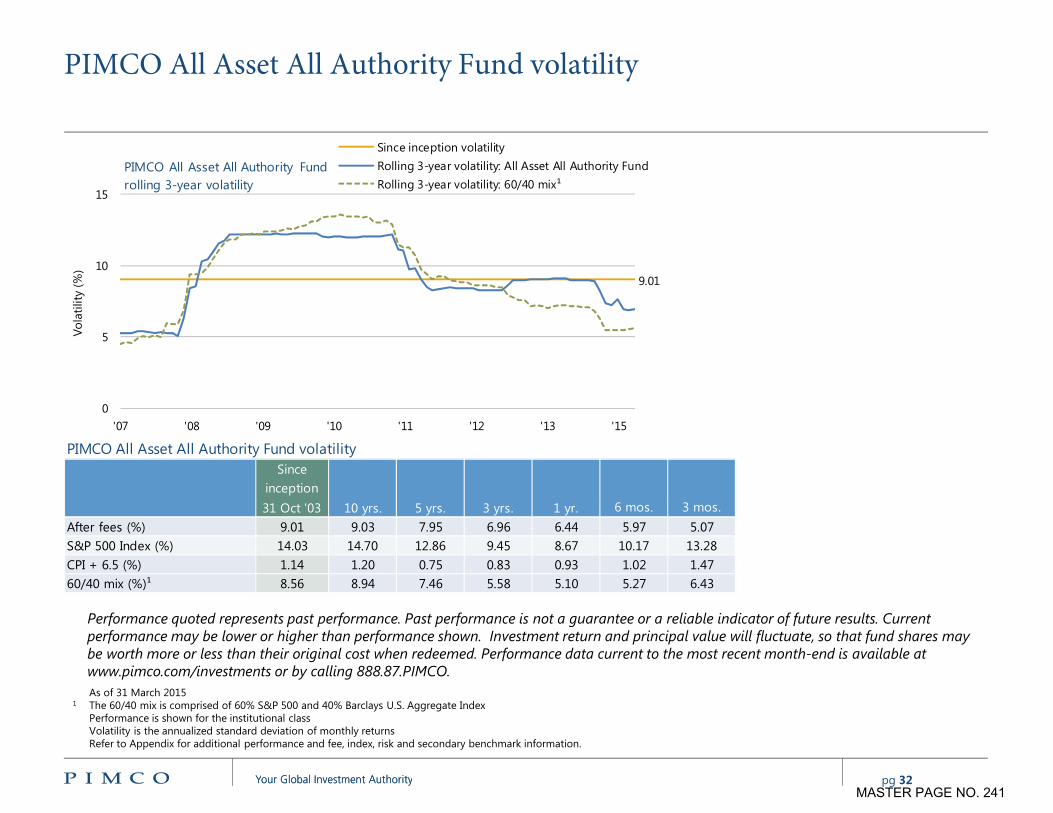
pg 32Your Global Investment AuthorityYour Global Investment Authority
PIMCO All Asset All Authority Fund volatility
As of 31 March 20151 The 60/40 mix is comprised of 60% S&P 500 and 40% Barclays U.S. Aggregate Index
Performance is shown for the institutional classVolatility is the annualized standard deviation of monthly returnsRefer to Appendix for additional performance and fee, index, risk and secondary benchmark information.
retu_791_avg_02_vol
PIMCO All Asset All Authority Fund volatilitySince
inception
31 Oct '03 10 yrs. 5 yrs. 3 yrs. 1 yr. 6 mos. 3 mos.
After fees (%) 9.01 9.03 7.95 6.96 6.44 5.97 5.07
S&P 500 Index (%) 14.03 14.70 12.86 9.45 8.67 10.17 13.28
CPI + 6.5 (%) 1.14 1.20 0.75 0.83 0.93 1.02 1.47
60/40 mix (%)¹ 8.56 8.94 7.46 5.58 5.10 5.27 6.43
9.01
0
5
10
15
'07 '08 '09 '10 '11 '12 '13 '15
Vo
lati
lity
(%)
PIMCO All Asset All Authority Fund
rolling 3-year volatility
Since inception volatility
Rolling 3-year volatility: All Asset All Authority Fund
Rolling 3-year volatility: 60/40 mix¹
Performance quoted represents past performance. Past performance is not a guarantee or a reliable indicator of future results. Current performance may be lower or higher than performance shown. Investment return and principal value will fluctuate, so that fund shares may be worth more or less than their original cost when redeemed. Performance data current to the most recent month-end is available at www.pimco.com/investments or by calling 888.87.PIMCO.
MASTER PAGE NO. 241

pg 33Your Global Investment AuthorityYour Global Investment Authority
PIMCO All Asset All Authority Fund: Seeking higher real returns at intermediate volatility
� PIMCO All Asset All Authority Fund has produced a high correlation to TIPS*, but with a meaningful return premium
– The high correlation is consistent with the CPI-based return of each
As of 31 March 2015* Treasury Inflation Protected Securities
** The 60/40 mix is comprised of 60% S&P 500 and 40% Barclays U.S. Aggregate Index1 AAAAF return differential is net of fees
Performance is shown for the institutional classRefer to Appendix for additional performance and fee, chart, correlation, index and risk information.
all_asset_review_19a
Performance quoted represents past performance. Past performance is not a guarantee or a reliable indicator of future results. Current performance may be lower or higher than performance shown. Investment return and principal value will fluctuate, so that fund shares may be worth more or less than their original cost when redeemed. Performance data current to the most recent month-end is available at www.pimco.com/investments or by calling 888.87.PIMCO.
31 Oct '03 – 31 Mar '15Correlation
to AAAAF
AAAAF
return
differential1
Volatility
PIMCO All Asset All Authority Fund,
after fees1.00 0.00% 9.0%
Barclays U.S. TIPS Index 0.71 +1.20% 6.3%
Barclays U.S. Aggregate Index 0.58 +1.23% 3.3%
S&P 500 0.55 -2.33% 14.1%
60/40 mix** 0.63 -1.03% 8.6%
MASTER PAGE NO. 242

pg 34Your Global Investment AuthorityYour Global Investment Authority
Comparison to PIMCO All Asset Fund
all_asset_app_06P309 MASTER PAGE NO. 243

pg 35Your Global Investment AuthorityYour Global Investment Authority
Comparison of key guidelines: All Asset vs. All Asset All Authority
As of 31 March 20151 Not normally to exceed. Total assets includes all holdings of PIMCO Funds, including the fund shares purchased in the All Asset All Authority Fund using a line of credit. 2 The All Asset All Authority Fund may draw against a line of credit to purchase more shares of underlying funds, as deemed attractive by the All Asset All Authority Fund’s investment process.
For example, for every $100 invested the All Asset All Authority Fund can borrow up to $50 to purchase more shares of underlying funds. 3 Consumer Price Index for All Urban Consumers (Seasonally Adjusted)4 Total Annual Operating Expense (Institutional Share Class): All Asset All Authority Fund: 1.68%; All Asset Fund: 0.965%
Refer to Appendix for additional risk and secondary benchmark information.
all_asset_review_12c
PIMCO ALL ASSET FUND4 PIMCO ALL ASSET ALL AUTHORITY FUND4
Exposure to any single fund Max 50% of total assets1
Max 50% of total assets1
Exposure to inflation related strategies(i.e., TIPS, commodities and REITs as a group)
Max 75% of total assets1
Max 75% of total assets1
Exposure to long-only equity strategies Max 50% of total assets1
Max 66 2/3% of total assets1
Exposure to Short Strategy Funds (e.g. PIMCO StocksPLUS AR Short Strategy Fund)
Not allowed Max 20% of total assets1
Use of direct borrowing to purchase additional shares of PIMCO Funds2
Not allowed Max 33 1/3% of total assets1
Secondary benchmark CPI + 5%3 CPI + 6.5%3
MASTER PAGE NO. 244

pg 36Your Global Investment AuthorityYour Global Investment Authority
PIMCO AUM by strategy
all_asset_app_05P309 MASTER PAGE NO. 245

pg 37Your Global Investment AuthorityYour Global Investment Authority
Assets under management by strategyPIMCO manages $1.59 trillion in assets, including $1.19 trillion in third-party client assets
asst_summary_01_USD
As of 31 March 2015SOURCE: PIMCOAssets reflect those managed on behalf of third-party clients and exclude affiliated assets. Fund of funds assets have been netted from each strategy. Potential differences in asset totals are due to rounding. Represents assets of strategy group in dedicated and non-dedicated portfolios.
1 Total Return has been segregated to isolate the assets of PIMCO sponsored U.S. Total Return 1940-act fund and foreign pool fund accounts. All other U.S. Total Return portfolios are included in the Intermediate category.
2 Stable value assets have not been netted from U.S. Total Return, U.S. Moderate Duration and U.S. Low Duration assets3 Tail-risk hedging assets reflect total notional value of dedicated mandates and are not counted towards PIMCO total assets under management
Alternatives Billions ($)
Liquid Absolute Return Unconstrained bond strategies, credit absolute return, other absolute return strategies 23.83
Hedge Funds Global macro, long/short credit, multi-asset volatility arbitrage strategies, relative value commodities 15.34
Opportunistic/Distressed Opportunistic strategies focusing on real estate related assets (residential, commercial), corporate credit 5.40
Asset Allocation
Asset Allocation Strategies Global Multi Asset, All Asset, EM Multi Asset, Real Retirement, Inflation-Response Multi Asset, DRA 63.31
Equities
Equity Strategies Combines enhanced equities and active equities 23.73
Real Return
Real Return Strategies Combines inflation linked strategies, actively managed commodities, and real-estate linked exposure 73.56
Fixed Income
Total Return1 Total Return 141.66
Intermediate2 Core Strategies, Moderate Duration 148.25
Credit Investment Grade Corporates, Bank Loans, High Yield Corporates, Convertibles 167.92
Long Duration Focus on long-term bonds; asset liability management 130.25
Global Non-U.S. and global multiple currency formats 102.04
Cash Management2 Money Market, Short-Term, Low Duration 94.06
Income Income-oriented, insurance income 80.73
Emerging Markets Local debt, external debt, currency 49.71
Mortgages Agency MBS, structured credit (non-Agency MBS, CMBS, and ABS) 33.39
Diversified Income Global credit combining corporate and emerging markets debt 21.52
Municipals Tax-efficient total return management 12.82
Other Custom mandates 9.05
$ 1,196.55 B
Stable Value2 Stable income with emphasis on principal stability 25.38
Tail-Risk Hedging3 Pooled and customized portfolios of actively managed tail-risk hedges 46.47
Total assets under management
MASTER PAGE NO. 246

pg 38Your Global Investment AuthorityYour Global Investment Authority
Appendix
!mk_AAAA_app
PERFORMANCE AND FEEPast performance is not a guarantee or a reliable indicator of future results. The performance figures presented reflect the total return performance for Institutional Class shares (after fees) and reflect changes in share price and reinvestment of dividend and capital gain distributions. All periods longer than one year are annualized. The minimum initial investment for Institutional class shares is $1 million; however, it may be modified for certain financial intermediaries who submit trades on behalf of eligible investors.
BETA COEFFICIENTA measure of the volatility, or systematic risk, of a security or a portfolio in comparison to the market as a whole.
CHARTPerformance results for certain charts and graphs may be limited by date ranges specified on those charts and graphs; different time periods may produce different results.
CORRELATIONThe statements contained in this presentation regarding the correlation of various indices or securities against one another or against inflation are based upon data over a long time period. These correlations may vary substantially in the future or over shorter time periods, resulting in greater volatility.
INVESTMENT STRATEGYThere is no guarantee that these investment strategies will work under all market conditions or are suitable for all investors and each investor should evaluate their ability to invest long-term, especially during periods of downturn in the market.
PORTFOLIO STRUCTUREPortfolio structure is subject to change without notice and may not be representative of current or future allocations.
RISKThe funds invest in other PIMCO funds and performance is subject to underlying investment weightings which will vary. Investing in the bond market is subject to risks, including market, interest rate, issuer, credit, inflation risk, and liquidity risk. The value of most bonds and bond strategies are impacted by changes in interest rates. Bonds and bond strategies with longer durations tend to be more sensitive and volatile than those with shorter durations; bond prices generally fall as interest rates rise, and the current low interest rate environment increases this risk. Current reductions in bond counterparty capacity may contribute to decreased market liquidity and increased price volatility. Bond investments may be worth more or less than the original cost when redeemed. Investing in foreign denominated and/or domiciled securities may involve heightened risk due to currency fluctuations, and economic and political risks, which may be enhanced in emerging markets. Commodities contain heightened risk including market, political, regulatory, and natural conditions, and may not be suitable for all investors. Mortgage and asset-backed securities may be sensitive to changes in interest rates, subject to early repayment risk, and their value may fluctuate in response to the market’s perception of issuer creditworthiness; while generally supported by some form of government or private guarantee there is no assurance that private guarantors will meet their obligations. High-yield, lower-rated, securities involve greater risk than higher-rated securities; portfolios that invest in them may be subject to greater levels of credit and liquidity risk than portfolios that do not. Inflation-linked bonds (ILBs) issued by a government are fixed-income securities whose principal value is periodically adjusted according to the rate of inflation; ILBs decline in value when real interest rates rise. Investing in securities of smaller companies tends to be more volatile and less liquid than securities of larger companies. Equities may decline in value due to both real and perceived general market, economic, and industry conditions. Derivatives and commodity-linked derivatives may involve certain costs and risks such as liquidity, interest rate, market, credit, management and the risk that a position could not be closed when most advantageous. Commodity-linked derivative instruments may involve additional costs and risks such as changes in commodity index volatility or factors affecting a particular industry or commodity, such as drought, floods, weather, livestock disease, embargoes, tariffs and international economic, political and regulatory developments. Investing in derivatives could lose more than the amount invested. The cost of investing in the funds will generally be higher than the cost of investing in a fund that invests directly in individual stocks and bonds. Diversification does not ensure against loss.
MASTER PAGE NO. 247

pg 39Your Global Investment AuthorityYour Global Investment Authority
Appendix
!mk_AAAA_app
SECONDARY BENCHMARKThe Funds' secondary benchmark is created by adding 5% (All Asset) or 6.5% (All Asset All Authority) to the annual percentage change in the Consumer Price Index ("CPI"). This index reflects seasonally adjusted returns. The Consumer Price Index is an unmanaged index representing the rate of inflation of the US consumer prices as determined by the US Department of Labor Statistics. There can be no guarantee that the CPI or other indexes will reflect the exact level of inflation at any given time. Prior to 31 July 2012 the Funds' benchmark used non-seasonally-adjusted CPI. The performance presented reflects this change in calculation.
This material contains the current opinions of the manager and such opinions are subject to change without notice. This material has been distributed for informational purposes only and should not be considered as investment advice or a recommendation of any particular security, strategy or investment product. Information contained herein has been obtained from sources believed to be reliable, but not guaranteed. No part of this material may be reproduced in any form, or referred to in any other publication, without express written permission. PIMCO and YOUR GLOBAL INVESTMENT AUTHORITY are trademarks or registered trademarks of Allianz Asset Management of America L.P. and Pacific Investment Management Company LLC, respectively, in the United States and throughout the world. ©2015, PIMCO.
PIMCO Investments LLC, distributor, 1633 Broadway, New York, NY, 10019, is a company of PIMCO.
INDEX DESCRIPTIONS60% S&P 500 / 40% BCAG Index - Synthesized from the Standard & Poor’s 500 and the Barclays U.S. Aggregate Index. Allocations are assigned to each index: 60% to the S&P 500 and 40% to the BCAG.
Barclays Long-Term Treasury consists of U.S. Treasury issues with maturities of 10 or more years.
Barclays U.S. Aggregate Index represents securities that are SEC-registered, taxable, and dollar denominated. The index covers the U.S. investment grade fixed rate bond market, with index components for government and corporate securities, mortgage pass-through securities, and asset-backed securities. These major sectors are subdivided into more specific indices that are calculated and reported on a regular basis.
Barclays U.S. TIPS: 1-10 Year is an unmanaged index market comprised of U.S. Treasury Inflation Protected securities having a maturity of at least 1 year and less than 10 years.
Barclays U.S. TIPS Index is an unmanaged market index comprised of all U.S. Treasury Inflation Protected Securities rated investment grade (Baa3 or better), have at least one year to final maturity, and at least $250 million par amount outstanding. Performance data for this index prior to October 1997 represents returns of the Barclays Inflation Notes Index.
The BofA Merrill Lynch U.S. High Yield BB-B Rated Index is an unmanaged market index comprised of various fixed income securities rated BB and B.
The Citigroup 3-Month Treasury Bill Index is an unmanaged index representing monthly return equivalents of yield averages of the last 3-month Treasury Bill issues.
The Consumer Price Index (CPI) is an unmanaged index representing the rate of inflation of the U.S. consumer prices as determined by the U.S. Department of Labor Statistics. There can be no guarantee that the CPI or other indexes will reflect the exact level of inflation at any given time.
The Dow Jones UBS Commodity Total Return Index is an unmanaged index composed of futures contracts on 19 physical commodities. The index is designed to be a highly liquid and diversified benchmark for commodities as an asset class. Prior to 7 May 2009, this index was known as the Dow Jones AIG Commodity Total Return Index.
Dow Jones U.S. Select Real Estate Investment Trust (REIT) Total Return Index, a subset of the Dow Jones U.S. Select Real Estate Securities Total Return Index, is an unmanaged index comprised of U.S. publicly traded Real Estate Investment Trusts. This index was formerly known as the Dow Jones Wilshire REIT Index.
The JPMorgan Emerging Markets Bond Index Plus is a total return index that tracks the traded market for U.S. dollar-denominated Brady and other similar sovereign restructured bonds traded in the emerging markets.
MASTER PAGE NO. 248

pg 40Your Global Investment AuthorityYour Global Investment Authority
Appendix
!mk_AAAA_app
The JPMorgan Non-U.S. Government Bond Index is an independently maintained and published index composed of non-U.S. government bonds with maturities of one year or more.
The MSCI EAFE (Morgan Stanley Capital International Europe, Australasia, Far East Index) is an unmanaged index of over 900 companies, and is a generally accepted benchmark for major overseas markets. Index weightings represent the relative capitalizations of the major overseas markets included in the index on a U.S. dollar adjusted basis.
The S&P 500 Index is an unmanaged market index generally considered representative of the stock market as a whole. The index focuses on the Large-Cap segment of the U.S. equities market.
It is not possible to invest directly in an unmanaged index.
MASTER PAGE NO. 249

This material is only authorized for use in the U.S. and for U.S. persons.
This document is intended for one-on-one use for investment professionals only and must not be relied on by anyone else.
Global Absolute Return Strategies (GARS)
Ventura County Employees' Retirement Association
May 18, 2015
Tam McVie Investment Director – Absolute Return Investment Specialist
Peter Schmole
Director, US Business Development
MASTER PAGE NO. 250

Standard Life Investments Worldwide
2
• Investment house founded in 1998 • Dedicated investment management
arm of the Standard Life Group, which was founded in 1825
• Clearly differentiated, successful investment philosophy and process
• HQ in Edinburgh – presence in London, Dublin, Paris, Frankfurt, Stockholm, Brussels, Milan, Madrid, Zurich, Boston, New York, Los Angeles, Toronto, Sydney, Hong Kong, Beijing, Seoul, Mumbai* and Tokyo**
Source: Standard Life Investments * Joint Venture with HDFC Asset Management, which is located in Mumbai ** Strategic Partnership with Sumitomo Mitsui Trust Bank Limited Please see Important Information at the back of this presentation
MASTER PAGE NO. 251

Global Absolute Return Strategies
3
• Objective Cash* +5% per year (gross) performance target over rolling 3 years basis Expected volatility range 4% - 8%
• Our Key Investment Themes
Investment Strategies Longer Term in Nature Markets are generally inefficient over long term time horizons (greater than 2 years) We see these market inefficiencies as opportunities which may be exploited by patient
investors
Enduring Diversification A robust portfolio that seeks to perform in a variety of future market conditions Experienced and integrated team combining idea generation, risk analysis and fund
management
Risk Controlled Implementation Strategies must be scalable and liquid Maximize the range of scenarios that may provide a positive return
* Cash is defined as 1 month USD LIBID rate Please see Important Information at the back of this presentation
MASTER PAGE NO. 252

Global Absolute Return Strategies
4
GARS Composite Performance
Annual GARS Composite
% R
etur
n
4.6
10.4
6.8 7.0 7.7
0.0 0.0 0.1 0.1 1.3
0
2
4
6
8
10
12
Q1 2015 1 Year 3 Years 5 Years Since Inception
GARS composite US$ Gross Return US 1 Month LIBID*
2014 2013 2012 2011 2010 2009 2008 2007
GARS Composite (Gross) 6.0 7.3 7.9 2.9 10.8 19.3 -6.4 8.4
1 Month LIBID* 0.0 0.1 0.1 0.1 0.2 0.2 2.6 5.4
* Source: Thomson Datastream for US 1 Month LIBID as of March 31, 2015 Source: Standard Life Investments, for US Composite gross Performance; $ GARS Composite performance from 06/12/2006 to 03/31/2015, Standard Life Investments converted U$ performance of £ Institutional Fund to the January 29, 2008, converted U$ performance of £ OEIC fund to July 31, 2009, weighted average of converted U$ performance of £ OEIC and the Off Shore GARS Fund to June 30, 2011, weighted average of converted U$ performance of £ OEIC, OffShore GARS Fund & GARS SICAV US$ thereafter. Gross performance does not reflect advisory or other fees that may be charged to the account Standard Life Investments claims compliance with the Global Investment Performance Standards (GIPS®). The portfolio specific data presented above is supplementary information to the US GARS GIPS® composite report, which is enclosed in the Appendix for your reference Past performance is no guarantee of future results. Please see Important Information at the back of this presentation
MASTER PAGE NO. 253

• Volatility: GARS 5.3% Global Equities 16.8%
(annualized, using monthly data, to 03/31/2015)
• VaR (95%, monthly): GARS -2.0% Global Equities -8.5%
(using monthly data, to 03/31/2015)
Risk Analytics
5
Consistent performance narrows the range of outcomes
Risk Statistics Market Capture & Drawdown • Global Equity Market Capture
Upside 30.5% Downside 1.9%
(using monthly data, to 03/31/2015)
• Maximum Drawdown: GARS -9.2% Global Equities -53.7%
(using daily data, to 03/31/2015)
Range of Outcomes
• Annualized Returns over Three Year Rolling Periods: High Low
GARS* 12.7% 4.2% Global Equities** 23.3% -10.9%
(using monthly data, to 03/31/2015)
** Source: Thomson Datastream as of March 31, 2015 * Source: Standard Life Investments, for US Composite gross Performance; $ GARS Composite performance from 06/12/2006 to 03/31/2015, Standard Life Investments converted U$ performance of £ Institutional Fund to the January 29, 2008, converted U$ performance of £ OEIC fund to July 31, 2009, weighted average of converted U$ performance of £ OEIC and the Off Shore GARS Fund to June 30, 2011, weighted average of converted U$ performance of £ OEIC, OffShore GARS Fund & GARS SICAV US$ thereafter Past performance is no guarantee of future results Please see Important Information at the back of this presentation
MASTER PAGE NO. 254

Multi-Asset Investing Team
6
Critical combination of skills and experience
MAI Team Members: Staff Area Average years in industry
Average years at Standard Life Investments
Economic Framework 10 Global Strategy 14 6
Risk Investigation 10 Multi-Asset Risk & Structuring 14 8
Idea Development and Implementation 26 Multi-Asset Management & Implementation 18 10
Development / Communication 8 Multi-Asset Investment Specialists 23 8
Head of Multi-Asset and Macro Investing
Jason Hepner CFA Dr Anne Friel PRM
Multi-Asset Risk and Structuring Dr Brian Fleming CFA PRM
Dr Robert de Roeck
Dr Jens Kroeske PRM FRM
Guy Stern CFA
Multi-Asset / Macro Portfolio Management
Malin Nairn James Esland CFA
Multi-Asset Business Management
Rates & Real Returns Philip Laing
Roger Sadewsky
Colette Conboy Scott Smith CFA Sebastian Mackay
Murray Forbes
Multi-Asset
Adam Rudd CFA
David Sol
Owen McCrossan FIA Richard Martin FIA
Global Strategy
Neil Richardson
Naglis Vysniauskas
Katy Forbes CFA Adam Skerry Tom Walker
Jack Kelly Liam O’Donnell CFA Ross Hutchison
Norest Zvavamwe CFA Sean Flanagan CFA
Christopher Nichols FIA Mark Foster FFA Malcolm Jones FFA David Bint Scott Kay Tam McVie* Stuart Peskin CFA* Andrew Spooner*
Multi-Asset Investment Specialists
David Kirkpatrick Multi-Asset Implementation
Audrey Simpson Alex Berry
Jennifer Catlow CFA
Stephen Kerr Kevin Hogg Harry Barnes
Kenny MacMaster
Dr Chris Faulkner – MacDonagh
Andrew Milligan
Frances Hudson
Craig Hoyda Govinda Finn
Harry Smith
Jeremy Lawson
Alex Wolf James McCann
Stephanie Kelly
Abdel Chabi-Yo Lynne Provan Andy McNeill
Graeme Lindsay Nicholas Hutchings
Mark Holden Vincent Ropers
* Based in North America, GARS Portfolio Constructors, Grey boxes denote reporting lines only The Real Returns and Rates teams provide macro research and views, they do not have a direct input into the management of the GARS Portfolio and are therefore not included in the number of investment professionals for the product and are therefore greyed out Source Standard Life Investments as of March 31, 2015 Please see Important Information at the back of this presentation
MASTER PAGE NO. 255

GARS Process
7 Please see Important Information at the back of this presentation
Integrated with broad skill set across Standard Life Investments
Fundamental economic analysis
Asset class team views
and strategies
Quantitative modelling
Valuation modelling
Multi-Asset Risk and Structuring
Pre-Trade Risk Diversification Measurement Scenario Analysis
Strategic Investment Group • Review • Debate • Ratify / Reject
Conviction Diversity Liquidity
Idea Generation
Selection
Implementation Multi-Asset Management
Strategy Implementation Final Position Sizing Execution
Investment Governance &
Oversight
• Independent Risk Analysis
• Counterparty Risk Management
• Investment Governance
MASTER PAGE NO. 256

Risk-based Portfolio Construction
8
Portfolio construction through a strategy lens Source: Standard Life Investments US Representative GARS portfolio as of March 31, 2015 The Security Selection component of the share of the market risk exposure represents exposure to the excess returns of actively managed portfolios in various asset classes Please see Important Information at the back of this presentation
Share of market risk exposure by strategy
Share of market risk exposure by risk categories
Equities, 2.71%
FX, 1.74%
Duration, 1.31%
Stock Selection,
0.63%
Credit, 0.50%
Volatility, 0.48%
MASTER PAGE NO. 257

Risk Profile
9
Risk Profile of Multi-market Return Strategy
Source: Standard Life Investments US Representative GARS portfolio as of March 31, 2015 *Risk analysis is conducted using Sungard APT, a 3rd party system Key to color coding: Market, Directional, Relative Value and Security Selection Please see Important Information at the back of this presentation
• The portfolio is exposed to multiple & diverse market risks
• Total stand-alone investment risk that is deployed to seek returns is 13.0%
• Equivalent equity volatility is 12.4%
• Independent risk analysis* shows the benefits of investment diversification
Stan
d-al
one
Ris
k
MASTER PAGE NO. 258

Individual Strategies Risk
10
1. MSCI WORLD equity vol (12.4%), 2. Limit on % total standalone: 30%, 3. Also known as Contribution to Risk Source: Standard Life Investments US Representative GARS portfolio as of March 31, 2015 Please see Important Information at the back of this presentation
% of equity vol1 ρ Volatility 3.91% 31.4% 0.04
Fully correlated risk categories 13.03% 105% 1 Uncorrelated risk categories 2.83% 23% 0
VaR (99%, 1 month) 72,908,622 2.62% as % of NAV
Risk Categories Stand-alone risk % of total standalone 2 Diversification Position-
removal Correlation Marginal Attribution3
Exposures Long Short
US equity tech v small cap 1.04% 8.01% -1.33% -0.09% -0.21 0.05% 10.5% -10.6% Short US duration 0.94% 7.18% 1.16% 0.29% 0.20 0.40% 5.6% -24.1% European equity 0.92% 7.08% 1.91% 0.62% 0.60 0.68% 8.7% -3.1% US butterfly 0.71% 5.46% -1.38% -0.18% -0.33 -0.12% 31.3% -77.0% European equity banks 0.67% 5.11% 1.19% 0.24% 0.29 0.29% 4.2% -4.0% Long MXN v AUD 0.66% 5.09% 1.08% 0.21% 0.24 0.26% 7.7% -7.5% Global equity 0.65% 5.00% 1.68% 0.44% 0.62 0.47% 15.9% -11.1% Global equity miners 0.63% 4.86% 1.53% 0.37% 0.52 0.40% 2.7% 0.0% Stock Selection 0.63% 4.84% 0.40% 0.07% 0.03 0.12% 35.2% -35.2% Long INR v EUR 0.55% 4.24% 1.20% 0.23% 0.36 0.26% 5.3% -5.1% Long USD v EUR 0.55% 4.23% -0.63% -0.01% -0.09 0.03% 7.1% -6.5% Long USD v CAD 0.55% 4.18% -1.22% -0.15% -0.34 -0.11% 7.7% -7.6% Japanese v Korean Equity 0.54% 4.17% 0.82% 0.13% 0.16 0.16% 2.8% -2.6% Mexican rates v EUR 0.51% 3.90% 1.27% 0.25% 0.44 0.27% 10.3% -5.1% German v French equity 0.50% 3.87% 0.39% 0.05% 0.04 0.08% 5.1% -4.9% European v US and Japanese duration 0.42% 3.20% 0.58% 0.07% 0.11 0.09% 10.0% -10.7% Australian forward-start interest rates 0.42% 3.19% -0.71% -0.04% -0.15 -0.02% 36.7% -8.8% EU corporate bonds 0.34% 2.63% 0.32% 0.03% 0.04 0.04% 6.5% 0.0% Brazilian government bonds 0.33% 2.54% 0.58% 0.06% 0.13 0.07% 3.4% 0.0% High yield credit 0.31% 2.38% 1.15% 0.19% 0.58 0.19% 4.6% 0.0% Long European payer swaptions 0.23% 1.77% 0.60% 0.05% 0.20 0.06% 0.0% -1.5% Asian v S&P variance 0.23% 1.74% 0.70% 0.07% 0.28 0.08% 0.0% 0.0% HSCEI v FTSE variance 0.21% 1.63% 0.40% 0.03% 0.10 0.03% 0.0% 0.0% Chinese equity 0.20% 1.51% 0.14% 0.01% 0.01 0.01% 1.9% -1.9% Long USD v JPY 0.17% 1.32% 0.68% 0.06% 0.35 0.07% 1.8% -1.7% FX Hedging 0.09% 0.67% 0.31% 0.01% 0.14 0.01% 1.5% -0.4% Liquid Instruments 0.03% 0.20% 0.33% 0.01% 0.55 0.01% 13.9% 0.0% Cash 0.00% 0.00% 0.00% 0.00% 0.00 0.00% 33.1% 0.0%
Total (exposures ex.cash): 13.03% 100.00% 3.03% 3.91% 205.3% -194.3%
Diversification benefit: 9.12%
MASTER PAGE NO. 259
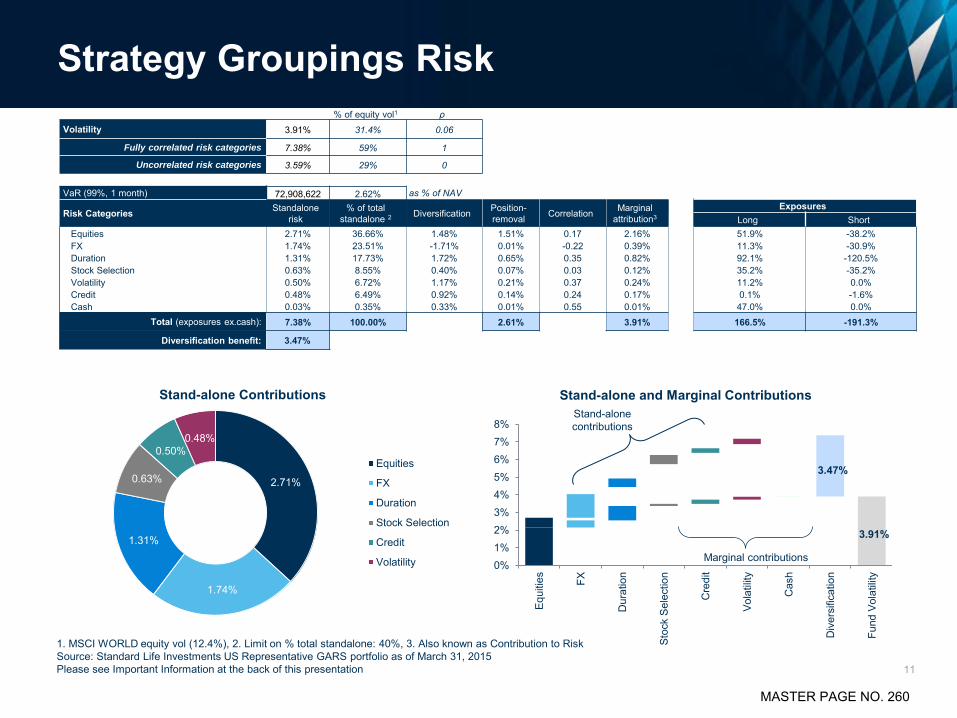
Strategy Groupings Risk
11
1. MSCI WORLD equity vol (12.4%), 2. Limit on % total standalone: 40%, 3. Also known as Contribution to Risk Source: Standard Life Investments US Representative GARS portfolio as of March 31, 2015 Please see Important Information at the back of this presentation
% of equity vol1 ρ Volatility 3.91% 31.4% 0.06
Fully correlated risk categories 7.38% 59% 1
Uncorrelated risk categories 3.59% 29% 0
VaR (99%, 1 month) 72,908,622 2.62% as % of NAV
Risk Categories Standalone risk
% of total standalone 2 Diversification Position-
removal Correlation Marginal attribution3
Exposures Long Short
Equities 2.71% 36.66% 1.48% 1.51% 0.17 2.16% 51.9% -38.2% FX 1.74% 23.51% -1.71% 0.01% -0.22 0.39% 11.3% -30.9% Duration 1.31% 17.73% 1.72% 0.65% 0.35 0.82% 92.1% -120.5% Stock Selection 0.63% 8.55% 0.40% 0.07% 0.03 0.12% 35.2% -35.2% Volatility 0.50% 6.72% 1.17% 0.21% 0.37 0.24% 11.2% 0.0% Credit 0.48% 6.49% 0.92% 0.14% 0.24 0.17% 0.1% -1.6% Cash 0.03% 0.35% 0.33% 0.01% 0.55 0.01% 47.0% 0.0%
Total (exposures ex.cash): 7.38% 100.00% 2.61% 3.91% 166.5% -191.3%
Diversification benefit: 3.47%
2.71%
1.74%
1.31%
0.63%
0.50% 0.48%
Equities
FX
Duration
Stock Selection
Credit
Volatility
Stand-alone Contributions Stand-alone and Marginal Contributions
0%1%2%3%4%5%6%7%8%
Equi
ties
FX
Dur
atio
n
Stoc
k S
elec
tion
Cre
dit
Vola
tility
Cas
h
Div
ersi
ficat
ion
Fund
Vol
atili
ty
Marginal contributions
Stand-alone contributions
3.47%
3.91%
MASTER PAGE NO. 260

Portfolio Outlook / Themes
12
Source: Standard Life Investments US Representative GARS portfolio as of March 31, 2015 Key to themes: Market, Directional, Relative Value and Security Selection Please see Important Information at the back of this presentation
Multi-Speed Global Growth German vs French equity Brazilian Government bonds
Central Bank Policy
US short forward interest rates Long US Dollar vs Japanese Yen European vs US & Japanese interest rates European banks vs European equity
Growth Potential and Uncertainty
European equity US Relative interest rates (Butterfly)
Resources and Demand
Long US Dollar vs Canadian Dollar Global miners equity
MASTER PAGE NO. 261

Key Benefits to GARS
13 Please see Important Information at the back of this presentation
Our goal: Exceptional rewards for modest risk levels
Diversity Broad range of return-seeking positions Positions carefully chosen to work in conjunction with one another
Transparency Communication program covering outlook and strategy positions Comprehensive return and risk attribution
Liquidity High underlying liquidity
Fit to your existing portfolio Growth engine / equity replacement Complimentary holding to a variety of investment strategies Palatable “Alternative Investment” – low, flat fee structure
MASTER PAGE NO. 262

Appendices
MASTER PAGE NO. 263

Strategy Activity Over the Last Four Quarters
15
Q2 2014
Closed European Duration (Forward Start)
Added Brazilian Gov’t Bonds (hedged)
Q3 2014 Reduced Investment Grade
credit exposure in UK and EU
Reduced UK Equity exposure
Added US $ vs NZ $
Added INR vs €
Added European Banks Relative Value
Added Short US Forward Duration
Closed European Long-End Curve Steepener
Q4 2014
Closed US Dollar vs NZ Dollar
Increased Brazilian Gov’t Bonds
Captured profit on Long Equity Variance then rebuilt position
Closed Global REIT
Implemented short strangle
on US$ vs Yen
Added US Relative Interest Rates (Butterfly)
Q1 2015
Closed Global Oil majors
Closed Short UK real yield
Closed Global miners equity vs Swiss equity
Added Global miners equity
Reduced equity beta over the quarter
Closed long equity variance
Reduced US Dollar vs Canadian Dollar
Closed strategies shown in italics Source: Standard Life Investments US Representative GARS portfolio as of March 31, 2015 Key to themes: Market, Directional, Relative Value and Security Selection Please see Important Information at the back of this presentation
MASTER PAGE NO. 264

Dynamic Diversification
16
Source: Standard Life Investments sample GARS portfolio as of March 31, 2015 The above strategy types are for illustrative purposes only to visualize the approach of changing risk allocation in a portfolio over a stated period of time Please see Important Information at the back of this presentation
0%
10%
20%
30%
40%
50%
60%
70%
80%
90%
100%
Dec-06 Dec-07 Dec-08 Dec-09 Dec-10 Dec-11 Mar-12 Jun-12 Sep-12 Dec-12 Dec-13 Mar-14 Jun-14 Sep-14 Dec-14 Mar-15
Market Returns Directional Relative Value Security Selection
Vola
tility
MASTER PAGE NO. 265

Changing Risk Allocation
17
Stra
tegy
Exp
osur
e
0.00%
10.00%
20.00%
30.00%
40.00%
50.00%
60.00%
70.00%
80.00%
90.00%
100.00%Security Selection
Inflation
Real Estate
Credit
Volatility
FX
Duration
Equities
• Strategy groups reflect the broad themes of risk exposure
• Each one is expected to have distinct behavior characteristics
• No one strategy group may actively be set to be more than 40% of aggregate risk
• Weighting reflects size coupled with a moving assessment of historic market volatility over 3 years
• Clear broad move away from Duration risk since the peak in Q1 2009
Source: Standard Life Investments sample GARS portfolio as of March 31, 2015 The above strategy exposures are for illustrative purposes only to visualize the approach of changing risk allocation in a portfolio over a stated period of time Please see Important Information at the back of this presentation
MASTER PAGE NO. 266

US Equities
18
Chart source: Bloomberg as of March 31, 2015. Comments: Standard Life Investments as of March 31, 2015 Key to color coding: Market, Directional, Relative Value and Security Selection. Index information is provided for illustrative purposes only and is not intended to imply past or future performance. Please note an investor cannot invest directly in an index . Unless otherwise noted, index returns reflect the reinvestment of income and dividends, if any, but do not reflect fees, brokerage commissions or other expenses of investing. Please see Important Information at the back of this presentation
• The outlook for US growth is positive, with the end of QE and the prospects of the Fed hiking rates in H2 2015 highlights that the economy is approaching escape velocity. Investors remain confident of strong US economic performance; the housing market is healthy, and rising prices and increased activity levels are important positives
• Repairs to banks' balance sheets have enabled the health of the financial sector to improve, allowing the transmission of very low Fed rates into the economy
• Valuations are not particularly expensive relative to their long term history, and have scope to further expand over the medium term. The asset class can benefit from inflows from yield and income seeking investors
600
800
1000
1200
1400
1600
1800
2000
2200
Jan 00
Jul 00
Jan 01
Jul 01
Jan 02
Jul 02
Jan 03
Jul 03
Jan 04
Jul 04
Jan 05
Jul 05
Jan 06
Jul 06
Jan 07
Jul 07
Jan 08
Jul 08
Jan 09
Jul 09
Jan 10
Jul 10
Jan 11
Jul 11
Jan 12
Jul 12
Jan 13
Jul 13
Jan 14
Jul 14
Jan 15
Inde
x Le
vel
Date
S&P 500 Index Implementation date
Strategy benefits when the index rises
MASTER PAGE NO. 267
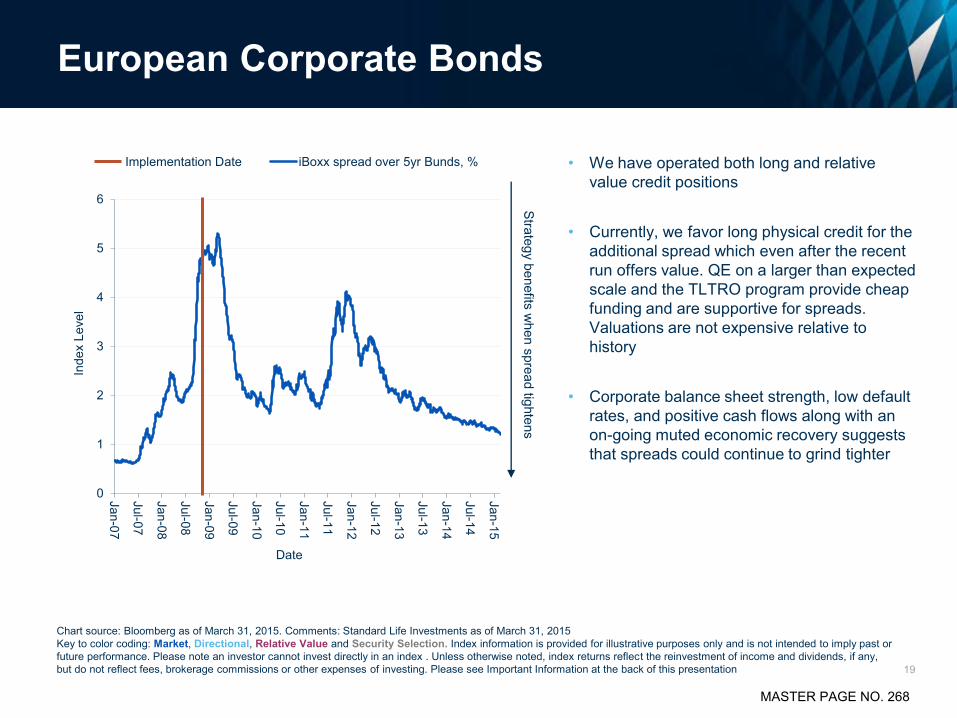
European Corporate Bonds
19
Chart source: Bloomberg as of March 31, 2015. Comments: Standard Life Investments as of March 31, 2015 Key to color coding: Market, Directional, Relative Value and Security Selection. Index information is provided for illustrative purposes only and is not intended to imply past or future performance. Please note an investor cannot invest directly in an index . Unless otherwise noted, index returns reflect the reinvestment of income and dividends, if any, but do not reflect fees, brokerage commissions or other expenses of investing. Please see Important Information at the back of this presentation
• We have operated both long and relative value credit positions
• Currently, we favor long physical credit for the additional spread which even after the recent run offers value. QE on a larger than expected scale and the TLTRO program provide cheap funding and are supportive for spreads. Valuations are not expensive relative to history
• Corporate balance sheet strength, low default rates, and positive cash flows along with an on-going muted economic recovery suggests that spreads could continue to grind tighter
0
1
2
3
4
5
6
Jan-07
Jul-07
Jan-08
Jul-08
Jan-09
Jul-09
Jan-10
Jul-10
Jan-11
Jul-11
Jan-12
Jul-12
Jan-13
Jul-13
Jan-14
Jul-14
Jan-15
Inde
x Le
vel
Date
Implementation Date iBoxx spread over 5yr Bunds, %
Strategy benefits when spread tightens
MASTER PAGE NO. 268

0
5
10
15
20
25
0
5
10
15
20
25
Jan 08
Jul 08
Jan 09
Jul 09
Jan 10
Jul 10
Jan 11
Jul 11
Jan 12
Jul 12
Jan 13
Jul 13
Jan 14
Jul 14
Jan 15
Spr
ead
Libo
r (%
)
Option adjusted spread for Merril Lynch Global Non-Financial High Yield Constrained Index LIBOR USD 6 Months
Strategy benefits when spreads tighten
High Yield Credit
20
Chart source: Bloomberg as of March 31, 2015. Comments: Standard Life Investments as of March 31, 2015 Key to color coding: Market, Directional, Relative Value and Security Selection. Index information is provided for illustrative purposes only and is not intended to imply past or future performance. Please note an investor cannot invest directly in an index . Unless otherwise noted, index returns reflect the reinvestment of income and dividends, if any, but do not reflect fees, brokerage commissions or other expenses of investing. Please see Important Information at the back of this presentation
• High yield credit delivers equity-like returns over some periods, though as high yield debt is further up the capital structure of the corporate balance sheet, risk-adjusted returns can be very attractive
• High yield bonds also provide a substantial additional yield over cash, supported by a positive outlook for corporate earnings. Default rates remain low
• The price behavior of high yield is closely correlated with equity but in a significant equity sell-off, when volatility rises, high yield should outperform - absent a recession
MASTER PAGE NO. 269

Global Miners
21
Chart source: Bloomberg as of March 31, 2015. Comments: Standard Life Investments as of March 31, 2015 Key to color coding: Market, Directional, Relative Value and Security Selection. Index information is provided for illustrative purposes only and is not intended to imply past or future performance. Please note an investor cannot invest directly in an index . Unless otherwise noted, index returns reflect the reinvestment of income and dividends, if any, but do not reflect fees, brokerage commissions or other expenses of investing. Please see Important Information at the back of this presentation
• The mining industry is focusing on capital discipline, cost cutting and returning capital to investors. Valuations are now attractive after the recent sell-off in commodities
• The backdrop of a positive global growth outlook, e.g. China meeting its economic growth forecasts, should act as a driver for commodity demand. Mining stocks are positively correlated with the US dollar, which should appreciate in anticipation of the Fed hiking rates in H2
100
150
200
250
300
350
400
450
Jan 05
Jul 05
Jan 06
Jul 06
Jan 07
Jul 07
Jan 08
Jul 08
Jan 09
Jul 09
Jan 10
Jul 10
Jan 11
Jul 11
Jan 12
Jul 12
Jan 13
Jul 13
Jan 14
Jul 14
Jan 15
Rel
ativ
e Pe
rform
ance
Date
FTSE 350 Mining Index (04/01/2005=100) Implementation Date
Strategy benefits when the index level rises
MASTER PAGE NO. 270

US Dollar vs Euro
22
Chart source: Datastream as of March 31, 2015. Comments: Standard Life Investments as of March 31, 2015 Key to color coding: Market, Directional, Relative Value and Security Selection. Index information is provided for illustrative purposes only and is not intended to imply past or future performance. Please note an investor cannot invest directly in an index . Unless otherwise noted, index returns reflect the reinvestment of income and dividends, if any, but do not reflect fees, brokerage commissions or other expenses of investing. Please see Important Information at the back of this presentation
• Monetary policy is disconnecting with the ECB instigating negative interest rates and undertaking QE, while the US has fully tapered QE and is looking to raise rates in H2 2015
• The AQR has given an indication that Euro banks have sufficiently developed, which should remove another headwind for the short Euro leg. Longer term concerns regarding several European economies' fiscal positions have not gone away
• The Euro remains expensive and the economic and political problems of the region should keep the currency under pressure. In contrast the US economic recovery is more robust and durable, acting as an important support for the Dollar
1.00
1.10
1.20
1.30
1.40
1.50
1.60
1.70
Jan-08 Jan-09 Jan-10 Jan-11 Jan-12 Jan-13 Jan-14 Jan-15
US
D/E
UR
Date
$ per € Implementation date
Strategy benefits when the rate decreases
MASTER PAGE NO. 271

US Dollar vs Japanese Yen
23
Chart source: Datastream as of March 31, 2015. Comments: Standard Life Investments as of March 31, 2015 Key to color coding: Market, Directional, Relative Value and Security Selection. Index information is provided for illustrative purposes only and is not intended to imply past or future performance. Please note an investor cannot invest directly in an index . Unless otherwise noted, index returns reflect the reinvestment of income and dividends, if any, but do not reflect fees, brokerage commissions or other expenses of investing. Please see Important Information at the back of this presentation
• Monetary policy is becoming disconnected with the BoJ recently expanding the its QQE program, while the US has fully tapered and the Fed is indicating rate rises are on the horizon in H2 2015
• Japanese debt levels are very high, and make the risks of policy error considerable; a deteriorating current account balance means that the BoJ must take action to prevent any strengthen of the Yen
• The US economic recovery is continuing, as evidenced by strong employment growth and other economic data
75
80
85
90
95
100
105
110
115
120
125
Aug 07
Feb 08
Aug 08
Feb 09
Aug 09
Feb 10
Aug 10
Feb 11
Aug 11
Feb 12
Aug 12
Feb 13
Aug 13
Feb 14
Aug 14
Feb 15
JPY/
US
D
Date
Yen per $ Implementation date
Strategy benefits when the rate rises
MASTER PAGE NO. 272

US Dollar vs Canadian Dollar
24
Chart source: Bloomberg as of March 31, 2015. Comments: Standard Life Investments as of March 31, 2015 Key to color coding: Market, Directional, Relative Value and Security Selection. Index information is provided for illustrative purposes only and is not intended to imply past or future performance. Please note an investor cannot invest directly in an index . Unless otherwise noted, index returns reflect the reinvestment of income and dividends, if any, but do not reflect fees, brokerage commissions or other expenses of investing. Please see Important Information at the back of this presentation
• Canadian exposure to a global slowdown is greater than that of the US which is more domestically orientated. Canadian consumers and banks remain more levered than in the US, with a stretched housing market. This creates domestic economic risks in the years ahead
• China's rebalancing of its economy away from investment and over to consumption makes the Canadian Dollar vulnerable, as its strength depends on buoyant commodity prices. Continued lower oil prices will have a large negative macro impact on the Canadian economy
• The withdrawal of quantitative easing in the US will cause money supply growth to slow, and stronger economic growth can be a driver of US Dollar strength; US rate hikes are a support for further US Dollar strength 0.90
0.95
1.00
1.05
1.10
1.15
1.20
1.25
1.30
1.35
1.40
1.45
1.50
1.55
1.60
1.65
Jan
00
Jan
01
Jan
02
Jan
03
Jan
04
Jan
05
Jan
06
Jan
07
Jan
08
Jan
09
Jan
10
Jan
11
Jan
12
Jan
13
Jan
14
Jan
15
CAD
/USD
Date
USD-CAD Exchange Rate Implementation date
Strategy benefits when the rate rises
MASTER PAGE NO. 273

Mexican Peso vs Australian Dollar
25
Chart source: Bloomberg as of March 31, 2015. Comments: Standard Life Investments as of March 31, 2015 Key to color coding: Market, Directional, Relative Value and Security Selection. Index information is provided for illustrative purposes only and is not intended to imply past or future performance. Please note an investor cannot invest directly in an index . Unless otherwise noted, index returns reflect the reinvestment of income and dividends, if any, but do not reflect fees, brokerage commissions or other expenses of investing. Please see Important Information at the back of this presentation
74
76
78
80
82
84
86
88
90
92
94
Jan 11 Jul 11 Jan 12 Jul 12 Jan 13 Jul 13 Jan 14 Jul 14 Jan 15
MX
NAU
D C
arry
Inde
x
Date
MXN-AUD Carry Return Implementation Date
Strategy benefits when the rate rises
• Mexico is taking market share from China in terms of US imports, and has a cheap currency. The economy is expected to grow faster than the Australian economy, helped by low leverage ratios across the Mexican economy
• Australian Dollar valuations had become very stretched, driven up by safe haven flows and the search for yield. The excessive strength of Australian Dollar is causing significant problems for parts of its economy
• Mexican Peso vs Australian Dollar has enjoyed a positive carry, and we expect this to widen over time given the RBA's propensity to cut rates given the flagging Australian economy
MASTER PAGE NO. 274

Indian Rupee vs Euro
26
Chart source: Bloomberg as of March 31, 2015. Comments: Standard Life Investments as of March 31, 2015 Key to color coding: Market, Directional, Relative Value and Security Selection. Index information is provided for illustrative purposes only and is not intended to imply past or future performance. Please note an investor cannot invest directly in an index . Unless otherwise noted, index returns reflect the reinvestment of income and dividends, if any, but do not reflect fees, brokerage commissions or other expenses of investing. Please see Important Information at the back of this presentation
110
120
130
140
150
160
170
180
190
200
Jan
00
Jan
01
Jan
02
Jan
03
Jan
04
Jan
05
Jan
06
Jan
07
Jan
08
Jan
09
Jan
10
Jan
11
Jan
12
Jan
13
Jan
14
Jan
15
Inde
x Le
vel
Date
Indian Rupee - Euro carry return index Implementation date
Strategy benefits when the index level rises
• This pairing benefits from the Indian Rupee's appeal as a carry currency and the need in Europe for the Euro to depreciate
• The Indian central bank and government have gained credibility by reducing the current account deficit and by introducing an inflation target; further reforms and an increase in FX reserves make the currency less vulnerable to rate rises in the US
• ECB actions in the form of QE, TLTRO and negative deposit rates should have the effect of dampening the currency. Recent bank deleveraging in time for the AQR looks to be almost complete, hence a support of Euro strength is in the process of being removed
MASTER PAGE NO. 275

2.0
2.5
3.0
3.5
4.0
4.5
5.0
5.5
Jan 10 Jul 10 Jan 11 Jul 11 Jan 12 Jul 12 Jan 13 Jul 13 Jan 14 Jul 14 Jan 15
Yiel
d (%
)
Date
US 30yr Treasury yield Implementation dates
Strategy benefits as the yield rises US Short Forward Interest Rates
27
Chart source: Datastream as of March 31, 2015. Comments: Standard Life Investments as of March 31, 2015 Key to color coding: Market, Directional, Relative Value and Security Selection. Index information is provided for illustrative purposes only and is not intended to imply past or future performance. Please note an investor cannot invest directly in an index . Unless otherwise noted, index returns reflect the reinvestment of income and dividends, if any, but do not reflect fees, brokerage commissions or other expenses of investing. Please see Important Information at the back of this presentation
• This position should benefit from a sell-off in US duration. More recently, long-dated forward rates in the US have reversed much of the increases seen in 2013. This move doesn’t appear to be caused by the fundamentals and is probably a reflection of ‘non-economic’ buying by foreign reserve managers
• Even if such flows continue, we would expect the private sector to respond to lower cost of borrowing by increasing investment given that significant deleveraging has already been achieved and capital stock is relatively low and aged
• The drop in forward rates may therefore be a temporary mismatch between planned savings and investment • This position is implemented through USD 20yr forward 10yr payer swap to avoid negative carry and achieve a
marginally positive roll-premium
MASTER PAGE NO. 276
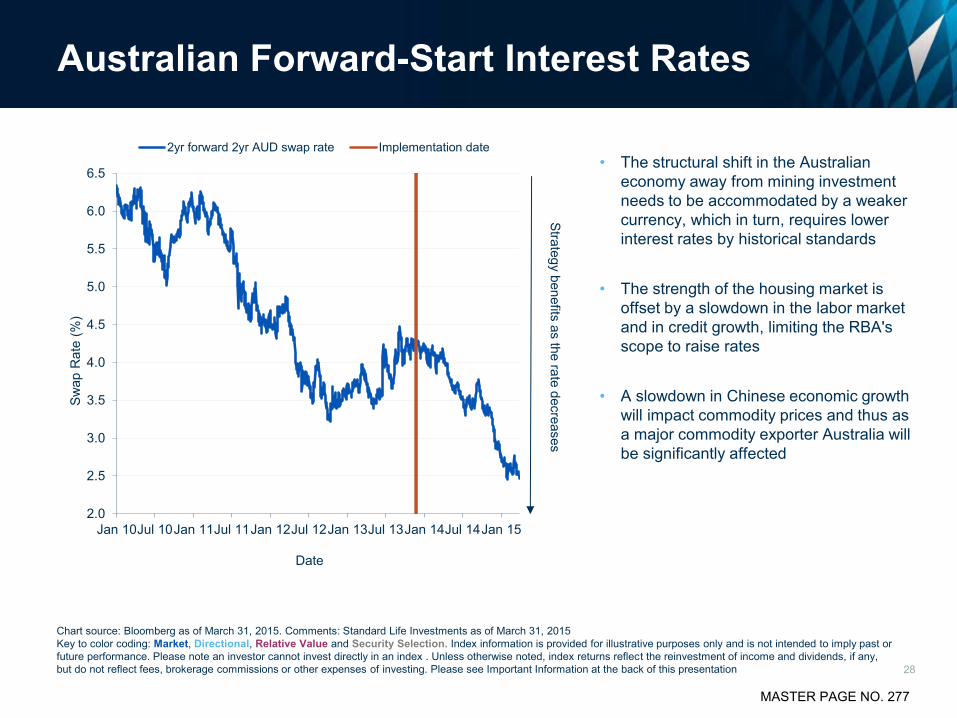
Australian Forward-Start Interest Rates
28
Chart source: Bloomberg as of March 31, 2015. Comments: Standard Life Investments as of March 31, 2015 Key to color coding: Market, Directional, Relative Value and Security Selection. Index information is provided for illustrative purposes only and is not intended to imply past or future performance. Please note an investor cannot invest directly in an index . Unless otherwise noted, index returns reflect the reinvestment of income and dividends, if any, but do not reflect fees, brokerage commissions or other expenses of investing. Please see Important Information at the back of this presentation
• The structural shift in the Australian economy away from mining investment needs to be accommodated by a weaker currency, which in turn, requires lower interest rates by historical standards
• The strength of the housing market is offset by a slowdown in the labor market and in credit growth, limiting the RBA's scope to raise rates
• A slowdown in Chinese economic growth will impact commodity prices and thus as a major commodity exporter Australia will be significantly affected
2.0
2.5
3.0
3.5
4.0
4.5
5.0
5.5
6.0
6.5
Jan 10Jul 10Jan 11Jul 11Jan 12Jul 12Jan 13Jul 13Jan 14Jul 14Jan 15
Swap
Rat
e (%
)
Date
2yr forward 2yr AUD swap rate Implementation date
Strategy benefits as the rate decreases
MASTER PAGE NO. 277

Mexican Government Bonds
29
Chart source: Bloomberg as of March 31, 2015. Comments: Standard Life Investments as of March 31, 2015 Key to color coding: Market, Directional, Relative Value and Security Selection. Index information is provided for illustrative purposes only and is not intended to imply past or future performance. Please note an investor cannot invest directly in an index . Unless otherwise noted, index returns reflect the reinvestment of income and dividends, if any, but do not reflect fees, brokerage commissions or other expenses of investing. Please see Important Information at the back of this presentation
360
380
400
420
440
460
480
Feb 11 Aug 11 Feb 12 Aug 12 Feb 13 Aug 13 Feb 14 Aug 14 Feb 15
Strategy benefits w
hen the index level rises
• Mexican bond yields are attractive in a global context, given low rates elsewhere. The country is Investment Grade, with a relatively low debt to GDP ratio and core inflation is muted at this time
• The Mexican Peso continues to be undervalued and this should boost the return projections for an unhedged Mexican Peso bond position. Real trend GDP at 3-4% is good vs the global economy, however not as strong as other Asian competitors
• Mexico is gaining market share within the US import market vs China, given China's wage and inflation pressures. This is an important strategic positive for Mexico
MASTER PAGE NO. 278

40
44
48
52
56
60
64
68
72
Jan 10 Jul 10 Jan 11 Jul 11 Jan 12 Jul 12 Jan 13 Jul 13 Jan 14 Jul 14 Jan 15
Vola
tility
(bp
s)
Date
European 20y fwd 20yr Swaption Implementation date
• European interest rate volatility was suppressed due to excess demand for callable bonds from German insurers who sought to enhance their yield in a low rates environment
• Callable bonds ordinarily offer a higher yield because the issuer has an option to redeem the bonds • Our view is that the rates’ volatility will rise along with long-term interest rates to reflect the stimulus of QE and
changes to regulations that drive hedging activity
Suppressed European Interest Rate Volatility
30
Chart source: Datastream as of March 31, 2015. Comments: Standard Life Investments as of March 31, 2015 Key to color coding: Market, Directional, Relative Value and Security Selection. Index information is provided for illustrative purposes only and is not intended to imply past or future performance. Please note an investor cannot invest directly in an index . Unless otherwise noted, index returns reflect the reinvestment of income and dividends, if any, but do not reflect fees, brokerage commissions or other expenses of investing. Please see Important Information at the back of this presentation
Strategy benefits as volatility rises
MASTER PAGE NO. 279

Brazilian Government Bonds
31
Chart source: Bloomberg as of March 31, 2015. Comments: Standard Life Investments as of March 31, 2015 Key to color coding: Market, Directional, Relative Value and Security Selection. Index information is provided for illustrative purposes only and is not intended to imply past or future performance. Please note an investor cannot invest directly in an index . Unless otherwise noted, index returns reflect the reinvestment of income and dividends, if any, but do not reflect fees, brokerage commissions or other expenses of investing. Please see Important Information at the back of this presentation
• The Brazilian central bank has raised interest rates sharply to combat inflation, defend the Real and due to the political backdrop; the result is that Brazil has one of the highest levels of real interest rates in the world. Rates at this level are unsustainable, and hence will need to be cut sometime in 2015
• The economic slowdown gives an opportunity for the central bank to begin to cut rates: retail sales, credit growth and industrial production are all weak
7
8
9
10
11
12
13
14
Jan 10Jul 10Jan 11Jul 11Jan 12Jul 12Jan 13Jul 13Jan 14Jul 14Jan 15
Yiel
d (%
)
Date
Bank of America Merrill Lynch Brazilian Government bond index yield
Implementation date
Strategy benefits when the yield tightens
MASTER PAGE NO. 280

US Relative Interest Rates (Butterfly)
32
Chart source: Bloomberg as of March 31, 2015. Comments: Standard Life Investments as of March 31, 2015 Key to color coding: Market, Directional, Relative Value and Security Selection. Index information is provided for illustrative purposes only and is not intended to imply past or future performance. Please note an investor cannot invest directly in an index . Unless otherwise noted, index returns reflect the reinvestment of income and dividends, if any, but do not reflect fees, brokerage commissions or other expenses of investing. Please see Important Information at the back of this presentation
0.4
0.6
0.8
1.0
1.2
1.4
1.6
1.8
2.0
2.2
May 12 Nov 12 May 13 Nov 13 May 14 Nov 14
Spre
ad (%
)
US swaps: 5y5y less 1y1y less 15y15y Implementation Date
Strategy benefits when the spread tightens
• This is a non-penal expression of a bearish US rates view that should also benefit from a disappointing economic recovery
• A sharp rise in 1 year rates relative to 5 year rates and 15 year rates as experienced in 2004 should produce strong positive returns
• Alternatively should US economic recovery disappoint and interest rate hikes are postponed, this strategy should still produce positive returns
MASTER PAGE NO. 281

• Technology valuations are currently attractive relative to the broad market at the aggregate index level, while capital expenditure by cash-rich corporates and consumer spending priorities towards technology related products looks set to continue
• We believe the market will continue to favor good quality large companies with reliable growth prospects, rather than those reliant on fast GDP growth in an environment of deleveraging headwinds. We consider the Nasdaq 100 will also continue to benefit from exposure to relatively strong overseas markets
• Strong growth prospects appear priced into earnings forecasts for the Russell 2000 versus modest assumptions for the Nasdaq 100; should US growth disappoint then the Russell 2000 will likely come under significant pressure
US Equity Large Cap Technology vs Small Caps
33
Chart source: Bloomberg as of March 31, 2015. Comments: Standard Life Investments as of March 31, 2015 Key to color coding: Market, Directional, Relative Value and Security Selection. Index information is provided for illustrative purposes only and is not intended to imply past or future performance. Please note an investor cannot invest directly in an index . Unless otherwise noted, index returns reflect the reinvestment of income and dividends, if any, but do not reflect fees, brokerage commissions or other expenses of investing. Please see Important Information at the back of this presentation
105
110
115
120
125
130
135
140
145
Rel
ativ
e Pe
rform
ance
Date
Nasdaq 100 index performance relative to Russell 2000 index(Rebased at 100 as of 1 January 2003)Implementation date
Strategy benefits w
hen the Nasdaq index outperform
s the Russell
2000 Index
MASTER PAGE NO. 282

• Japan is in the midst of a tectonic shift in its monetary policy regime, as it attempts to pull the economy out of deflation. Aggressive monetary easing is often a key driver of stock market returns
• One of the key mechanisms via which Japan is looking to exit deflation and get its economy kick-started, is to weaken its currency. This makes Japan more competitive versus South Korea, a key competitor. 30% of the Nikkei market cap is in cash, making capex, M&A and share buybacks/dividends more likely
• Abe, the Japanese Prime Minister, won a strong mandate at the upper house elections, and this will likely prove a spur for structural reforms. South Korea's economy is struggling for growth at this time, with a large proportion of households finding difficulty in coping with their high debt burdens
Japan vs Korean Equity
34
Chart source: Bloomberg as of March 31, 2015. Comments: Standard Life Investments as of March 31, 2015 Key to color coding: Market, Directional, Relative Value and Security Selection. Index information is provided for illustrative purposes only and is not intended to imply past or future performance. Please note an investor cannot invest directly in an index . Unless otherwise noted, index returns reflect the reinvestment of income and dividends, if any, but do not reflect fees, brokerage commissions or other expenses of investing. Please see Important Information at the back of this presentation
3035404550556065707580859095
100105
Jan 05Jul 05Jan 06Jul 06Jan 07Jul 07Jan 08Jul 08Jan 09Jul 09Jan 10Jul 10Jan 11Jul 11Jan 12Jul 12Jan 13Jul 13Jan 14Jul 14Jan 15
Rel
ativ
e Pe
rform
ance
Date
Nikkei 225 Index performance relative to the KOSPI Index(04/01/2011=100)Implementation Date
Strategy benefits w
hen the Nikkei 225 Index outperform
s the K
OS
PI Index
MASTER PAGE NO. 283

German vs French Equities
35
Chart source: Bloomberg as of March 31, 2015. Comments: Standard Life Investments as of March 31, 2015 Key to color coding: Market, Directional, Relative Value and Security Selection. Index information is provided for illustrative purposes only and is not intended to imply past or future performance. Please note an investor cannot invest directly in an index . Unless otherwise noted, index returns reflect the reinvestment of income and dividends, if any, but do not reflect fees, brokerage commissions or other expenses of investing. Please see Important Information at the back of this presentation
• Following a series of reforms beginning a decade ago, the German economy has become one of the most successful and dynamic European economies. France, on the other hand, requires radical reforms to adjust its fiscal mix and alleviate its rigid labor market. It is unlikely that the French government will launch a radical reform program that will free-up the rigid labor market
• Furthermore, corporate profitability in France is low due to uncompetitive labor costs while German industries are globally competitive and highly profitable, helped by a larger exposure to faster-growing international markets. Despite the deteriorating fiscal situation in France, the consensus currently underestimates the extent of faster German growth relative to France
• We believe that lacklustre growth in Europe will weigh on French corporates, demonstrated via earnings expectations, while relative earnings momentum in Germany should remain positive. If the European crisis deepens, we expect France to diverge further from the "core" and Germany to re-rate relative to other markets based on its superior medium-term economic prospects
94
96
98
100
102
104
106
Dec 12 Feb 13 Apr 13 Jun 13 Aug 13 Oct 13 Dec 13 Feb 14 Apr 14 Jun 14 Aug 14 Oct 14 Dec 14 Feb 15
Inde
x Le
vel
Date
Implementation date Dax index performance relative to CAC 40 index (rebased at 100 as of 31 December 2012)
Strategy benefits w
hen the DA
X outperform
s the CA
C
MASTER PAGE NO. 284

European vs US & Japanese Interest Rates
36
Chart source: Standard Life Investments as of March 31, 2015. Comments: Standard Life Investments as of March 31, 2015 Key to color coding: Market, Directional, Relative Value and Security Selection. Index information is provided for illustrative purposes only and is not intended to imply past or future performance. Please note an investor cannot invest directly in an index . Unless otherwise noted, index returns reflect the reinvestment of income and dividends, if any, but do not reflect fees, brokerage commissions or other expenses of investing. Please see Important Information at the back of this presentation
• Japan is vulnerable to a significant correction in yields, driven by change in investor behavior: the state pension fund is likely to rotate to riskier assets and corporations are increasing capex and running down their cash reserves
• Europe is experiencing symptoms similar to Japan in its lost decade, thus European yields should remain anchored over time, and deflationary concerns for ECB have prompted the central bank into unconventional monetary policy. Regulatory changes in Japan could also see increased investment in the European bond market
• Incorporating a short US Treasuries position insulates against a possible US led sell-off -1.0
-0.8
-0.6
-0.4
-0.2
0.0
0.2
0.4
0.6
0.8
1.0
1.2
Spre
ad (%
)
Date
EUR swap 1y10y minus USD swap 1y10y minus JPY swap 1y10y
Implementation date
Strategy benefits as spreads narrow
MASTER PAGE NO. 285

0
5
10
15
20
25
Sep 07
Mar 08
Sep 08
Mar 09
Sep 09
Mar 10
Sep 10
Mar 11
Sep 11
Mar 12
Sep 12
Mar 13
Sep 13
Mar 14
Sep 14
Mar 15
Spre
ad (b
ps)
Date
Spread of HSCEI volatility over FTSE volatility
Implementation date
China Equity vs UK Equity Volatility
37
Chart source: Bloomberg as of March 31, 2015. Comments: Standard Life Investments as of March 31, 2015 Key to color coding: Market, Directional, Relative Value and Security Selection. Index information is provided for illustrative purposes only and is not intended to imply past or future performance. Please note an investor cannot invest directly in an index . Unless otherwise noted, index returns reflect the reinvestment of income and dividends, if any, but do not reflect fees, brokerage commissions or other expenses of investing. Please see Important Information at the back of this presentation
• We expect Chinese equity volatility to be much higher than that of UK equity for a number of reasons:
Chinese banks form c.50% of the HSCEI index and are vulnerable to bad debts and credit constraint in the Chinese economy
We have been able to receive HSCEI variance at a low level funded by paying away FTSE100 Variance
Strategy benefits w
hen the spread increases
MASTER PAGE NO. 286

• An improvement in European economic conditions should entail lower loan provisions and an increase in lending, which in turn should improve profitability measure such as Return on Equity and support valuations
• Movement towards a banking union within Europe can support the sector over the medium term which should boost sentiments around earnings and valuations; the banks index is still trading cheaply on a Price-to-Book metric compared to its history
• Lower peripheral spreads and core government bond yields have reduced the cost of equity for banks
European Banks vs European Equity
38
Chart source: Bloomberg as of March 31, 2015. Comments: Standard Life Investments as of March 31, 2015 Key to color coding: Market, Directional, Relative Value and Security Selection. Index information is provided for illustrative purposes only and is not intended to imply past or future performance. Please note an investor cannot invest directly in an index . Unless otherwise noted, index returns reflect the reinvestment of income and dividends, if any, but do not reflect fees, brokerage commissions or other expenses of investing. Please see Important Information at the back of this presentation
40
50
60
70
80
90
100
Jan 10Jul 10Jan 11Jul 11Jan 12Jul 12Jan 13Jul 13Jan 14Jul 14Jan 15
Rel
ativ
e Pe
rform
ance
Date
EuroStoxx Banks index performance relative to EuroStoxx index
Implementation date
Strategy benefits w
hen the European B
anks outperform the
Euro S
toxx index
MASTER PAGE NO. 287

Historical Scenario Analysis
39
-28 -26 -24 -22 -20 -18 -16 -14 -12 -10 -8 -6 -4 -2 0 2 4 6 8 10 12 14 16 18
Black Monday 1987
Gulf War 1990
Rate Rise 1994
Mexican Crisis 1995
Asian Crisis 1997
Russian/LTCM
Tech Wreck (April 07 - 14, 2000)
Sept 11th
Equity Sell-Off (August 23 - October 09, 2002)
Equity Rally (October 10 - November 27, 2002)
Gulf War 2 (March 01 - 23, 2003)
Bond Rally (May 01 - June 13, 2003)
Bond Sell-Off (June 14 - July 31, 2003)
Emerging Market Sell-Off 2006 (May 01 - June 08, 2006)
Subprime Debacle 2007 (July 15 - August 15, 2007)
Bank Meltdown 2008 (September 12 - October 15, 2008)
Euro Crisis (July 22 - August 23, 2011)
QE jitters (May 22 - June 24, 2013)
% Move MSCI World (USD) move over same period Fund simulated performance (current positions)
Source: RiskMetrics as of March 31, 2015 Standard Life Investments US Representative GARS portfolio as of March 31, 2015 Please see Important Information at the back of this presentation
MASTER PAGE NO. 288

Forward-looking Scenario Approach
• Defining features of scenarios need not be directly financial market related* Economic Environmental Geopolitical Societal Technological
• Our subject matter experts translate scenarios into financial market impacts
• Quantitative techniques are then used to
Add uncertainty to point return figures Explore potential portfolio behavior
40
A pragmatic approach based on strategy returns * Global Risks 2013, World Economic Forum (2013) Please see Important Information at the back of this presentation
MASTER PAGE NO. 289

Future Scenario Analysis The Worst Outcome May Not be Repeat of the Past
41
Modelling techniques can help identify potential concentrations of investment risk
Some scenarios currently of interest: • Acropolis now • Cold war 2 • US Consumer disappointment • Inflation shocker • China crisis • Liquidity drought
Shaded regions represent the origin of one or more scenarios Source: Standard Life Investments as of March 2015. Please see Important Information at the back of this presentation
MASTER PAGE NO. 290

Regular Liquidity Monitoring
42
Considerable cash buffer beyond 99% VaR stress Standard Life Investments US Representative GARS portfolio as of March 31, 2015 Please see Important Information at the back of this presentation
Fund 2250
Valuation date 31/03/2015 OTC Derivatives
Total fund value 2,778,190,021 23,831,438 collateral posted (c)
Available cash 854,441,433 (a) 123,419,031 collateral held
Eligible securities 335,985,407 (b) 99,587,593 mark to market
Exchange traded
(margin)
OTC
(collateral)
Total derivatives
covered by cash cash + securities
Standalone Risk 2.48% 3.88%
VaR (99%, 1m) 46,216,079 (d) 72,335,987 (e) 118,552,066 (d)+(e)
Available cover 854,441,433 (f) 1,120,379,323 (g) 1,166,595,403 (h)
Cover for 1m VaR 18.5 15.5 9.8
RAG Status GREEN GREEN GREEN
Legend
(f) = (a)
(g) = (a)-(d)+(b)-(c)
(h) = (a)+(b)-(c)
RED < 1 * 1 month VaR
AMBER < 2 * 1 month VaR
GREEN > 2 * 1 month VaR
The primary s tatus i s that on the total derivative cover, however an amber s tatus on ei ther ET or OTC cover requires review by Fund
Management. The RAG status l imits are:
Avai labi l i ty of cash is managed by the Money Market Team. The VaR figures inform this process , as documented in the Cash Management
MASTER PAGE NO. 291

Ex-post Risk Analysis
43
Advanced portfolio technologies (APT) The chart above is for illustrative purposes only of a sample Standard Life Investments GARS portfolio Chart source: Thomson Datastream as of March 31, 2015 Comments: Standard Life Investments as of March 31, 2015 Please see Important Information at the back of this presentation
• Expect volatility range of 4 – 8% • We track realized volatility
relative to expectation and to risk model estimates
• Many different bases can be used:
Monthly, weekly, daily data Various window sizes and
weightings
• Measuring relative to equities is a useful way to normalize
• We expect to be 1/3 to 1/2 of equity volatility
MASTER PAGE NO. 292

US GARS Composite Report
44
Composite Name US GARS Creation Date 01-07-2006 Firm Standard Life Investments Currency USD Report End Date 31-12-2014 Composite Group Converted GARS Benchmark 1 Month USD LIBID
Anlzd Return (Composite)
Anlzd Return (Benchmark)
3 Year Anzld StdDev (Composite)
3 Year Anzld StdDev (Benchmark) Dispersion Market Value Total Firm
Assets % of Firm
Assets Number of Portfolios
Dec 2005 NA NA NA NA NA NA NA NA NA
Dec 2006 7.92 2.63 NA NA NA 61,396,573 250,034,719,675 0.02 1
Dec 2007 8.36 5.28 NA NA NA 480,921,603 273,159,275,038 0.18 1
Dec 2008 -6.35 2.58 NA NA NA 1,193,805,120 169,620,437,123 0.70 1
Dec 2009 19.25 0.20 7.19 0.60 NA 3,555,802,495 205,104,682,260 1.73 2
Dec 2010 10.75 0.13 7.31 0.35 1.33 10,897,493,192 206,244,327,020 5.28 2
Dec 2011 2.89 0.10 5.69 0.02 0.14 16,448,902,409 191,669,627,227 8.58 3
Dec 2012 7.86 0.11 4.62 0.01 0.73 28,976,474,718 217,691,673,950 13.31 3
Dec 2013 7.29 0.06 4.52 0.01 0.31 42,830,233,476 248,389,468,750 17.24 3
Dec 2014 5.96 0.03 3.44 0.01 1.04 49,082,656,541 345,453,084,900 14.21 3 Firm Disclosures A complete list and description of all of the firm's composites are available from Standard Life Investments. There are no minimum asset levels set below which portfolios are not included in a composite. All performance calculations and returns have been calculated gross of management fees. All returns are presented on an all-inclusive basis and as such all capital gains interest income and withholding taxes have been taken into account in market valuations and returns. All indices are on a gross of tax basis apart from FTSE UK indices which are net of Withholding Tax There are no Non-Fee-Paying portfolios included in any composite. The Daily True Time Weighted Rate of Return methodology has been used from 2001 apart from unitised Cash Property GARS and Myfolio products where NAV performance is used. Prior to this NAV performance was used for all products. Additional information regarding policies for calculating and reporting returns is available upon request Dispersion is calculated using high/low difference. Where there are less than 36 months of returns, the Composite and Benchmark Standard Deviations have not been calculated. Standard Life Investments 'The Firm' consists of all fee-paying funds managed by Standard Life Investments and its Subsidiaries which include Standard Life Investments (Mutual Funds) Limited SLTM Limited Standard Life Investments (Corporate Funds) Limited Standard Life Investments (USA) Limited and Standard Life Investments (Asia) Limited Past performance results from Standard Life Investments Limited UK Firm and Standard Life Investments Limited Irish Firm have been linked to form the performance record of the new firm Standard Life Investments. The new firm was created on 01/01/2008. Standard Life Investments claims compliance with the Global Investment Performance Standards (GIPS®) and has prepared and presented this report in compliance with the GIPS standards. Standard Life Investments has been independently verified by PricewaterhouseCoopers LLP for the periods 1996 to 2014. The verification report is available upon request. Verification assesses whether (1) the firm has complied with all the composite construction requirements of the GIPS standards on a firm-wide basis and (2) the firm's policies and procedures are designed to calculate and present performance in compliance with the GIPS standards. Verification does not ensure the accuracy of any specific composite presentation Composite Disclosures Derivatives may be used to vary exposure to markets and express views on the direction of currencies, interest rates, sectors and securities to enhance capital return, limit downside volatility and preserve capital Includes part period return for 2006 from 01/07 The composite includes funds that invest in a highly diversified strategy including equities, bonds and cash with a derivative overlay in options, futures, swaps and currency forwards to deliver a positive absolute return. The fund is benchmarked against 1 month US Libid The standard annual fee applicable to this composite is 1.00%, but individual fees are negotiated on an account basis This composite includes GBP denominated funds that are converted into USD using 3 month USD Libor and 3 month GBP Libor rates
MASTER PAGE NO. 293

Important Information
45
All sources within this presentation are Standard Life Investments as of March 31, 2015 unless otherwise stated. Products and services described herein are provided by Standard Life Investments, its subsidiaries, affiliates or related companies. The enclosed material is confidential and not to be reproduced or redistributed in whole or in part without the prior written consent of Standard Life Investments. This material is for informational purposes only to provide general information and is not meant to be legal or tax advice for any particular investor, which can only be provided by qualified tax and legal counsel. Any offer of securities may be made only by means of a formal confidential private offering memorandum. This document may not be used for the purpose of an offer or solicitation in any jurisdiction or in any circumstance in which such an offer or solicitation is unlawful or not authorized. Please read the confidential private placement memorandum carefully prior to investing. Parties should independently investigate any investment strategy or manager, and should consult with qualified investment, legal, and tax professionals before making any investments. All opinions and estimates in this presentation are those of Standard Life Investments, and constitute Standard Life Investments’ best judgment as of the date indicated. The information in this material is only as current as the date indicated, and may be superseded by subsequent market events or for other reasons. Statements concerning market trends are based on current market conditions, which may fluctuate. References to future returns are not promises or even estimates of actual returns that Standard Life Investments may achieve, and should not be relied upon. The forecasts contained herein are for illustrative purposes only and are not to be relied upon as advice or interpreted as a recommendation. In addition, the forecasts are based upon subjective estimates and assumptions about circumstance and events that may not yet have taken place or may never do so. Performance is shown gross of fees and expenses, and includes the reinvestment of dividends and capital gain distributions where applicable. The performance of the strategy will be reduced by advisory and other fees charged to the strategy. Many factors affect performance including changes in market conditions and interest rates and in response to other economic, political, or financial developments. Investment return and principal value of your investment will fluctuate, so that when your investment is sold, the amount you receive could be less than what you originally invested. Past performance is not a guide to or indicative of future results. Future returns are not guaranteed and a loss of principal may occur. A schedule of fees is described in Part II of Form ADV, which is available upon request. To illustrate an account subject to an investment advisory fee of 1% per annum growing at an annual rate of 8.2% for a five year period would only produce a 7.1% annual return. The returns and fees experienced by a particular client will be different than the example shown. Investments are not insured by the FDIC (or any other state or federal agency), are not guaranteed by any bank, and may lose value. Fees are also described in the Standard Life Investments (Corporate Fund) Ltd Form ADV Part II and may vary depending on, among other things, the applicable fee schedule and account size. Standard Life Investments is engaged in a joint venture with HDFC Asset Management owning 40%. Standard Life Investments is engaged in a strategic partnership with Sumitomo Mitsui Trust Bank. SL Capital Partners (US) Ltd is a subsidiary of Standard Life Investments. Standard Life Investments owns 60% No investment process is free of risk and there is no guarantee that the investment process described herein will be profitable. The strategy allocation percentages set forth herein are estimates and actual percentages may vary from time to time. The types of investments presented herein will not always have the same comparable risks and returns. Please see the private placement memorandum for a description of the investment, as well as the risks associated with that investment. Please note that the strategy may elect to invest assets in different investment sectors from those depicted herein, which may entail additional and/or different risks. The actual performance of the portfolio will depend on the Investment Manager’s ability to identify and access appropriate investments, and balance assets to maximize return while minimizing risk. The actual investments in the portfolio may or may not be the same or in the same proportion as those shown herein. Portfolios within the composite are benchmarked to an appropriate market index. The benchmark does not reflect any fees, brokerage commissions or other expenses and does not reflect the reinvestment of dividends. The GARS representative account is the GARS Cayman Master portfolio. This account is available to US investors. Performance may differ based on factors which include exchange rate fluctuations, cash flows, fees, product structure differences, etc. The GARS sample account is the GARS £, Institutional Pooled Pension Portfolio. This account is not available to US investors.
MASTER PAGE NO. 294

Important Information The following benchmarks are broad based indices are used for comparative/illustrative purposes only and have been selected as they are well known and are easily recognizable by investors. Comparisons to benchmarks have limitations because benchmarks have volatility and other material characteristics that may differ from the portfolio. For example, investments made for the portfolio may differ significantly in terms of security holdings, industry weightings and asset allocation from those of the benchmark. Accordingly, investment results and volatility of the portfolio may differ from those of the benchmark. Also, the indices noted in this presentation are unmanaged, are not available for direct investment, and are not subject to management fees, transaction costs or other types of expenses that the portfolio may incur. In addition, the performance of the indices reflects reinvestment of dividends and, where applicable, capital gain distributions. Therefore, investors should carefully consider these limitations and differences when evaluating the comparative benchmark data performance. 1 Month USD LIBID Bloomberg Code: LIBMBO1M London Interbank Bid Rate – LIBID is the average interest rate at which participating London banks are willing to borrow eurocurrency deposits from other banks. It is calculated by the British Bankers Association on the daily basis as the average of the interest rates at which London banks bid for borrowed eurocurrency portfolios from other banks. MSCI World Index MSCI World Index is a free float-adjusted market capitalization weighted index of over 1600 world stocks that is designed to measure the equity market performance of developed markets. The MSCI World Index consists of the following 23 developed market country indices: Australia, Austria, Belgium, Canada, Denmark, Finland, France, Germany, Hong Kong, Ireland, Israel, Italy, Japan, Netherlands, New Zealand, Norway, Portugal, Singapore, Spain, Sweden, Switzerland, the United Kingdom, and the United States. The US GARS composite is comprised of portfolios whose objective is to achieve a target of cash + 5% by investing in securities that perform over a 2-5 year time horizon. While the strategy’s objective is to seek to provide consistent returns with 4-8% tracking error, it does not imply that this strategy shall share, or attempt to share, the same or similar characteristics of the benchmark or attempt to track the benchmark. Sub-advised and portfolios constrained by guidelines and restrictions are excluded from the composite. Standard Life Investments maintains a complete list and description of composites, which is available upon request. An investment in the portfolio is speculative and involves certain risks. Prospective investors should ensure that they: (1) understand the nature of the investment and the extent of their exposure to risk; (2) have sufficient knowledge, experience and access to professional advisors to make their own legal, tax, accounting, and financial evaluation of the merits and risks of participating in an investment in the portfolio; and (3) consider the suitability of investing in the portfolio in light of their own circumstances and financial condition. The portfolio investment program is not suitable as the sole investment vehicle for an investor and should be part of an overall investment strategy. Investors should only invest if total off of the investment may be sustained. Due to among other things, the volatile nature of the markets and the investment strategies discussed herein, they may only be suitable for certain investors. No investment strategy or risk management technique can guarantee return or eliminate risk in any market environment. Further, this information may be amended or revoked at any time without notice. The strategy may use alternative investment techniques (such as leverage, short selling, and the use of derivatives) which carry additional risks. The low initial margin deposits normally required to establish a position in such instruments may permit a high degree of leverage. As a result, a relatively small movement in the price of a contract may result in a profit or loss that is high proportion to the amount of portfolios actually places as initial margin and may result in a disproportionate loss exceeding any margin deposited. Transactions on over-the-counter derivatives may involve additional risk as there is no exchange on which to close out a position, only the original counterparty. Such transactions may therefore be difficult to liquidate, to value, or to assess the exposure. The strategy may at times use certain types of investment derivatives, such as options, futures, forwards and swaps. These instruments involve risks different from, and in certain cases, greater than, the risks presented by more traditional investments. To the extent the portfolio invests in foreign securities, its performance will be influenced by political, social and economic factors affecting investments in foreign companies. Special risks associated with investments in foreign companies include exposure to currency fluctuations and controls, less liquidity, less developed or less efficient trading markets, less governmental supervisor and regulation, lack of comprehensive company information, political instability, greater market volatility, and differing auditing and legal standards.
46
MASTER PAGE NO. 295

Important Information Equity securities are generally subject to varying degrees of market factors, including but not limited to, market sector, market liquidity, issuer and investment style risk The foregoing list of certain factors does not claim to be a complete list or explanation of the risks involved in an investment in the portfolio. Investors should read the strategy’s documents and consult with his/her own advisors before deciding to invest. In addition, as the investment markets and portfolio develop and change over time, an investment may be subject to additional and different risk factors. No assurance can be made that profits will be achieved or that substantial losses will not be incurred. Risks are also described in the Standard Life Investments (Corporate Fund) ADV Form Part II and may vary depending on the type of investment. Any data contained herein which is attributed to a third party ("Third Party Data") is the property of (a) third party supplier(s) (the “Owner”) and is licensed for use by Standard Life**. Third Party Data may not be copied or distributed. Third Party Data is provided “as is” and is not warranted to be accurate, complete or timely. To the extent permitted by applicable law, none of the Owner, Standard Life** or any other third party (including any third party involved in providing and/or compiling Third Party Data) shall have any liability for Third Party Data or for any use made of Third Party Data. Past performance is no guarantee of future results. Neither the Owner nor any other third party sponsors, endorses or promotes the portfolio or product to which Third Party Data relates. **Standard Life means the relevant member of the Standard Life group, being Standard Life plc together with its subsidiaries, subsidiary undertakings and associated companies (whether direct or indirect) from time to time. Standard Life Investments One Beacon Street, 34th Floor Boston, MA 02108-3106 Telephone: (617) 720-7900 Standard Life Investments (USA) Limited and Standard Life Investments (Corporate Funds) Limited are both registered as an Investment Adviser with the US Securities and Exchange Commission. Standard Life Investments Limited is registered in Scotland (SC123321) at 1 George Street, Edinburgh EH2 2LL. Standard Life Investments Limited and Standard Life Investments (Corporate Funds) Limited are authorized and regulated in the UK by the Financial Conduct Authority. Calls may be monitored and/or recorded to protect both you and us and help with our training. © 2015 Standard Life, images reproduced under license.
47
MASTER PAGE NO. 296

Dan LeBeau, ConsultantAllan Martin, PartnerTony Ferrara, CAIA, Senior Analyst
May 18, 2015
Investment Performance Analysisfor the period ending March 31, 2015
Ventura County Employees’ Retirement Association
MASTER PAGE NO. 297

Page
Market Environment Update and Outlook 2
Total Fund Performance 17
Manager Due Diligence 49
Appendix: Market Environment; Performance Disclosures 54
ContentsVentura County Employees’ Retirement Association
March 31, 2015
1
MASTER PAGE NO. 298

Market Environment Update and Outlook
2
MASTER PAGE NO. 299

• First quarter “advance” estimate of GDP growth increased at a weak +0.2% after increasing by +2.2% in the fourth quarter of 2014.
– Retail sales ended the first quarter at +0.5% on a year-over-year growth rate basis.– The inventory-to-sales ratio increased slightly to 1.4 in February and has remained relatively flat since early 2010. – Corporate profits as a percent of GDP declined in the fourth quarter, but remain elevated relative to historical levels.– The U.S. trade deficit decreased slightly in February.
• The unemployment rate fell to 5.5% in Q1, down from 5.8% at the end of December 2014; U-6, a broader measure of unemployment, fell to 10.9% during the first quarter.
• The Case-Shiller Home Price Index (as of 2/28) increased slightly to 166.8 from fourth quarter levels and is currently higher than that of pre-financial crisis levels of 150.92.
• Rolling 12-month seasonally adjusted CPI decreased to -0.1% from +0.8% at the end of December; Capacity Utilization declined slightly to 77.1% in March.
• Fed Funds rate remains at 0.25%, while the 10-year Treasury Yield finished Q1 at 1.94%.
• The Fed balance sheet declined slightly in Q1 2015, while the European Central Bank balance sheet increased.
– ECB began asset purchases of €60 billion per month.
• S&P valuations increased in March, remaining above the 10-year and long-term averages– Cyclically adjusted Shiller PE ratio is above the long-term average of 16.4x and above the 10-year average of 22.9x.
• The U.S. Dollar continues to strengthen against a basket of major currencies as the Fed ends its quantitative easing program and the ECB ramps up its easing program.
Economic Environment
March 31, 2015
Ventura County Employees’ Retirement Association
3
MASTER PAGE NO. 300

Market Environment – Q1 2015 Overview
* As of 12/31/2014
March 31, 2015
Qtr. 1 Yr. 3 Yr. 5 Yr. 10 Yr.
World Equity Benchmarks
MSCI World World 2.3% 6.0% 12.2% 10.0% 6.4%
Qtr. 1 Yr. 3 Yr. 5 Yr. 10 Yr.
Domestic Equity Benchmarks
S&P 500 Large Core 1.0% 12.7% 16.1% 14.5% 8.0%Russell 1000 Large Core 1.6% 12.7% 16.5% 14.7% 8.3%
Russell 1000 Growth Large Growth 3.8% 16.1% 16.3% 15.6% 9.4%
Russell 1000 Value Large Value -0.7% 9.3% 16.4% 13.8% 7.2%
Russell 2000 Small Core 4.3% 8.2% 16.3% 14.6% 8.8%
Russell 2000 Growth Small Growth 6.6% 12.1% 17.7% 16.6% 10.0%
Russell 2000 Value Small Value 2.0% 4.4% 14.8% 12.5% 7.5%
Qtr. 1 Yr. 3 Yr. 5 Yr. 10 Yr.
International Equity Benchmarks
MSCI EAFE International Developed 4.9% -0.9% 9.0% 6.2% 5.0%
S&P EPAC SmallCap Small Cap Int'l 5.6% -1.5% 11.4% 9.2% 7.1%
MSCI EM Emerging Equity 2.2% 0.4% 0.3% 1.8% 8.5%
MSCI ACWI ex-US World ex-US 3.5% -1.0% 6.4% 4.8% 5.5%Qtr. 1 Yr. 3 Yr. 5 Yr. 10 Yr.
Domestic Fixed Income Benchmarks
Barclays Aggregate Core Bonds 1.6% 5.7% 3.1% 4.4% 4.9%
Barclays US High Yield High Yield 2.5% 2.0% 7.5% 8.6% 8.2%
BofA ML US HY BB/B High Yield 2.7% 3.2% 7.4% 8.4% 7.5%
CSFB Levered Loans Bank Loans 1.3% 5.0% 5.3% 12.2% 5.0%
BofA ML US 3-Month T-Bill Cash 0.0% 0.0% 0.1% 0.1% 1.5%
Barclays US TIPS 1-10 Yr Inflation 1.2% 1.1% -0.1% 2.9% 4.0%
Qtr. 1 Yr. 3 Yr. 5 Yr. 10 Yr.
Global Fixed Income Benchmarks
Citigroup WGBI World Gov. Bonds -2.5% -5.5% -1.6% 3.4% 4.1%
BC Global Credit Global Bonds -1.2% -0.9% 2.8% 4.4% 4.4%JPM GBI-EM Glob. Diversified Em. Mkt. Bonds (Local) -4.0% -11.1% -3.9% 0.7% 6.3%
JPM EMBI+ Em. Mkt. Bonds 1.9% 4.5% 4.0% 6.6% 8.0%
Qtr. 1 Yr. 3 Yr. 5 Yr. 10 Yr.
Alternative Benchmarks
DJ UBS Commodity Index Commodity -6.0% -27.1% -11.6% -5.8% -4.9%
DJCS HF Composite Hedge Fund 0.6% 6.1% 2.4% 4.9% 3.1%
HFRI FoF Conservative Fund of Funds 1.3% 6.2% 2.8% 4.6% 2.6%
Cambridge PE Lagged* Private Equity 0.7% 11.5% 15.3% 15.4% 13.6%
NCREIF Property Index* Real Estate 3.0% 11.8% 11.1% 12.1% 8.4%
Wilshire REIT Index REIT 4.0% 22.7% 14.0% 15.4% 6.7%
CPI + 2% Inflation/Real Assets 0.3% 2.0% 3.0% 3.7% 4.1%
Ventura County Employees’ Retirement Association
4
MASTER PAGE NO. 301

• With Fed asset purchases coming to an end, divergence in monetary policies signals different investment environments globally
• ECB monetary easing begins with €60 billion in monthly asset purchases
– ECB commits €1.3 trillion in asset purchases in the Eurozone
– Global risk assets respond positively– Negative short dated interest rates in
Eurozone
• Developed world inflation is low – In U.S., CPI for all Urban Consumers on a
seasonally adjusted basis was negative in Q1, driven by Energy in January
• Geopolitical instability continues to drive volatility
– Instability in the Mid-East, Eastern Europe, Greece
• Fed rate hike uncertainty contributed to volatility in domestic markets
– Timing of Fed rate hike is “dependent on market conditions”
• Europe continues to see ongoing political and economic growth challenges
– Negative currency impact for U.S. investors as USD appreciates
• GDP decelerated, posting a +0.2% estimated growth rate
– Consumer spending decelerated, but still growing
• Valuations remain above 10-year and long-term averages
– Developed Equity P/Es above median
First Quarter 2015 Market Review
Positives Negatives
March 31, 2015
Ventura County Employees’ Retirement Association
5
MASTER PAGE NO. 302

Global Equity
• U.S. equities advanced in the first quarter as global monetary accommodation ramps up.
• Small cap stocks outperformed large cap stocks during the quarter, with the Russell 2000 Index returning +4.3% and the S&P 500 Index returning +1.0%.
• International equities outperformed U.S. markets during the quarter, returning +3.5%, as measured by the MSCI ACWI ex-U.S. Index.
– Developed markets returned +4.9% as measured by the MSCI EAFE Index; Japan was the top performer returning approximately +10%.
– Emerging markets returned +2.2% as measured by the MSCI Emerging Markets Index; India and Russia bolstered returns, with Russia returning +18%. Commodity driven markets, such as Brazil, lagged on the back of continued pressure on energy prices.
Private Equity
• New private equity commitments totaled $83.1 billion in Q1 2015.– $83.1 billion represents 23% of total PE raised in 2014 and suggests fundraising in 2015 could equal or exceed the $350
billion raised in 2014, the most prolific year for fundraising since 2007.
• Buyout and growth equity fund deal volume in both the U.S. and Europe continues to decelerate. – Buyout and growth equity funds raised $36.7 billion in the first quarter, with U.S. buyout and growth equity activity
experiencing a sharp reduction in Q1.
• Venture capital raised $11.8 billion during the quarter. – At 14% of total private equity raised, commitments are just below the 10-year historic relative average and are buoyed by
strong IPO and M&A environment in 2014.
• Energy funds raised $3.2 billion during the quarter, representing 16% of capital raised. – Investors are opportunistically approaching the energy market dislocation.
• Asian private equity commitments slowed to total 8% of total funds raised, down from 10% in 2014.
• European commitments comprised 14% of all new PE commitments in Q1 2015– 72% of European funds raised were based in the United Kingdom
Market Environment
March 31, 2015
Ventura County Employees’ Retirement Association
6
MASTER PAGE NO. 303

Fixed Income
• As yields fell amid declining inflation and monetary easing, global sovereign debt gained in the first quarter.
• The spread between 2 and 10-year rates fell 12 basis points to 1.38%; Treasury Inflation-Protected Securities, or TIPS, returned +1.4% during the quarter, as measured by the Barclays U.S. TIPS Index.
• The Barclays Long Duration Credit Index gained +3.1%, bolstered by declining Treasury yields.
• Agency mortgage-backed securities benefitted from a decrease in mortgage rates in January and March, posting a gain of +1.1% during the quarter.
• Investment grade credit spreads continued to widen, ending March at 129 basis points.
• High yield bonds returned +2.5% as spreads increased slightly to 433 basis points, up from 429 basis points.
– High yield markets were most significantly impacted by the decline of oil prices as Energy makes up approximately 14% of the Barclays U.S. High Yield Bond Index.
• Emerging markets debt continued to slow in local currency, posting a -4.0% return as measured by the JP Morgan GBI-EM Global Diversified Index.
– Hard-currency emerging market debt trumped local currency debt, with the JP Morgan EMBI Global Diversified Index returning +2.0%.
– After plunging at year-end, Russian debt outperformed as oil prices stabilized and geopolitical tensions cooled. – Brazilian debt underperformed amid disappointing growth, high inflation, and concerns around the mismanagement of the
state-run oil giant Petrobras.
Market Environment
March 31, 2015
Ventura County Employees’ Retirement Association
7
MASTER PAGE NO. 304

Real Assets/Inflation-Linked Assets
• Massive energy market dislocation.– Oil prices stabilized mid-quarter. – Private equity and private debt opportunities attractive.– Potential for public stressed/distressed credit, equity and commodity plays.
• OPEC and Saudi Arabia have indicated a willingness to allow lower oil prices to persist in efforts to cement market share and reduce marginal supply.
• Select infrastructure opportunities are attractive.– Target opportunistic strategies in niche sub-sectors to take advantage of market dislocations.
• NEPC continues to believe in the long-term demand drivers in agriculture.– Long-term commodity prices driven by growing emerging market demand.
• Timber opportunity set limited, but warrants further review. – 45% increase in housing starts forecasted; timber prices highly correlated
Market Environment
March 31, 2015
Ventura County Employees’ Retirement Association
8
MASTER PAGE NO. 305

Commodities
• Commodities continued their losing streak, with the Bloomberg Commodity Index posting a loss (-5.9%) for the third straight quarter.
– Volatility in commodities trumped other asset classes, including equities, bonds and the US dollar during the quarter.– Brent crude dropped -9.9% in January, then sharply recovered, gaining +14.8% in February, and slipped again in March,
losing -12.3%, posting a -9.3% loss in Q1.
Real Estate
• NEPC continues to be neutral on core real estate in the U.S. and remains positive on non-core real estate, that is, value-add and opportunistic strategies.
• Within U.S. core real estate, strong fundamentals continue to be the story along with attractive income spreads relative to interest rates.
– The concerns for U.S. core real estate (and U.S. real estate, broadly) continue to be 1) plentiful capital that is driving up pricing, and 2) the market’s expectation for higher future interest rates and their impact on capitalization rates and capital values.
• U.S. REITs posted a strong quarter with a +4.0% return. – REITs are trading at slight premiums to NAV– FFO multiples are up to approximately 18x, remaining considerably above the average of 12.5x since 2000.
• Overall, the non-core real estate investment environment in the U.S. is normalizing; however, select areas remain attractive.
• Europe is viewed as the best place for a marginal dollar of non-core real estate investment. – Europe is emerging from a multi-year recession, but recovery is slow and uneven with global markets experiencing large
capital inflows.– Banks in EU are still overleveraged and have significant real estate exposure to jettison.
Market Environment
March 31, 2015
Ventura County Employees’ Retirement Association
9
MASTER PAGE NO. 306

Building Blocks for U.S. Equities
Source: Bloomberg, NEPC
Source: Bloomberg, NEPC
March 31, 2015
Ventura County Employees’ Retirement Association
10
MASTER PAGE NO. 307

Launch of Quantitative Easing in Eurozone is a New Catalyst for International Equities
March 31, 2015
Ventura County Employees’ Retirement Association
11
MASTER PAGE NO. 308

Currencies Have Been Volatile (and mostly negative versus the US Dollar)
Source: Bloomberg
March 31, 2015
Ventura County Employees’ Retirement Association
12
MASTER PAGE NO. 309

Currency Pressure Remains; Historic Movements Exhibit Persistence
Source: Bloomberg
Source: Bloomberg
March 31, 2015
Ventura County Employees’ Retirement Association
13
MASTER PAGE NO. 310
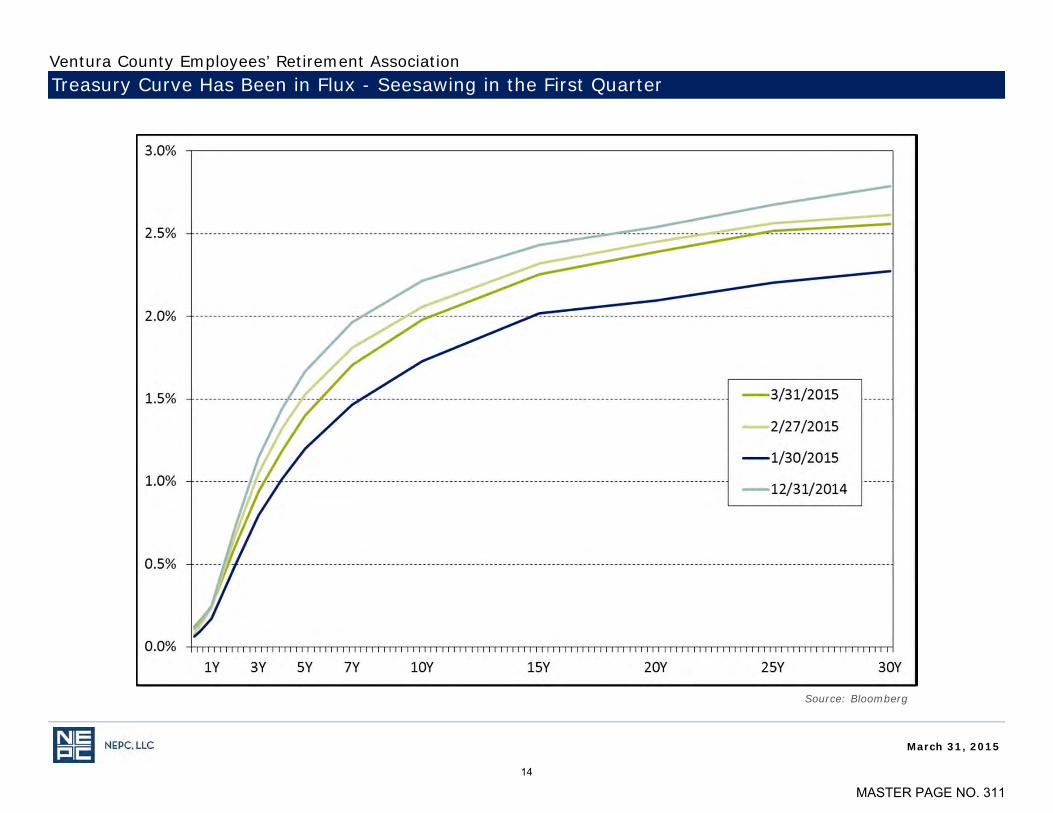
Treasury Curve Has Been in Flux - Seesawing in the First Quarter
Source: Bloomberg
March 31, 2015
Ventura County Employees’ Retirement Association
14
MASTER PAGE NO. 311
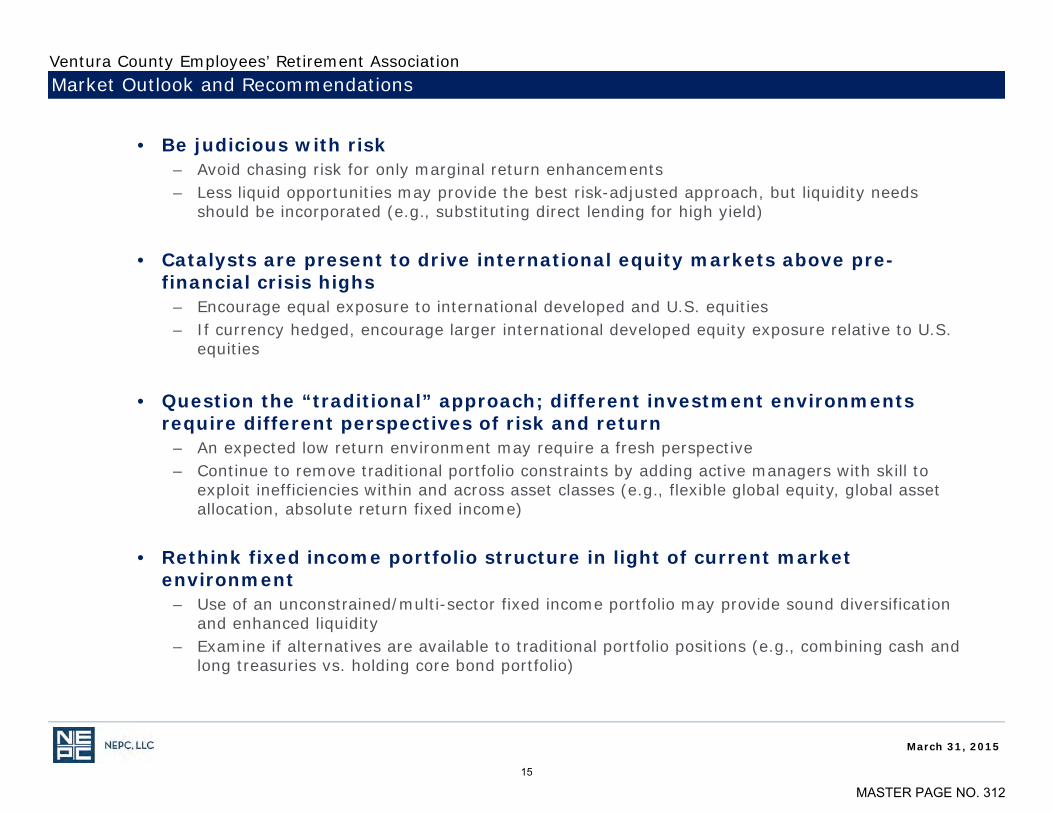
• Be judicious with risk – Avoid chasing risk for only marginal return enhancements– Less liquid opportunities may provide the best risk-adjusted approach, but liquidity needs
should be incorporated (e.g., substituting direct lending for high yield)
• Catalysts are present to drive international equity markets above pre-financial crisis highs
– Encourage equal exposure to international developed and U.S. equities– If currency hedged, encourage larger international developed equity exposure relative to U.S.
equities
• Question the “traditional” approach; different investment environments require different perspectives of risk and return
– An expected low return environment may require a fresh perspective – Continue to remove traditional portfolio constraints by adding active managers with skill to
exploit inefficiencies within and across asset classes (e.g., flexible global equity, global asset allocation, absolute return fixed income)
• Rethink fixed income portfolio structure in light of current market environment
– Use of an unconstrained/multi-sector fixed income portfolio may provide sound diversification and enhanced liquidity
– Examine if alternatives are available to traditional portfolio positions (e.g., combining cash and long treasuries vs. holding core bond portfolio)
Market Outlook and Recommendations
March 31, 2015
Ventura County Employees’ Retirement Association
15
MASTER PAGE NO. 312

Highlights of First Quarter Happenings at NEPC
First Quarter 2015
NEPC Updates
NEPC ResearchRecent White Papers Posted Six Years Later: A Time for Moderation?
NEPC's 2015 Asset Allocation (January 2015) - NEPC’s Asset Allocation Committee
A Primer on US Equity REITs and Their Role in an Institutional Investment Portfolio (April 2015) - Sean Ruhmann, Director of Real Assets Research; Tim Bruce, Director of Traditional Research; Matt Ritter, Research Analyst, Real Assets Research; Larissa Davy, Research Associate, Traditional Research - The NEPC research paper provides an overview of US REITs and examines their place in institutional portfolios.
NEPC Client Recognitions We are immensely gratified to consistently achieve your
favorable client satisfaction ratings in relation to our peers. Last year, you ranked NEPC #1 among the 10 largest firms in the investment consulting business, as measured by the Greenwich Quality Index (GQI). We remain the only firm among the 10 largest investment consultancies with rankings in the top three in 10 of the last 11 years, according to Greenwich Associates’ annual survey of over 1,000 large plan sponsors regarding their investment consulting relationships.1
Orange County Employees’ Retirement System has won the Government Finance Officers Association’s Award for Excellence in Government Finance, for its investment fee transparency and management initiatives.
Upcoming Events NEPC’s 20th Annual Client Conference – May 19-20, 2015 in
Boston at the Boston Convention & Exhibition Center (BCEC) Headline Speakers:
Liz Ann Sonders, Senior Vice President, Chair of the Investment Committee, Windhaven Investment Management, Inc.
Don Yaeger, Sports Journalist
Rick Rieder, Chief Investment Officer, Fundamental Fixed Income, BlackRock
Register at www.nepc.com
Professional Staff Updates We are also pleased to announce that Aarish Patell has joined
NEPC as a Research Consultant located in our Boston, MA office. Aarish will be focusing on private markets research.
NEPC has also added two new Research Analysts to our hedge fund research team, Christian Pieri and Victoria Margosian.
1Source: Greenwich Associates, 2014 Evaluations by U.S. Institutional Investors. Greenwich Associates is an independent research firm. Its rankings do not represent an endorsement of NEPC. Past performance is no guarantee of future results.
March 31, 2015
16
MASTER PAGE NO. 313

Total Fund PerformanceNote: All of the data shown on the following pages is as of March 31, 2015 and reflects the deduction of investment manager fees, unless otherwise noted.
17
MASTER PAGE NO. 314

March 31, 2015
Market Value 3 Mo Rank FiscalYTD Rank 1 Yr Rank 3 Yrs Rank 5 Yrs Rank 10 Yrs Rank Return Since
_
Total Fund $4,365,835,058 2.0% 73 1.8% 60 6.2% 41 10.3% 16 10.1% 9 6.8% 29 8.3% Apr-94Policy Index 2.0% 65 3.1% 20 7.1% 18 10.1% 25 9.7% 30 6.9% 25 8.2% Apr-94Allocation Index 1.8% 80 2.5% 41 6.9% 24 9.5% 39 9.2% 45 6.6% 43 -- Apr-94
InvestorForce Public DB > $1B Net Median 2.2% 2.2% 5.6% 9.3% 9.1% 6.4% 7.8% Apr-94XXXXX
5 Years Ending March 31, 2015
Anlzd Ret Rank Anlzd StdDev Rank Sharpe
Ratio Rank SortinoRatio RF Rank
_
Total Fund 10.1% 9 9.1% 84 1.1 52 1.7 48Policy Index 9.7% 30 8.9% 75 1.1 58 1.6 49InvestorForce Public DB > $1B NetMedian 9.1% -- 7.9% -- 1.1 -- 1.6 --
3 Years Ending March 31, 2015
Anlzd Ret Rank Anlzd StdDev Rank Sharpe
Ratio Rank SortinoRatio RF Rank
_
Total Fund 10.3% 16 6.5% 71 1.6 39 2.3 28Policy Index 10.1% 25 6.4% 66 1.6 40 2.2 45InvestorForce Public DB > $1B NetMedian 9.3% -- 6.1% -- 1.5 -- 2.1 --
XXXXX
Ventura County Employees’ Retirement AssociationTotal Fund Performance Summary (Net)
For the one-year period ending March 31, 2015, the Fund produced a net investment gain of $274.6 million, which includes a net investment gain of $89.2 million in the quarter. Assets increased from $4.12 billion one year ago to $4.37 billion on March 31, 2015 with $31.2 million in net distributions during the year.
For the one-year period ending March 31, 2015, the Fund returned 6.2%, trailing the policy index by 0.9% and ranking in the 41st percentile of the InvestorForce Public Funds > $1 Billion Universe (Net of Fees).
For the three-year period ending March 31, 2015, the Fund returned 10.3%, outperforming the policy index by 0.2% and ranking in the 16th percentile of its peers. The Fund's volatility, as measured by standard deviation, ranked in the 71st percentile of its peers, and the risk-adjusted return, or Sharpe Ratio, ranks in the 39th percentile. This means that the Fund has earned more return per unit of risk taken than 61% of its peers.
For the five-year period ending March 31, 2015, the Fund returned 10.1%, outperforming the policy index by 0.4% and ranking in the 9th percentile of its peers. The Fund's volatility ranks in the bottom quartile of its peers over this period, with the Fund's Sharpe Ratio being slightly below the median Fund in the universe.
*Please see the appendix for additional performance disclosures.
18
MASTER PAGE NO. 315

March 31, 2015
Ventura County Employees’ Retirement AssociationTotal Fund Asset Growth Summary
Summary of Cash FlowsSources of Portfolio Growth First Quarter Fiscal Year-To-Date One Year
_
Beginning Market Value $4,328,232,756 $4,258,489,574 $4,122,353,883
Net Additions/Withdrawals -$51,572,390 $15,360,038 -$31,158,326
Investment Earnings $89,174,692 $91,985,446 $274,639,500
Ending Market Value $4,365,835,058 $4,365,835,058 $4,365,835,058_
19
MASTER PAGE NO. 316

March 31, 2015
Asset Allocation vs. Target
Current Current Policy Difference* Policy Range Within
Range_
U.S. Equity $1,360,896,365 31.2% 30.0% 1.2% 26.0% - 34.0% YesNon-US Equity $617,229,438 14.1% 14.0% 0.1% 11.0% - 17.0% YesGlobal Equity $440,946,810 10.1% 10.0% 0.1% 7.0% - 13.0% YesU.S. Fixed Income $767,452,669 17.6% 19.0% -1.4% 15.0% - 23.0% YesGlobal Bonds $258,135,292 5.9% 5.0% 0.9% 3.0% - 7.0% YesPrivate Equity $126,461,444 2.9% 5.0% -2.1% 3.0% - 7.0% NoReal Estate $330,958,239 7.6% 7.0% 0.6% 4.0% - 10.0% YesCash $38,833,449 0.9% 0.0% 0.9% 0.0% - 3.0% YesLiquid Alternatives $424,921,353 9.7% 10.0% -0.3% 7.0% - 13.0% YesTotal $4,365,835,058 100.0% 100.0%
XXXXX
*Difference between Policy and Current Allocation
Cash represents assets in Clifton Group Overlay
Ventura County Employees’ Retirement AssociationTotal Fund Asset Allocation vs. Policy Targets
20
MASTER PAGE NO. 317

March 31, 2015
Ventura County Employees’ Retirement AssociationTotal Fund Allocation History
21
MASTER PAGE NO. 318

March 31, 2015
1 Years Ending March 31, 2015 Sharpe Ratio Rank Sortino Ratio Rank
_
Total Fund 1.2 56 3.6 7Policy Index 1.4 26 3.7 5InvestorForce Public DB > $1B Net Median 1.2 -- 2.2 --
XXXXX
Ventura County Employees’ Retirement AssociationTotal Fund Risk/Return
1 Years Ending March 31, 2015 Anlzd Ret Rank Anlzd Std Dev Rank
_
Total Fund 6.2% 41 5.3% 74Policy Index 7.1% 18 5.1% 56InvestorForce Public DB > $1B Net Median 5.6% -- 4.9% --
XXXXX
22
MASTER PAGE NO. 319

March 31, 2015
Ventura County Employees’ Retirement AssociationTotal Fund Risk/Return
3 Years Ending March 31, 2015 Sharpe Ratio Rank Sortino Ratio Rank
_
Total Fund 1.6 39 2.4 28Policy Index 1.6 40 2.2 45InvestorForce Public DB > $1B Net Median 1.5 -- 2.1 --
XXXXX
3 Years Ending March 31, 2015 Anlzd Ret Rank Anlzd Std Dev Rank
_
Total Fund 10.3% 16 6.5% 71Policy Index 10.1% 25 6.4% 66InvestorForce Public DB > $1B Net Median 9.3% -- 6.1% --
XXXXX
23
MASTER PAGE NO. 320

March 31, 2015
Ventura County Employees’ Retirement AssociationTotal Fund Risk/Return
5 Years Ending March 31, 2015 Sharpe Ratio Rank Sortino Ratio Rank
_
Total Fund 1.1 52 1.7 48Policy Index 1.1 58 1.7 49InvestorForce Public DB > $1B Net Median 1.1 -- 1.7 --
XXXXX
5 Years Ending March 31, 2015 Anlzd Ret Rank Anlzd Std Dev Rank
_
Total Fund 10.1% 9 9.1% 84Policy Index 9.7% 30 8.9% 75InvestorForce Public DB > $1B Net Median 9.1% -- 7.9% --
XXXXX
24
MASTER PAGE NO. 321

March 31, 2015
Ventura County Employees’ Retirement AssociationTotal Fund Risk/Return
10 Years Ending March 31, 2015 Anlzd Ret Rank Anlzd Std Dev Rank
_
Total Fund 6.8% 29 10.9% 89Policy Index 6.9% 25 10.5% 82InvestorForce Public DB > $1B Net Median 6.4% -- 9.7% --
XXXXX
10 Years Ending March 31, 2015 Sharpe Ratio Rank Sortino Ratio Rank
_
Total Fund 0.5 67 0.7 64Policy Index 0.5 49 0.8 45InvestorForce Public DB > $1B Net Median 0.5 -- 0.8 --
XXXXX
25
MASTER PAGE NO. 322

March 31, 2015
Ventura County Employees’ Retirement AssociationTotal Fund Risk Statistics vs. Peer Universe
Total Fund vs. InvestorForce Public DB > $1B Net1 Year
26
MASTER PAGE NO. 323
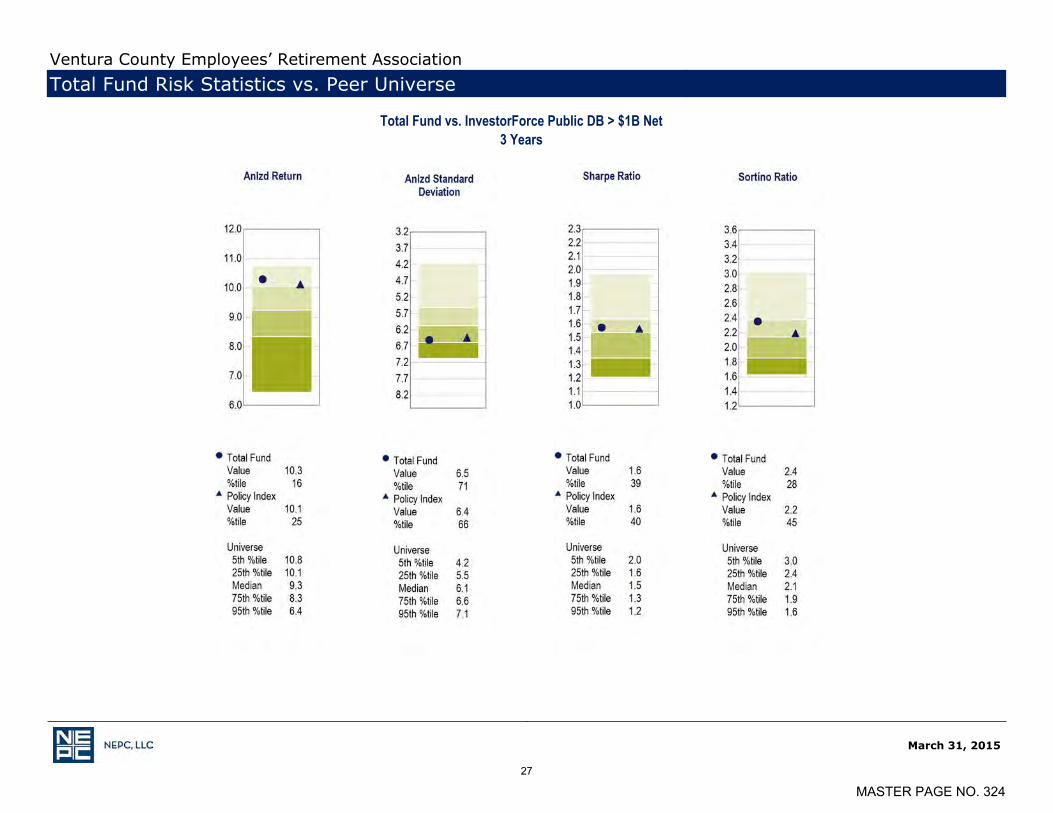
March 31, 2015
Ventura County Employees’ Retirement AssociationTotal Fund Risk Statistics vs. Peer Universe
Total Fund vs. InvestorForce Public DB > $1B Net3 Years
27
MASTER PAGE NO. 324

March 31, 2015
Ventura County Employees’ Retirement AssociationTotal Fund Risk Statistics vs. Peer Universe
Total Fund vs. InvestorForce Public DB > $1B Net5 Years
28
MASTER PAGE NO. 325

March 31, 2015
Ventura County Employees’ Retirement AssociationTotal Fund Risk Statistics vs. Peer Universe
Total Fund vs. InvestorForce Public DB > $1B Net10 Years
29
MASTER PAGE NO. 326

March 31, 2015
Ventura County Employees’ Retirement Association Rolling 5 Year Excess Returns
30
MASTER PAGE NO. 327

March 31, 2015
Ventura County Employees’ Retirement AssociationTotal Fund Attribution Analysis
Attribution Summary3 Months Ending March 31, 2015
Wtd.ActualReturn
Wtd. IndexReturn
ExcessReturn
SelectionEffect
AllocationEffect
InteractionEffects
TotalEffects
Total US Equity 1.9% 1.8% 0.0% 0.0% 0.0% 0.0% 0.0%Total Non-US Equity 3.1% 3.5% -0.4% -0.1% 0.0% 0.0% -0.1%Total Global Equity 2.5% 2.3% 0.2% 0.0% 0.0% 0.0% 0.0%Total US Fixed Income 1.0% 1.6% -0.6% -0.1% 0.0% 0.0% -0.1%Total Global Fixed Income -0.8% -1.9% 1.1% 0.1% 0.0% 0.0% 0.0%Total Real Estate 2.9% 3.4% -0.5% 0.0% 0.0% 0.0% 0.0%Total Liquid Alternatives 1.7% 1.5% 0.2% 0.0% 0.0% 0.0% 0.0%Overlay 3.4% 0.0% 3.3% 0.0% 0.0% 0.1% 0.1%Total Private Equity 4.5% 2.6% 1.9% 0.1% 0.0% 0.0% 0.0%Total 2.0% 2.1% -0.1% 0.0% -0.1% 0.0% -0.1%
31
MASTER PAGE NO. 328

Attribution Summary9 Months Ending March 31, 2015
Wtd.ActualReturn
Wtd. IndexReturn
ExcessReturn
SelectionEffect
AllocationEffect
InteractionEffects
TotalEffects
Total US Equity 7.1% 7.1% 0.1% 0.0% 0.0% 0.0% 0.0%Total Non-US Equity -5.5% -5.8% 0.3% 0.0% 0.0% 0.0% 0.0%Total Global Equity -2.2% 0.4% -2.5% -0.3% 0.0% 0.0% -0.3%Total US Fixed Income 1.0% 3.6% -2.6% -0.5% 0.0% 0.0% -0.5%Total Global Fixed Income -3.7% -6.0% 2.3% 0.1% -0.1% 0.0% 0.0%Total Real Estate 9.3% 10.2% -1.0% -0.1% 0.0% 0.0% -0.1%Total Liquid Alternatives -2.5% 2.0% -4.6% -0.4% 0.0% 0.0% -0.4%Overlay 5.1% 0.0% 5.1% 0.0% -0.1% 0.0% 0.0%Total Private Equity 12.3% 9.4% 2.8% 0.1% -0.2% -0.1% -0.1%Total 1.8% 3.1% -1.4% -1.0% -0.4% 0.0% -1.4%
March 31, 2015
Ventura County Employees’ Retirement AssociationTotal Fund Attribution Analysis
32
MASTER PAGE NO. 329

March 31, 2015
Ventura County Employees’ Retirement AssociationTotal Fund Attribution Analysis
Attribution Summary1 Year Ending March 31, 2015
Wtd.ActualReturn
Wtd. IndexReturn
ExcessReturn
SelectionEffect
AllocationEffect
InteractionEffects
TotalEffects
Total US Equity 12.3% 12.2% 0.1% 0.0% 0.0% 0.0% 0.1%Total Non-US Equity -1.1% -1.0% -0.1% 0.0% 0.0% 0.0% -0.1%Total Global Equity 2.7% 5.4% -2.7% -0.3% 0.0% 0.0% -0.3%Total US Fixed Income 2.4% 5.7% -3.3% -0.7% 0.0% 0.1% -0.6%Total Global Fixed Income -1.4% -3.7% 2.2% 0.1% -0.1% 0.0% 0.0%Total Real Estate 12.3% 13.4% -1.2% -0.1% 0.0% 0.0% -0.1%Total Liquid Alternatives 6.5% 3.9% 2.6% 0.3% 0.0% 0.0% 0.3%Overlay 2.5% 0.0% 2.4% 0.0% -0.1% 0.0% 0.0%Total Private Equity 18.5% 15.6% 2.9% 0.1% -0.2% -0.1% -0.2%Total 6.2% 7.1% -0.9% -0.5% -0.4% 0.0% -0.9%
33
MASTER PAGE NO. 330

1 Year Ending March 31, 2015
% of Tot Anlzd Ret Rank Anlzd StdDev Rank Sharpe
RatioTracking
Error Rank Info Ratio Rank Anlzd AJ Rank Beta_
Total Fund 100.0% 6.2% 41 5.3% 74 1.2 0.7% 20 -1.1 84 -1.2% 75 1.0 Policy Index -- 7.1% 18 5.1% 56 1.4 0.0% 1 -- -- 0.0% 38 1.0Total Equity 55.4% 6.9% 42 8.6% 40 0.8 1.3% 3 1.2 14 1.5% 45 1.0 MSCI ACWI -- 5.4% 55 8.5% 37 0.6 0.0% 1 -- -- 0.0% 55 1.0Total US Equity 31.2% 12.3% 36 9.4% 28 1.3 0.1% 1 1.9 4 0.1% 33 1.0 Total U.S. Equity Benchmark -- 12.2% 37 9.4% 28 1.3 0.0% 1 -- -- 0.0% 34 1.0Total Non-US Equity 14.1% -1.1% 54 8.6% 33 -0.1 1.2% 1 -0.1 57 -0.2% 55 0.9 Total Non-US EquityBenchmark -- -1.0% 54 9.3% 64 -0.1 0.0% 1 -- -- 0.0% 54 1.0
Total Global Equity 10.1% 2.7% 72 9.1% 52 0.3 1.3% 3 -2.0 94 -3.0% 73 1.1 MSCI ACWI -- 5.4% 55 8.5% 37 0.6 0.0% 1 -- -- 0.0% 55 1.0Total Fixed Income 23.5% 1.4% 39 1.6% 6 0.9 2.3% 30 2.2 31 2.8% 52 0.4 Barclays Global Aggregate -- -3.7% 82 3.6% 48 -1.0 0.0% 1 -- -- 0.0% 78 1.0Total US Fixed Income 17.6% 2.4% 68 1.2% 21 2.0 2.3% 55 -1.4 62 0.8% 23 0.3 Barclays Aggregate -- 5.7% 27 3.0% 67 1.9 0.0% 1 -- -- 0.0% 52 1.0Total Global Fixed Income 5.9% -1.4% 63 3.1% 29 -0.5 0.9% 8 2.6 21 1.6% 62 0.8 Barclays Global Aggregate -- -3.7% 82 3.6% 48 -1.0 0.0% 1 -- -- 0.0% 78 1.0Total Real Estate 7.6% 12.3% -- 5.0% -- 2.4 0.5% -- -2.2 -- 0.0% -- 0.9 Total Real Estate Benchmark -- 13.4% -- 5.5% -- 2.5 0.0% -- -- -- 0.0% -- 1.0Total Liquid Alternatives 9.7% 6.5% -- 8.6% -- 0.8 8.3% -- 0.3 -- 0.0% -- 1.7 CPI + 4% (Unadjusted) -- 3.9% -- 1.4% -- 2.8 0.0% -- -- -- 0.0% -- 1.0
XXXXX
March 31, 2015
Ventura County Employees’ Retirement AssociationTotal Fund Risk Statistics
34
MASTER PAGE NO. 331
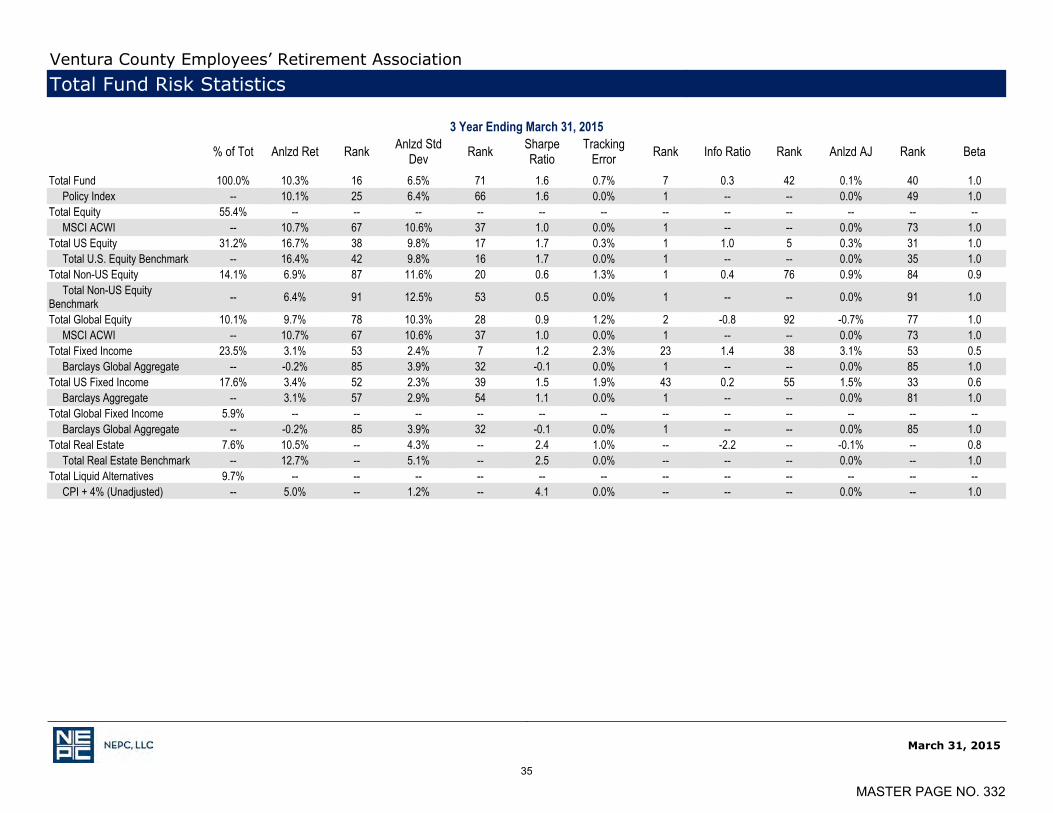
3 Year Ending March 31, 2015
% of Tot Anlzd Ret Rank Anlzd StdDev Rank Sharpe
RatioTracking
Error Rank Info Ratio Rank Anlzd AJ Rank Beta_
Total Fund 100.0% 10.3% 16 6.5% 71 1.6 0.7% 7 0.3 42 0.1% 40 1.0 Policy Index -- 10.1% 25 6.4% 66 1.6 0.0% 1 -- -- 0.0% 49 1.0Total Equity 55.4% -- -- -- -- -- -- -- -- -- -- -- -- MSCI ACWI -- 10.7% 67 10.6% 37 1.0 0.0% 1 -- -- 0.0% 73 1.0Total US Equity 31.2% 16.7% 38 9.8% 17 1.7 0.3% 1 1.0 5 0.3% 31 1.0 Total U.S. Equity Benchmark -- 16.4% 42 9.8% 16 1.7 0.0% 1 -- -- 0.0% 35 1.0Total Non-US Equity 14.1% 6.9% 87 11.6% 20 0.6 1.3% 1 0.4 76 0.9% 84 0.9 Total Non-US EquityBenchmark -- 6.4% 91 12.5% 53 0.5 0.0% 1 -- -- 0.0% 91 1.0
Total Global Equity 10.1% 9.7% 78 10.3% 28 0.9 1.2% 2 -0.8 92 -0.7% 77 1.0 MSCI ACWI -- 10.7% 67 10.6% 37 1.0 0.0% 1 -- -- 0.0% 73 1.0Total Fixed Income 23.5% 3.1% 53 2.4% 7 1.2 2.3% 23 1.4 38 3.1% 53 0.5 Barclays Global Aggregate -- -0.2% 85 3.9% 32 -0.1 0.0% 1 -- -- 0.0% 85 1.0Total US Fixed Income 17.6% 3.4% 52 2.3% 39 1.5 1.9% 43 0.2 55 1.5% 33 0.6 Barclays Aggregate -- 3.1% 57 2.9% 54 1.1 0.0% 1 -- -- 0.0% 81 1.0Total Global Fixed Income 5.9% -- -- -- -- -- -- -- -- -- -- -- -- Barclays Global Aggregate -- -0.2% 85 3.9% 32 -0.1 0.0% 1 -- -- 0.0% 85 1.0Total Real Estate 7.6% 10.5% -- 4.3% -- 2.4 1.0% -- -2.2 -- -0.1% -- 0.8 Total Real Estate Benchmark -- 12.7% -- 5.1% -- 2.5 0.0% -- -- -- 0.0% -- 1.0Total Liquid Alternatives 9.7% -- -- -- -- -- -- -- -- -- -- -- -- CPI + 4% (Unadjusted) -- 5.0% -- 1.2% -- 4.1 0.0% -- -- -- 0.0% -- 1.0
XXXXX
March 31, 2015
Ventura County Employees’ Retirement AssociationTotal Fund Risk Statistics
35
MASTER PAGE NO. 332

March 31, 2015
Ventura County Employees’ Retirement AssociationTotal Fund Risk Statistics
5 Year Ending March 31, 2015
% of Tot Anlzd Ret Rank Anlzd StdDev Rank Sharpe
RatioTracking
Error Rank Info Ratio Rank Anlzd AJ Rank Beta_
Total Fund 100.0% 10.1% 9 9.1% 84 1.1 0.8% 10 0.5 30 0.2% 40 1.0 Policy Index -- 9.7% 30 8.9% 75 1.1 0.0% 1 -- -- 0.0% 48 1.0Total Equity 55.4% -- -- -- -- -- -- -- -- -- -- -- -- MSCI ACWI -- 9.0% 71 14.4% 40 0.6 0.0% 1 -- -- 0.0% 72 1.0Total US Equity 31.2% 15.1% 41 13.5% 27 1.1 0.3% 1 1.0 1 0.2% 34 1.0 Total U.S. Equity Benchmark -- 14.8% 48 13.4% 25 1.1 0.0% 1 -- -- 0.0% 37 1.0Total Non-US Equity 14.1% 5.5% 80 15.5% 26 0.4 1.4% 1 0.5 61 0.9% 78 1.0 Total Non-US EquityBenchmark -- 4.8% 88 16.3% 49 0.3 0.0% 1 -- -- 0.0% 86 1.0
Total Global Equity 10.1% 8.8% 73 13.4% 21 0.7 2.3% 6 -0.1 75 0.5% 67 0.9 MSCI ACWI -- 9.0% 71 14.4% 40 0.6 0.0% 1 -- -- 0.0% 72 1.0Total Fixed Income 23.5% 5.3% 43 2.8% 9 1.9 3.2% 35 0.9 30 4.2% 34 0.4 Barclays Global Aggregate -- 2.3% 85 4.8% 30 0.5 0.0% 1 -- -- 0.0% 84 1.0Total US Fixed Income 17.6% 5.5% 38 2.7% 40 2.0 2.0% 41 0.5 38 2.5% 25 0.7 Barclays Aggregate -- 4.4% 57 2.8% 48 1.6 0.0% 1 -- -- 0.0% 82 1.0Total Global Fixed Income 5.9% -- -- -- -- -- -- -- -- -- -- -- -- Barclays Global Aggregate -- 2.3% 85 4.8% 30 0.5 0.0% 1 -- -- 0.0% 84 1.0Total Real Estate 7.6% 12.7% -- 5.4% -- 2.4 1.1% -- -1.7 -- -0.3% -- 0.9 Total Real Estate Benchmark -- 14.5% -- 5.9% -- 2.4 0.0% -- -- -- 0.0% -- 1.0Total Liquid Alternatives 9.7% -- -- -- -- -- -- -- -- -- -- -- -- CPI + 4% (Unadjusted) -- 5.7% -- 1.2% -- 4.8 0.0% -- -- -- 0.0% -- 1.0
XXXXX
36
MASTER PAGE NO. 333
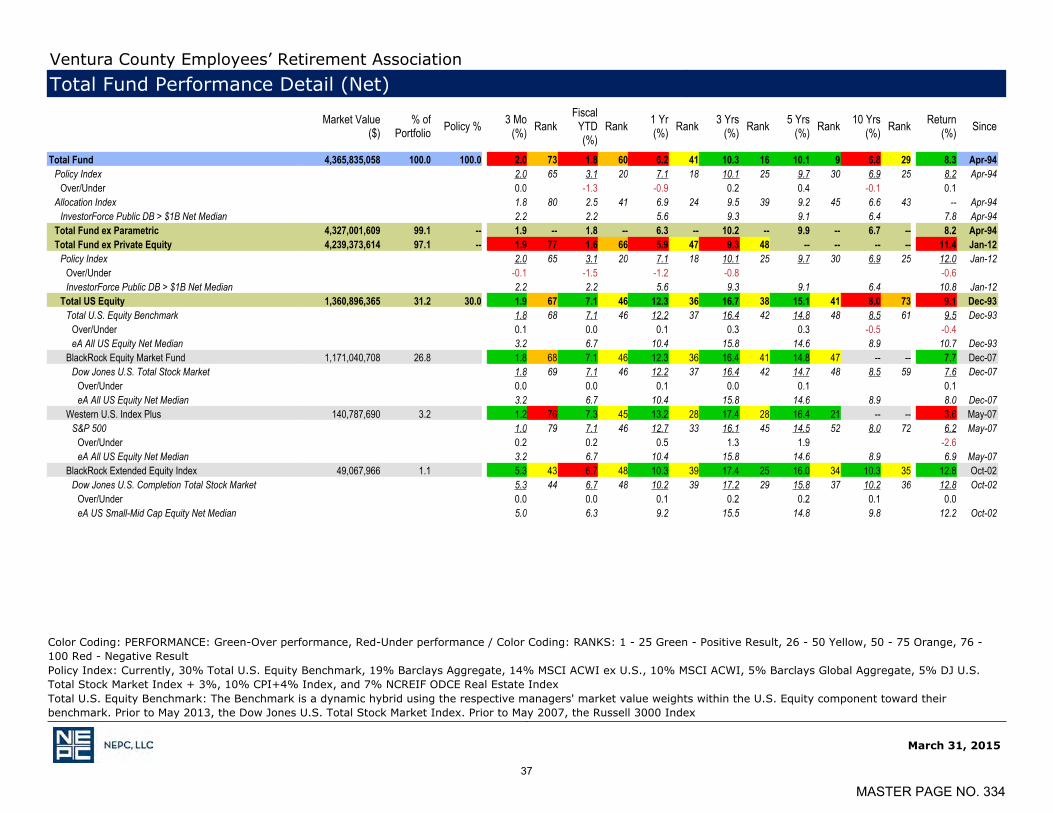
March 31, 2015
Color Coding: PERFORMANCE: Green-Over performance, Red-Under performance / Color Coding: RANKS: 1 - 25 Green - Positive Result, 26 - 50 Yellow, 50 - 75 Orange, 76 -100 Red - Negative ResultPolicy Index: Currently, 30% Total U.S. Equity Benchmark, 19% Barclays Aggregate, 14% MSCI ACWI ex U.S., 10% MSCI ACWI, 5% Barclays Global Aggregate, 5% DJ U.S.Total Stock Market Index + 3%, 10% CPI+4% Index, and 7% NCREIF ODCE Real Estate IndexTotal U.S. Equity Benchmark: The Benchmark is a dynamic hybrid using the respective managers' market value weights within the U.S. Equity component toward theirbenchmark. Prior to May 2013, the Dow Jones U.S. Total Stock Market Index. Prior to May 2007, the Russell 3000 Index
Ventura County Employees’ Retirement AssociationTotal Fund Performance Detail (Net)
Market Value($)
% ofPortfolio Policy % 3 Mo
(%) RankFiscal
YTD(%)
Rank 1 Yr(%) Rank 3 Yrs
(%) Rank 5 Yrs(%) Rank 10 Yrs
(%) Rank Return(%) Since
_
Total Fund 4,365,835,058 100.0 100.0 2.0 73 1.8 60 6.2 41 10.3 16 10.1 9 6.8 29 8.3 Apr-94Policy Index 2.0 65 3.1 20 7.1 18 10.1 25 9.7 30 6.9 25 8.2 Apr-94
Over/Under 0.0 -1.3 -0.9 0.2 0.4 -0.1 0.1 Allocation Index 1.8 80 2.5 41 6.9 24 9.5 39 9.2 45 6.6 43 -- Apr-94
InvestorForce Public DB > $1B Net Median 2.2 2.2 5.6 9.3 9.1 6.4 7.8 Apr-94Total Fund ex Parametric 4,327,001,609 99.1 -- 1.9 -- 1.8 -- 6.3 -- 10.2 -- 9.9 -- 6.7 -- 8.2 Apr-94Total Fund ex Private Equity 4,239,373,614 97.1 -- 1.9 77 1.6 66 5.9 47 9.3 48 -- -- -- -- 11.4 Jan-12
Policy Index 2.0 65 3.1 20 7.1 18 10.1 25 9.7 30 6.9 25 12.0 Jan-12Over/Under -0.1 -1.5 -1.2 -0.8 -0.6 InvestorForce Public DB > $1B Net Median 2.2 2.2 5.6 9.3 9.1 6.4 10.8 Jan-12
Total US Equity 1,360,896,365 31.2 30.0 1.9 67 7.1 46 12.3 36 16.7 38 15.1 41 8.0 73 9.1 Dec-93Total U.S. Equity Benchmark 1.8 68 7.1 46 12.2 37 16.4 42 14.8 48 8.5 61 9.5 Dec-93
Over/Under 0.1 0.0 0.1 0.3 0.3 -0.5 -0.4 eA All US Equity Net Median 3.2 6.7 10.4 15.8 14.6 8.9 10.7 Dec-93
BlackRock Equity Market Fund 1,171,040,708 26.8 1.8 68 7.1 46 12.3 36 16.4 41 14.8 47 -- -- 7.7 Dec-07Dow Jones U.S. Total Stock Market 1.8 69 7.1 46 12.2 37 16.4 42 14.7 48 8.5 59 7.6 Dec-07
Over/Under 0.0 0.0 0.1 0.0 0.1 0.1 eA All US Equity Net Median 3.2 6.7 10.4 15.8 14.6 8.9 8.0 Dec-07
Western U.S. Index Plus 140,787,690 3.2 1.2 76 7.3 45 13.2 28 17.4 28 16.4 21 -- -- 3.6 May-07S&P 500 1.0 79 7.1 46 12.7 33 16.1 45 14.5 52 8.0 72 6.2 May-07
Over/Under 0.2 0.2 0.5 1.3 1.9 -2.6 eA All US Equity Net Median 3.2 6.7 10.4 15.8 14.6 8.9 6.9 May-07
BlackRock Extended Equity Index 49,067,966 1.1 5.3 43 6.7 48 10.3 39 17.4 25 16.0 34 10.3 35 12.8 Oct-02Dow Jones U.S. Completion Total Stock Market 5.3 44 6.7 48 10.2 39 17.2 29 15.8 37 10.2 36 12.8 Oct-02
Over/Under 0.0 0.0 0.1 0.2 0.2 0.1 0.0 eA US Small-Mid Cap Equity Net Median 5.0 6.3 9.2 15.5 14.8 9.8 12.2 Oct-02
37
MASTER PAGE NO. 334

March 31, 2015
Total Non-U.S. Equity Benchmark: MSCI ACWI ex US Free, prior to May 2002, the MSCI EAFE
Ventura County Employees’ Retirement AssociationTotal Fund Performance Detail (Net)
Market Value($)
% ofPortfolio Policy % 3 Mo
(%) RankFiscal
YTD(%)
Rank 1 Yr(%) Rank 3 Yrs
(%) Rank 5 Yrs(%) Rank 10 Yrs
(%) Rank Return(%) Since
_
Total Non-US Equity 617,229,438 14.1 14.0 3.1 91 -5.5 71 -1.1 54 6.9 87 5.5 80 5.5 57 6.6 Mar-94Total Non-US Equity Benchmark 3.5 87 -5.8 73 -1.0 54 6.4 91 4.8 88 5.5 61 5.4 Mar-94
Over/Under -0.4 0.3 -0.1 0.5 0.7 0.0 1.2 eA All EAFE Equity Net Median 4.9 -4.0 -0.8 9.5 7.3 5.8 6.4 Mar-94
BlackRock ACWI ex-U.S. Index 258,178,876 5.9 3.6 61 -5.8 77 -1.2 75 6.7 78 5.2 85 -- -- 1.8 Mar-07MSCI ACWI ex USA 3.5 63 -5.8 77 -1.0 74 6.4 80 4.8 87 5.5 76 1.4 Mar-07
Over/Under 0.1 0.0 -0.2 0.3 0.4 0.4 eA ACWI ex-US All Cap Equity Net Median 3.9 -3.3 0.4 8.2 7.3 6.3 2.4 Mar-07
Sprucegrove 184,158,765 4.2 2.0 96 -6.8 77 -3.2 77 7.0 78 6.5 58 5.8 37 8.0 Mar-02MSCI EAFE 4.9 48 -4.8 61 -0.9 48 9.0 55 6.2 63 4.9 67 6.5 Mar-02
Over/Under -2.9 -2.0 -2.3 -2.0 0.3 0.9 1.5 MSCI ACWI ex USA 3.5 78 -5.8 65 -1.0 48 6.4 86 4.8 83 5.5 46 7.1 Mar-02
eA EAFE All Cap Equity Net Median 4.8 -4.0 -1.2 9.2 6.9 5.4 7.6 Mar-02Hexavest 80,358,439 1.8 3.7 74 -4.3 56 0.0 46 7.6 72 -- -- -- -- 4.9 Dec-10
MSCI EAFE 4.9 48 -4.8 61 -0.9 48 9.0 55 6.2 63 4.9 67 5.6 Dec-10Over/Under -1.2 0.5 0.9 -1.4 -0.7 eA EAFE All Cap Equity Net Median 4.8 -4.0 -1.2 9.2 6.9 5.4 6.1 Dec-10
Walter Scott 94,533,357 2.2 3.4 65 -2.6 44 2.5 24 6.2 84 -- -- -- -- 4.8 Dec-10MSCI ACWI ex USA 3.5 63 -5.8 77 -1.0 74 6.4 80 4.8 87 5.5 76 3.5 Dec-10
Over/Under -0.1 3.2 3.5 -0.2 1.3 eA ACWI ex-US All Cap Equity Net Median 3.9 -3.3 0.4 8.2 7.3 6.3 5.5 Dec-10
38
MASTER PAGE NO. 335

March 31, 2015
Ventura County Employees’ Retirement AssociationTotal Fund Performance Detail (Net)
Market Value($)
% ofPortfolio Policy % 3 Mo
(%) RankFiscal
YTD(%)
Rank 1 Yr(%) Rank 3 Yrs
(%) Rank 5 Yrs(%) Rank 10 Yrs
(%) Rank Return(%) Since
_
Total Global Equity 440,946,810 10.1 10.0 2.5 62 -2.2 76 2.7 72 9.7 78 8.8 73 -- -- 5.7 May-05MSCI ACWI 2.3 65 0.4 60 5.4 55 10.7 67 9.0 71 6.4 65 6.7 May-05
Over/Under 0.2 -2.6 -2.7 -1.0 -0.2 -1.0 eA All Global Equity Net Median 3.0 1.3 6.0 12.1 10.5 7.3 7.7 May-05
BlackRock MSCI ACWI Equity Index 227,794,793 5.2 2.4 64 0.6 58 5.8 52 -- -- -- -- -- -- -- May-12MSCI ACWI 2.3 65 0.4 60 5.4 55 10.7 67 9.0 71 6.4 65 15.6 May-12
Over/Under 0.1 0.2 0.4 eA All Global Equity Net Median 3.0 1.3 6.0 12.1 10.5 7.3 16.3 May-12
GMO Global Equity 213,152,017 4.9 2.5 61 -5.0 86 -0.4 84 8.8 85 8.4 76 -- -- 6.7 Apr-05MSCI ACWI 2.3 65 0.4 60 5.4 55 10.7 67 9.0 71 6.4 65 6.7 Apr-05
Over/Under 0.2 -5.4 -5.8 -1.9 -0.6 0.0 eA All Global Equity Net Median 3.0 1.3 6.0 12.1 10.5 7.3 7.7 Apr-05
39
MASTER PAGE NO. 336

March 31, 2015
Private Equity performance is shown on a time-weighted return basis. Values are cash adjusted with current quarter cash flows.
Ventura County Employees’ Retirement AssociationTotal Fund Performance Detail (Net)
Market Value($)
% ofPortfolio Policy % 3 Mo
(%) RankFiscal
YTD(%)
Rank 1 Yr(%) Rank 3 Yrs
(%) Rank 5 Yrs(%) Rank 10 Yrs
(%) Rank Return(%) Since
_
Total Private Equity 126,461,444 2.9 5.0 4.5 -- 12.3 -- 18.5 -- 16.0 -- -- -- -- -- -- Jul-10DJ U.S. Total Stock Market Index + 3% 2.6 -- 9.4 -- 15.6 -- 19.8 -- 18.2 -- -- -- 20.6 Jul-10
Over/Under 1.9 2.9 2.9 -3.8 Adams Street Partners 77,594,905 1.8 3.2 -- 10.5 -- 16.5 -- 14.8 -- -- -- -- -- -- Jul-10
DJ U.S. Total Stock Market Index + 3% 2.6 -- 9.4 -- 15.6 -- 19.8 -- 18.2 -- -- -- 20.6 Jul-10Over/Under 0.6 1.1 0.9 -5.0
Panteon Ventures 14,663,333 0.3 2.2 -- 5.5 -- 12.7 -- 12.1 -- -- -- -- -- -- Aug-10DJ U.S. Total Stock Market Index + 3% 2.6 -- 9.4 -- 15.6 -- 19.8 -- 18.2 -- -- -- 22.2 Aug-10
Over/Under -0.4 -3.9 -2.9 -7.7 Harbourvest 34,203,207 0.8 7.9 -- 19.1 -- 25.9 -- -- -- -- -- -- -- -- May-13
DJ U.S. Total Stock Market Index + 3% 2.6 -- 9.4 -- 15.6 -- 19.8 -- 18.2 -- -- -- 19.9 May-13Over/Under 5.3 9.7 10.3
XXXXX
40
MASTER PAGE NO. 337

March 31, 2015
Reams Custom Index: Merrill Lynch 3 Month Libor Constant Maturity Index, prior to February 2013 the Barclays AggregateLoomis Custom Index: 65% Barclays Aggregate, 30% Citigroup High Yield Market Index and 5% JPM Non-US Hedged Bond Index
Ventura County Employees’ Retirement AssociationTotal Fund Performance Detail (Net)
Market Value($)
% ofPortfolio Policy % 3 Mo
(%) RankFiscal
YTD(%)
Rank 1 Yr(%) Rank 3 Yrs
(%) Rank 5 Yrs(%) Rank 10 Yrs
(%) Rank Return(%) Since
_
Total US Fixed Income 767,452,669 17.6 19.0 1.0 72 1.0 68 2.4 68 3.4 52 5.5 38 6.1 27 6.3 Feb-94Barclays Aggregate 1.6 46 3.6 22 5.7 27 3.1 57 4.4 57 4.9 49 5.8 Feb-94
Over/Under -0.6 -2.6 -3.3 0.3 1.1 1.2 0.5 eA All US Fixed Inc Net Median 1.5 2.1 3.6 3.5 4.7 4.9 5.7 Feb-94
BlackRock U.S. Debt Fund 141,505,104 3.2 1.6 46 3.7 21 5.9 25 3.2 55 4.5 55 5.0 47 5.7 Nov-95Barclays Aggregate 1.6 46 3.6 22 5.7 27 3.1 57 4.4 57 4.9 49 5.7 Nov-95
Over/Under 0.0 0.1 0.2 0.1 0.1 0.1 0.0 eA All US Fixed Inc Net Median 1.5 2.1 3.6 3.5 4.7 4.9 5.5 Nov-95
Western 272,269,339 6.2 2.2 23 3.9 17 6.7 15 5.0 33 6.5 29 5.8 30 6.7 Dec-96Barclays Aggregate 1.6 46 3.6 22 5.7 27 3.1 57 4.4 57 4.9 49 5.7 Dec-96
Over/Under 0.6 0.3 1.0 1.9 2.1 0.9 1.0 eA All US Fixed Inc Net Median 1.5 2.1 3.6 3.5 4.7 4.9 5.6 Dec-96
Reams 280,328,425 6.4 -0.7 99 -3.1 99 -4.1 99 1.5 81 4.5 55 6.1 26 5.8 Sep-01Reams Custom Index 0.1 98 0.2 84 0.2 94 1.2 84 3.3 75 4.4 63 4.6 Sep-01
Over/Under -0.8 -3.3 -4.3 0.3 1.2 1.7 1.2 Barclays Aggregate 1.6 46 3.6 22 5.7 27 3.1 57 4.4 57 4.9 49 5.0 Sep-01
eA All US Fixed Inc Net Median 1.5 2.1 3.6 3.5 4.7 4.9 5.0 Sep-01Loomis Sayles Multi Strategy 73,349,802 1.7 2.1 24 1.5 62 5.1 38 6.9 19 7.9 19 -- -- 7.3 Jul-05
Loomis Custom Index 1.8 34 2.2 50 4.3 43 4.3 41 5.6 37 -- -- 5.8 Jul-05Over/Under 0.3 -0.7 0.8 2.6 2.3 1.5
Barclays Aggregate 1.6 46 3.6 22 5.7 27 3.1 57 4.4 57 4.9 49 4.9 Jul-05eA All US Fixed Inc Net Median 1.5 2.1 3.6 3.5 4.7 4.9 4.9 Jul-05
41
MASTER PAGE NO. 338

March 31, 2015
Ventura County Employees’ Retirement AssociationTotal Fund Performance Detail (Net)
Market Value($)
% ofPortfolio Policy % 3 Mo
(%) RankFiscal
YTD(%)
Rank 1 Yr(%) Rank 3 Yrs
(%) Rank 5 Yrs(%) Rank 10 Yrs
(%) Rank Return(%) Since
_
Total Global Fixed Income 258,135,292 5.9 5.0 -0.8 63 -3.7 59 -1.4 63 -- -- -- -- -- -- 0.7 Jun-12Barclays Global Aggregate -1.9 82 -6.0 80 -3.7 82 -0.2 85 2.3 85 3.6 84 -0.5 Jun-12
Over/Under 1.1 2.3 2.3 1.2 eA All Global Fixed Inc Net Median 0.6 -2.4 0.1 3.3 4.7 5.1 3.2 Jun-12
Loomis Sayles Global Fixed Income 90,486,017 2.1 -1.9 85 -6.2 86 -3.8 86 -- -- -- -- -- -- 0.0 Jun-12Barclays Global Aggregate -1.9 86 -6.0 85 -3.7 86 -0.2 83 2.3 83 3.6 76 -0.5 Jun-12
Over/Under 0.0 -0.2 -0.1 0.5 eA Global Fixed Inc Unhedged Net Median 0.0 -3.2 -0.7 2.4 4.2 4.5 2.6 Jun-12
PIMCO Global Fixed Income 124,955,057 2.9 -0.8 59 -3.6 55 -1.2 59 -- -- -- -- -- -- -1.0 Sep-12Barclays Global Aggregate -1.9 86 -6.0 85 -3.7 86 -0.2 83 2.3 83 3.6 76 -1.8 Sep-12
Over/Under 1.1 2.4 2.5 0.8 eA Global Fixed Inc Unhedged Net Median 0.0 -3.2 -0.7 2.4 4.2 4.5 1.3 Sep-12
Loomis Strategic Alpha 42,694,218 1.0 1.6 30 2.0 9 3.4 10 -- -- -- -- -- -- 3.3 Jul-13Barclays Global Aggregate -1.9 86 -6.0 85 -3.7 86 -0.2 83 2.3 83 3.6 76 -0.2 Jul-13
Over/Under 3.5 8.0 7.1 3.5 eA Global Fixed Inc Unhedged Net Median 0.0 -3.2 -0.7 2.4 4.2 4.5 2.7 Jul-13
42
MASTER PAGE NO. 339

March 31, 2015
Total Real Estate Benchmark: NCREIF ODCE; prior to January 2006, the NCREIF Property Index
Ventura County Employees’ Retirement AssociationTotal Fund Performance Detail (Net)
Market Value($)
% ofPortfolio Policy % 3 Mo
(%) RankFiscal
YTD(%)
Rank 1 Yr(%) Rank 3 Yrs
(%) Rank 5 Yrs(%) Rank 10 Yrs
(%) Rank Return(%) Since
_
Total Real Estate 330,958,239 7.6 7.0 2.9 -- 9.3 -- 12.3 -- 10.5 -- 12.7 -- 5.0 -- 7.8 Mar-94Total Real Estate Benchmark 3.4 -- 10.2 -- 13.4 -- 12.7 -- 14.5 -- 7.0 -- 8.9 Mar-94
Over/Under -0.5 -0.9 -1.1 -2.2 -1.8 -2.0 -1.1 Prudential Real Estate 111,362,490 2.6 3.2 -- 10.4 -- 13.8 -- 11.8 -- 14.9 -- 5.9 -- 5.4 Jun-04
NCREIF-ODCE 3.4 -- 10.2 -- 13.4 -- 12.7 -- 14.5 -- 7.0 -- 7.6 Jun-04Over/Under -0.2 0.2 0.4 -0.9 0.4 -1.1 -2.2
UBS Real Estate 213,926,049 4.9 2.7 -- 8.7 -- 11.1 -- 9.6 -- 11.6 -- 6.4 -- 7.4 Mar-03NCREIF-ODCE 3.4 -- 10.2 -- 13.4 -- 12.7 -- 14.5 -- 7.0 -- 7.9 Mar-03
Over/Under -0.7 -1.5 -2.3 -3.1 -2.9 -0.6 -0.5 RREEF 5,669,699 0.1 2.3 -- 9.7 -- 24.0 -- 21.0 -- 26.7 -- -- -- -6.1 Sep-07
NCREIF-ODCE 3.4 -- 10.2 -- 13.4 -- 12.7 -- 14.5 -- 7.0 -- 3.4 Sep-07Over/Under -1.1 -0.5 10.6 8.3 12.2 -9.5
43
MASTER PAGE NO. 340

Market Value($)
% ofPortfolio Policy % 3 Mo
(%) RankFiscal
YTD(%)
Rank 1 Yr(%) Rank 3 Yrs
(%) Rank 5 Yrs(%) Rank 10 Yrs
(%) Rank Return(%) Since
_
Total Liquid Alternatives 424,921,353 9.7 10.0 1.7 -- -2.5 -- 6.5 -- -- -- -- -- -- -- 12.1 Apr-13CPI + 4% (Unadjusted) 1.5 -- 2.0 -- 3.9 -- 5.0 -- 5.7 -- 6.1 -- 4.8 Apr-13
Over/Under 0.2 -4.5 2.6 7.3 Bridgewater All Weather Fund 284,498,548 6.5 3.7 -- 1.9 -- 7.6 -- -- -- -- -- -- -- 9.5 Aug-13
CPI + 5% (Unadjusted) 1.8 -- 2.8 -- 4.9 -- -- -- -- -- -- -- 5.6 Aug-13Over/Under 1.9 -0.9 2.7 3.9
Tortoise Energy Infrastructure 140,422,805 3.2 -2.2 -- -10.5 -- 4.3 -- -- -- -- -- -- -- 13.4 Apr-13Wells Fargo MLP Index -3.7 -- -13.3 -- -0.7 -- 10.5 -- -- -- -- -- 4.3 Apr-13
Over/Under 1.5 2.8 5.0 9.1 Overlay 38,833,449 0.9 0.0
Parametric 38,833,449 0.9
March 31, 2015
Overlay performance is not applicable on an individual account level
Ventura County Employees’ Retirement AssociationTotal Fund Performance Detail (Net)
44
MASTER PAGE NO. 341

March 31, 2015
Ventura County Employees’ Retirement AssociationTotal Fund Return Summary vs. Peer Universe
45
MASTER PAGE NO. 342

March 31, 2015
Ventura County Employees’ Retirement AssociationTotal Fund Return Summary vs. Peer Universe
46
MASTER PAGE NO. 343
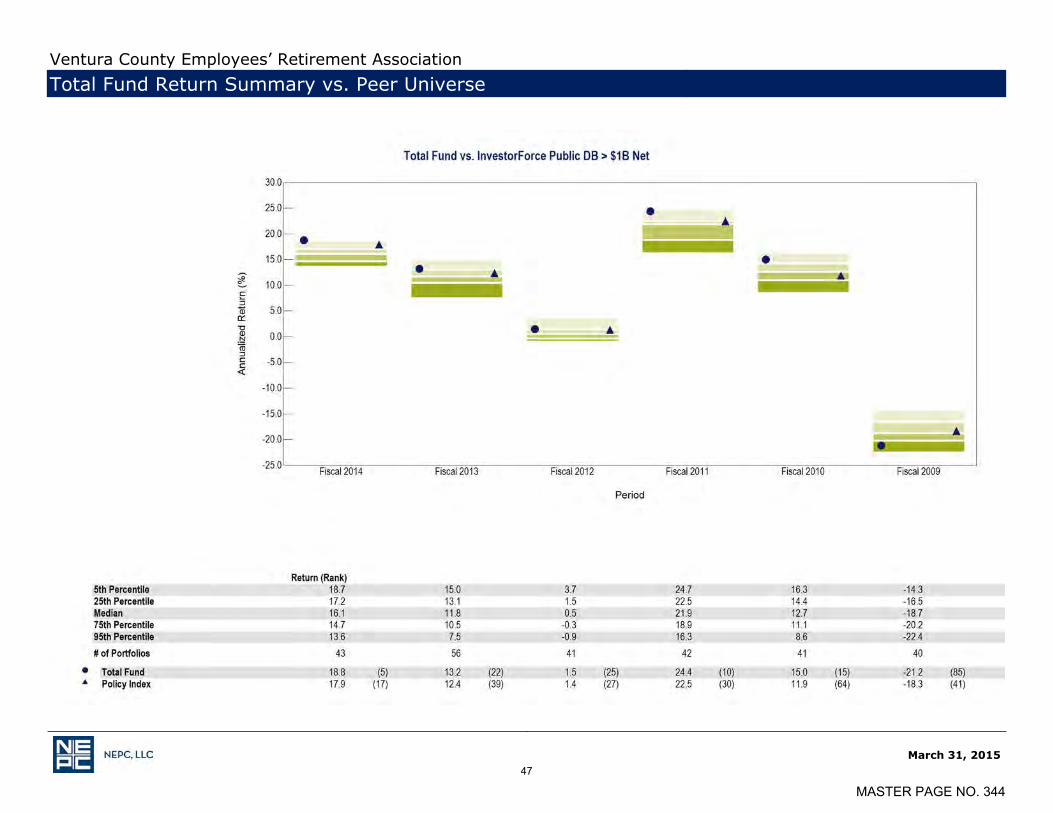
March 31, 2015
Ventura County Employees’ Retirement AssociationTotal Fund Return Summary vs. Peer Universe
47
MASTER PAGE NO. 344
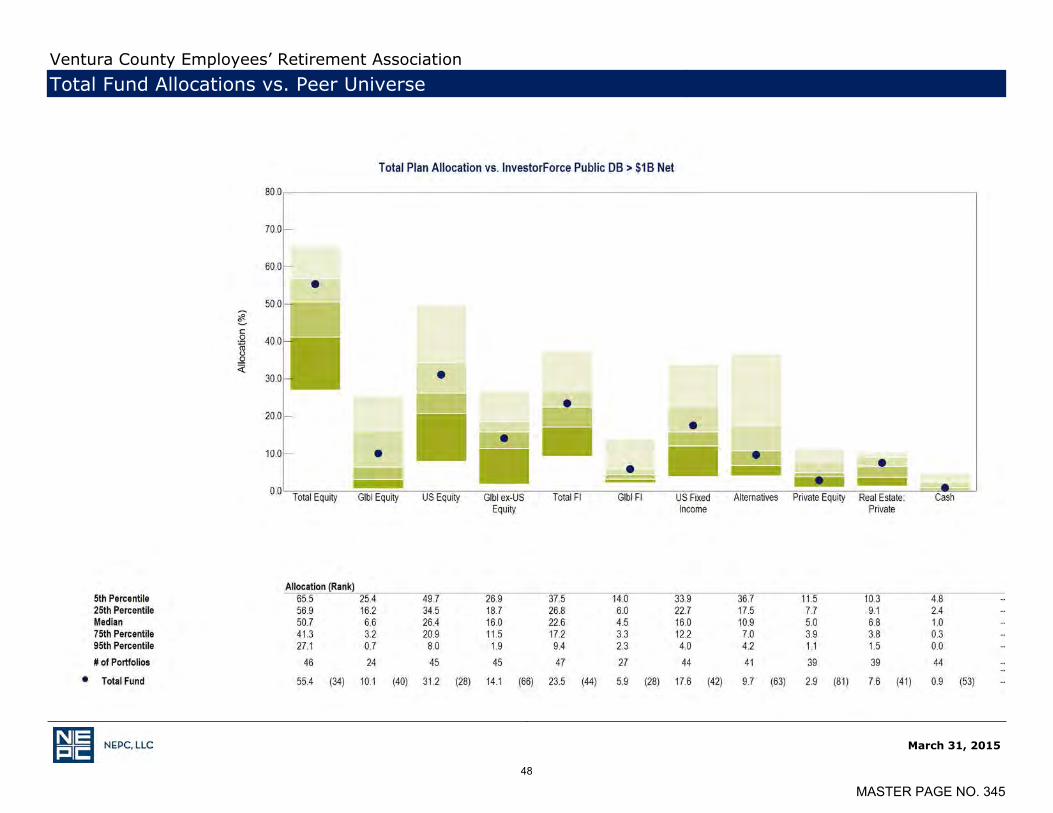
March 31, 2015
Ventura County Employees’ Retirement AssociationTotal Fund Allocations vs. Peer Universe
48
MASTER PAGE NO. 345

Manager Due Diligence
49
MASTER PAGE NO. 346

Investment OptionsPerformance
(Recent Quarter)
Changes/Announcements
(Recent Quarter)
NEPC Due Diligence
Committee Recommendations
Plan Recommendation Comments
BlackRock Equity Market Index - - - -
Western U.S. Index Plus Bottom Quartile - - -
BlackRock Extended Equity Index - - - -
BlackRock MSCI ACWI ex-U.S. Index - - - -
Sprucegrove Bottom Decile No Hold No Action 3Q 2014 Departure
Hexavest - - - -
Walter Scott - - - -
BlackRock MSCI ACWI Index - - - -
GMO - - - -
Adams Street N/A - - -
HarbourVest N/A - - -
Pantheon N/A - - -
BlackRock U.S. Debt Fund - - - -
Western Top Quartile - - -
Reams Bottom Decile - - -
Loomis Sayles Multi-Sector Full Discretion Top Quartile - - -
Loomis Sayles Global Fixed Income Bottom Quartile - - -
PIMCO Global Fixed Income - Yes Watch No ActionContinued
organizational developments
Loomis Sayles Strategic Alpha - - - -
The items below summarize the recent quarter’s performance and any changes or announcements from the Plan’s managers/products. A “-” indicates there were no material announcements. A “Yes” indicates there was an announcement and a brief summary is provided on the following pages. NEPC’s Due Diligence Committee meets every two weeks to review events as they relate to investment managers and determine if any action should be taken (by NEPC and/or by our clients). Events are rated: No Action, Watch, Hold, Client Review or Terminate. NEPC’s recommendation in view of the recent quarter’s developments (performance, manager events, and any of the longer-term trending data) is refreshed quarterly.
Ventura County Employees’ Retirement AssociationDue Diligence Monitor
March 31, 2015
50
MASTER PAGE NO. 347

Investment OptionsPerformance
(Recent Quarter)
Changes/Announcements
(Recent Quarter)
NEPC Due Diligence
Committee Recommendations
Plan Recommendation Comments
Prudential N/A - - -
RREEF N/A - - -
UBS N/A - - -
Bridgewater N/A - - -
Tortoise N/A - - -
Parametric/Clifton N/A - - -
Due Diligence Monitor ContinuedVentura County Employees’ Retirement Association
NEPC Due Diligence Committee Recommendation Key
No Action Informational items have surfaced; no action is recommended.
Watch Issues have surfaced to be concerned over; manager can participate in future searches, but currentand prospective clients must be made aware of the issues.
Hold Serious issues have surfaced to be concerned over; manager cannot participate in future searchesunless a client specifically requests, but current and prospective clients must be made aware of theissues.
Client Review Very serious issues have surfaced with an Investment Manager; manager cannot participate infuture searches unless a client specifically requests. Current clients must be advised to review themanager.
Terminate We have lost all confidence in the product; manager would not be recommended for searches andclients would be discouraged from using. The manager cannot participate in future searches unless aclient specifically requests. Current clients must be advised to replace the manager.
March 31, 2015
51
MASTER PAGE NO. 348

Below is a summary of manager changes, announcements and due diligence events since the issuance of our last quarterly report.
Manager Changes/Announcements
Sprucegrove Investment Management Ltd.On September 1, 2014, NEPC was notified that Co-President/Co-Portfolio Manager Peter Ellement resigned from the firm. Sprucegrove did not provide transparency into the exact reason for the departure other than there appeared to be some level of conflict between Mr. Ellement and other members of the firm. Shirley Woo will be joined by Arjun Kumar as the Co-Portfolio Managers on the International Equity Fund going forward. Craig Merrigan will become the sole President of the firm.
NEPC recommends a due diligence status of HOLD for Sprucegrove. We do not recommend any action at this time as a result of Mr. Ellement’s departure.
PIMCONEPC Research placed PIMCO on Client Review in September 2014 following the sudden departure of Founder and CIO Bill Gross. We felt a Client Review status was necessary given that Mr. Gross’ departure was significant from both an investment and business standpoint. Since that time, NEPC Research has conducted an extensive due diligence review in order to gather additional information and ultimately formulate a follow-up recommendation to clients. While outflows continue at PIMCO, particularly from the flagship Total Return strategy, redemptions have slowed and performance has not materially suffered. Additionally, with the exception of a few individuals, PIMCO has retained its leading investment professionals throughout the period. We believe the level of business and investment risk associated with PIMCO as a firm has been reduced considerably as time has passed following the departure of Mr. Gross, although some products continue to exhibit a greater degree of uncertainty. Even with the changes summarized below, NEPC Research will continue to closely monitor PIMCO in the coming months.
As our Due Diligence event process outlines, the Client Review status is reassessed 6-12 months after an event occurs. After conducting analysis on PIMCO at both the firm and individual product level, we have made multiple changes to the Due Diligence status. The changes are summarized below:
• PIMCO Firm DD status will move from Client Review to Watch• Total Return and Unconstrained Bond will maintain Client Review status• All other PIMCO products will be upgraded from Client Review to Watch
In the months following the departure of Bill Gross, NEPC maintained a consistent dialogue with PIMCO executives, senior investmentpersonnel, and staff. These interactions included two onsite meetings in Newport Beach, a conference call and in-person discussion withCEO Doug Hodge, several product-specific updates, and constant ad-hoc conversations with PIMCO representatives. Through theseConversations, we gathered information related to Bill Gross’ departure, specifically, the impact on investment performance, internalworking environment, PIMCO’s approach to managing a high level of redemptions, revenue losses and organizational flexibility,and retention of key professionals. The insight gained from these conversations combined with the actual results in the months after theannouncement provide us with a basis on which to make a recommendation.
Due Diligence CommentaryVentura County Employees’ Retirement Association
March 31, 2015
52
MASTER PAGE NO. 349

Below is a summary of manager changes, announcements and due diligence events since the issuance of our last quarterly report.
Manager Changes/Announcements
PIMCO (continued)
PIMCO - Firm Status: In the period beginning January 1, 2014 through March 31, 2015, PIMCO total assets under management fell byapproximately $330 billion. Much of the outflows occurred following Bill Gross’s departure and more than half was redeemed from theTotal Return strategy. There are signs that asset flows have stabilized outside of Total Return, with several strategies experiencing netinflows in March 2015. In addition, there is no evidence that PIMCO has made any material organizational changes to adjust for the lossin revenue. We believe that PIMCO has a great deal of financial flexibility in this regard through compensation adjustments, employeeattrition, and overall financial health. One factor that did not go unnoticed in conversations with members of the investment team is the improvement in the workplace environment since Mr. Gross’ departure. By all accounts, it appears the atmosphere is positive and moreconducive to a collegial workplace. While it will take time to see if this new PIMCO environment will yield positive results for clients, it isa step in the right direction. For these reasons we are upgrading PIMCO’s firm due diligence status to Watch from Client Review.
PIMCO strategies excluding Total Return and Unconstrained Bond: The impact of Bill Gross’s departure for a majority of PIMCO strategies is much less significant from an investment standpoint. While outflows did occur across the product platform, redemptions tapered off quickly in the months following the announcement and reversed in some cases. While some strategies may continue to feel a residual impact from the organizational changes, we are comfortable with the investment teams and strategies and see little in terms of product-specific risks going forward. All PIMCO strategies, with the exception of Total Return and Unconstrained Bond, will have their Client Review due diligence status rescinded. These strategies will retain a due diligence status of Watch due to the overall PIMCO Firm rating detailed above.
NEPC recommends a due diligence status of WATCH for PIMCO as a firm and for the Global Fixed Income portfolio in which VCERA currently invests.
Due Diligence CommentaryVentura County Employees’ Retirement Association
March 31, 2015
53
MASTER PAGE NO. 350

Appendix: Market Environment; Performance Disclosures
54
MASTER PAGE NO. 351

Broad Market Performance Summary as of 3/31/2015
Source: Bloomberg, Standard and Poors, Russell, MSCI, Barclays, Citigroup, JP Morgan *1 Yr Range: Represents range of cumulative high/low daily index returns for an investment made one year ago
‐35%
‐30%
‐25%
‐20%
‐15%
‐10%
‐5%
0%
5%
10%
15%
20%
S&P 500 Russell2500
MSCI EAFE MSCI EM BarclaysAgg
BarclaysHigh Yield
WGBI GBI‐EMGlob Div
BloombergCommodity
1 Yr Range
1 Yr Return
3 Month Return
March 31, 2015
Ventura County Employees’ Retirement Association
55
MASTER PAGE NO. 352

Inflation has stayed low Unemployment steadily improving
Corporate profits at secular highs Manufacturing above average but trending down
U.S. Economic Indicators
Source: Bloomberg, Federal Reserve, Bureau of Labor Statistics Source: Bloomberg, Bureau of Labor Statistics
Source: Bloomberg, Institute for Supply ManagementSource: Bloomberg, Bureau of Economic Analysis
60%
65%
70%
75%
80%
85%
90%
‐3%‐2%‐1%0%1%2%3%4%5%6%
1995
1996
1997
1998
1999
2000
2001
2002
2003
2004
2005
2006
2007
2008
2009
2010
2011
2012
2013
2014
CPI (LHS)Capacity Utilization (RHS)
0%2%4%6%8%
10%12%14%16%18%
1995
1996
1997
1998
1999
2000
2001
2002
2003
2004
2005
2006
2007
2008
2009
2010
2011
2012
2013
2014
US UnemploymentU‐6 Unemployment
6%
7%
8%
9%
10%
11%
12%
13%
14%
1965
1967
1969
1971
1973
1975
1977
1979
1981
1983
1985
1987
1989
1991
1993
1995
1997
1999
2001
2003
2005
2007
2009
2011
2013
Corporate Profits (% of GDP)
35
40
45
50
55
60
65
1995
1996
1997
1998
1999
2000
2001
2002
2003
2004
2005
2006
2007
2008
2009
2010
2011
2012
2013
2014
US ISM PMI
March 31, 2015
Ventura County Employees’ Retirement Association
56
MASTER PAGE NO. 353

Deflation remains a concern Europe employment recovery lagging
Manufacturing subdued in Europe but rising off lows Leading indicators neutral to positive
International Economic Indicators
Source: Bloomberg, Japan Ministry of Internal Affairs and Communications, Eurostat Source: Bloomberg, Japan Ministry of Internal Affairs and Communications, Eurostat
Source: Bloomberg, OECDSource: Bloomberg, OECD, Eurostat
‐3%
‐2%
‐1%
0%
1%
2%
3%
4%
5%
Jan‐04
Sep‐04
May‐05
Jan‐06
Sep‐06
May‐07
Jan‐08
Sep‐08
May‐09
Jan‐10
Sep‐10
May‐11
Jan‐12
Sep‐12
May‐13
Jan‐14
Sep‐14
Japan CPI
Euro CPI0%
2%
4%
6%
8%
10%
12%
14%
Apr‐00
Feb‐01
Dec‐01
Oct‐02
Aug‐03
Jun‐04
Apr‐05
Feb‐06
Dec‐06
Oct‐07
Aug‐08
Jun‐09
Apr‐10
Feb‐11
Dec‐11
Oct‐12
Aug‐13
Jun‐14
Europe UnemploymentJapan Unemployment
‐10%‐8%‐6%‐4%‐2%0%2%4%6%8%
10%
Mar‐05
Nov
‐05
Jul‐0
6
Mar‐07
Nov
‐07
Jul‐0
8
Mar‐09
Nov
‐09
Jul‐1
0
Mar‐11
Nov
‐11
Jul‐1
2
Mar‐13
Nov
‐13
Jul‐1
4YoY % Cha
nge in M
anufacturin
g
GermanyFranceItalyJapan
97.0
98.0
99.0
100.0
101.0
102.0
103.0
Feb‐05
Oct‐05
Jun‐06
Feb‐07
Oct‐07
Jun‐08
Feb‐09
Oct‐09
Jun‐10
Feb‐11
Oct‐11
Jun‐12
Feb‐13
Oct‐13
Jun‐14
OECD Lead
ing Indicator S
A
Euro AreaJapanUKCanada
March 31, 2015
Ventura County Employees’ Retirement Association
57
MASTER PAGE NO. 354

EM inflation is varied by country Relatively healthy Debt/GDP ratios
Some improvement in account balance challenged countries
Emerging economies make up >50% of global output
Emerging Market Economic Indicators
Source: Bloomberg Source: Bloomberg, IMF
Source: Bloomberg, IMFSource: Bloomberg
‐1.0%0.0%1.0%2.0%3.0%4.0%5.0%6.0%7.0%8.0%9.0%
Brazil China Mexico SouthAfrica
SouthKorea
Taiwan Turkey
CPI
Most Recent
1 Yr Previous
0%
20%
40%
60%
80%
100%
120%
Gross Gov
't Deb
t as %
of G
DP
‐20%
‐15%
‐10%
‐5%
0%
5%
10%
15%
20%
Jun‐05
Jan‐06
Aug‐06
Mar‐07
Oct‐07
May‐08
Dec‐08
Jul‐0
9Feb‐10
Sep‐10
Apr‐11
Nov
‐11
Jun‐12
Jan‐13
Aug‐13
Mar‐14
Oct‐14
Accoun
t Balan
ce (%
of G
DP)
Mexico Brazil South AfricaTurkey Malaysia Indonesia
0%10%20%30%40%50%60%70%80%90%
100%
1995
1996
1997
1998
1999
2000
2001
2002
2003
2004
2005
2006
2007
2008
2009
2010
2011
2012
2013
2014
2015
2016
2017
2018
GDP PP
P as % of W
orld
Developed
Emerging
March 31, 2015
Ventura County Employees’ Retirement Association
58
MASTER PAGE NO. 355

Equity volatility remains low Treasury rates experiencing higher volatility
Recent uptick in currency volatilities Commodity pricing volatility has increased
Volatility
Source: Bloomberg, CBOE Source: Bloomberg, Merrill Lynch
Source: Bloomberg, Merrill LynchSource: Bloomberg, Deutsche Bank
05
101520253035404550
Apr‐10
Jul‐1
0Oct‐10
Jan‐11
Apr‐11
Jul‐1
1Oct‐11
Jan‐12
Apr‐12
Jul‐1
2Oct‐12
Jan‐13
Apr‐13
Jul‐1
3Oct‐13
Jan‐14
Apr‐14
Jul‐1
4Oct‐14
Jan‐15
VIX Index
405060708090
100110120130
Apr‐10
Jul‐1
0Oct‐10
Jan‐11
Apr‐11
Jul‐1
1Oct‐11
Jan‐12
Apr‐12
Jul‐1
2Oct‐12
Jan‐13
Apr‐13
Jul‐1
3Oct‐13
Jan‐14
Apr‐14
Jul‐1
4Oct‐14
Jan‐15
MOVE Index
4
6
8
10
12
14
16
18
Apr‐10
Jul‐1
0Oct‐10
Jan‐11
Apr‐11
Jul‐1
1Oct‐11
Jan‐12
Apr‐12
Jul‐1
2Oct‐12
Jan‐13
Apr‐13
Jul‐1
3Oct‐13
Jan‐14
Apr‐14
Jul‐1
4Oct‐14
Jan‐15
CVIX Index5
10
15
20
25
30
Mar‐10
Jun‐10
Sep‐10
Dec‐10
Mar‐11
Jun‐11
Sep‐11
Dec‐11
Mar‐12
Jun‐12
Sep‐12
Dec‐12
Mar‐13
Jun‐13
Sep‐13
Dec‐13
Mar‐14
Jun‐14
Sep‐14
Dec‐14
Mar‐15
ML Commodity 3‐Month Vol
March 31, 2015
Ventura County Employees’ Retirement Association
59
MASTER PAGE NO. 356

Major central bank policy divergence Fed’s ideal rate of policy firming above market expectations
Many developed central banks have maintained low interest rates
EM central bank policies have varied by circumstance
Central Banks
Source: Bloomberg, Federal Reserve, Bank of Japan, ECB, NEPC Source: Bloomberg, Federal Reserve, NEPC
Source: BloombergSource: Bloomberg
$0.00$0.50$1.00$1.50$2.00$2.50$3.00$3.50$4.00$4.50$5.00
2007 2008 2009 2010 2011 2012 2013 2014
Trillions (b
alan
ce she
et assets) FED
ECB
BoJ
‐0.5%0.0%0.5%1.0%1.5%2.0%2.5%3.0%3.5%4.0%4.5%5.0%
2014 2015 2016 2017 2018 2019 2020
FOMC ParticipantsFOMC MedianFed Funds Futures
Long Term
‐1.0% 0.0% 1.0% 2.0% 3.0% 4.0%
AustraliaCanada
ECBJapan
New ZealandNorway
SingaporeSwitzerland
UKUS
Target central bank rate
1 Yr Previous
Current
0.0% 2.0% 4.0% 6.0% 8.0% 10.0% 12.0% 14.0% 16.0%
BrazilChinaIndia
IndonesiaMalaysiaMexicoPolandRussia
South AfricaSouth Korea
Turkey
Target central bank rate
1 Yr Previous
Current
March 31, 2015
Ventura County Employees’ Retirement Association
60
MASTER PAGE NO. 357

Global valuations are mixed Earnings growth trending lower in the U.S.
Margins elevated, but largely a U.S. story Significant global variance in returns
Global Equity
Source: Bloomberg, Standard and Poors, MSCI *MSCI EAFE is ex UK Telecom Source: Bloomberg, Standard and Poors, MSCI
Source: Bloomberg, MSCISource: Bloomberg, MSCI
0
5
10
15
20
25
30
35
40
MSCI ACWI MSCI EAFE MSCI EM S&P 500
PE Ratio
+1 Std Dev ‐1 St Dev3/31/2014 3/31/2015
‐40%
‐30%
‐20%
‐10%
0%
10%
20%
30%
40%
Apr‐05
Dec‐05
Aug‐06
Apr‐07
Dec‐07
Aug‐08
Apr‐09
Dec‐09
Aug‐10
Apr‐11
Dec‐11
Aug‐12
Apr‐13
Dec‐13
Aug‐14
Rolling
12‐Mo Ch
ange
in EBIT
S&P 500MSCI EAFEMSCI EM
0%
2%
4%
6%
8%
10%
12%
14%
1995
1996
1997
1998
1999
2000
2001
2002
2003
2004
2005
2006
2007
2008
2009
2010
2011
2012
2013
2014
2015
Profit Margins
MSCI ACWIMSCI EAFEMSCI EM
‐2%
‐1%
0%
1%
2%
3%
4%
5%
6%
MSCI ACWI MSCI ACWI IMI MSCI EAFE MSCI EM
3 Month Return
1 Yr Return
March 31, 2015
Ventura County Employees’ Retirement Association
61
MASTER PAGE NO. 358

Valuations above historical norms Solid growth recovery
Profit margins remain elevated Trailing performance is positive
U.S. Equity
Source: Bloomberg, Standard and Poors, Russell *Russell 2000 PE is index adjusted positive Source: Bloomberg, Bureau of Economic Analysis
Source: Bloomberg, Standard and Poors, RussellSource: Bloomberg, Standard and Poors, Russell
0
5
10
15
20
25
30
35
40
S&P 500 Russell 2500 Russell 2000 Russell 1000Growth
Russell 1000Value
PE Ratio
+1 Std Dev ‐1 St Dev3/31/2014 3/31/2015
‐10%
‐8%
‐6%
‐4%
‐2%
0%
2%
4%
6%
20142013201220112010200920082007200620052004
US Real GDP Growth
‐8%‐6%‐4%‐2%0%2%4%6%8%
10%12%
1991
1993
1995
1997
1999
2001
2003
2005
2007
2009
2011
2013
2015
Profit Margins
S&P 500Russell 2000
‐2%0%2%4%6%8%
10%12%14%16%18%
SP 500 Russell 2500 Russell 2000 Russell 1000Growth
Russell 1000Value
3 Month Return
1 Yr Return
March 31, 2015
Ventura County Employees’ Retirement Association
62
MASTER PAGE NO. 359

PEs near or below historical medians Growth dispersion pronounced
Margins elevated but not at extremes Positive performance muted by dollar strength
International Equity
Source: Bloomberg, MSCI, FTSE *UK represented by FTSE 100 Index Source: Bloomberg
Source: Bloomberg, MSCISource: Bloomberg, MSCI
0
5
10
15
20
25
30
35
40
45
Europe Japan United Kingdom
PE Ratio
+1 Std Dev ‐1 St Dev3/31/2014 3/31/2015
‐15%
‐10%
‐5%
0%
5%
10%
15%
20142013201220112010200920082007200620052004
Eurozone
Japan
UK
0%1%2%3%4%5%6%7%8%9%
10%
Profit Margins
MSCI EAFE
‐5%
0%
5%
10%
15%
20%
MSCI EAFE EAFE (Local) EAFE Small Cap EAFE SC (Local)
3 Month Return1 Yr Return
March 31, 2015
Ventura County Employees’ Retirement Association
63
MASTER PAGE NO. 360

Regional valuations show divergence Slowing growth in major economies
Profit margins in line with history Dollar strength has detracted
Emerging Markets Equity
Source: Bloomberg, MSCI Source: Bloomberg
Source: Bloomberg, MSCISource: Bloomberg, MSCI
0
5
10
15
20
25
China Brazil South Africa India Russia South Korea
PE Ratio
+1 Std Dev ‐1 St Dev3/31/2014 3/31/2015
‐15%
‐10%
‐5%
0%
5%
10%
15%
20142013201220112010200920082007200620052004
Brazil RussiaIndia China
0%
2%
4%
6%
8%
10%
12%
14%
Profit Margins
MSCI EM‐15%
‐10%
‐5%
0%
5%
10%
15%
20%
25%
MSCI EM EM (Local) EM SmallCap
EM SC(Local)
Frontier
3 Month Return1 Yr Return
March 31, 2015
Ventura County Employees’ Retirement Association
64
MASTER PAGE NO. 361

MSCI ACWI returns led by health care rally S&P 500 sectors nearly all positive
Energy decline especially felt in MSCI EM Global energy sector weight has fallen
Global Equity by Sector
Source: Bloomberg, MSCI Source: Bloomberg, Standard and Poors
Source: Bloomberg, MSCISource: Bloomberg, MSCI
‐20%‐15%‐10%‐5%0%5%
10%15%20%25%
3‐Mo Return1 Yr Return
‐15%‐10%‐5%0%5%
10%15%20%25%30%
3‐Mo Return1 Yr Return
‐30%
‐20%
‐10%
0%
10%
20%
30%
3‐Mo Return1 Yr Return
0%
5%
10%
15%
20%
25%
Sector W
eigh
t of A
CWI
3/31/2015
3/31/2014
March 31, 2015
Ventura County Employees’ Retirement Association
65
MASTER PAGE NO. 362

Developed currencies broadly declined versus the U.S. dollar
EM currencies have suffered in unique fashions
Yen and GBP expect to decline versus USD Recent dollar strength pronounced
Currencies
Source: Bloomberg Source: Bloomberg
Source: Bloomberg, Federal ReserveSource: Bloomberg
60
70
80
90
100
110
120
1990
1991
1992
1993
1994
1995
1996
1997
1998
1999
2000
2001
2002
2003
2004
2005
2006
2007
2008
2009
2010
2011
2012
2013
2014
USD Trade Weighted Index
‐25%
‐20%
‐15%
‐10%
‐5%
0%
5%
JapaneseYen
PoundSterling
Euro SwissFranc
CanadianDollar
AustralianDollar
3 Month Spot Change1 Yr Spot Change
‐40%‐35%‐30%‐25%‐20%‐15%‐10%‐5%0%5%
3 Month Spot Change1 Yr Spot Change
‐2.0%
‐1.0%
0.0%
1.0%
2.0%
3.0%
4.0%
Euro Yen BritishPound
SwissFranc
Aus Dollar Yuan(O/S)
Chan
ge versus U
SD
3M Currency Fwd12M Currency Fwd
March 31, 2015
Ventura County Employees’ Retirement Association
66
MASTER PAGE NO. 363

Spreads in line or above history Yields have mostly declined
Similar yield/duration tradeoff among major U.S. indices Trailing returns have been strong
U.S. Fixed Income
Source: Bloomberg, Barclays Source: Bloomberg, Barclays
Source: Bloomberg, BarclaysSource: Bloomberg, Barclays
0
200
400
600
800
1000
1200
1400
1600
1800
Aaa Aa A Baa Ba B Caa
Spread
(bps)
+2 Std Dev+1 Std Dev‐1 St Dev3/31/20143/31/2015
0%1%2%3%4%5%6%7%
Month End Yield3‐Mo Previous Yield
0%
1%
2%
3%
4%
5%
6%
7%
0 1 2 3 4 5 6 7 8
Yield
Duration
BC AggBC US TreasuryBC CreditBC MBSBC High YieldBC MunicipalBC TIPS
0%1%2%3%4%5%6%7%8%
3 Month Return1 Yr Return
March 31, 2015
Ventura County Employees’ Retirement Association
67
MASTER PAGE NO. 364
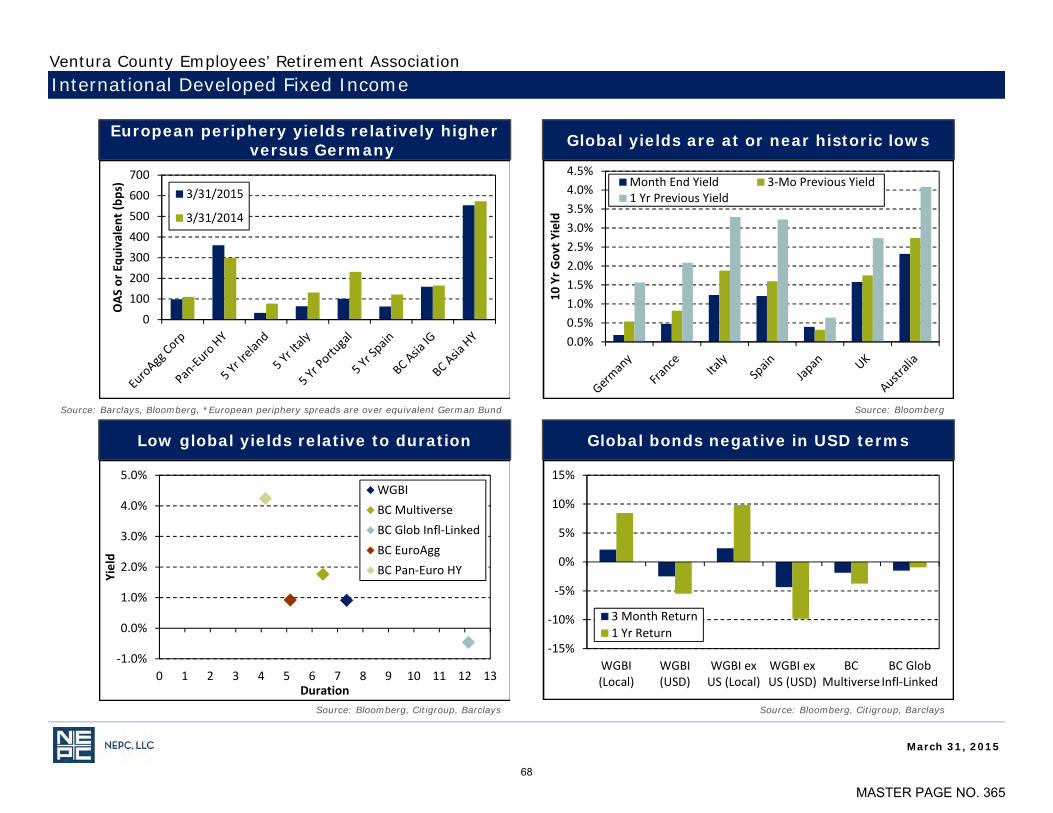
European periphery yields relatively higher versus Germany Global yields are at or near historic lows
Low global yields relative to duration Global bonds negative in USD terms
International Developed Fixed Income
Source: Barclays, Bloomberg, *European periphery spreads are over equivalent German Bund Source: Bloomberg
Source: Bloomberg, Citigroup, BarclaysSource: Bloomberg, Citigroup, Barclays
0
100
200
300400
500
600
700
OAS
or E
quivalen
t (bp
s) 3/31/2015
3/31/2014
0.0%0.5%1.0%1.5%2.0%2.5%3.0%3.5%4.0%4.5%
10 Yr G
ovt Y
ield
Month End Yield 3‐Mo Previous Yield1 Yr Previous Yield
‐1.0%
0.0%
1.0%
2.0%
3.0%
4.0%
5.0%
0 1 2 3 4 5 6 7 8 9 10 11 12 13
Yield
Duration
WGBIBC MultiverseBC Glob Infl‐LinkedBC EuroAggBC Pan‐Euro HY
‐15%
‐10%
‐5%
0%
5%
10%
15%
WGBI(Local)
WGBI(USD)
WGBI exUS (Local)
WGBI exUS (USD)
BCMultiverse
BC GlobInfl‐Linked
3 Month Return1 Yr Return
March 31, 2015
Ventura County Employees’ Retirement Association
68
MASTER PAGE NO. 365

Spreads have risen but still in line with history
Emerging market bond yield changes have varied directionally
EM yields higher versus global counterparts Currency effect pronounced in EMD returns
Emerging Markets Fixed Income
Source: Bloomberg, JP Morgan Source: Bloomberg
Source: Bloomberg, JP MorganSource: Bloomberg, JP Morgan
0
200
400
600
800
1000
1200
1400Mar‐05
Nov‐05
Jul‐0
6
Mar‐07
Nov‐07
Jul‐0
8
Mar‐09
Nov‐09
Jul‐1
0
Mar‐11
Nov‐11
Jul‐1
2
Mar‐13
Nov‐13
Jul‐1
4
Mar‐15
Spread
in bps
EMBI Glob Div EMBI Glob Div IGEMBI Glob Div HY CEMBI Div Broad IGCEMBI Div Broad HY
0%
2%
4%
6%
8%
10%
12%
14%
10 Yr L
ocal Gov
t Yield
Month End Yield3‐Mo Previous Yield1 Yr Previous Yield
0%
2%
4%
6%
8%
10%
12%
0 1 2 3 4 5 6 7 8
Yield
Duration
JPM EMBI CompositeJPM GBI‐EM Glob DivCEMBI IGCEMBI HYEMBI HYEMBI IG ‐12%
‐10%‐8%‐6%‐4%‐2%0%2%4%6%8%
JPM EMBIGlob Div
JPM GBI‐EMGlob Div
CEMBI IG CEMBI HY ELMI+ Comp
3 Month Return1 Yr Return
March 31, 2015
Ventura County Employees’ Retirement Association
69
MASTER PAGE NO. 366

Treasury yields lower but some steepness remains
Significant compression in German Bund curve
Global yield curves have flattened Global yields trending lower
Rates
Source: Bloomberg Source: Bloomberg
Source: BloombergSource: Bloomberg
0.0%
0.5%
1.0%
1.5%
2.0%
2.5%
3.0%
3.5%
4.0%
1Y 3Y 5Y 7Y 10Y
15Y
20Y
25Y
30Y
3/31/2015
12/31/2014
3/29/2013
3/30/2012‐0.5%0.0%0.5%1.0%1.5%2.0%2.5%3.0%3.5%4.0%
1Y 3Y 5Y 7Y 10Y
15Y
20Y
25Y
30Y
UK Month End UK 3M PreviousJapan Month End Japan 3M PreviousGerm Month End Germ 3M Previous
‐1.0%
‐0.5%
0.0%
0.5%
1.0%
1.5%
2.0%
2.5%
3.0%
2000
2001
2002
2003
2004
2005
2006
2007
2008
2009
2010
2011
2012
2013
2014
US 10 Yr ‐ 2 YrJapan 10 Yr ‐ 2 YrGermany 10 Yr ‐ 2 Yr
‐1%0%1%2%3%4%5%6%7%8%
1995
1996
1997
1998
1999
2000
2001
2002
2003
2004
2005
2006
2007
2008
2009
2010
2011
2012
2013
2014
Japan 10 YrJapan 2 YrGermany 10 YrGermany 2 Year
March 31, 2015
Ventura County Employees’ Retirement Association
70
MASTER PAGE NO. 367

Long duration yields have fallen over last few years
Lower yields driven by fall in inflation expectations
Yields are low but spreads remain near historic averages Long duration assets have outperformed
Long Rates and Liability
Source: Bloomberg, Citigroup, Barclays Source: Bloomberg, US Treasury, Barclays, NEPC
Source: Bloomberg, BarclaysSource: Bloomberg, BofA Merrill Lynch, Barclays *No index for 20+ year corporate
1%
2%
3%
4%
5%
6%
7%
Dec‐09
Apr‐10
Aug‐10
Dec‐10
Apr‐11
Aug‐11
Dec‐11
Apr‐12
Aug‐12
Dec‐12
Apr‐13
Aug‐13
Dec‐13
Apr‐14
Aug‐14
Dec‐14
Citigroup Pension Liability IndexBC Long CreditBC 20‐30 Yr STRIPS
‐1%0%1%2%3%4%5%6%7%8%9%
10%
Long
credit y
ield (b
y compo
nent) Spread (BC Long Cred OAS)
Inflation (LT Yield ‐ LT Real Yield)Real Rate (LT Real Yield)
0.0%0.5%1.0%1.5%2.0%2.5%3.0%3.5%4.0%4.5%5.0%
0‐5 Years 5‐10 Years 10‐15 Years 15+ Years 20+ Years
US Corp Spread
US Gov't Yield
0%
5%
10%
15%
20%
25%
30%
35%
40%
20‐30 YrSTRIPS
US AggLong Treas
US LongCredit
US LongGovt/Credit
US LongCredit A+
Long CorpA+
3‐Month Return
1 Year Return
March 31, 2015
Ventura County Employees’ Retirement Association
71
MASTER PAGE NO. 368
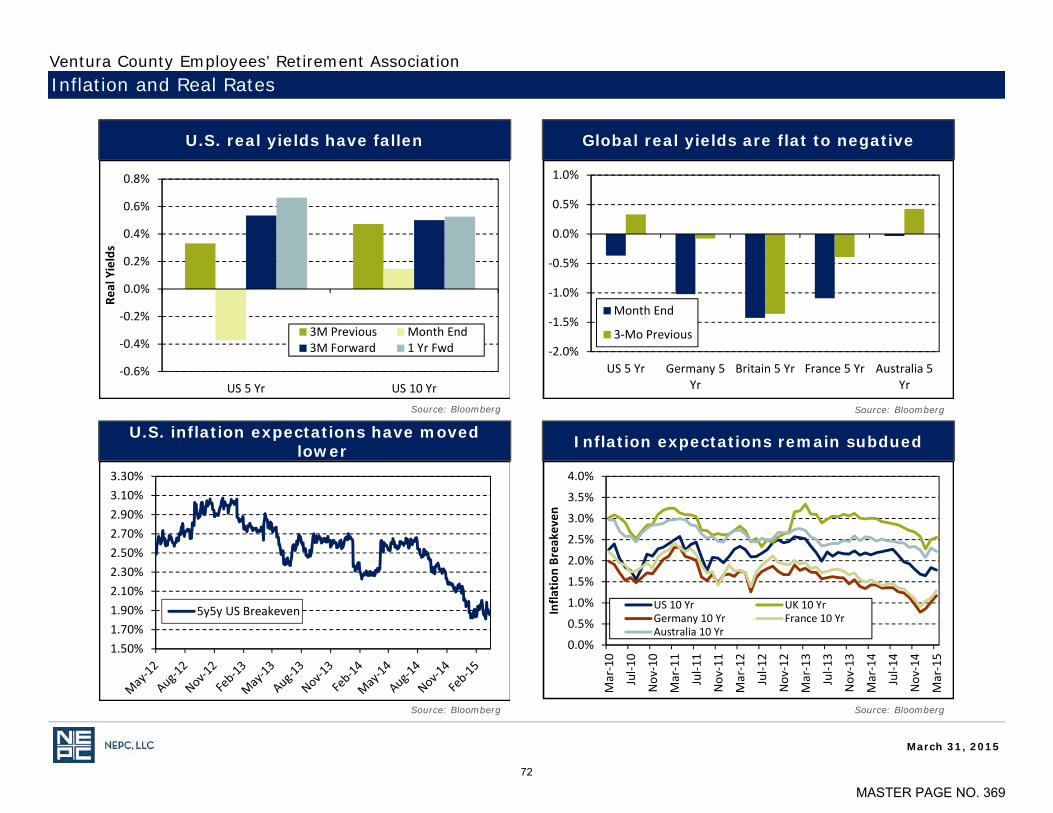
U.S. real yields have fallen Global real yields are flat to negative
U.S. inflation expectations have moved lower Inflation expectations remain subdued
Inflation and Real Rates
Source: Bloomberg Source: Bloomberg
Source: BloombergSource: Bloomberg
‐0.6%
‐0.4%
‐0.2%
0.0%
0.2%
0.4%
0.6%
0.8%
US 5 Yr US 10 Yr
Real Yields
3M Previous Month End3M Forward 1 Yr Fwd ‐2.0%
‐1.5%
‐1.0%
‐0.5%
0.0%
0.5%
1.0%
US 5 Yr Germany 5Yr
Britain 5 Yr France 5 Yr Australia 5Yr
Month End
3‐Mo Previous
1.50%1.70%1.90%2.10%2.30%2.50%2.70%2.90%3.10%3.30%
5y5y US Breakeven
0.0%
0.5%
1.0%
1.5%
2.0%
2.5%
3.0%
3.5%
4.0%
Mar‐10
Jul‐1
0
Nov
‐10
Mar‐11
Jul‐1
1
Nov
‐11
Mar‐12
Jul‐1
2
Nov
‐12
Mar‐13
Jul‐1
3
Nov
‐13
Mar‐14
Jul‐1
4
Nov
‐14
Mar‐15
Infla
tion Breakeven
US 10 Yr UK 10 YrGermany 10 Yr France 10 YrAustralia 10 Yr
March 31, 2015
Ventura County Employees’ Retirement Association
72
MASTER PAGE NO. 369

Yields at similar levels relative to last year Slow recovery in occupancy rates
PE Ratios near or above averages REITs have rallied globally
Inflation Sensitive Growth Assets
0
500
1000
1500
2000
2500
1985
1986
1988
1990
1992
1994
1996
1997
1999
2001
2003
2005
2007
2008
2010
2012
2014
Thou
sand
s
US Housing Starts SA
Source: Bloomberg, Alerian, Nareit, Standard and Poors Source: Bloomberg, CB Richard Ellis
Source: Bloomberg, US Census Bureau Source: Bloomberg, Alerian, Nareit, Standard and Poors
0%
1%
2%
3%
4%
5%
6%
7%
Alerian MLP NAREIT Global NAREIT US S&P Glob NatRes
Dividen
d Yield
Month End Yield
1 Yr Previous Yield
75%
80%
85%
90%
95%
100%
2000
2001
2002
2003
2004
2005
2006
2007
2008
2009
2010
2011
2012
2013
2014
US Occup
ancy Rate
Office IndustrialRetail Multi‐Family
0
5
10
15
20
25
30
PE Ratio
Alerian MLPNAREIT GlobalNAREIT USS&P Glob Nat Res
‐15%‐10%‐5%0%5%
10%15%20%25%30%
Alerian MLP NAREIT Glob NAREIT US NCREIFProperty
S&P GlobNat Res
3 Mo Return1 Yr Return
March 31, 2015
Ventura County Employees’ Retirement Association
73
MASTER PAGE NO. 370

Contango in major energy commodities Precipitous fall in oil prices
U.S. fuel production closing gap with consumption
Commodity indices dragged lower by falling energy prices
Commodities
Source: Bloomberg Source: Bloomberg
Source: Bloomberg, Standard and PoorsSource: Bloomberg, US Department of Energy *Crude oil and liquid fuels
‐6% ‐5% ‐4% ‐3% ‐2% ‐1% 0%
Aluminum
Copper
Corn
Gold
Natural Gas
Oil
Soybeans
3‐Mo Future Roll Yield
0200400600800100012001400160018002000
0
20
40
60
80
100
120
140
160
1999
2000
2001
2002
2003
2004
2005
2006
2007
2008
2009
2010
2011
2012
2013
2014
$/Troy
Oun
ce
$/Ba
rrel
Crude Oil Spot (LHS)Gold Spot (RHS)
75
80
85
90
95
100
0
5
10
15
20
25
US ProductionUS ConsumptionWorld Production (RHS)World Consumption (RHS)
Crude oil and liquid fuels
‐45%‐40%‐35%‐30%‐25%‐20%‐15%‐10%‐5%0%
BloombergCommodity
GSCI GSCI Non‐Energy
3‐Month Return
1 Yr Return
March 31, 2015
Ventura County Employees’ Retirement Association
74
MASTER PAGE NO. 371

• The client’s custodian bank is NEPC’s preferred data source unless otherwise directed. NEPC reconciles custodian data to manager data. If the custodian cannot provide accurate data, manager data may be used.
• Trailing time period returns are determined by geometrically linking the holding period returns from the first full month after inception to the report date. Rates of return are annualized when the time period is longer than a year. Performance is presented gross and/or net of fees as indicated.
• For managers funded in the middle of a month, the ‘since inception’ return will start with the first full month, although actual inception dates and cash flows are included in all respective Composite calculations.
• This report may contain forward-looking statements that are based on NEPC’s estimates, opinions and beliefs, but NEPC cannot guarantee that any plan will achieve its targeted return or meet other goals.
Reporting Methodology
March 31, 2015
Ventura County Employees’ Retirement Association
75
MASTER PAGE NO. 372
• Past performance is no guarantee of future results.
• All investments carry some level of risk. Diversification and other asset allocation techniques are not guaranteed to ensure profit or protect against losses.
• Some index returns displayed in this report or used in calculation of a policy, allocation or custom benchmark may not be available from the source or may be preliminary and subject to change.
• NEPC’s source for portfolio pricing, calculation of accruals, and transaction information is the Plan’s custodian bank. Information on market indices and security characteristics is received from other sources external to NEPC. While NEPC has exercised reasonable professional care in preparing this report, we cannot guarantee the accuracy of all source information contained herein.
• This report is provided as a management aid for the client’s internal use only. Performance in this report does not constitute a recommendation by NEPC.
• This report may contain confidential or proprietary information and may not be copied or redistributed to any party not legally entitled to receive it.
Information Disclaimer
March 31, 2015
Ventura County Employees’ Retirement Association
76
MASTER PAGE NO. 373

Ventura County Employees'Retirement AssociationPreliminary Performance ReportMonth Ending April 30, 2015
Daniel LeBeau, ConsultantAllan Martin, Partner,Anthony Ferrara, CAIA, Senior Analyst
MASTER PAGE NO. 374

April 30, 2015
Policy Index: Uses an estimated CPI+4% index due to CPI monthly lag
Policy Index: Currently, 30% Total U.S. Equity Benchmark, 19% Barclays Aggregate, 14% MSCI ACWI ex U.S., 10% MSCI ACWI, 5% Barclays Global Aggregate, 5% DJ U.S.Total Stock Market Index + 3%, 10% CPI+4% Index, and 7% NCREIF ODCE Real Estate Index
Total U.S. Equity Benchmark: The Benchmark is a dynamic hybrid using the respective managers' market value weights within the U.S. Equity component toward theirbenchmark. Prior to May 2013, the Dow Jones U.S. Total Stock Market Index. Prior to May 2007, the Russell 3000 Index
CPI+4% is estimated for latest month.
Ventura County Employees’ Retirement AssociationTotal Fund Performance Detail Net of Fees
Performance Summary
Market Value($)
% ofPortfolio Policy % 1 Mo
(%)3 Mo
(%)YTD(%)
FiscalYTD(%)
1 Yr(%)
3 Yrs(%)
5 Yrs(%)
10 Yrs(%)
Return(%) Since
_
Total Fund 4,420,136,052 100.0 100.0 1.5 4.2 3.5 3.4 7.0 10.9 10.1 7.1 8.3 Apr-94Policy Index 1.2 4.1 3.3 4.4 7.8 10.7 9.7 7.1 8.3 Apr-94
Over/Under 0.3 0.1 0.2 -1.0 -0.8 0.2 0.4 0.0 0.0 Allocation Index 1.3 4.4 3.2 3.8 7.6 10.1 9.2 6.8 -- Apr-94Total Fund ex Parametric 4,395,593,694 99.4 -- 1.5 4.2 3.5 3.4 6.9 10.8 10.0 7.0 8.3 Apr-94Total Fund ex Private Equity 4,294,795,809 97.2 -- 1.6 4.3 3.5 3.2 6.8 10.0 -- -- 11.7 Jan-12
Policy Index 1.2 4.1 3.3 4.4 7.8 10.7 9.7 7.1 12.1 Jan-12Over/Under 0.4 0.2 0.2 -1.2 -1.0 -0.7 -0.4
Total US Equity 1,366,926,426 30.9 30.0 0.4 5.2 2.3 7.6 12.7 17.1 14.6 8.3 9.1 Dec-93Total U.S. Equity Benchmark 0.4 5.2 2.3 7.5 12.7 16.8 14.4 8.8 9.5 Dec-93
Over/Under 0.0 0.0 0.0 0.1 0.0 0.3 0.2 -0.5 -0.4 BlackRock Equity Market Fund 1,176,421,813 26.6 0.5 5.2 2.3 7.6 12.7 16.8 14.4 -- 7.6 Dec-07
Dow Jones U.S. Total Stock Market 0.5 5.2 2.3 7.5 12.7 16.8 14.4 8.8 7.6 Dec-07Over/Under 0.0 0.0 0.0 0.1 0.0 0.0 0.0 0.0
Western U.S. Index Plus 142,183,693 3.2 1.0 5.2 2.2 8.3 13.2 18.0 15.8 -- 3.7 May-07S&P 500 1.0 5.1 1.9 8.2 13.0 16.7 14.3 8.3 6.2 May-07
Over/Under 0.0 0.1 0.3 0.1 0.2 1.3 1.5 -2.5 BlackRock Extended Equity Index 48,320,920 1.1 -1.5 5.7 3.7 5.1 11.4 17.1 14.6 10.5 12.5 Oct-02
Dow Jones U.S. Completion Total Stock Market -1.5 5.7 3.7 5.1 11.4 16.9 14.3 10.5 12.5 Oct-02Over/Under 0.0 0.0 0.0 0.0 0.0 0.2 0.3 0.0 0.0
2 MASTER PAGE NO. 375

April 30, 2015
Total Non-U.S. Equity Benchmark: MSCI ACWI ex US Free, prior to May 2002, the MSCI EAFE
Ventura County Employees’ Retirement AssociationTotal Fund Performance Detail Net of Fees
Market Value($)
% ofPortfolio Policy % 1 Mo
(%)3 Mo
(%)YTD(%)
FiscalYTD(%)
1 Yr(%)
3 Yrs(%)
5 Yrs(%)
10 Yrs(%)
Return(%) Since
_
Total Non-US Equity 646,795,221 14.6 14.0 4.8 8.1 8.0 -1.0 2.1 8.9 6.5 6.3 6.8 Mar-94Total Non-US Equity Benchmark 5.1 8.9 8.7 -1.0 2.6 8.7 6.0 6.3 5.6 Mar-94
Over/Under -0.3 -0.8 -0.7 0.0 -0.5 0.2 0.5 0.0 1.2 BlackRock ACWI ex-U.S. Index 271,639,019 6.1 5.2 9.2 9.0 -0.9 2.8 9.0 6.4 -- 2.4 Mar-07
MSCI ACWI ex USA 5.1 8.9 8.7 -1.0 2.6 8.7 6.0 6.3 2.0 Mar-07Over/Under 0.1 0.3 0.3 0.1 0.2 0.3 0.4 0.4
Sprucegrove 192,283,160 4.4 4.4 6.8 6.5 -2.7 -0.6 8.5 7.1 6.5 8.3 Mar-02MSCI EAFE 4.1 8.6 9.2 -0.9 1.7 11.2 7.4 5.6 6.7 Mar-02
Over/Under 0.3 -1.8 -2.7 -1.8 -2.3 -2.7 -0.3 0.9 1.6 MSCI ACWI ex USA 5.1 8.9 8.7 -1.0 2.6 8.7 6.0 6.3 7.4 Mar-02
Hexavest 83,515,718 1.9 3.9 7.5 7.7 -0.6 2.2 9.5 -- -- 5.7 Dec-10MSCI EAFE 4.1 8.6 9.2 -0.9 1.7 11.2 7.4 5.6 6.5 Dec-10
Over/Under -0.2 -1.1 -1.5 0.3 0.5 -1.7 -0.8 Walter Scott 99,357,324 2.2 5.0 8.5 8.6 2.3 5.6 8.0 -- -- 5.9 Dec-10
MSCI ACWI ex USA 5.1 8.9 8.7 -1.0 2.6 8.7 6.0 6.3 4.6 Dec-10Over/Under -0.1 -0.4 -0.1 3.3 3.0 -0.7 1.3
Total Global Equity 456,654,608 10.3 10.0 3.6 7.4 6.1 1.3 4.9 11.5 9.8 6.0 6.0 May-05MSCI ACWI 2.9 6.9 5.3 3.3 7.5 12.2 9.6 7.0 7.0 May-05
Over/Under 0.7 0.5 0.8 -2.0 -2.6 -0.7 0.2 -1.0 -1.0 BlackRock MSCI ACWI Equity Index 234,496,168 5.3 2.9 7.1 5.4 3.6 7.9 -- -- -- -- May-12
MSCI ACWI 2.9 6.9 5.3 3.3 7.5 12.2 9.6 7.0 16.3 May-12Over/Under 0.0 0.2 0.1 0.3 0.4
GMO Global Equity 222,158,441 5.0 4.2 7.8 6.9 -1.0 2.0 10.9 9.5 7.1 7.1 Apr-05MSCI ACWI 2.9 6.9 5.3 3.3 7.5 12.2 9.6 7.0 7.0 Apr-05
Over/Under 1.3 0.9 1.6 -4.3 -5.5 -1.3 -0.1 0.1 0.1
3 MASTER PAGE NO. 376

April 30, 2015
Reams Custom Index: Merrill Lynch 3 Month Libor Constant Maturity Index, prior to February 2013 the Barclays Aggregate Loomis Custom Index: 65% Barclays Aggregate, 30% Citigroup High Yield Market Index and 5% JPM Non-US Hedged Bond Index Loomis Sayles Multi Strategy is Preliminary
Ventura County Employees’ Retirement AssociationTotal Fund Performance Detail Net of Fees
Market Value($)
% ofPortfolio Policy % 1 Mo
(%)3 Mo
(%)YTD(%)
FiscalYTD(%)
1 Yr(%)
3 Yrs(%)
5 Yrs(%)
10 Yrs(%)
Return(%) Since
_
Total US Fixed Income 771,474,315 17.5 19.0 0.5 0.8 1.5 1.5 2.4 3.3 5.3 6.0 6.3 Feb-94Barclays Aggregate -0.4 -0.8 1.2 3.2 4.5 2.6 4.1 4.7 5.8 Feb-94
Over/Under 0.9 1.6 0.3 -1.7 -2.1 0.7 1.2 1.3 0.5BlackRock U.S. Debt Fund 141,095,962 3.2 -0.3 -0.8 1.3 3.4 4.7 2.7 4.2 4.8 5.7 Nov-95
Barclays Aggregate -0.4 -0.8 1.2 3.2 4.5 2.6 4.1 4.7 5.6 Nov-95Over/Under 0.1 0.0 0.1 0.2 0.2 0.1 0.1 0.1 0.1
Western 271,939,127 6.2 -0.1 -0.3 2.0 3.7 5.4 4.6 6.1 5.6 6.6 Dec-96Barclays Aggregate -0.4 -0.8 1.2 3.2 4.5 2.6 4.1 4.7 5.7 Dec-96
Over/Under 0.3 0.5 0.8 0.5 0.9 2.0 2.0 0.9 0.9Reams 284,645,415 6.4 1.5 2.4 0.8 -1.6 -2.2 1.6 4.5 6.1 5.9 Sep-01
Reams Custom Index 0.0 0.1 0.1 0.2 0.2 0.9 3.1 4.2 4.5 Sep-01Over/Under 1.5 2.3 0.7 -1.8 -2.4 0.7 1.4 1.9 1.4
Barclays Aggregate -0.4 -0.8 1.2 3.2 4.5 2.6 4.1 4.7 4.9 Sep-01Loomis Sayles Multi Strategy 73,793,811 1.7 0.6 1.4 2.7 2.0 4.6 6.7 7.5 -- 7.3 Jul-05
Loomis Custom Index 0.2 0.4 2.0 2.3 3.7 4.0 5.3 -- 5.7 Jul-05Over/Under 0.4 1.0 0.7 -0.3 0.9 2.7 2.2 1.6
Barclays Aggregate -0.4 -0.8 1.2 3.2 4.5 2.6 4.1 4.7 4.8 Jul-05Total Global Fixed Income 260,264,261 5.9 5.0 0.8 -0.4 0.0 -2.9 -1.5 -- -- -- 0.9 Jun-12
Barclays Global Aggregate 1.1 -0.7 -0.9 -5.0 -3.7 -0.2 2.5 3.6 -0.1 Jun-12Over/Under -0.3 0.3 0.9 2.1 2.2 1.0
Loomis Sayles Global Fixed Income 91,531,091 2.1 1.1 -0.5 -0.8 -5.1 -3.8 -- -- -- 0.4 Jun-12Barclays Global Aggregate 1.1 -0.7 -0.9 -5.0 -3.7 -0.2 2.5 3.6 -0.1 Jun-12
Over/Under 0.0 0.2 0.1 -0.1 -0.1 0.5PIMCO Global Fixed Income 125,925,604 2.8 0.7 -0.8 0.0 -2.9 -1.4 -- -- -- -0.7 Sep-12
Barclays Global Aggregate 1.1 -0.7 -0.9 -5.0 -3.7 -0.2 2.5 3.6 -1.3 Sep-12Over/Under -0.4 -0.1 0.9 2.1 2.3 0.6
Loomis Strategic Alpha 42,807,565 1.0 0.2 1.0 1.8 2.2 3.3 -- -- -- 3.2 Jul-13Barclays Global Aggregate 1.1 -0.7 -0.9 -5.0 -3.7 -0.2 2.5 3.6 0.4 Jul-13
Over/Under -0.9 1.7 2.7 7.2 7.0 2.8
4 MASTER PAGE NO. 377

Market Value($)
% ofPortfolio Policy % 1 Mo
(%)3 Mo
(%)YTD(%)
FiscalYTD(%)
1 Yr(%)
3 Yrs(%)
5 Yrs(%)
10 Yrs(%)
Return(%) Since
_
Total Real Estate 330,958,239 7.5 7.0 0.0 2.9 2.9 9.3 12.3 10.5 12.7 5.0 7.8 Mar-94Total Real Estate Benchmark 0.0 3.4 3.4 10.2 13.4 12.7 14.5 7.0 8.9 Mar-94
Over/Under 0.0 -0.5 -0.5 -0.9 -1.1 -2.2 -1.8 -2.0 -1.1Prudential Real Estate 111,362,490 2.5 0.0 3.2 3.2 10.4 13.8 11.8 14.9 5.9 5.3 Jun-04
NCREIF-ODCE 0.0 3.4 3.4 10.2 13.4 12.7 14.5 7.0 7.5 Jun-04Over/Under 0.0 -0.2 -0.2 0.2 0.4 -0.9 0.4 -1.1 -2.2
UBS Real Estate 213,926,049 4.8 0.0 2.7 2.7 8.7 11.1 9.6 11.6 6.4 7.4 Mar-03NCREIF-ODCE 0.0 3.4 3.4 10.2 13.4 12.7 14.5 7.0 7.8 Mar-03
Over/Under 0.0 -0.7 -0.7 -1.5 -2.3 -3.1 -2.9 -0.6 -0.4RREEF 5,669,699 0.1 0.0 2.3 2.3 9.7 24.0 21.0 26.7 -- -6.0 Sep-07
NCREIF-ODCE 0.0 3.4 3.4 10.2 13.4 12.7 14.5 7.0 3.3 Sep-07Over/Under 0.0 -1.1 -1.1 -0.5 10.6 8.3 12.2 -9.3
Total Liquid Alternatives 437,180,381 9.9 10.0 2.9 3.7 4.6 0.3 7.0 -- -- -- 13.1 Apr-13CPI + 4% (Unadjusted) 0.9 2.6 2.5 3.0 4.2 5.1 5.8 6.1 5.1 Apr-13
Over/Under 2.0 1.1 2.1 -2.7 2.8 8.0Bridgewater All Weather Fund 288,487,422 6.5 1.4 2.3 5.2 3.3 7.2 -- -- -- 9.9 Aug-13
CPI + 5% (Unadjusted) 1.0 2.9 2.8 3.8 5.2 -- -- -- 6.0 Aug-13Over/Under 0.4 -0.6 2.4 -0.5 2.0 3.9
Tortoise Energy Infrastructure 148,692,959 3.4 5.8 6.6 3.5 -5.2 6.6 -- -- -- 16.0 Apr-13Wells Fargo MLP Index 4.3 3.8 0.5 -9.5 -0.2 11.6 -- -- 6.4 Apr-13
Over/Under 1.5 2.8 3.0 4.3 6.8 9.6Overlay 24,542,358 0.6 0.0
Parametric 24,542,358 0.6
April 30, 2015
Total Real Estate Benchmark: NCREIF ODCE; prior to January 2006, the NCREIF Property IndexReal Estate managers and NCREIF ODCE are valued on a quarterly basis. Performance is not applicable in mid-quarter months, therefore 0% return is shown. Total Liquid Alternatives index, the CPI+4% is estimated by carrying the last available month forwardCPI+5% and CPI+4% are estimated by carrying the last available month forwardReal Estate Valuation is as of 3/31/2015
Ventura County Employees’ Retirement AssociationTotal Fund Performance Detail Net of Fees
5 MASTER PAGE NO. 378

April 30, 2015
Please Note:Private Equity performance is shown on a time-weighted return basis. Values are cash adjusted with current month cash flows.
Ventura County Employees’ Retirement AssociationTotal Fund Performance Detail Net of Fees
Market Value($)
% ofPortfolio Policy % 1 Mo
(%)3 Mo
(%)YTD(%)
FiscalYTD(%)
1 Yr(%)
3 Yrs(%)
5 Yrs(%)
10 Yrs(%)
Return(%) Since
_
Total Private Equity 125,340,243 2.8 5.0 -0.4 1.8 4.1 11.8 16.9 13.9 -- -- -- Jul-10DJ U.S. Total Stock Market Index + 3% 0.7 6.0 3.3 10.2 16.0 20.2 17.8 -- 20.4 Jul-10
Over/Under -1.1 -4.2 0.8 1.6 0.9 -6.3 Adams Street Partners 77,520,339 1.8 -0.1 3.1 3.1 10.4 16.4 13.0 -- -- -- Jul-10
DJ U.S. Total Stock Market Index + 3% 0.7 6.0 3.3 10.2 16.0 20.2 17.8 -- 20.4 Jul-10Over/Under -0.8 -2.9 -0.2 0.2 0.4 -7.2
Panteon Ventures 13,616,697 0.3 -2.9 -0.8 -0.8 2.4 9.4 8.7 -- -- -- Aug-10DJ U.S. Total Stock Market Index + 3% 0.7 6.0 3.3 10.2 16.0 20.2 17.8 -- 22.0 Aug-10
Over/Under -3.6 -6.8 -4.1 -7.8 -6.6 -11.5 Harbourvest 34,203,207 0.8 0.0 -0.1 7.9 19.1 21.1 -- -- -- -- May-13
DJ U.S. Total Stock Market Index + 3% 0.7 6.0 3.3 10.2 16.0 20.2 17.8 -- 19.4 May-13Over/Under -0.7 -6.1 4.6 8.9 5.1
XXXXX
6 MASTER PAGE NO. 379

Cash Flow Summary Month Ending April 30, 2015
BeginningMarket Value Withdrawals Contributions Net Cash Flow Fees Net Investment
ChangeEnding
Market Value_
Adams Street Partners $77,594,905 $0 $0 $0 $0 -$74,565 $77,520,339BlackRock ACWI ex-U.S. Index $258,178,876 $0 $0 $0 -$24,303 $13,460,143 $271,639,019BlackRock Equity Market Fund $1,171,040,708 $0 $0 $0 -$21,690 $5,381,105 $1,176,421,813BlackRock Extended Equity Index $49,067,966 $0 $0 $0 -$3,221 -$747,046 $48,320,920BlackRock MSCI ACWI Equity Index $227,794,793 $0 $0 $0 -$9,483 $6,701,375 $234,496,168BlackRock U.S. Debt Fund $141,505,104 $0 $0 $0 -$8,037 -$409,142 $141,095,962Bridgewater All Weather Fund $284,498,548 $0 $0 $0 -$93,435 $3,988,875 $288,487,422GMO Global Equity $213,152,017 $0 $0 $0 -$101,823 $9,006,424 $222,158,441Harbourvest $34,203,207 $0 $0 $0 $0 $0 $34,203,207Hexavest $80,358,439 $0 $0 $0 -$32,005 $3,157,279 $83,515,718Loomis Sayles Global Fixed Income $90,486,017 $0 $0 $0 -$22,883 $1,045,074 $91,531,091Loomis Sayles Multi Strategy $73,349,802 $0 $0 $0 -$24,282 $444,010 $73,793,811Loomis Strategic Alpha $42,694,218 $0 $0 $0 -$14,269 $113,347 $42,807,565Panteon Ventures $14,663,333 -$921,142 $300,822 -$620,320 $50,137 -$426,316 $13,616,697Parametric $38,833,449 -$17,785,796 $4,615,212 -$13,170,584 -$3,068 -$1,120,507 $24,542,358PIMCO Global Fixed Income $124,955,057 $0 $0 $0 -$35,648 $970,547 $125,925,604Prudential Real Estate $111,362,490 $0 $0 $0 $0 $0 $111,362,490Reams $280,328,425 $0 $0 $0 -$41,831 $4,316,990 $284,645,415RREEF $5,669,699 $0 $0 $0 $0 $0 $5,669,699Sprucegrove $184,158,765 $0 $0 $0 -$59,642 $8,124,394 $192,283,160Tortoise Energy Infrastructure $140,422,805 $0 $0 $0 -$87,861 $8,270,154 $148,692,959UBS Real Estate $213,926,049 $0 $0 $0 $0 $0 $213,926,049Walter Scott $94,533,357 $0 $0 $0 -$71,554 $4,823,967 $99,357,324Western $272,269,339 $0 $0 $0 -$46,492 -$330,212 $271,939,127Western U.S. Index Plus $140,787,690 $0 $0 $0 -$30,273 $1,396,003 $142,183,693Total $4,365,835,058 -$18,706,938 $4,916,034 -$13,790,904 -$681,663 $68,091,898 $4,420,136,052
April 30, 2015
Ventura County Employees’ Retirement AssociationTotal Fund
7 MASTER PAGE NO. 380

May 18, 2015 Board of Retirement Ventura County Employees’ Retirement Association 1190 South Victoria Avenue, Suite 200 Ventura, CA 93003 SUBJECT: QUARTERLY RETIREMENT ADMINISTRATOR’S REPORT Dear Board Members: My first quarter serving as VCERA’s Retirement Administrator has been eventful, and has provided many opportunities for learning more about not only VCERA’s specific operations and challenges, but broader issues concerning CERL and its rules and provisions. This report will provide more detail than future ones and will include a bit of overlap/recap of Board items, as the first report since my arrival. Though April is typically reported in the 2nd quarter’s report, I have included it so that my first full quarter as RA is reflected. In compliance with VCERA’s Monitoring & Reporting Policy, this report will include information regarding travel, training, key meetings and media communications, as well as other key issues. Key Meetings As I assumed my new role, I had a good number of introductory meetings and initial briefings with County executives, investment managers, consultants and others. January
Chair Towner set up separate introductory meetings with County CEO Mike Powers and Auditor Controller Jeff Burgh.
February: Brian Colker, Linea: briefing on the history and current status of the PAS project. Tony Frietas, Blackrock: introduction and briefing on Blackrock’s role and performance in
the VCERA portfolio. County HR to discuss VCERA resuming participation in New Employee Orientation
training (see Travel & Training on following page for more details.) March:
Veronica Amici, Western Asset Management: introduction & history/performance briefing. Margaret Foley, Walter Scott: introduction & portfolio review. Ed Althof & Kevin Coe, Ventura County I.T. to discuss I.T. support in general, as well as
potential support after completion of PAS project; 2nd meeting March 31 to discuss website options.
April David Blair & Sasha Talcott, PIMCO: introduction & history/performance briefing.
MASTER PAGE NO. 381

May 18, 2015 Page 2 of 2
Scott Larson & Hammad Zaigham, ViTech, as well as Henry Solis from VCERA: reviewed travel expenditures related to VCERA contract and discussed options to correct billing error.
Hammad Zaigham & Haridas Mamgalappilly, ViTech: explored Query Builder capability in V3 to allow for simple queries by RA as needed to avoid incurring unnecessary costs during project.
Travel & Training I attended the CALAPRS General Assembly, March 7-10, 2015 in Monterey, California (Cost: $1140.06). I attended a variety of sessions, the most helpful of which was a presentation by Harvey Liederman from Reed Smith regarding contracts. As a new employee, in February I attended New Employee Orientation at the Hall of Administration, as well as the required safety training. During the New Employee Orientation, I had concerns about the very brief and incomplete information provided to new employees about VCERA. Afterwards, I reached out to County HR to express my interest in resuming our participation in these monthly orientations and I offered to come over in person to do that portion of the presentation. It’s important in my view to have employees’ first impression and information about VCERA be accurate, positive and complete. County HR welcomed this and I hope to begin participating in those meetings next month. Personnel At the end of March, we saw the departure of Fiscal Manager Christina Stevens who left to pursue other opportunities. Shortly after, Nida Williams joined our team as Accounting Officer IV and has been coming along quickly. Our new CIO Dan Gallagher began work May 4th, and we are happy to welcome him to our VCERA team. In the weeks leading up to this, I worked with the Personnel Review Committee and Board in the process of reviewing application materials, selecting interview questions and coordinating the process. On April 20th, we received the salary study we had requested from County HR for the VCERA General Counsel position. After review of this study, on April 23rd we requested to renew our original request to link the position to “Chief Assistant County Counsel”. Board/Policy/Compliance During the previous quarter, the following policies were reviewed and modified or updated in some way:
Board of Retirement Education & Travel Policy; Funding Policy (from actuarial valuation); Conflict of Interest Code; Interest Crediting and Excess Earnings Policy (formerly Interest Crediting Policy).
In addition, we issued our annual Board Education Compliance Report. Finally, staff has been working through issues related to VCERA’s IRS Qualification, including review with Board Counsel of recommendations and documents provided by Hanson Bridgett regarding the adoption of model regulations. The most recent discussions have been in examining the potential impact on the PAS project. During a recent meeting while reviewing model regulations related to the 401(A)(17) limits, I asked staff to run a specific query to identify members
MASTER PAGE NO. 382

May 18, 2015 Page 2 of 2
who may have exceeded these, or were getting close considering we are nearing fiscal year’s end. This proved valuable, and we have identified one member who exceeded and two additional who are approaching the limit within weeks. We may now work with the County to avoid issues with members contributing on more salary than the limits allow. In February, while inquiring about our process for monitoring retiree deaths, I discovered that a periodic update had not been run since the departure of our former I.T. employee. After working with County I.T. to reestablish the process, we found that there was an unreported death and the benefit payments had not yet been stopped. This has since been resolved and the process is running again regularly. Actuarial Perhaps the most significant work during the first quarter was in relation to the annual actuarial valuation and the corresponding contribution rates. It proved as another rich opportunity to quickly learn a great deal about not only how VCERA contribution rates are developed, but about the process and communication with the County, the history of these rates, and the process for providing information to stakeholders. In addition to the actuarial valuation, the 3-year experience study was completed in April and this provided additional opportunities to understand and navigate these issues and processes. Press/Media The announcement of VCERA’s decision to invest in Global Tactical Asset Allocation generated requests from investment related publications for information. In late April, I wrote a press release to announce the hiring of Dan Gallagher. Administrative & Operations Our VCERA team is now meeting monthly for staff meetings, where I summarize recent decisions by the Board, answer questions, and generally discuss issues that affect the staff. I have begun asking a Board member to attend these meetings so that he/she may meet our staff and they may learn more about our Board. Also, I have asked a couple of staff members to attend Board meetings as well. In addition to these monthly team meetings, I generally meet every couple of weeks with my senior staff, our CFO and COO. Soon to join these discussions will be our CIO. At these meetings we discuss not only current workloads and issues, but talk about potential problems that we work to avoid. Annual statements were mailed in April to our active members. COO Julie Stallings has been taking me through various processes as time allows, helping me become familiar with the process of retiring members, responding to requests and the flow of data into our system. This is critical before I can properly identify the areas that are most in need of change and improved efficiency. One of the priorities I have set for staff was to improve turnaround time of estimates and buyback requests. Turnaround time has improved somewhat steadily, despite the high volume of work.
MASTER PAGE NO. 383

May 18, 2015 Page 2 of 2
Here are the stats for the past two quarters, plus April 1- May 5, 2015:
Q4-2014 Q1-2015 Q2-2015*
New Buyback & Estimate Requests 178 229 82
Completed Buybacks & Estimates 198 185 22
Average Turnaround (calendar days) 39 34 19
Open Buyback & Estimate requests as of 5/7/15 71
* 04/01/15 - 05/05/15 I’d like to personally thank VCERA staff for their help in these first months in building my knowledge and answering my questions. Specifically, I’d like to acknowledge the patient guidance of Board Counsel Lori Nemiroff, as well as the thorough briefings from CFO Henry Solis and COO Julie Stallings. I’m pleased with the outstanding staff members on our VCERA team. Please let me know if you have any questions or concerns regarding the information provided in this report. Sincerely,
Linda Webb Retirement Administrator
MASTER PAGE NO. 384

Ventura County Employees’ Retirement Information System
Project Status Report Month Ending: April 2015
Reporting to: Board of Retirement Report Date: 05/13/15 Written by: Brian Colker
1
PROJECT STATUS SUMMARY Actual Percentage Complete: 77.13%* Planned Percentage Complete: 77.13%*
**Note: The updated Sprint Schedule went into effect with the approval of the change orders presented to the Board 01/05/2015. The completion percentages have been adjusted to take into account the updates and changes per the new sprint schedule. Scope Schedule Cost Risks Quality
Risks
Plan sponsor payroll transmittal – The first two parallel test files have been tested and the project team has been working with the Auditor-Controller’s office to resolve the identified issues. The Auditor-Controller provided a scenario-based file to test fixes on April 30, 2015. The project team will analyze the file and provide feedback to Auditor-Controller. Parallel testing will resume when critical issues have been resolved. Weekly meetings are held to discuss issues and project status.
KEY ACCOMPLISHMENTS LAST MONTH
Received additional test files from Auditor-Controller. Delivered additional functionality in:
o Disability o Active Death Processing o Retired Death Processing o DRO Processing – Alt Payee o Member Correspondence
Wrote 191 test cases and executed 217 tests. There have been 3,123 tests executed to date and there are currently 442 defects in an open status – 35 high priority, 305 medium priority, 102 low priority.
MASTER PAGE NO. 385

Adams Street Partners 2015 Client Conference Four Seasons Hotel 120 East Delaware Place June 2 – 3, 2015
CHICAGO AGENDA Tuesday, June 2
3:30 pm to 5:00 pm Four Seasons Hotel
Additional Sessions
Secondary Investor Forum Direct Fund Advisory Board Meeting
6:00 pm to 9:00 pm
Welcome Reception/Dinner
Fig & Olive 104 East Oak Street Chicago, IL 60611
Wednesday, June 3
7:30 am Registration and Breakfast
Four Seasons Hotel (Ballroom)
8:00 Opening Remarks
Kevin Callahan
8:15 Adams Street Partners Overview
Jeff Diehl
8:45 Venture Capital Market Update
Kelly Meldrum David Hornik, General Partner, August Capital
9:45 Break
10:00 Venture Capital in China
Bo Shao, Founding Managing Partner, Matrix Partners China
11:00 Venture Capital and Growth Equity Investing
Terry Gould Norbert Riedel, Chief Executive Officer, Naurex
12:00 pm Lunch
1:15 Energy Investing
John Raymond, Managing Partner & Chief Executive Officer, The Energy & Minerals Group
2:15 Secondary and Co-Investment Market Update
Troy Barnett and Dave Brett
2:45 Closing Remarks
Bon French
3:00 Reception
MASTER PAGE NO. 386

Adams Street Partners 2015 Chicago Client Conference June 2-3, 2015
CHICAGO HOTEL RESERVATION INFORMATION We are currently holding a block of rooms at the following Chicago hotels. Please call the hotel directly to make a reservation. In order to take advantage of the discounted room rate, please mention that you are with the Adams Street Partners Client Conference.
FOUR SEASONS HOTEL CHICAGO
Address: 120 East Delaware Place Chicago, Illinois, USA 60611
Reservations call: 312.280.8800
The negotiated conference room rate is $390 per night for a deluxe room. If you wish to stay at the Four Seasons Hotel, please contact the hotel directly
at the Reservations number listed above.
Four Seasons Hotel reservations cutoff date: May 11, 2015
THE WESTIN MICHIGAN AVENUE CHICAGO
Address: 909 North Michigan Avenue Chicago, Illinois, USA 60611
Reservations call: 888.627.8385 or Adams Street Partners Room Block
The negotiated conference room rate is $249 per night for a traditional king room. If you wish to stay at The Westin Hotel please contact the hotel directly
at the Reservations number listed above.
The Westin Hotel reservations cutoff date: May 01, 2015
Four Seasons Hotel
Westin Hotel
MASTER PAGE NO. 387

Having trouble viewing this email?Click here
PROGRAM ANNOUNCEMENT
Friday, June 12, 2015 From 8:30am to 3:30pm
Los Angeles Marriott Burbank Airport 2500 North Hollywood Way Burbank, CA 91505 818-843-6000 Reserve your room > Cutoff Date: May 11 Room Rate: $145 + tax
Get Directions > Nearest Airport: BUR Airport Shuttle: 24 hours
Trustees' Roundtable
Agenda: What would you like to discuss?
Your meeting chair Marty Dirks, San Jose Federated, is preparing the agenda for this meeting. Please contact him to share your suggestions for discussion topics. The agenda will be emailed to you and posted on the website as available. Breakfast and lunch will be provided.
Reserve your hotel room by May 11
CALAPRS has a discounted room block at the Los Angeles Marriott Burbank Airport for $145/night + tax. By May 11,reserve on-line HERE or by phone at 818-843-6000.
REGISTER NOW
California Association of Public Retirement Systems
575 Market Street, Suite 2125, San Francisco, CA 94105 P: 415.764.4860 | Toll-free: 1-800-Retire-0 | F: 415.764.4915
[email protected] | www.calaprs.org
MASTER PAGE NO. 388