ventura county traffic model scag modeling task …€¦ · ventura county traffic model scag...
TRANSCRIPT
© 2016 Iteris, Inc. All rights reserved. © 2016 Iteris, Inc. All rights reserved.
Ventura County Traffic ModelSCAG Modeling Task Force Meeting
May 24, 2017
© 2016 Iteris, Inc. All rights reserved.
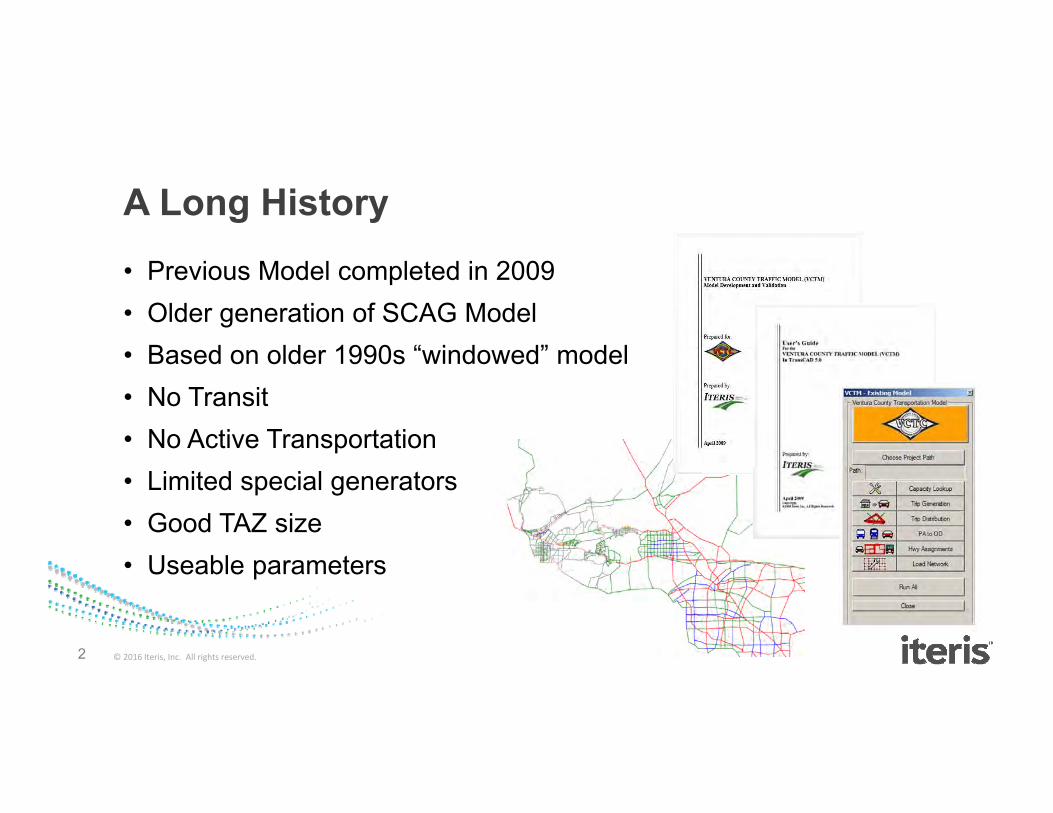
A Long History• Previous Model completed in 2009• Older generation of SCAG Model• Based on older 1990s “windowed” model• No Transit• No Active Transportation• Limited special generators• Good TAZ size• Useable parameters
2

© 2016 Iteris, Inc. All rights reserved.
Focus on the Goals• Meet Key Application Needs
o VCTC’s Highway Program Developmento County’s Multi‐Modal Planningo Ventura County’s General Plan Updateo SB 743 Needso Compatibility with CMPo Impact Fee/Fair Share Analyseso Next Generation of Local Models
o Leverage Current Model’s Featureso Consistency with SCAG
© 2016 Iteris, Inc. All rights reserved.
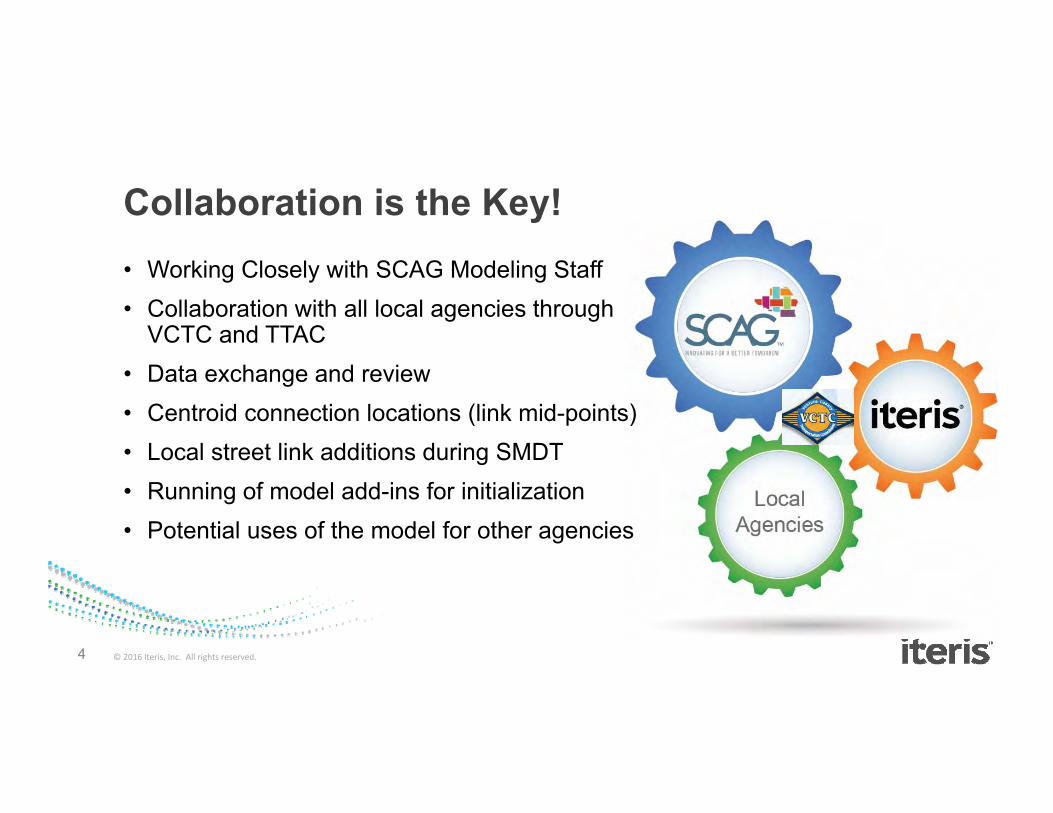
Collaboration is the Key!• Working Closely with SCAG Modeling Staff• Collaboration with all local agencies through
VCTC and TTAC• Data exchange and review• Centroid connection locations (link mid-points)• Local street link additions during SMDT• Running of model add-ins for initialization• Potential uses of the model for other agencies
4
© 2016 Iteris, Inc. All rights reserved.
What’s in the Model?
5
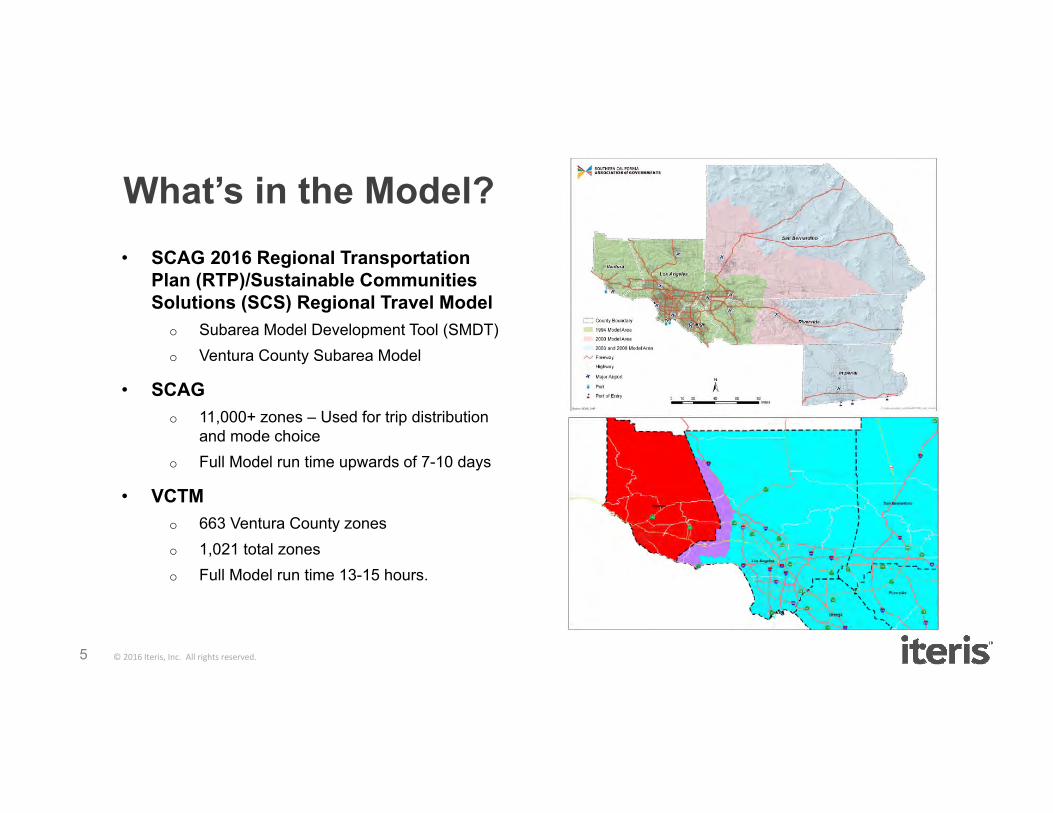
• SCAG 2016 Regional Transportation Plan (RTP)/Sustainable Communities Solutions (SCS) Regional Travel Model
o Subarea Model Development Tool (SMDT)o Ventura County Subarea Model
• SCAGo 11,000+ zones – Used for trip distribution
and mode choiceo Full Model run time upwards of 7-10 days
• VCTMo 663 Ventura County zoneso 1,021 total zoneso Full Model run time 13-15 hours.

© 2016 Iteris, Inc. All rights reserved.
Improvements Customized to Local Needs
• Land Use to Socio-Economic Data Conversion
• Special Generator Trip Generation
• Enhanced Active Transportation in Mode Choiceo Previous Model did not include a Mode Choice
component
• Additional Assignment Output Capabilities
• Specialized and Standardized Performance Measure Outputs for VCTC and local needs
6

© 2016 Iteris, Inc. All rights reserved. 7
Land Use to SED
Special Generators
Active Transportation
Assignment Outputs
Performance Measures
© 2016 Iteris, Inc. All rights reserved.
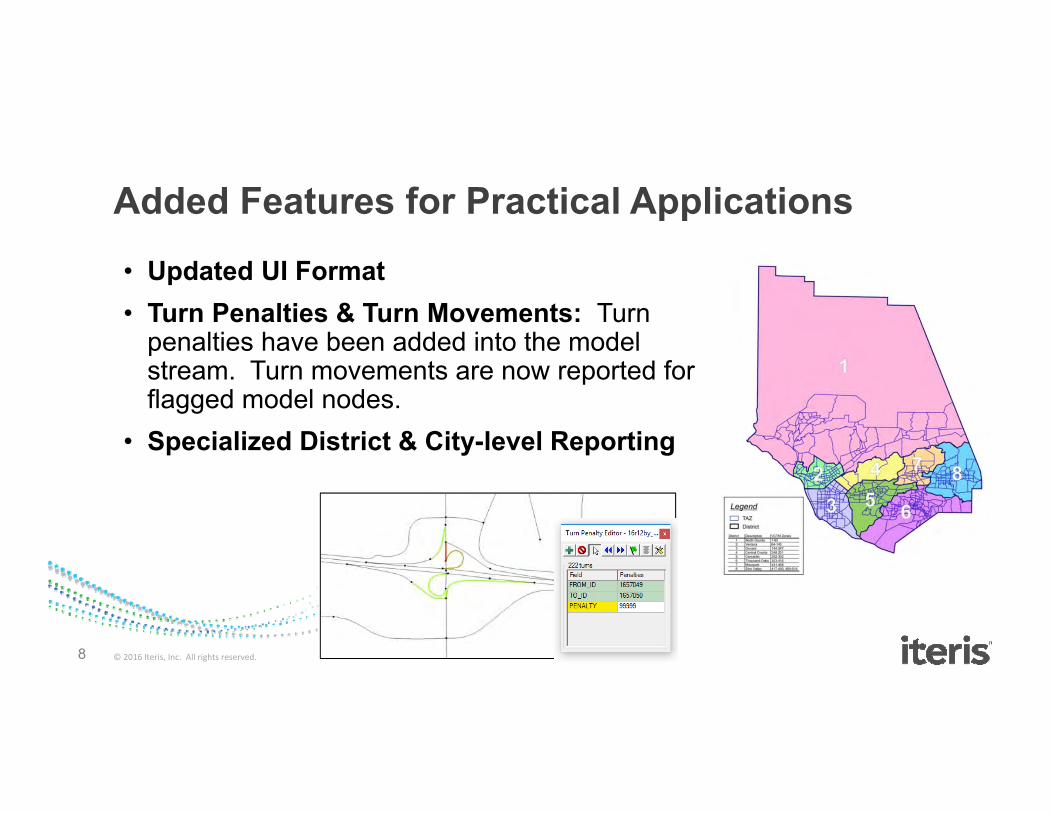
Added Features for Practical Applications• Updated UI Format• Turn Penalties & Turn Movements: Turn
penalties have been added into the model stream. Turn movements are now reported for flagged model nodes.
• Specialized District & City-level Reporting
8

© 2016 Iteris, Inc. All rights reserved.
Land Use Model• Obtained raw land use for 2012 and 2040 from SCAG
o Converted to Square Feet (SCAG Maintains Square Meters)o Adjusted some of inputs (water, undevelopable, etc.)
• Developed local factors for Land Use to SEDo Based on Representative Zoneso Developed for Total Employment & Total Households
• Currently Collecting Feedback from TTAC on Land Use Data
9
Land Use to SED
© 2016 Iteris, Inc. All rights reserved.
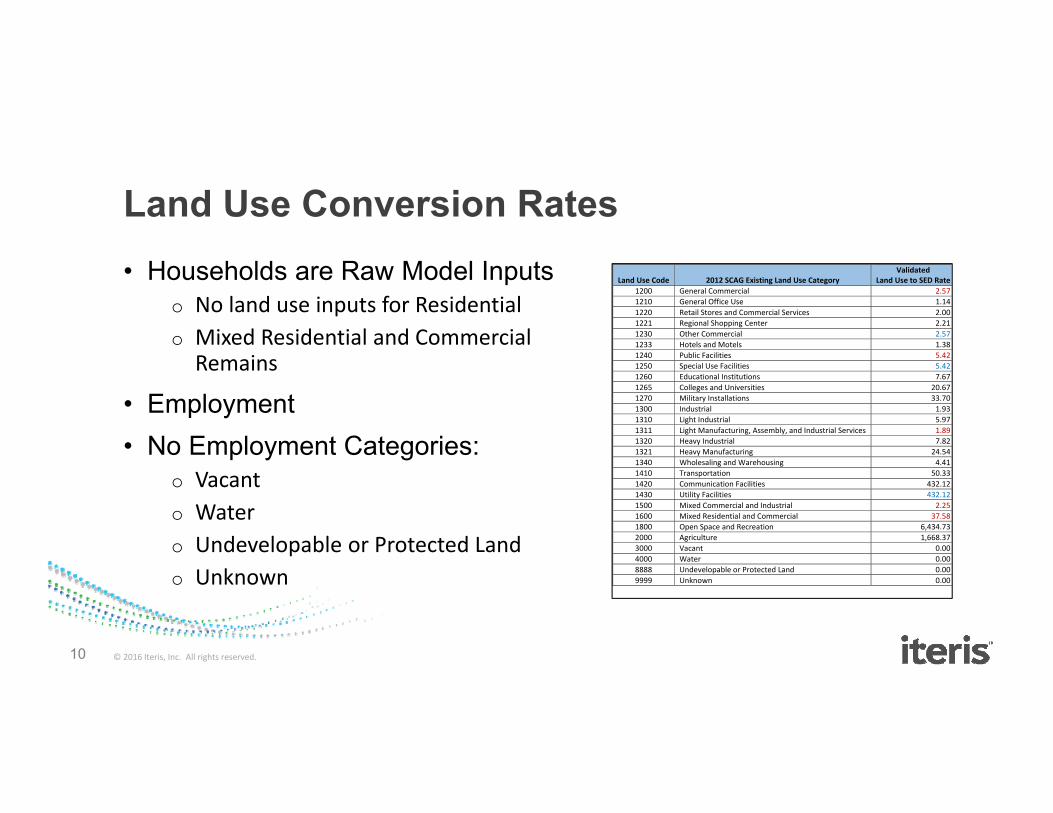
Land Use Conversion Rates
10
• Households are Raw Model Inputso No land use inputs for Residentialo Mixed Residential and Commercial
Remains
• Employment• No Employment Categories:
o Vacanto Watero Undevelopable or Protected Lando Unknown
Land Use Code 2012 SCAG Existing Land Use Category Validated
Land Use to SED Rate 1200 General Commercial 2.57 1210 General Office Use 1.14 1220 Retail Stores and Commercial Services 2.00 1221 Regional Shopping Center 2.21 1230 Other Commercial 2.57 1233 Hotels and Motels 1.38 1240 Public Facilities 5.42 1250 Special Use Facilities 5.42 1260 Educational Institutions 7.67 1265 Colleges and Universities 20.67 1270 Military Installations 33.70 1300 Industrial 1.93 1310 Light Industrial 5.97 1311 Light Manufacturing, Assembly, and Industrial Services 1.89 1320 Heavy Industrial 7.82 1321 Heavy Manufacturing 24.54 1340 Wholesaling and Warehousing 4.41 1410 Transportation 50.33 1420 Communication Facilities 432.12 1430 Utility Facilities 432.12 1500 Mixed Commercial and Industrial 2.25 1600 Mixed Residential and Commercial 37.58 1800 Open Space and Recreation 6,434.73 2000 Agriculture 1,668.37 3000 Vacant 0.00 4000 Water 0.00 8888 Undevelopable or Protected Land 0.00 9999 Unknown 0.00

© 2016 Iteris, Inc. All rights reserved.
Special Generators• Facilities with Unique Trip Making Characteristics
o Examples: Universities, Military Bases, Airportso Based on ITE Trip Rates or Special Local Surveys/Research
• Areas Under Review for Employment Development/Trip Generation
o Ventura Oil Fieldso Point Muguo San Buenaventura Light Industrialo Port of Huenemeo Oxnard High Density Light Industrialo Los Robles Hospital
11
Special Generators
© 2016 Iteris, Inc. All rights reserved.
Model Calibration
• What needs calibration?o Trip Generation Rates
o Regional Boundaries (External Stations)
o Special Generator Rates
o Agriculture Trip Rates
o Transit Trips
o Mode Choice Coefficients
o Trip Distribution
• Currently in process!
12

© 2016 Iteris, Inc. All rights reserved.
Model Validation• Freeway and Arterial Street Networks
o Count/Volume Comparison (FHWA & Caltrans)oFreeways +/- 7%
oMajor Arterials +/- 10%
oMinor Arterials +/- 15%
o Percent Root Mean Squared Error (%RMSE )oCaltrans = 40
oFHWA = 30
o Coefficient of Determination (R2) (FHWA & Caltrans)o0.88
o Caltrans Standard Deviationo>0.75
13
Caltrans Criteria from the Caltrans Travel Forecasting
Guidelines, November 1992
FHWA Criteria from the TMIP Model Validation and
Reasonableness Checking Manual

© 2016 Iteris, Inc. All rights reserved.
Model Validation• Screenlines
14

© 2016 Iteris, Inc. All rights reserved.
Model Validation• Freeway and Arterial Street Networks
• Use of PeMS & Big Data Analytics
15
VCTM Model Update Count - Volume Comparison - (VCTM_12BY_V2) -
0
20000
40000
60000
80000
100000
120000
0 20000 40000 60000 80000 100000 120000
Volume
Count
DAY COUNT VS. VOLUME
All Counts
© 2016 Iteris, Inc. All rights reserved.
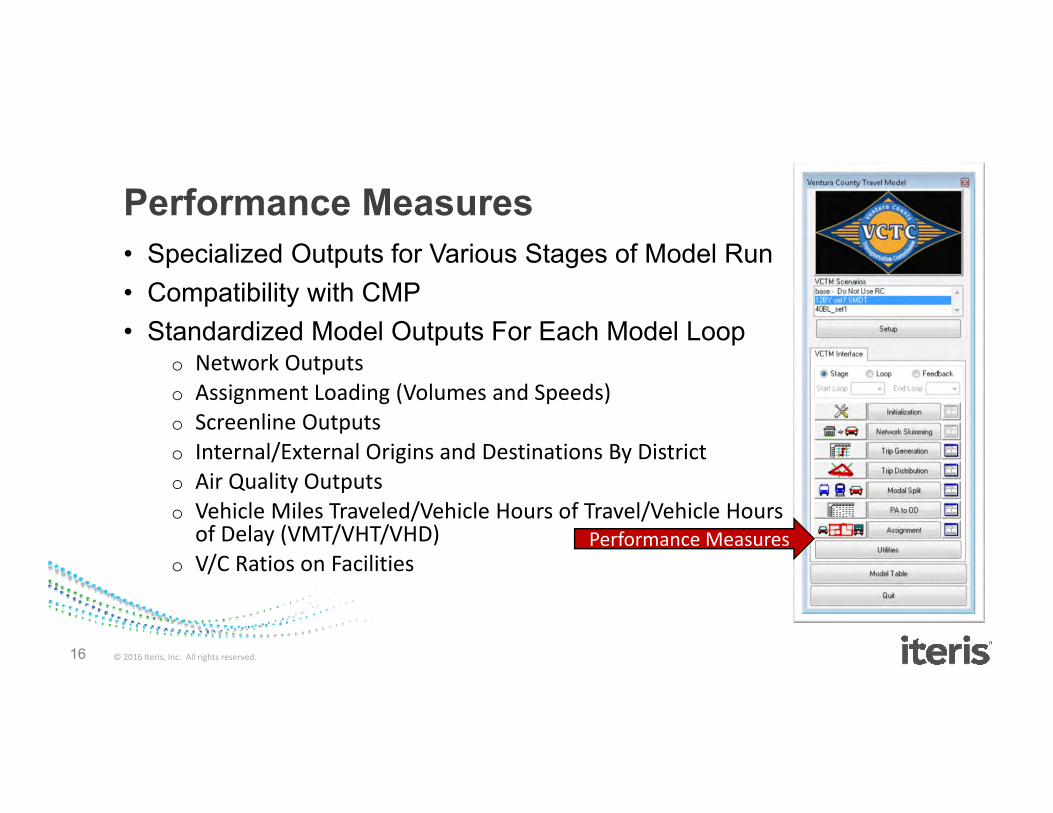
Performance Measures• Specialized Outputs for Various Stages of Model Run• Compatibility with CMP• Standardized Model Outputs For Each Model Loop
o Network Outputso Assignment Loading (Volumes and Speeds)o Screenline Outputso Internal/External Origins and Destinations By Districto Air Quality Outputso Vehicle Miles Traveled/Vehicle Hours of Travel/Vehicle Hours
of Delay (VMT/VHT/VHD)o V/C Ratios on Facilities
16
Performance Measures
© 2016 Iteris, Inc. All rights reserved.
Next Steps• Collect Feedback from TTAC regarding
Land Use Data• Complete Special Generator Determination
and Inclusion into the Model• Complete Model Calibration and Validation• Finalize Standardized Performance
Measures• Modify and Refine Active Transportation
Model• Coordination with General Plan
17

© 2016 Iteris, Inc. All rights reserved.
Thank You!
18
Viggen Davidian (Project Manager)[email protected](213) 802-1707
Jennifer Martin (Technical Lead)[email protected]
(509) 990-3441
Mahmoud Ahmadi (Technical Advisor/QC)[email protected]
(949) 270-9649Steve DeGeorge
Director of Planning, VCTC