ventura county transit asset management plan · 2020-01-24 · ventura county transportation...
TRANSCRIPT

Ventura County Transportation Commission
TRANSIT ASSET MANAGEMENT PLAN
OCTOBER 2018
950 County Square Drive, Ventura, California 93003 | 805.642.1591 | www.goventura.org

Ventura County Transportation Commission 2018 Ventura County Group TAM Plan
Page 1
Approval by Agency Accountable Executives
Transit asset management plans are required for all Federal Transit Administration grantees per MAP-21 legislation. Moreover, developing a transit asset management plan makes good business sense. The benefits from enhanced asset management practices include improved system safety and reliability, reduced costs, better customer service, and optimized resource allocation. The Ventura County Group Transit Asset Management (TAM) Plan, with VCTC as acting group plan sponsor, outlines the policies, processes and procedures to improve asset management practices over the next four years and has the support of the member agencies’ Accountable Executives. Signatures can be found at the end of the document.

Ventura County Transportation Commission 2018 Ventura County Group TAM Plan
Page 2
Acknowledgements
Ventura County Transportation Commission
Linda Parks, County of Ventura, Chair Manuel Minjares, City of Fillmore, Vice Chair
Jan McDonald, City of Camarillo Ken Simons, City of Moorpark
Randy Haney, City of Ojai Bryan MacDonald, City of Oxnard Will Berg, City of Port Hueneme
Neal Andrews, City of San Buenaventura Ginger Gherardi, City of Santa Paula
Mike Judge, City of Simi Valley Claudia Bill-de la Peña, City of Thousand Oaks
Steve Bennett, County of Ventura Peter Foy, County of Ventura Kelly Long, County of Ventura
John Zaragoza, County of Ventura Brian Humphrey, Citizen Rep., Cities
Jim White, Citizen Rep., County Paul Marquez, Caltrans District 7
Ventura County Transit Providers
Mike Houser, Senior Transit Analyst, City of Thousand Oaks
Pricscilla Freduah-Agyemang, Transit Analyst, Thousand Oaks Ben Gonzales, Transit Operations Manager, Simi Valley
John Willoughby, Maintenance Superintendent, City of Simi Valley Tyler Nestved, Engineering Technician, City of Camarillo
Shaun Kroes, Program Manager, City of Moorpark Peter De Haan, Programming Director, VCTC
Martin R. Erickson, Public Transit Director, VCTC Claire Grasty, Program Manager, Regional Transit Planning, VCTC
Aaron B. Bonfilio, Program Manager, Transit Services, VCTC Heather L. Miller, Transit Planner, VCTC
Syed Shadab, General Manager, RATP Dev Thomas Conlon, General Manager, MV Transportation
Masood Babaeian, Ventura Transit Systems Tina Rosas, HELP of Ojai
Meredith Hart, Downtown Ventura Partners

Ventura County Transportation Commission 2018 Ventura County Group TAM Plan
Page 3
Contents
1 INTRODUCTION 9
2 VALLEY EXPRESS 15
2.1 Overview of Valley Express Service 15
2.2 Valley Express Asset Inventory Portfolio 15
2.3 Valley Express Asset Condition Assessment 16
2.4 Valley Express Decision Support Tools & Management Approach 16
2.5 Valley Express Prioritized List of Investments 17
3 VCTC INTERCITY TRANSIT 19
3.1 Overview of VCTC Intercity Service 19
3.2 VCTC Intercity Asset Inventory Portfolio 19
3.3 VCTC Intercity Asset Condition Assessment 21
3.4 VCTC Intercity Decision Support Tools & Management Approach 22
3.5 VCTC Intercity Prioritized List of Investments 24
4 CAMARILLO AREA TRANSIT (CAT) 26
4.1 Overview of CAT Service 26
4.2 CAT Asset Inventory Portfolio 26
4.3 CAT Asset Condition Assessment 27
4.4 CAT Decision Support Tools & Management Approach 27
4.5 CAT Prioritized List of Investments 28
5 MOORPARK CITY TRANSIT (MCT) 30
5.1 Overview of MCT Service 30
5.2 MCT Asset Inventory Portfolio 30

Ventura County Transportation Commission 2018 Ventura County Group TAM Plan
Page 4
5.3 MCT Asset Condition Assessment 31
5.4 MCT Decision Support Tools & Management Approach 31
5.5 MCT Prioritized List of Investments 32
6 SIMI VALLEY TRANSIT (SVT) 34
6.1 Overview of SVT Service 34
6.2 SVT Asset Inventory Portfolio 34
6.3 SVT Asset Condition Assessment 36
6.4 SVT Decision Support Tools & Management Approach 38
6.5 SVT Prioritized List of Investments 39
7 THOUSAND OAKS TRANSIT (TOT) 41
7.1 Overview of TOT Service 41
7.2 TOT Asset Inventory Portfolio 41
7.3 TOT Asset Condition Assessment 43
7.4 TOT Decision Support Tools & Management Approach 45
7.5 TOT Prioritized List of Investments 48
8 OTHER VENTURA COUNTY TRANSIT SERVICE PROVIDERS 50
9 VENTURA COUNTY RAIL 52
10 VENTURA COUNTY ANNUALIZED PERFORMANCE TARGET & MEASURES 54
11 RECORDKEEPING & NTD REPORTING 56
12 CONCLUSION 58

Ventura County Transportation Commission 2018 Ventura County Group TAM Plan
Page 5
EXECUTIVE SUMMARY
BACKGROUND
In 2012, Moving Ahead for Progress in the 21st Century Act (MAP-21) mandated the Federal Transit Administration (FTA) develop a rule establishing a strategic and systematic process of operating, maintaining, and improving public capital assets effectively through their entire life cycle. The resulting FTA’s Transit Asset Management (TAM) Final Rule 49 USC 625 became effective in 2016 and set forth federal regulations establishing minimum asset management practices for transit providers. The final rule requires transit agencies to maintain and document minimum TAM standards, which will prioritize funding based on the condition of transit assets in order to achieve or maintain transit networks in a State of Good Repair (SGR). State of Good Repair (SGR) Definition SGR is the condition in which a capital asset is able to operate at a full level of performance. A capital asset is in a state of good repair when that asset:
• Is able to perform its designed function, • Does not pose a known unacceptable safety risk, and • Its lifecycle investments must have been met or recovered.
Goal The purpose of the FTA rulemaking is to help achieve and maintain SGR for the nation’s public transportation assets. Currently, there is an estimated $89.8 billion transit SGR backlog. The TAM rule aims to address the backlog by requiring transit providers create TAM plans that will help them systematically address their maintenance needs and develop prioritized asset investment plans . Well-developed asset management systems have been shown to lower long-term maintenance costs and increase efficiency and service reliability. Additionally, TAM will have important non-quantifiable benefits, such as improved transparency and accountability. Implementing a TAM system will require transit providers to collect and use asset condition data, set targets, and develop strategies to prioritize investments to meet their goals. The rule develops a framework

Ventura County Transportation Commission 2018 Ventura County Group TAM Plan
Page 6
for transit agencies to monitor and manage public transportation assets, improve safety, increase reliability and performance, and establish performance measures and targets. Applicability The regulations apply to all Transit Providers that are recipients or subrecipients of Federal financial assistance under 49 U.S.C. Chapter 53 and own, operate, or manage transit capital assets used in the provision of public transportation.
Group TAM Plan The Ventura County Transportation Commission (VCTC) serves as the Regional Transportation Planning Agency (RPTA) for Ventura County. VCTC, as a direct recipient of Chapter 53 funds, which passes along funds to subrecipients that own or operate capital assets used in providing public transportation, must sponsor a group TAM plan on behalf of its subrecipients. Accordingly, VCTC is the sponsoring agency of the Ventura County Group TAM Plan. VCTC and all participating agencies in the plan are Tier II agencies, defined as those transit providers who operate or manage 100 or less vehicles in revenue service during peak regular service. Participating Agencies Serving a population of more than 850,000 County residents, local public transit service (fixed-route and dial-a-ride) in Ventura County is provided by several transit operators managed mainly by local agencies as shown in Figure 1.

Ventura County Transportation Commission 2018 Ventura County Group TAM Plan
Page 7
Figure 1. Map of Ventura County Transit Providers
The Ventura County Group TAM Plan includes the following Ventura County transit providers:
Camarillo Area Transit (CAT) Moorpark City Transit (MCT)
Simi Valley Transit (SVT) City of Thousand Oaks Transit (TOT)
VCTC Intercity Transit (VCTC) Valley Express
Ventura Transit System Downtown Ventura Partners
HELP of Ojai

Ventura County Transportation Commission 2018 Ventura County Group TAM Plan
Page 8
The cities of Camarillo, Moorpark, Simi Valley and Thousand Oaks manage their own municipal fixed-route services that operate mainly within city boundaries. Dial-a-ride service within these cities are managed by local jurisdictions, while inter-city DAR is managed through the East County Transit Alliance (ECTA) administered by the City of Thousand Oaks. The Valley Express service is provided by a cooperative agreement between the cities of Fillmore and Santa Paula, and the County of Ventura and administered by VCTC. VCTC also operates the Intercity service. The Intercity service is an inter-city bus service with eight (8) fixed routes linking the cities of Ventura County. Intercity connects with all but one local transit operator in Ventura County. Intercity also provides service south to Warner Center in Los Angeles County and north to the cities of Carpinteria, Santa Barbara, and Goleta in Santa Barbara County. In addition, smaller bus systems that operate in Ventura County with federally funded assets include the Ventura Transit System, Downtown Ventura Partners and HELP of Ojai. Note: Gold Coast Transit District (GCTD), a Tier II direct recipient of federal funds, developed an individual TAM Plan. GCTD provides bus and paratransit services in the cities of Ojai, Oxnard, Port Hueneme and Ventura, as well as unincorporated areas of western Ventura County.

Ventura County Transportation Commission 2018 Ventura County Group TAM Plan
Page 9
1 INTRODUCTION
Transit providers must complete several key actions to comply with the TAM rule. Providers must submit two reports to the NTD annually, a data report and a narrative report, as well as develop a TAM plan. The data report, an asset inventory, is submitted through the National Transit Database (NTD) program’s Asset Inventory Module (AIM) and is designed to collect basic information on assets and infrastructure applied by transit agencies to deliver service. The purpose of assembling a nationwide inventory is to improve the Federal Transit Administration’s (FTA’s) ability to project capital costs for the replacement (and necessary capital renewal activities) of existing transit assets in the future. The narrative report describes an agency’s progress made toward meeting SGR performance targets set annually by the agency (which are informed by the TAM Plan), and any change in the condition of the provider’s transit system from the previous year.
In addition, The TAM Rule requires transit providers develop a TAM Plan. A TAM Plan outlines the activities that will be implemented and resources applied to address asset management policy and strategy. All TAM Plans must contain an inventory of assets, a condition assessment of inventoried assets, documentation of the use of a decision support tool, and a prioritization of investments. While the TAM Plan is not submitted directly to the FTA, starting in FY 2019, Triennial Reviews and State Management Reviews will include TAM as a part of the FTA’s oversight review program. The TAM Rule requires each participant identify an Accountable Executive responsible for approving the group TAM Plan. Any other aspect of the approval process is considered a “local” or agency decision. The TAM Plan must be updated every four years. Transit Asset Management (TAM) Plan A TAM Plan is a tool that assists transit providers in:
• Identifying a full inventory of an agency’s capital assets. • Assessing the current condition of its capital assets. • Determining what the condition and performance of its assets should be (if they
are not already in a state of good repair).

Ventura County Transportation Commission 2018 Ventura County Group TAM Plan
Page 10
• Identifying the unacceptable risks, including safety risks, in continuing to use an asset that is not in a SGR.
• Deciding how to best balance and prioritize reasonably anticipated funds (revenues from all sources) towards improving asset condition and achieving a sufficient level of performance, or SGR, within those means.
TAM Plan Elements
The following four (4) TAM Plan elements are required by Tier II providers:
• Inventory of Capital Assets • Condition Assessment • Decision Support Tools • Investment Prioritization
Inventory of Capital Assets Asset inventory is a register, repository, or comprehensive list of an agency’s capital assets and specific information about those assets. It is expected that all assets used in the provision of public transit will be included in the TAM Plan asset inventory. This includes (with the exception of equipment) assets that are owned by a third party, or shared resources. The inventory must include all service vehicles, and any other owned equipment assets over $50,000 in acquisition value. Transit assets are categorized as equipment (includes non-revenue support service vehicles), rolling stock (revenue vehicles by mode), facilities (maintenance and administrative facilities, passenger stations, and parking facilities) and infrastructure (rail fixed guideway, signal systems, structures). Note: Although VCTC is not a rail service operator, VCTC owns rail related assets. As such, the Plan includes an inventory of these rails assets (see Section 8 of the Plan). However, since VCTC is not a rail operator, VCTC is not obligated to perform a condition assessment of such assets nor include a prioritized list of capital investments in the Plan. Instead, Metrolink, the region’s commuter rail operator, includes an inventory of all station assets

Ventura County Transportation Commission 2018 Ventura County Group TAM Plan
Page 11
and track (infrastructure) along the rail line it serves (including all Ventura County Stations), a condition assessment of the track, and an investment prioritization list in the Metrolink TAM Plan. Condition Assessment Condition assessment is the process of assessing and documenting the condition or residual life of an asset. It is a rating of the assets’ physical state. Agencies need only include condition assessments for assets for which they have direct capital responsibility. Rolling Stock and Equipment Condition Assessment Condition ratings for vehicles are expressed in terms of the percentage of assets that are at or beyond the Useful Life Benchmark (ULB) based on FTA Circular 9030.1D, paragraph 4.a, or a ULB defined at the discretion of the service provider. ULB is the expected lifecycle of a capital asset for a particular Transit Provider’s operating environment, or the acceptable period of use in service for a particular Transit Provider’s operating environment and is measured in years.
Useful Life Benchmarks (ULBs) Definition
“Useful life benchmark (ULB) is the measure agencies will use to track the performance of revenue vehicles (rolling stock) and service vehicles (equipment) to set their performance measure targets. Each vehicle type’s ULB estimates how many years that vehicle can be in service and still be in a state of good repair. The ULB considers how long it is cost effective to operate an asset before ongoing maintenance costs outweigh replacement costs. The TAM ULB refers to the maximum age of the asset, or the point at which the asset enters the state of good repair backlog. The ULB is used solely for setting state of good repair performance measure targets for equipment and rolling stock asset categories.”
Agencies may choose to use the FTA’s established default ULBs as shown in Attachment A. Alternatively, an agency may develop its own ULBs based on its operating conditions, warranty information, and any other criteria that would affect the assets’ maximum useful life.

Ventura County Transportation Commission 2018 Ventura County Group TAM Plan
Page 12
Facilities Condition Assessment Agencies are required to assess the condition of facilities for which an agency has capital responsibility. FTA requires that facility condition data be fully updated and reported to the NTD every four years, at a minimum. Agencies may choose to assess their facilities more frequently.
Condition assessments for facilities employ the FTA’s Transit Economic Requirements Model (TERM) scale. The TERM condition rating scale ranges from (5) Excellent to (1) Poor. Under the TERM scale, an asset in need of immediate repair or replacement is scored as one (1), whereas a new asset with no visible defects is scored as five (5). Per the FTA TAM Final Ruling, assets with a condition rating score of 3.0 and above are in a SGR. Assets with a condition score lower than 3.0 are not in a SGR and may require prioritization during capital programming to ensure safe, efficient, and reliable transit service. The following table illustrates the Transit Economic Requirements Model (TERM) scale:
Table 1. FTA’s TERM Rating Scale
Note: Agencies can assess the condition of their assets in a way that is most useful to the agency. The TAM rule does not require a specific method for conducting condition assessments of assets.
TERM Rating Condition Description
5 ExcellentNo visible defects, new or near new condition, may still be under warranty if applicable
4 GoodGood condition, but no longer new, may have some slightly defective or deteriorated component(s), but is overall functional
3 AdequateModerately deteriorated or defective components; but has not exceeded useful life
2 MarginalDefective or deteriorated component(s) in need of replacement; exceeded useful life
1 PoorCritically damaged component(s) or in need of immediate repair; well past useful life
TERM Rating Scale

Ventura County Transportation Commission 2018 Ventura County Group TAM Plan
Page 13
Decision Support Tools Decision support tools are analytical processes or methodologies for group plan sponsors and participants to understand their underlying asset and condition data. A decision support tool interprets data and may be based on software, spreadsheets, or formulas, but can also be a process or methodology. These tools can be those created specifically for the Plan or modified versions of existing TAM tools. Each transit agency may and likely do employ unique processes and tools to assist in their TAM which can be contributed to the Group. These analytic processes and/or tools are used to assist in capital asset investment prioritization needs. TAM Plans can also consider policies adopted by group plan participants or other plans to inform and guide investment prioritization, funding decisions and target setting. The Group TAM Plan is a collaborative effort where all participating agencies agree on the outputs since the participating agencies will ultimately be responsible for implementing the Plan. The TAM Plan is the result of a process by which member agencies share, collaborate, assess and reach a consensus on how best to manage their collective Ventura County transit assets with the resources available to them and in the interest of the community they serve.
Figure 2. Phasing of TAM Plan Creation and Related Processes
Investment Prioritization An Investment Prioritization is a prioritized list of projects or programs to manage or improve the SGR of capital assets. While Group TAM Plans may create robust datasets and outputs from decision support tools, there are financial constraints that limit the action that can be taken toward achieving desired goals.

Ventura County Transportation Commission 2018 Ventura County Group TAM Plan
Page 14
The purpose of the investment prioritization section is to link information gained from the asset inventory, condition assessment, and decision support tools to actual investment priorities in support of targets. Investment prioritization needs to be consistent with official or unofficial TAM policies and consider efficiency, safety and accessibility for all. In addition, funding sources can be inconsistent or unpredictable (SB-1) so investment plans must take such funding uncertainties into consideration. The group plan must rank projects to improve or manage the SGR of capital assets in order of priority and anticipated project funding year, and must take into consideration the estimated funding levels from all available sources that the sponsor reasonably expects will be available in each fiscal year during the TAM plan 4 year horizon period (2019-2023). The Group TAM Plan’s Investment Prioritization list is reached by consensus by all of the participating agencies and approved by the designated Accountable Executives.

Ventura County Transportation Commission 2018 Ventura County Group TAM Plan
Page 15
2 Valley Express
2.1 Overview of Valley Express Service
Valley Express operates fixed route, ADA-paratransit, and general purpose dial-a-ride (DAR) throughout the Heritage Valley in Ventura County, California. The service is provided by a cooperative agreement between the Cities of Fillmore and Santa Paula, the County of Ventura, and VCTC. It is managed and administered by VCTC with the operations contracted to MV Transportation Inc. The Valley Express fixed-route service includes four routes serving the cities of Santa Paula and Fillmore as well as the unincorporated area of Piru. Additional “school trippers” operate during the school year. The DAR service, previously limited to seniors and riders with ADA certification, was expanded to include the general public in 2017. With the increase in DAR ridership since expanding service, and consequently service miles, the average fleet mileage is anticipated to accelerate on these vehicles, thus impacting the condition of the fleet overall. Valley Express provides approximately 85,000 passenger trips annually.
2.2 Valley Express Asset Inventory Portfolio
The following table summarizes the revenue vehicles (fixed route and DAR) used in the provision of the Valley Express service. The Valley Express Service operates with fifteen (15) cutaway buses averaging 85,000 miles with a $99,000 replacement value as of 2018. Ten (10) cutaway buses are used for the DAR service, while five (5) cutaway buses are dedicated to fixed route service. Table 2.2. Valley Express Inventory Summary
Asset Category/Class Total Number Avg Age Avg Mileage Avg ValueRevenueVehicles 15 4.0 85,260 $99,333.33AB - Articulated Bus 0 - - -AO - Automobile 0 - - -BR - Over-the-road Bus 0 - - -BU - Bus 0 - - -CU - Cutaway Bus 15 4.0 85,260 $99,333.33DB - Double Decked Bus 0 - - -FB - Ferryboat 0 - - -MB - Mini-bus 0 - - -MV - Mini-van 0 - - -RT - Rubber-tire Vintage Trolley 0 - - -SB - School Bus 0 - - -SV - Sport Utility Vehicle 0 - - -TB - Trolleybus 0 - - -VN - Van 0 - - -
Ventura County Transportation Commission 2018 Ventura County Group TAM Plan
Page 16
2.3 Valley Express Asset Condition Assessment
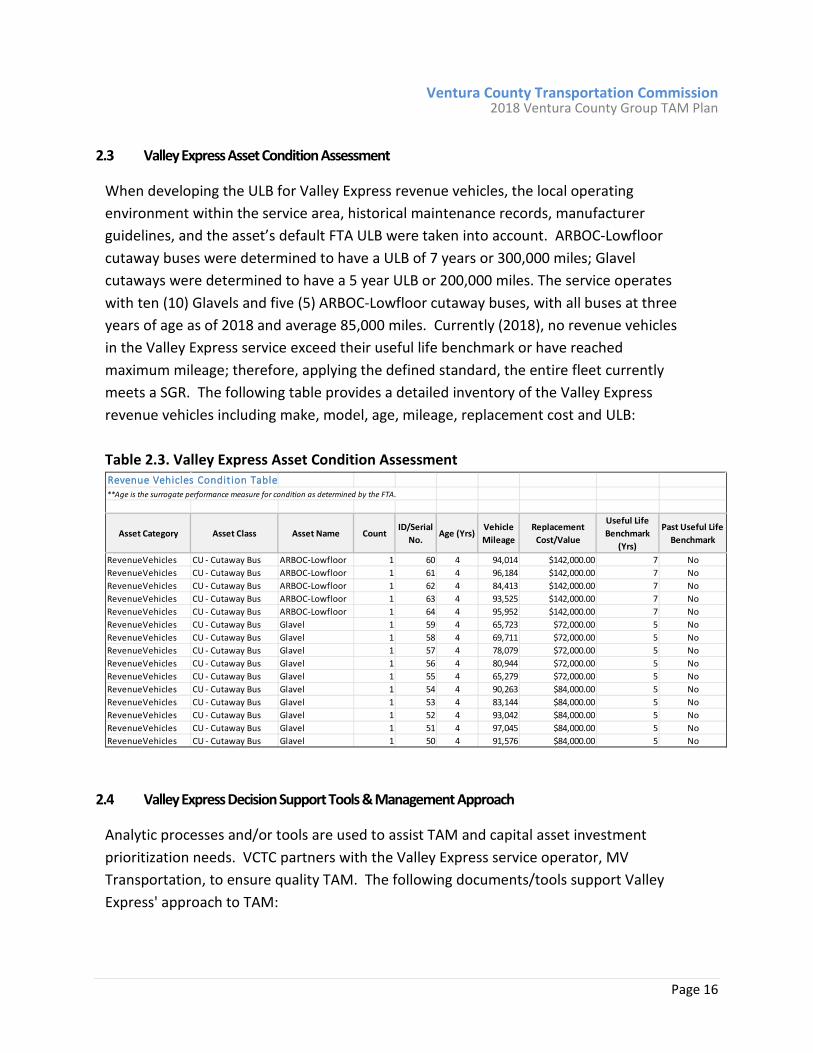
When developing the ULB for Valley Express revenue vehicles, the local operating environment within the service area, historical maintenance records, manufacturer guidelines, and the asset’s default FTA ULB were taken into account. ARBOC-Lowfloor cutaway buses were determined to have a ULB of 7 years or 300,000 miles; Glavel cutaways were determined to have a 5 year ULB or 200,000 miles. The service operates with ten (10) Glavels and five (5) ARBOC-Lowfloor cutaway buses, with all buses at three years of age as of 2018 and average 85,000 miles. Currently (2018), no revenue vehicles in the Valley Express service exceed their useful life benchmark or have reached maximum mileage; therefore, applying the defined standard, the entire fleet currently meets a SGR. The following table provides a detailed inventory of the Valley Express revenue vehicles including make, model, age, mileage, replacement cost and ULB: Table 2.3. Valley Express Asset Condition Assessment
2.4 Valley Express Decision Support Tools & Management Approach
Analytic processes and/or tools are used to assist TAM and capital asset investment prioritization needs. VCTC partners with the Valley Express service operator, MV Transportation, to ensure quality TAM. The following documents/tools support Valley Express' approach to TAM:
Revenue Vehicles Condition Table**Age is the surrogate performance measure for condition as determined by the FTA.
Asset Category Asset Class Asset Name CountID/Serial
No.Age (Yrs)
Vehicle Mileage
Replacement Cost/Value
Useful Life Benchmark
(Yrs)
Past Useful Life Benchmark
RevenueVehicles CU - Cutaway Bus ARBOC-Lowfloor 1 60 4 94,014 $142,000.00 7 NoRevenueVehicles CU - Cutaway Bus ARBOC-Lowfloor 1 61 4 96,184 $142,000.00 7 NoRevenueVehicles CU - Cutaway Bus ARBOC-Lowfloor 1 62 4 84,413 $142,000.00 7 NoRevenueVehicles CU - Cutaway Bus ARBOC-Lowfloor 1 63 4 93,525 $142,000.00 7 NoRevenueVehicles CU - Cutaway Bus ARBOC-Lowfloor 1 64 4 95,952 $142,000.00 7 NoRevenueVehicles CU - Cutaway Bus Glavel 1 59 4 65,723 $72,000.00 5 NoRevenueVehicles CU - Cutaway Bus Glavel 1 58 4 69,711 $72,000.00 5 NoRevenueVehicles CU - Cutaway Bus Glavel 1 57 4 78,079 $72,000.00 5 NoRevenueVehicles CU - Cutaway Bus Glavel 1 56 4 80,944 $72,000.00 5 NoRevenueVehicles CU - Cutaway Bus Glavel 1 55 4 65,279 $72,000.00 5 NoRevenueVehicles CU - Cutaway Bus Glavel 1 54 4 90,263 $84,000.00 5 NoRevenueVehicles CU - Cutaway Bus Glavel 1 53 4 83,144 $84,000.00 5 NoRevenueVehicles CU - Cutaway Bus Glavel 1 52 4 93,042 $84,000.00 5 NoRevenueVehicles CU - Cutaway Bus Glavel 1 51 4 97,045 $84,000.00 5 NoRevenueVehicles CU - Cutaway Bus Glavel 1 50 4 91,576 $84,000.00 5 No

Ventura County Transportation Commission 2018 Ventura County Group TAM Plan
Page 17
Table 2.4. Decision Support Tools
2.5 Valley Express Prioritized List of Investments
An investment prioritization analysis was performed on the Valley Express fleet using the FTA’s “Fleet Retirement and Replacement Computation Module” to produce a yearly expenditures schedule. The table below shows the required purchase for each fleet type per year over a four (4) year period, beginning in 2019, based on vehicle replacement at time of useful life expiration. According to the concluding schedule, in order to maintain a 20% spare ratio and ensure safe and reliable service by meeting SGR, ten (10) replacement vehicles should be purchased by 2020 at a cost of approximately $807,000*
Tool DescriptionValley Express Vehicle Maintenance Plan
The purpose of the Vehicle Maintenance Plan is to develop a consistent, ongoing system of maintenance procedures and guidelines to be used as a basis and reference to ensure the highest quality Maintenance Program, and to maintain a fleet while minimizing service interruptions and road calls. In doing so, provide safe, clean and dependable equipment at the lowest cost possible. Further, this document is to outline the maintenance program for the MV Transportation employed by VCTC for the provision of services to the Valley Express Transit system. The Vehicle Maintenance Plan is intended for use as a management tool for ongoing evaluation and monitoring of the Maintenance Program, based on policies, goals and objectives, industry standards and accepted maintenance procedures, including training and planning functions.
MV Transportation Maintenance Department Procedure Manual
A procedure manual for the maintenance department of MV Transportation that includes policy, procedures and guidance related to safety, vehicle maintenance, facility maintenance, mantenance training and asset management.
Trapeze Equipment Asset Manaegent (T-EAM) Fleet Focus maintenance software
A Maintenance Information System (MIS) is essential for scheduling of maintenance activities and for controlling labor and material costs. Another major benefit of MIS is the ability to evaluate the effects of changes in maintenance procedures and policies. MV Transportation uses the Trapeze Equipment Asset Management (T-EAM) – (Fleet Focus) fleet maintenance software to track maintenance activities, work-orders, parts inventory, etc. The T-EAM system can identify labor and material costs to specific job procedures and maintenance functions.

Ventura County Transportation Commission 2018 Ventura County Group TAM Plan
Page 18
and another five (5) replacement vehicles by 2022 at an approximate cost of $735,000*. Table 2.5.1. Valley Express Fleet Replacement Yearly Expenditures (2019-2023)
* An annual 3.5% inflation rate was factored into future expenditures. The following table illustrates the capital investments that are needed over the four (4) year horizon of the TAM Plan (2019-2023) for the Valley Express service. Group TAM Plan performance targets advise that no more than 10% of rolling stock should exceed their ULB in a given year. The following list is based on anticipated funding and a “high” priority applied to fleet replacement: Table 2.5.2. Valley Express Prioritized List of Investments (2019-2023)
Total in Current Year $Inflation RateCompounded InflationTotal in Year of Expenditure $
Fleet Type (Year/Make/Model)
Number Cost in 2018 $ Number Cost in 2018 $ Number Cost in 2018 $ Number Cost in 2018 $ Number Cost in 2018 $
2014 Chevorlet 23 PAX Lowfloor 0 $0.00 0 $0.00 0 $0.00 5 $710,000.00 0 $0.00
2014 Chevorlet 12 PAX DAR 0 $0.00 5 $360,000.00 0 $0.00 0 $0.00 0 $0.00
2014 Chevorlet 16 PAX DAR 0 $0.00 5 $420,000.00 0 $0.00 0 $0.00 0 $0.00
$0.000.0% 3.5% 3.5% 3.5% 3.5%
1.035
$734,850.00
1.035
2020 2021 2022 2023
$0.00
1.035
2019
$0.00 $807,300.00 $0.00
1.035
$0.00 $780,000.00 $0.00 $710,000.00
1
Project Year Project Name Asset/Asset Class Cost Priority Funding Source2020 Valley Express Vehicle Replacement (10) Revenue Vehicles 807,000$ High TBD2022 Valley Express Vehicle Replacement (5) Revenue Vehicles 735,000$ High TBD

Ventura County Transportation Commission 2018 Ventura County Group TAM Plan
Page 19
3 VCTC Intercity Transit
3.1 Overview of VCTC Intercity Service
Intercity Service provides commuter bus service on eight (8) routes linking the cities of Ventura County and providing connections to neighboring Santa Barbara and Los Angeles Counties. The service includes the following routes: the Coastal Express connects Ventura to the cities of Goleta, Carpinteria and Santa Barbara in Santa Barbara County; Highway 101/Conejo Connection travels along Highway 101 from Ventura to destinations eastward including Oxnard, Camarillo, Newbury Park, Thousand Oaks and the Warner Center; the East County route travels on Highway 23 connecting Moorpark to Thousand Oaks; the East-West Connector launched in 2017 is a direct connection for commuters traveling from Simi Valley and Moorpark to Oxnard and Ventura; the CSUCI Connector routes provide service to students and faculty of California State University Chanel Islands (CSUCI) from the communities of Oxnard and Camarillo; the Highway 126 route connects the cities of Fillmore and Santa Paula to Ventura. Overall, VCTC Intercity Service serves one-hundred and fifteen (115) bus stop locations across the region with a total annual ridership of more than 720,000 passenger trips. VCTC Intercity Service operates with a fleet of thirty-two (32) commuter coaches owned or leased in partnership with the contracted operator RATP Dev (formerly Roadrunner).
3.2 VCTC Intercity Asset Inventory Portfolio
Intercity service is administered by VCTC with operations contracted out to RATP Dev. VCTC Intercity’s asset inventory consists of thirty-two (32) revenue vehicles and one (1) non-revenue/service vehicle. VCTC owns fourteen (14) over-the road buses while RATP Dev owns or leases the remainder of the fleet. The following table summarizes the fleet of revenue vehicles and shows an average age of 3.6 years and average mileage of 235,500 per coach. Average vehicle mileage is relatively high but is customary and consistent with the long distant nature of inter-city commuter service.

Ventura County Transportation Commission 2018 Ventura County Group TAM Plan
Page 20
Table 3.2. VCTC Intercity Asset Inventory
Asset Category/ClassTotal
NumberAvg Age
Avg Mileage
Avg Value
RevenueVehicles 32 3.6 235,527 $724,868.75AB - Articulated Bus 0 - - -AO - Automobile 0 - - -BR - Over-the-road Bus 32 3.6 235,527 $724,868.75BU - Bus 0 - - -CU - Cutaway Bus 0 - - -DB - Double Decked Bus 0 - - -FB - Ferryboat 0 - - -MB - Mini-bus 0 - - -MV - Mini-van 0 - - -RT - Rubber-tire Vintage Trolley 0 - - -SB - School Bus 0 - - -SV - Sport Utility Vehicle 0 - - -TB - Trolleybus 0 - - -VN - Van 0 - - -Custom 1 0 - - -Custom 2 0 - - -Custom 3 0 - - -Equipment 1 19.0 375,590 $80,800.00Non Revenue/Service Automobile 1 19.0 375,590 $80,800.00Steel Wheel Vehicles 0 - - -Trucks and other Rubber Tire Vehicles 0 - - -Custom 1 0 - - -Custom 2 0 - - -Custom 3 0 - - -Facilities 0 - N/A -Administration 0 - N/A -Maintenance 0 - N/A -Parking Structures 0 - N/A -Passenger Facilities 0 - N/A -Administration/Maintenance 0 - N/A -Custom 2 0 - N/A -Custom 3 0 - N/A -

Ventura County Transportation Commission 2018 Ventura County Group TAM Plan
Page 21
3.3 VCTC Intercity Asset Condition Assessment
The following table provides a detailed listing of Intercity assets (revenue vehicles and equipment, i.e. non-revenue vehicles) and their respective conditions measured as age in relation to the designated Useful Life Benchmark (ULB). All Intercity coaches assume a ULB of ten (10) years based on the local operating environment including the service area, historical maintenance records and manufacturer guidelines. VCTC Intercity trips average 17 miles and Intercity coaches average 90,000 miles annually. Currently (2018), three (3) revenue vehicles exceed their ULB and one (1) non-revenue vehicles exceeds its ULB. Table 3.3. VCTC Intercity Asset Condition Assessment
Asset Category Asset Class Count ID/Serial No. Age (Yrs) Vehicle MileageReplacement
Cost/Value
Useful Life Benchmark
(Yrs)
Past Useful Life
Benchmark
RevenueVehicles BR - Over-the-road Bus 1 990 10 314,458 $733,400.00 10 YesRevenueVehicles BR - Over-the-road Bus 1 994 10 330,898 $733,400.00 10 YesRevenueVehicles BR - Over-the-road Bus 1 995 10 302,190 $733,400.00 10 YesRevenueVehicles BR - Over-the-road Bus 1 981 5 364,204 $690,000.00 10 NoRevenueVehicles BR - Over-the-road Bus 1 V301 3 221,305 $717,000.00 10 NoRevenueVehicles BR - Over-the-road Bus 1 V302 3 226,330 $717,000.00 10 NoRevenueVehicles BR - Over-the-road Bus 1 V303 3 246,025 $717,000.00 10 NoRevenueVehicles BR - Over-the-road Bus 1 V304 3 219,318 $717,000.00 10 NoRevenueVehicles BR - Over-the-road Bus 1 V305 3 261,728 $717,000.00 10 NoRevenueVehicles BR - Over-the-road Bus 1 V306 3 230,479 $717,000.00 10 NoRevenueVehicles BR - Over-the-road Bus 1 V307 3 247,616 $717,000.00 10 NoRevenueVehicles BR - Over-the-road Bus 1 V308 3 241,526 $717,000.00 10 NoRevenueVehicles BR - Over-the-road Bus 1 V309 3 223,346 $717,000.00 10 NoRevenueVehicles BR - Over-the-road Bus 1 V310 3 241,156 $717,000.00 10 NoRevenueVehicles BR - Over-the-road Bus 1 V311 3 251,564 $717,000.00 10 NoRevenueVehicles BR - Over-the-road Bus 1 V312 3 202,560 $717,000.00 10 NoRevenueVehicles BR - Over-the-road Bus 1 V313 3 270,385 $717,000.00 10 NoRevenueVehicles BR - Over-the-road Bus 1 V314 3 204,844 $717,000.00 10 NoRevenueVehicles BR - Over-the-road Bus 1 V315 3 241,110 $733,400.00 10 NoRevenueVehicles BR - Over-the-road Bus 1 V316 3 187,556 $733,400.00 10 NoRevenueVehicles BR - Over-the-road Bus 1 V317 3 226,218 $733,400.00 10 NoRevenueVehicles BR - Over-the-road Bus 1 V318 3 283,665 $733,400.00 10 NoRevenueVehicles BR - Over-the-road Bus 1 V319 3 264,123 $733,400.00 10 NoRevenueVehicles BR - Over-the-road Bus 1 V320 3 222,044 $733,400.00 10 NoRevenueVehicles BR - Over-the-road Bus 1 V321 3 234,129 $733,400.00 10 NoRevenueVehicles BR - Over-the-road Bus 1 V322 3 265,332 $733,400.00 10 NoRevenueVehicles BR - Over-the-road Bus 1 V323 3 280,478 $733,400.00 10 NoRevenueVehicles BR - Over-the-road Bus 1 V324 3 229,082 $733,400.00 10 NoRevenueVehicles BR - Over-the-road Bus 1 V325 3 220,670 $733,400.00 10 NoRevenueVehicles BR - Over-the-road Bus 1 V330 2 106,444 $733,400.00 10 NoRevenueVehicles BR - Over-the-road Bus 1 V331 1 81,586 $733,400.00 10 NoRevenueVehicles BR - Over-the-road Bus 1 V332 1 94,491 $733,400.00 10 No
Equipment Non Revenue/Service Automobile 1 RRF350 19 375,590 $80,800.00 10 No

Ventura County Transportation Commission 2018 Ventura County Group TAM Plan
Page 22
3.4 VCTC Intercity Decision Support Tools & Management Approach
VCTC partners with Intercity service operator RATP Dev (formerly Roadrunner) to ensure quality TAM. The following documents/tools support the collaborative effort of managing Intercity service’s transit assets.
Tool DescriptionRoadrunner Maintenance Plan
The purpose of this maintenance guide is to provide a written guideline for all maintenance and inspection procedures as well as training and safety standards for all maintenance personnel. This plan includes the following components:▪ A written maintenance plan describing the roles of maintenance personnel, fueler/detail personnel, and ▪ A written set of goals and objectives for the maintenance department and personnel ▪ A written process for documenting maintenance and repair procedures▪ A written process describing safety inspections▪ A written process to identify equipment defects▪ A safety/hazard communication plan▪ A written Employee Training Guideline and Procedure▪ A written process for integrating new equipment into the fleet maintenance plan▪ A written process detaining procedures to manage break-down or road call situations▪ A written policy to conform to manufacturer’s warranty policies▪ A facility maintenance and inspection plan
Fleetmate Software A Maintenance Information System (MMIS) is essential for the scheduling of maintenance activities and controlling labor and material costs. MMIS software does not replace effective maintenance program, but is a useful tool to monitor mechanic performance, maintenance costs, and maintain vehicle repair and inspection records. Roadrunner uses the “Fleetmate” Enterprise Edition software program. The Fleetmate software allows record keeping and the ability to:
▪ Generate and track work orders▪ Track and schedule PM inspections and services▪ Track services performed externally▪ Labor details, including technician information▪ Vehicle licensing information▪ Assign costs to various cost centers▪ Update and maintain a parts inventory▪ Issue purchase orders▪ Retain insurance due dates ▪ Document road calls▪ Maintain a list of approved vendors▪ Document warranty repairs▪ Generate reports as needed to assure compliance with inspection requirements▪ Provide specific maintenance and repair costs by various factors (cost per mile, per vehicle type, etc.)▪ Track vehicle costs that are abnormal to assist in replacing high maintenance cost vehicles

Ventura County Transportation Commission 2018 Ventura County Group TAM Plan
Page 23
In addition, the following documents provide policy and guidance for decision-making in support of Transit Asset Management (TAM) on a regional level:
Tool DescriptionTAM Plan Ventura County's Group TAM Plan is a document containing a
business model that uses the condition of assets (facility, rolling stock, and equipment) used in the provision of providing public transportation to help guide the optimal prioritization of funding in order to keep the participating agencies’ transit system in a state of good repair (SGR). The TAM Plan also contains information related to data collection and reporting requirements for the following: asset inventory portfolio, asset condition assessment, decision support tools and management approach, investment prioritization, and NTD annual reporting to comply with the TAM Ruling.
Ventura County Short Range Transit Plan (SRTP) Vehicle Acquisition Plan
The SRTP Vehicle Acquisition Plan summarizes fixed-route and paratransit vehicle acquisition needs for all transit providers within Ventura County. The countywide "Vehicle Acquisition Plan" schedule provided therein helps allocate funding and assist in asset management.
SCAG Metropolitian Planning Organization (MPO) Federal Transportation Improvement Program (FTIP)
FTIP is a federally mandated four year program of all surface transportation projects that will receive federal funding or are subject to a federally required action. The FTIP is a comprehensive listing of such transportation projects proposed over a six-year period. As the MPO for the region, SCAG is responsible for developing the FTIP for submittal to Caltrans and the federal funding agencies. The FTIP for the SCAG region is developed in partnership between the six County Transportation Commissions (CTCs) of Imperial, Los Angeles, Orange, Riverside, San Bernardino, and Ventura as well as Caltrans Districts 7, 8, 11, 12 and Headquarters. This listing identifies specific funding sources and fund amounts for each project. It is prioritized to implement the region’s overall strategy for providing mobility and improving both the efficiency and safety of the transportation system, while supporting efforts to attain federal and state air quality standards for the region by reducing transportation related air pollution.
Ventura County Congestion Management Program (CMP)
The Ventura County CMP provides local agencies the procedures and tools necessary to manage and decrease traffic congestion in the County. The CMP includes a chapter on Transit Systems that describe current rail, bus and paratransit services in the County including defining the performance measures for each service type for analysis as part of the CMP.
Procurement Manual This document represents VCTC’s procurement policies and procedures for all aspects of contract administration and was developed based on California Government and Public Contract Codes and the federal procurement procedures found in 2 CFR Part 200 and Federal Transit Administration (FTA) Circular 4220.1F. The purpose of these procurement standards and procedures is to ensure that materials and services are obtained in an effective manner and in compliance with state and federal requirements.

Ventura County Transportation Commission 2018 Ventura County Group TAM Plan
Page 24
3.5 VCTC Intercity Prioritized List of Investments
An investment prioritization analysis was performed on the existing Intercity Fleet using the FTA’s “Fleet Retirement and Replacement Computation Module” to produce a yearly expenditures schedule. Taking into account the assessed condition of the Intercity revenue vehicles to determine when and at what cost the fleet type (year/make/model) should be replaced over the four (4) year Plan, the analysis generated a replacement schedule. The following table shows the required purchase for each fleet type per year over the four (4) year period, beginning in 2019, based on a vehicle age in excess of ULB replacement formula. To maintain current level of service (LOS), an FTA recommended 20% spare ratio, and to ensure safe and reliable service by meeting SGR, three (3) replacement vehicles are to be purchased by 2019 at a cost of approximately $2,300,000* to replace the coaches that have exceeded their ULB. Table 3.5.1. Intercity Total Expenditure for Fleet Replacement (2019-2023)
* An annual 3.5% inflation rate was factored into future expenditures.
Total in Current Year $Inflation RateCompounded InflationTotal in Year of Expenditure $
Fleet Type (Year/Make/Model)
Number Cost in 2018 $ Number Cost in 2018 $ Number Cost in 2018 $ Number Cost in 2018 $ Number Cost in 2018 $
2015 MCI D4500 0 $0.00 0 $0.00 0 $0.00 0 $0.00 0 $0.00
2015 MCI D4505 0 $0.00 0 $0.00 0 $0.00 0 $0.00 0 $0.00
2016 MCI D4500 0 $0.00 0 $0.00 0 $0.00 0 $0.00 0 $0.00
2017 MCI D4500 0 $0.00 0 $0.00 0 $0.00 0 $0.00 0 $0.00
2013 VOLVO 9700 0 $0.00 0 $0.00 0 $0.00 0 $0.00 0 $0.00
2008 MCI J4500 1 $733,400.00 0 $0.00 0 $0.00 0 $0.00 0 $0.00
2008 MCI D4505 2 $1,466,800.00 0 $0.00 0 $0.00 0 $0.00 0 $0.00
$0.003.5% 3.5% 3.5% 3.5% 3.5%
1.035
$0.00
1.035
2020 2021 2022 2023
$0.00
1.035
2019
$2,277,207.00 $0.00 $0.00
1.035
$2,200,200.00 $0.00 $0.00 $0.00
1.035

Ventura County Transportation Commission 2018 Ventura County Group TAM Plan
Page 25
The table below lists VCTC Intercity’s current prioritized investment schedule. The bus replacement project listed below has secured funding through Congestion Mitigation and Air Quality (CMAQ) Program funds and is currently on order with delivery expected by 2019. Table 3.5.2. Intercity Prioritized List of Investments (2019-2023)
Project Year Project Name Asset/Asset Class Cost Priority Funding Source2019 VCTC Intercity Vehicle Replacement Purchase (3) Revenue Vehicles 2,151,000$ High CMAQ

Ventura County Transportation Commission 2018 Ventura County Group TAM Plan
Page 26
4 Camarillo Area Transit (CAT)
4.1 Overview of CAT Service
Camarillo Area Transit provides transit service within the city of Camarillo. CAT operates general purpose dial-a-ride daily. CAT also operates a fixed-route service Monday through Friday and a trolley route daily. While the general purpose DAR is limited to the city boundaries, CAT provides DAR service for senior and ADA passengers to the surrounding unincorporated areas as well as to the East County Transit Alliance (ECTA) service area.
4.2 CAT Asset Inventory Portfolio
The CAT Service currently operates with seventeen (17) revenue vehicles, all owned by the City of Camarillo. The service itself is operated by a contractor, RATP Dev/Roadrunner Shuttle. The vehicles average an approximate age of 2.2 years and have logged as of 2018 approximately 87,000 miles on average. CAT revenue vehicles include ten (10) cutaway buses and seven (7) mini-vans. Table 4.2. CAT Asset Inventory Portfolio
Asset Category/ClassTotal
NumberAvg Age
Avg Mileage
Avg Value
RevenueVehicles 17 2.2 76,378 $87,058.82AB - Articulated Bus 0 - - -AO - Automobile 0 - - -BR - Over-the-road Bus 0 - - -BU - Bus 0 - - -CU - Cutaway Bus 10 1.9 59,841 $102,000.00DB - Double Decked Bus 0 - - -FB - Ferryboat 0 - - -MB - Mini-bus 0 - - -MV - Mini-van 7 2.6 100,004 $65,714.29RT - Rubber-tire Vintage Trolley 0 - - -SB - School Bus 0 - - -SV - Sport Utility Vehicle 0 - - -TB - Trolleybus 0 - - -VN - Van 0 - - -Custom 1 0 - - -Custom 2 0 - - -

Ventura County Transportation Commission 2018 Ventura County Group TAM Plan
Page 27
4.3 CAT Asset Condition Assessment
CAT currently has one (1) revenue vehicle past its ULB, a 2010 Dodge Entervan mini-van meeting its 8 year ULB threshold this year (2018) with more than 180,000 miles. Two (2) revenue vehicles were replaced in 2018, a mini-van and a cutaway bus. No other vehicles are expected to reach their ULB during the Plan’s 4 year horizon (2019-2023). Table 4.3. CAT Asset Condition Assessment
4.4 CAT Decision Support Tools & Management Approach
The contract between the City of Camarillo and the CAT service operator, Roadrunner Shuttle, stipulates vehicle maintenance and facility and equipment standards, as a supplement to Roadrunner’s established company policies. The contract outlines reporting procedures for preventative maintenance and inspections required by the City of Camarillo. Revenue vehicle replacement is planned when the vehicle reaches its ULB.
Revenue Vehicles Condition Table**Age is the surrogate performance measure for condition as determined by the FTA.
Asset Category Asset ClassAsset Name
CountID/Serial
No.Age (Yrs)
Vehicle Mileage
Replacement Cost/Value
Useful Life Benchmark
(Yrs)
Past Useful Life
BenchmarkRevenueVehicles CU - Cutaway Bus CAT 807 1 0 5 98,582 $130,000.00 10 NoRevenueVehicles CU - Cutaway Bus CAT 809 1 0 3 63,688 $90,000.00 10 NoRevenueVehicles CU - Cutaway Bus CAT 820 1 0 2 81,710 $90,000.00 10 NoRevenueVehicles CU - Cutaway Bus CAT 821 1 0 2 78,150 $90,000.00 10 NoRevenueVehicles CU - Cutaway Bus CAT 822 1 0 3 93,934 $130,000.00 10 NoRevenueVehicles CU - Cutaway Bus CAT 823 1 0 2 70,621 $130,000.00 10 NoRevenueVehicles CU - Cutaway Bus CAT 826 1 0 1 53,793 $90,000.00 10 NoRevenueVehicles CU - Cutaway Bus CAT 827 1 0 1 49,049 $90,000.00 10 NoRevenueVehicles CU - Cutaway Bus CAT 828 1 0 0 8,130 $90,000.00 10 NoRevenueVehicles CU - Cutaway Bus CAT 831 1 0 0 750 $90,000.00 10 NoRevenueVehicles MV - Mini-van CAT 815 1 0 8 182,896 $65,000.00 8 YesRevenueVehicles MV - Mini-van CAT 818 1 0 4 168,106 $65,000.00 8 NoRevenueVehicles MV - Mini-van CAT 819 1 0 4 161,526 $65,000.00 8 NoRevenueVehicles MV - Mini-van CAT 824 1 0 1 79,920 $65,000.00 8 NoRevenueVehicles MV - Mini-van CAT 825 1 0 1 83,408 $65,000.00 8 NoRevenueVehicles MV - Mini-van CAT 829 1 0 0 23,248 $65,000.00 8 NoRevenueVehicles MV - Mini-van CAT 830 1 0 0 923 $70,000.00 8 No

Ventura County Transportation Commission 2018 Ventura County Group TAM Plan
Page 28
4.5 CAT Prioritized List of Investments
TAM Plans require a prioritized list of projects or programs to manage or improve the SGR of capital assets. An investment prioritization analysis was performed on the existing CAT Fleet using the FTA’s “Fleet Retirement and Replacement Computation Module” to produce a yearly expenditures schedule beginning in 2019 through 2023, as shown in Table 4.5.1. Based on the analysis, in order to meet SGR, CAT would need to replace one (1) 2010 Dodge Entervan mini-van in 2019 at a cost of approximately $67,275. No other CAT fleet investment needs are forecasted during the plan’s 4 year horizon. Table 4.5.1. CAT New Fleet Expenditures (2019-2023)
* An annual 3.5% inflation rate was factored into future expenditures.
Total in Current Year $Inflation RateCompounded InflationTotal in Year of Expenditure $
Fleet Type (Year/Make/Model)
Number Cost in 2018 $ Number Cost in 2018 $ Number Cost in 2018 $ Number Cost in 2018 $ Number Cost in 2018 $
2013 Glaval Entourage 0 $0.00 0 $0.00 0 $0.00 0 $0.00 0 $0.00
2018 Ford Challenger 0 $0.00 0 $0.00 0 $0.00 0 $0.00 0 $0.00
2015 El Dorado National 0 $0.00 0 $0.00 0 $0.00 0 $0.00 0 $0.00
2010 Dodge Entervan 1 $65,000.00 0 $0.00 0 $0.00 0 $0.00 0 $0.00
2018 Ford Trasnit-350 0 $0.00 0 $0.00 0 $0.00 0 $0.00 0 $0.00
2014 Dodge Entervan 0 $0.00 0 $0.00 0 $0.00 0 $0.00 0 $0.00
2016 Glaval Titain 0 $0.00 0 $0.00 0 $0.00 0 $0.00 0 $0.002015 Chevy Arboc 0 $0.00 0 $0.00 0 $0.00 0 $0.00 0 $0.002016 Glaval Entourage 0 $0.00 0 $0.00 0 $0.00 0 $0.00 0 $0.002017 Dodge Entervan 0 $0.00 0 $0.00 0 $0.00 0 $0.00 0 $0.00
2017 Glaval Titain 0 $0.00 0 $0.00 0 $0.00 0 $0.00 0 $0.00
2018 Glaval Titain 0 $0.00 0 $0.00 0 $0.00 0 $0.00 0 $0.00
2018 Dodge Entervan 0 $0.00 0 $0.00 0 $0.00 0 $0.00 0 $0.00
2019
$67,275.00 $0.00 $0.00
1.035
$65,000.00 $0.00 $0.00 $0.00
1.035 1.035
$0.00
1.035
2020 2021 2022 2023
$0.00
1.035
$0.003.5% 3.5% 3.5% 3.5% 3.5%

Ventura County Transportation Commission 2018 Ventura County Group TAM Plan
Page 29
The following table represents CAT’s List of Investments for the Plan’s 4 year horizon which includes the 2019 mini-van replacement due to an expiring useful life. Table 4.5.2. CAT Prioritized List of Investments for 2019-2023
Project Year Project Name Asset/Asset Class Cost Priority Funding Source2019 Camarillo Vehicle Replacement (1) Revenue Vehicles 67,725$ High TBD

Ventura County Transportation Commission 2018 Ventura County Group TAM Plan
Page 30
5 Moorpark City Transit (MCT)
5.1 Overview of MCT Service
MCT, located in Moorpark, CA provides an average of 60,000 trips annually with two fixed-routes. MCT's fixed-route bus service provides connections with Metrolink and Amtrak at the Moorpark Metrolink Train Station. The fixed-route bus service connects to communities within Ventura County with transfer opportunities to the VCTC Intercity East County and East-West Connector bus services at the Moorpark Metrolink Train Station and Moorpark College. Additionally, MCT provides approximately 1,800 paratransit trips (ADA and Seniors) annually throughout the City. The City also participates in the ECTA, which provides inter-city paratransit services. The ECTA transports an average of 3,300 trips for Moorpark residents per year. The City of Moorpark has a population of approximately 36,828 residents, and is approximately 12.44 square miles.
5.2 MCT Asset Inventory Portfolio
The City of Moorpark owns five (5) revenue vehicles with one vehicle leased to the City of Thousand Oaks. The five vehicles’ average age is close to six years with an average mileage approaching 190,000. Table 5.2. Moorpark City Transit Asset Inventory Portfolio
Asset Category/Class Total Number Avg Age Avg Mileage Avg ValueRevenueVehicles 5 5.6 188,446 $455,000.00AB - Articulated Bus 0 - - -AO - Automobile 0 - - -BR - Over-the-road Bus 0 - - -BU - Bus 5 5.6 188,446 $455,000.00CU - Cutaway Bus 0 - - -DB - Double Decked Bus 0 - - -FB - Ferryboat 0 - - -MB - Mini-bus 0 - - -MV - Mini-van 0 - - -RT - Rubber-tire Vintage Trolley 0 - - -SB - School Bus 0 - - -SV - Sport Utility Vehicle 0 - - -TB - Trolleybus 0 - - -VN - Van 0 - - -

Ventura County Transportation Commission 2018 Ventura County Group TAM Plan
Page 31
5.3 MCT Asset Condition Assessment
The following table represents the condition assessment of MCT fleet as defined by the age of the vehicle in relation to ULB. Following the standard definition, no MCT vehicles currently (2018) exceed their ULB of 12 years; therefore, all vehicles meet a SGR.
Table 5.3. MCT Asset Condition Assessment
5.4 MCT Decision Support Tools & Management Approach
The following outlines MCT’s approach to TAM:
Acquisition and Renewal Strategy Assets are replaced at time of useful life expiration. The City adopted the FTA’s useful life determination (see Table 1 in Appendix) when calculating the ULB and replacement of City buses, and also takes into account safety assurances. Preventive maintenance is performed to ensure buses continue to operate throughout their useful life. Sufficient “contingency” funding is available for maintenance expenses. Bus acquisition is dependent on grant funding. The City is currently exploring the option of engine rebuilds for the 2022 bus replacement schedule (3 buses). The City is also exploring the option of ending bus ownership and instead leasing buses from the contracted service provider. Disposal Strategy The City uses its contracted auction service provider (Ken Porter) when disposing of buses after replacement buses have arrived and been placed into revenue service. Ken Porter auctions the vehicles; any revenue received from the auctioned vehicles is placed into transit service account for expenditures. Auction results are reported to VCTC.
Asset CategoryAsset Class
Asset Name
CountID/Serial
No.Age (Yrs)
Vehicle Mileage
Replacement Cost/Value
Useful Life Benchmark
(Yrs)
Past Useful Life Benchmark
RevenueVehicles BU - Bus 66460 1 4295 8 219,181 $455,000.00 12 NoRevenueVehicles BU - Bus 66461 1 4296 8 283,252 $455,000.00 12 NoRevenueVehicles BU - Bus 66462 1 4297 8 250,655 $455,000.00 12 NoRevenueVehicles BU - Bus 66463 1 4190 2 87,066 $455,000.00 12 NoRevenueVehicles BU - Bus 66464 1 4191 2 102,075 $455,000.00 12 No

Ventura County Transportation Commission 2018 Ventura County Group TAM Plan
Page 32
Risk Management and Maintenance Strategy Thousand Oaks Transit is Moorpark’s contracted maintenance provider. As such, the City relies on the City of Thousand Oaks’ preventive maintenance program to keep MCT buses operating in a safe manner. Please refer to Section 7.4 of this Plan for the City of Thousand Oaks’ asset management approach and decision support tools.
5.5 MCT Prioritized List of Investments
An investment prioritization analysis was performed on the existing MCT Fleet using the FTA’s “Fleet Retirement and Replacement Computation Module” to produce a yearly expenditures schedule. Assets are replaced at time of useful life expiration. With this formula, the analysis generated a replacement schedule. The following table shows the required purchase for each fleet type per year over the four (4) year period, beginning in 2019, based on the established replacement formula. The analysis determined that three (3) 2010 El Dorado EZ Rider II buses are identified for replacement by 2023 at an approximate cost of $1,412,775* in order to maintain a SGR. Table 5.5.1. MCT New Fleet Expenditures (2019-2023)
* An annual 3.5% inflation rate was factored into future expenditures.
Total in Current Year $Inflation RateCompounded InflationTotal in Year of Expenditure $
Fleet Type (Year/Make/Model)
Number Cost in 2018 $ Number Cost in 2018 $ Number Cost in 2018 $ Number Cost in 2018 $ Number Cost in 2018 $
2010 El Dorado EZ Rider II 0 $0.00 0 $0.00 0 $0.00 0 $0.00 3 $1,365,000.00
2016 El Dorado EZ Rider II 0 $0.00 0 $0.00 0 $0.00 0 $0.00 0 $0.00
2019
$0.00 $0.00 $0.00
1.035
$0.00 $0.00 $0.00 $0.00
1.035 1.035
$0.00
1.035
2020 2021 2022 2023
$1,412,775.00
1.035
$1,365,000.003.5% 3.5% 3.5% 3.5% 3.5%

Ventura County Transportation Commission 2018 Ventura County Group TAM Plan
Page 33
The following table represents MCT’s Planned List of Investments for the Plan’s 4 year horizon and includes an anticipated three (3) bus acquisition in 2023 to be purchased with grant funding to replace expiring El Dorados at a cost of approximately $1.413 million.
Table 5.5.2. MCT Prioritized List of Investments for 2019-2023
Project Year Project Name Asset/Asset Class Cost Priority Funding Source2022 Moorpark Vehicle Replacement (3) RevenueVehicles 1,412,775$ High TBD

Ventura County Transportation Commission 2018 Ventura County Group TAM Plan
Page 34
6 Simi Valley Transit (SVT)
6.1 Overview of SVT Service
SVT, located in Simi Valley, CA provides 380,000 rides annually with four fixed-routes servicing the City of Simi Valley. Additionally, SVT transports approximately 44,000 paratransit passengers (ADA and Seniors) annually throughout the City. Transportation to communities within Ventura County is made possible through connections with the Ventura County VCTC East County Intercity line at the Simi Valley Town Center Mall. The City of Simi Valley’s fixed-route bus service provides connections with Los Angeles County’s METRO in the San Fernando Valley community of Chatsworth. The City of Simi Valley has an estimated population of 127, 000 residents and occupies an area of approximately 42 square miles.
6.2 SVT Asset Inventory Portfolio
The following table provides a summary of SVT assets in 2018. The City owns their entire fleet of twenty-two (22) revenue vehicles including eleven (11) buses averaging 5 years of age and approximately 140,000 miles, and eleven (11) cutaway buses averaging 3 years of age and approximately 50,000 miles. Simi’s transit assets also include seven (7) non-revenue vehicles with an average age of 18 years and over 100,000 miles. In addition, the City of Simi Valley owns the Simi Valley Transit Maintenance Facility valued at over $4 million.

Ventura County Transportation Commission 2018 Ventura County Group TAM Plan
Page 35
Table 6.2. SVT Asset Inventory Portfolio
Asset Category/ClassTotal
NumberAvg Age Avg Mileage Avg Value
RevenueVehicles 22 5.0 137,316 $ 317,500.00 AB - Articulated Bus 0 - - -
AO - Automobile 0 - - - BR - Over-the-road Bus 11 6.9 227,758 $ 425,000.00
BU - Bus 0 - - - CU - Cutaway Bus 11 3.0 46,874 $ 210,000.00
DB - Double Decked Bus 0 - - - FB - Ferryboat 0 - - - MB - Mini-bus 0 - - - MV - Mini-van 0 - - -
RT - Rubber-tire Vintage Trolley 0 - - - SB - School Bus 0 - - -
SV - Sport Utility Vehicle 0 - - - TB - Trolleybus 0 - - -
VN - Van 0 - - - Custom 1 0 - - - Custom 2 0 - - - Custom 3 0 - - -
Equipment 7 17.9 105,697 $ 25,701.43 Non Revenue/Service Automobile 7 17.9 105,697 $ 25,701.43
Steel Wheel Vehicles 0 - - - Trucks and other Rubber Tire Vehicles 0 - - -
Custom 1 0 - - - Custom 2 0 - - - Custom 3 0 - - - Facilities 1 29.0 N/A $ 4,110,560.00
Administration 1 29.0 N/A $ 4,110,560.00 Maintenance 0 - N/A -
Parking Structures 0 - N/A - Passenger Facilities 0 - N/A -
Custom 1 0 - N/A - Custom 2 0 - N/A - Custom 3 0 - N/A -

Ventura County Transportation Commission 2018 Ventura County Group TAM Plan
Page 36
6.3 SVT Asset Condition Assessment
Revenue Vehicles The following table provides SVT Asset Condition Assessment for revenue vehicles. Two (2) buses have reached their ULB of 14 years as of 2018. The remaining fleet range between 6-10 years removed from reaching their respective ULB at the present time (2018) and therefore meet a SGR. Table 6.3.1. SVT Revenue Vehicle Asset Condition Assessment
Equipment (includes non-revenue vehicles) All of Simi Valley’s non-revenue vehicles are past their ULB of 12 years as of 2018 as shown in the following table:
Asset Category Asset Class CountID/Serial
No.Age (Yrs)
Vehicle Mileage
Replacement Cost/Value
Useful Life Benchmark
(Yrs)
Past Useful Life
BenchmarkRevenueVehicles BR - Over-the-road Bus 1 4524 14 261,000 $425,000 14 YesRevenueVehicles BR - Over-the-road Bus 1 4525 14 274,614 $425,000 14 YesRevenueVehicles BR - Over-the-road Bus 1 4526 8 348,594 $425,000 14 NoRevenueVehicles BR - Over-the-road Bus 1 4527 8 336,600 $425,000 14 NoRevenueVehicles BR - Over-the-road Bus 1 4528 8 330,182 $425,000 14 NoRevenueVehicles BR - Over-the-road Bus 1 4529 4 159,728 $425,000 14 NoRevenueVehicles BR - Over-the-road Bus 1 4530 4 167,274 $425,000 14 NoRevenueVehicles BR - Over-the-road Bus 1 4531 4 175,201 $425,000 14 NoRevenueVehicles BR - Over-the-road Bus 1 4532 4 158,368 $425,000 14 NoRevenueVehicles BR - Over-the-road Bus 1 4533 4 161,585 $425,000 14 NoRevenueVehicles BR - Over-the-road Bus 1 4534 4 132,187 $425,000 14 NoRevenueVehicles CU - Cutaway Bus 1 6025 3 49,878 $210,000 10 NoRevenueVehicles CU - Cutaway Bus 1 6026 3 52,869 $210,000 10 NoRevenueVehicles CU - Cutaway Bus 1 6027 3 51,599 $210,000 10 NoRevenueVehicles CU - Cutaway Bus 1 6028 3 49,738 $210,000 10 NoRevenueVehicles CU - Cutaway Bus 1 6029 3 53,784 $210,000 10 NoRevenueVehicles CU - Cutaway Bus 1 6030 3 42,654 $210,000 10 NoRevenueVehicles CU - Cutaway Bus 1 6031 3 52,486 $210,000 10 NoRevenueVehicles CU - Cutaway Bus 1 6032 3 46,788 $210,000 10 NoRevenueVehicles CU - Cutaway Bus 1 6033 3 45,648 $210,000 10 NoRevenueVehicles CU - Cutaway Bus 1 6034 3 44,895 $210,000 10 NoRevenueVehicles CU - Cutaway Bus 1 6035 3 25,275 $210,000 10 No

Ventura County Transportation Commission 2018 Ventura County Group TAM Plan
Page 37
Table 6.3.2. SVT Non-Revenue Vehicles Condition Assessment
Facilities Simi Valley’s Transit Maintenance Facility was assessed a TERM Scale Condition Rating of 4.0, a “good” rating which generally means “an asset in good condition, but no longer new, may have some slightly defective or deteriorated components but is overall functional.” Assets with a condition score of 3.0 or higher are considered to be in a SGR. Table 6.3.3. Simi Valley Transit Facilities Condition Assessment
Asset Category
Asset Class CountID/Serial
No.Age (Yrs)
Vehicle Mileage
Replacement Cost/Value
Useful Life Benchmark
(Yrs)
Past Useful Life
Benchmark
EquipmentNon Revenue/Service Automobile 1 7004
21138,328 $22,215.00 12 Yes
EquipmentNon Revenue/Service Automobile 1 408
1984,206 $24,120.00 12 Yes
EquipmentNon Revenue/Service Automobile 1 5000
1973,693 $24,120.00 12 Yes
EquipmentNon Revenue/Service Automobile 1 5001
1985,532 $24,120.00 12 Yes
EquipmentNon Revenue/Service Automobile 1 7005
18134,434 $24,120.00 12 Yes
EquipmentNon Revenue/Service Automobile 1 7000
15132,722 $39,000.00 12 Yes
EquipmentNon Revenue/Service Automobile 1 7002
1490,963 $22,215.00 12 Yes
Asset Category
Asset Class Asset Name Count ID/Serial No. Age (Yrs)TERM Scale Condition
Replacement Cost/Value
Facilities AdministrationSimi Valley Transit Maintenance Facility 1 Administratio
29 4$4,110,560.00

Ventura County Transportation Commission 2018 Ventura County Group TAM Plan
Page 38
6.4 SVT Decision Support Tools & Management Approach
Decision Support and Investment Prioritization SVT investment prioritization process is determined based upon a comprehensive list of rolling stock, which details each vehicle miles travelled and year of purchase. Replacement prioritization is based upon replacement after 12 years from date of purchase or 500,000 service miles for revenue vehicles. Daily inspection sheets log amount of miles on each vehicle.
Maintenance Strategy Maintenance strategy includes the following regularly planned maintenance activities:
Risk Management Risk of revenue vehicle down time is reduced or mitigated by minimum bi-monthly inspections with an emphasis on known issues and maintaining an inventory of frequently used parts. Overhaul Strategy For revenue buses, including cutaways, no mid-life overhauls or repairs are planned on a
Asset Category Asset ClassMaintenance
ActivityFrequency
Avg Duration (Hrs)
Cost
RevenueVehicles BU - Bus Engine tune-up Annual 3 $1,000 RevenueVehicles BU - Bus Monthly Inspection Monthly 2 $200RevenueVehicles BU - Bus 6k service 6,000 mi. 3 variesRevenueVehicles BU - Bus Valve adjustment 36,000 mi. 3.5 $195RevenueVehicles BU - Bus Tune Up 48,000 mi. 3.5 $825RevenueVehicles BU - Bus Yearly Service Annual 5 $1,150RevenueVehicles BU - Bus Brake pads/rotors At 40% life left 5.5/axle $1,315RevenueVehicles BU - Bus CNG tank inpsection 3yrs/36,000 mi 1.5 $85RevenueVehicles CU - Cutaway Bus 6k service 6,000 2 variesRevenueVehicles CU - Cutaway Bus Monthly Inspection Monthly 1.5 $85RevenueVehicles CU - Cutaway Bus Tune Up 48,000 3 $245RevenueVehicles CU - Cutaway Bus Brake pads/rotors At 40% life left 2.5 axle $215RevenueVehicles CU - Cutaway Bus CNG tank inpsection 3 yrs/36,000 mi 1.5 $85

Ventura County Transportation Commission 2018 Ventura County Group TAM Plan
Page 39
given schedule; engine overhauls are performed as required.
6.5 SVT Prioritized List of Investments
An investment prioritization analysis was performed on the existing Intercity Fleet using the FTA’s “Fleet Retirement and Replacement Computation Module” to produce a yearly expenditures schedule for the 2019-2023 plan period. Based on the analysis, SVT would need to replace two (2) 2004 Nabi C40LF buses in 2019 at a cost of approximately $880,000 in order to maintain a SGR. Table 6.5.1. SVT New Fleet Expenditures (2019-2023)
* An annual 3.5% inflation rate was factored into future expenditures.
Total in Current Year $Inflation RateCompounded InflationTotal in Year of Expenditure $
Fleet Type (Year/Make/Model)
Number Cost in 2018 $ Number Cost in 2018 $ Number Cost in 2018 $ Number Cost in 2018 $ Number Cost in 2018 $
2004 Nabi C40LF 2 $850,000.00 0 $0.00 0 $0.00 0 $0.00 0 $0.00
2010 New Flyer BU/X0140 0 $0.00 0 $0.00 0 $0.00 0 $0.00 0 $0.00
2014 New Flyer BU/X0140 0 $0.00 0 $0.00 0 $0.00 0 $0.00 0 $0.00
2014 New Flyer BU/XN35 0 $0.00 0 $0.00 0 $0.00 0 $0.00 0 $0.00
2015 Chevrolet BU 0 $0.00 0 $0.00 0 $0.00 0 $0.00 0 $0.00
$0.003.5% 3.5% 3.5% 3.5% 3.5%
1.035
$0.00
1.035
2020 2021 2022 2023
$0.00
1.035
2019
$879,750.00 $0.00 $0.00
1.035
$850,000.00 $0.00 $0.00 $0.00
1.035

Ventura County Transportation Commission 2018 Ventura County Group TAM Plan
Page 40
The following table lists Simi Valley Transit’s planned capital projects during the TAM Plan’s 4 year horizon (2019-2023) period and include a Prop 1B funded two (2) bus replacement acquisition in 2019 at a cost of $880,000 and a seven (7) non-revenue vehicle replacement tentatively scheduled for 2019 with funding to be determined. Table 6.5.2. SVT Prioritized List of Investments for 2019-2023
Project Year Project Name Asset/Asset Class Cost Priority Funding Source2019 Simi Valley Vehicle Replacement (2) Revenue Vehicles 880,000$ High Prop 1B PTSIMEA2019 Simi Valley Non-revenue Replacement (7) Equipment/Non-Revenue Vehicles 200,000$ Medium TBD

Ventura County Transportation Commission 2018 Ventura County Group TAM Plan
Page 41
7 Thousand Oaks Transit (TOT)
7.1 Overview of TOT Service
TOT was established in 1981 and provides fixed route, seasonal, and paratransit services (ADA and seniors) to residents of Thousand Oaks. TOT provides approximately 500,000 passenger trips annually in a service area of approximately 138 sq. miles servicing a population of over 420,000. In addition, TOT provides fixed route, DAR, ADA, and vehicle maintenance services under contract to the City of Moorpark, DAR services to the City of Westlake Village, General DAR and special event bus services to the City of Agoura Hills, DAR, ADA and shuttle bus services to the County of Ventura, and inter-city DAR and ADA service to the East County Transit Alliance (ECTA).
7.2 TOT Asset Inventory Portfolio
The following table summarizes Thousand Oak’s Transit Asset Inventory. Thousand Oaks currently owns or leases thirty-six (36) revenue vehicles including seven (7) buses averaging close to 8 years of age; seventeen (17) Cutaway buses averaging approximately 2 years of age; and twelve (12) vans averaging approximately 4 years of age. Two (2) non-revenue vehicles average 4 years of age. The City of Thousand Oaks owns their own Fleet Maintenance Facility with parking and equipment that is valued at over $4.5 million, and The Thousand Oaks Transportation Center valued at $12 million.

Ventura County Transportation Commission 2018 Ventura County Group TAM Plan
Page 42
Table 7.2. Thousand Oaks Transit TOT Asset Inventory
Asset Category/ClassTotal
NumberAvg Age
Avg Mileage
Avg Value
RevenueVehicles 36 3.7 131,416 $171,666.67AB - Articulated Bus 0 - - -AO - Automobile 0 - - -BR - Over-the-road Bus 0 - - -BU - Bus 7 7.7 348,396 $567,857.14CU - Cutaway Bus 17 1.9 50,960 $94,411.76DB - Double Decked Bus 0 - - -FB - Ferryboat 0 - - -MB - Mini-bus 0 - - -MV - Mini-van 0 - - -RT - Rubber-tire Vintage Trolley 0 - - -SB - School Bus 0 - - -SV - Sport Utility Vehicle 0 - - -TB - Trolleybus 0 - - -VN - Van 12 3.9 118,825 $50,000.00Custom 1 0 - - -Custom 2 0 - - -Custom 3 0 - - -Equipment 8 4.4 23,653 $98,125.00Non Revenue/Service Automobile 2 4.0 23,653 $40,000.00Steel Wheel Vehicles 0 - - -Trucks and other Rubber Tire Vehicles 0 - - -Fueling 1 1.0 N/A $150,000.00Maintenance 5 5.2 N/A $111,000.00Custom 3 0 - - -Facilities 3 16.0 N/A $5,416,666.67Administration 0 - N/A -Maintenance 1 24.0 N/A $2,000,000.00Parking Structures 0 - N/A -Passenger Facilities 1 21.0 N/A $12,000,000.00Parking 1 3.0 N/A $2,250,000.00Custom 2 0 - N/A -Custom 3 0 - N/A -

Ventura County Transportation Commission 2018 Ventura County Group TAM Plan
Page 43
7.3 TOT Asset Condition Assessment
Revenue Vehicles The following table provides condition assessment information for TOT’s revenue vehicles. Of the thirty six (36) revenue vehicles valued at over $6 million, eleven (11) vans with a ULB of 4 years are currently at the 4 years of age mark as of 2018, and five (5) cutaway buses also currently meet their ULB of 4 years. All other vehicles have not met their ULB as of 2018, but an additional eight (8) more TOT revenue vehicles will reach the ULB threshold in 2019. Table 7.3.1. TOT Condition Assessment
Asset Category Asset Class CountID/Serial
No.Age (Yrs)
Vehicle Mileage
Replacement Cost/Value
Useful Life Benchmark
(Yrs)
Past Useful Life
BenchmarkRevenueVehicles BU - Bus 1 554-036 10 493,833 $575,000.00 12 NoRevenueVehicles BU - Bus 1 554-037 10 514,465 $575,000.00 12 NoRevenueVehicles BU - Bus 1 554-038 10 439,021 $575,000.00 12 NoRevenueVehicles BU - Bus 1 554-039 10 419,987 $575,000.00 12 NoRevenueVehicles BU - Bus 1 66461 8 280,222 $525,000.00 12 NoRevenueVehicles BU - Bus 1 554-054 3 146,716 $575,000.00 12 NoRevenueVehicles BU - Bus 1 554-055 3 144,528 $575,000.00 12 NoRevenueVehicles CU - Cutaway Bus 1 554-073 4 57,745 $120,000.00 5 NoRevenueVehicles CU - Cutaway Bus 1 554-074 4 51,133 $120,000.00 5 NoRevenueVehicles CU - Cutaway Bus 1 555-010 4 123,076 $100,000.00 5 NoRevenueVehicles CU - Cutaway Bus 1 555-011 4 119,063 $100,000.00 4 YesRevenueVehicles CU - Cutaway Bus 1 555-012 4 120,194 $100,000.00 4 YesRevenueVehicles CU - Cutaway Bus 1 555-013 4 121,658 $100,000.00 4 YesRevenueVehicles CU - Cutaway Bus 1 555-014 4 114,087 $100,000.00 4 YesRevenueVehicles CU - Cutaway Bus 1 555-015 4 103,067 $100,000.00 4 YesRevenueVehicles CU - Cutaway Bus 1 88706 0 100 $60,000.00 4 NoRevenueVehicles CU - Cutaway Bus 1 554-077 0 100 $125,000.00 4 NoRevenueVehicles CU - Cutaway Bus 1 77503 0 27,714 $100,000.00 4 NoRevenueVehicles CU - Cutaway Bus 1 77504 0 25,497 $100,000.00 4 NoRevenueVehicles CU - Cutaway Bus 1 77114 0 1,570 $100,000.00 4 NoRevenueVehicles CU - Cutaway Bus 1 77115 0 1,012 $100,000.00 4 NoRevenueVehicles CU - Cutaway Bus 1 88707 0 100 $60,000.00 4 NoRevenueVehicles CU - Cutaway Bus 1 88708 0 100 $60,000.00 4 NoRevenueVehicles CU - Cutaway Bus 1 88709 0 100 $60,000.00 4 NoRevenueVehicles VN - Van 1 77101 4 115,932 $50,000.00 4 YesRevenueVehicles VN - Van 1 77102 4 128,188 $50,000.00 4 YesRevenueVehicles VN - Van 1 77103 4 130,394 $50,000.00 4 YesRevenueVehicles VN - Van 1 77104 4 118,592 $50,000.00 4 YesRevenueVehicles VN - Van 1 77105 4 115,482 $50,000.00 4 YesRevenueVehicles VN - Van 1 77106 4 126,478 $50,000.00 4 YesRevenueVehicles VN - Van 1 77107 4 102,118 $50,000.00 4 YesRevenueVehicles VN - Van 1 77108 4 115,866 $50,000.00 4 YesRevenueVehicles VN - Van 1 77109 4 120,116 $50,000.00 4 YesRevenueVehicles VN - Van 1 77110 4 131,090 $50,000.00 4 YesRevenueVehicles VN - Van 1 77111 4 127,136 $50,000.00 4 YesRevenueVehicles VN - Van 1 77112 3 94,508 $50,000.00 4 No

Ventura County Transportation Commission 2018 Ventura County Group TAM Plan
Page 44
Equipment (includes non-revenue vehicles) The following table provides condition assessment data for TOT Equipment Assets which includes maintenance facility equipment and two (2) non-revenue vehicles. None of the equipment listed currently (2018) exceed their respective ULB. Table 7.3.2. Thousand Oaks Transit Equipment Condition Assessment
Facilities The following table contains TOT Facilities Condition Assessment. Thousand Oak’s Fleet Maintenance Facility is 24 years of age and rated 4 on the TERM scale, a “good” rating which generally means “an asset in good condition, but no longer new, may have some slightly defective or deteriorated components but is overall functional.” The Thousand Oaks Transportation Center has a similar TERM scale condition rating at 21 years of age. The 3 year old MSC Bus Parking and Fueling Station are rated 5 or “excellent”. Assets with a condition score of 3.0 or higher are considered to be in a SGR. Table 7.3.3. Thousand Oaks Transit Facilities Condition Assessment
Asset Category
Asset Class Asset Name CountID/Serial
No.Age (Yrs)
Vehicle Mileage
Replacement Cost/Value
Useful Life Benchmark
(Yrs)
Past Useful Life Benchmark
Equipment Fueling CNF Fast-fill Dispenser 1 N/A 1 N/A $150,000 10 NoEquipment Maintenance Bus Wash 1 N/A 8 N/A $250,000 10 NoEquipment Maintenance BusLift 1 50900050 8 N/A $200,000 10 NoEquipment Maintenance Portable Bus Lift (set of 4) 1 13010271M 5 N/A $50,000 10 NoEquipment Maintenance Tire Balancer 1 430027337 3 N/A $25,000 20 NoEquipment Maintenance Tire Changer 1 IKG725174 2 N/A $30,000 10 No
EquipmentNon Revenue/Service Automobile Pool Vehicle 1 554-040
640,305 $40,000 10 No
EquipmentNon Revenue/Service Automobile Pool Vehicle 1 554-070
27,000 $40,000 10 No
Asset Category
Asset Class Asset Name CountID/Serial
No.Age (Yrs)
TERM Scale Condition
Replacement Cost/Value
Facilities Maintenance Fleet Maintenance Facility 1 N/A 24 4 $2,000,000Facilities Parking MSC Bus Parking and Fueling 1 N/A 3 5 $2,250,000Facilities Passenger Facilities Thousand Oaks Transportation Center 1 N/A 21 4 $12,000,000

Ventura County Transportation Commission 2018 Ventura County Group TAM Plan
Page 45
7.4 TOT Decision Support Tools & Management Approach
The following documents/tools inform and support TAM decision making: Decision Support and Investment Prioritization Every two years, the City of Thousand Oaks produces a Capital Improvement Plan (CIP). The City updates the CIP project list and budget within a five-year outlook that includes project description, funding source, and priority based on City Council approved evaluation criteria. As part of the five-year capital project development process, staff reviews all vehicles and transit related assets currently in service and identifies their required or anticipated end of life date and any equipment that due to other factors may require unscheduled replacement or modernization to extend its life expectancy. Once identified, staff reviews available and anticipated funding. Lastly, staff identifies which of the three City Council priorities best fits the project needs and impacts. Once all components are identified, projects are added to the CIP program, are budgeted, prioritized, and ultimately, approved by the City Council. The CIP for 2017-18 and 2018-19 informed TOT’s prioritized list of transit capital improvements that follow. In addition, the list was adapted to suit the TAM Plan’s stated goals, performance targets and priority setting. Risk Management
Risk Mitigation StrategyLoss of significant amounts of federal funds Decrease dependence on federal funds for capital
Unexpected vehicle and facility maintenance costs
Maintain a reserve in federally requested funding levels of at least 25% and supplement with local funding set aside for maintenance activities.
Loss of fuel facility access
Cooperative fueling agreements maintained with neighboring agencies, operater maintains seperate public fleet card access for emergencies.
Maintenance is not done during non-revenue hours which can lead to bus shortages
Maintan a higher than normal reserve ratio using reserve, light and medium duty buses which can also double for demand response activities to ensure service flexibility and access to vehicles in emergencies.
Insufficient demand response vehicles to meet demandOperator is required to maintain two additional emergency vehicles available to any service.
Loss of power at Operations and Maintenenace facilities
Each facility has back-up generators to power all critical systems with back-up fueling supplies on standby. CNG compressor has dedicated back-up power as well.

Ventura County Transportation Commission 2018 Ventura County Group TAM Plan
Page 46
Maintenance Strategy TOT’s Vehicle Maintenance Plan and Transit Facility Maintenance Plan provide a comprehensive TAM approach. A summary of these strategies is provided below. Vehicles City maintains transit vehicles along with the City's entire vehicle and small engine and equipment fleet in a single shop. While certain mechanics are assigned on a full-time basis to transit vehicle maintenance, additional mechanics can be pulled from other duties to support extraordinary workloads due to unexpected failures or accidents. The City maintains a maintenance reserve so that all unexpected costs can be covered. In addition, the contract with the operator requires them to pay for all accident repairs regardless of fault, thereby limiting the City's exposure. The following schedule provides regularly planned vehicle maintenance activities:
Asset Category Asset Class Maintenance Activity FrequencyAvg Duration
(Hrs)Cost
RevenueVehicles BU - Bus PMI CHP Inspection 40 days 2 $196RevenueVehicles BU - Bus PMB oil change 7500 miles 2 $213RevenueVehicles BU - Bus PMC all fluids 60000 miles 3 $314RevenueVehicles BU - Bus PML lift inspection 40 days 0.88 $88RevenueVehicles CU - Cutaway Bus PMI CHP Inspection 90 days 1.64 $131RevenueVehicles CU - Cutaway Bus PMB oil change 5000 miles 1 $80RevenueVehicles CU - Cutaway Bus PMC all fluids 15000 miles 2.5 $200RevenueVehicles CU - Cutaway Bus PML lift inspection 5000 miles 0.95 $75RevenueVehicles MV - Mini-van PMB oil change 5000 miles 1 $80RevenueVehicles MV - Mini-van PMC all fluids 15000 miles 2.5 $200Equipment Non Revenue/Service Automobile PMB oil change 5000 miles 1 $80Equipment Non Revenue/Service Automobile PMC all fluids 30000 miles 2.5 $200Equipment Non Revenue/Service Automobile PMS emission test 24 months 1 $80Facilities Maintenance Bus Washer Maintenance 7 DAYS 2 $130

Ventura County Transportation Commission 2018 Ventura County Group TAM Plan
Page 47
Facilities The following schedule provides regularly planned Facility maintenance activities:
Overhaul Strategy
Acquisition and Renewal Strategy
Asset Category Asset Class Maintenance Activity Frequency Avg Duration (Hrs) CostFacilities Administration HVAC Maintenance Monthly 1 $2,400Facilities Administration Fire System Maintenance Quarterly $1,800Facilities Administration Security Patrol Daily $10,000Facilities Administration Security System Maint. Quarterly 2 $860Facilities Administration Janitorial Services 6x per week 2 $3,200Facilities Administration Window Washing Quarterly 1 $1,500Facilities Administration Building Inspections Monthly 1 $2,400
Asset Category Asset Class
RevenueVehicles BU - Bus
RevenueVehiclesCU - Cutaway Bus
RevenueVehiclesMV - Mini-van
Equipment
Non Revenue/Service Automobile
City policy is no deferred maintenance. City does not do mid-life overhauls. Major component failures are addressed as they occur. We do not automatically replace engines and transmissions on a set schedule. Rather we rely on compliance with manufacturer service intervals to ensure minimum component failures
City policy is no deferred maintenance. City does not do mid-life overhauls. Major component failures are addressed as they occur. We do not automatically replace engines and transmissions on a set schedule. Rather we rely on compliance with manufacturer service intervals to ensure minimum component failures
City policy is no deferred maintenance. City does not do mid-life overhauls. Major component failures are addressed as they occur. We do not automatically replace engines and transmissions on a set schedule. Rather we rely on compliance with manufacturer service intervals to ensure minimum component failures
Overhaul Strategy
City policy is no deferred maintenance. City does not do mid-life overhauls. Major component failures are addressed as they occur. We do not automatically replace engines and transmissions on a set schedule. Rather we rely on compliance with manufacturer service intervals to ensure minimum component failures
Asset Category Asset Class
RevenueVehicles BU - Bus
RevenueVehicles CU - Cutaway Bus
RevenueVehicles MV - Mini-van
Equipment Non Revenue/Service AutomobileMaintain 100% EV/Plug in hybrid for city-owned, transition to 100% transit operator owned.
Transition to renewable or EV vans once vehicles are available.
Maintain current 100% renewalable fleet (CNG) and transition to EV as buses are retired.Maintain city-owned 100% renewable fleet (CNG) and strive for renewable leases where applicable. Transition to EV cutaways where feasible.
Acquisition and Renewal Strategy

Ventura County Transportation Commission 2018 Ventura County Group TAM Plan
Page 48
7.5 TOT Prioritized List of Investments
The following table provides the purchase cost in inflation adjusted dollars per fleet type (year/make/model) over the Plan’s four (4) year horizon from 2019-2023 applying a vehicle replacement initiation when such vehicle exceeds its respective ULB. The table shows that in 2019, eight (8) 2014 Starcraft Starlites cutaway buses are identified for replacement at a cost of $840,000 and eleven (11) 2014 Braun Entravan vans are identified for replacement at a cost of $550,000 for a total of close to $1.5 million*. In 2021, four (4) 2008 Orion VII buses are identified for replacement at a cost of close to $2.4 million*. In 2023, one (1) 2010 El Dorado EZ Rider II, four (4) 2018 Starcraft Starlites cutaway buses and eleven (11) Braun Entravan vans (with a ULB of 4 years) are identified for replacement at a collective cost of more than $1.5 million*. To maintain a SGR, total expenditures for the Plan’s 4 year horizon for TOT Fleet Replacement is calculated to be in excess of $5.0 million*.
Table 7.5.1. Thousand Oaks New Fleet Expenditures (2019-2023)
* An annual 3.5% inflation rate was factored into future expenditures.
Total in Current Year $Inflation RateCompounded InflationTotal in Year of Expenditure $
Fleet Type (Year/Make/Model)
Number Cost in 2018 $ Number Cost in 2018 $ Number Cost in 2018 $ Number Cost in 2018 $ Number Cost in 2018 $
2015 Starcraft Starlite 0 0 0 0 02008 Orion Orion VII 0 $0.00 0 $0.00 4 $2,300,000.00 0 $0.00 0 $0.002015 Gillig BRT 0 $0.00 0 $0.00 0 $0.00 0 $0.00 0 $0.002010 Starcraft Allstar 0 0 0 0 02014 Starcraft Starlite 8 $840,000.00 0 $0.00 0 $0.00 0 $0.00 0 $0.00
2010 El Dorado EZ Rider II 0 $0.00 0 $0.00 0 $0.00 0 $0.00 1 $525,000.002018 Starcraft Starlite 0 $0.00 0 $0.00 0 $0.00 0 $0.00 4 $400,000.002014 Braun Entravan 11 $550,000.00 0 $0.00 0 $0.00 0 $0.00 11 $550,000.00
2015 Braun Entravan 0 0 0 0 0
$1,475,000.003.5% 3.5% 3.5% 3.5% 3.5%
1.035
$0.00
1.035
2020 2021 2022 2023
$1,526,625.00
1.035
2019
$1,438,650.00 $0.00 $2,380,500.00
1.035
$1,390,000.00 $0.00 $2,300,000.00 $0.00
1.035

Ventura County Transportation Commission 2018 Ventura County Group TAM Plan
Page 49
The following table lists Thousand Oaks Transit planned capital projects. In its entirety, the list totals more than $9 million in costs for the projects that are listed. Table 7.5.2. TOT Prioritized List of Investments for 2019-2023
Project Year Project Name Asset/Asset Class Cost Priority2019 TOT Replacement CNG Bus Purchase RevenueVehicles 2,300,000$ High2019 TOT Replacement Demand Response Purchase RevenueVehicles/Cutaway Bus 750,000$ High
2019TOT Transportation Center Bus Parking and
Pedestrian ImprovementsFacilities/Passenger Facilties 2,375,000$ Medium
2019 TOT Bus Turnouts Facilities/Parking Structures 100,000$ Medium
2020TOT Janss Road Park and Ride Facility
ImprovementsFacilities/Parking Structures 250,000$ Medium
2020 TOT Transit Radio Communications Equipment 250,000$ Medium2021 TOT EV Bus Purchase RevenueVehicles/Bus 2,000,000$ High2021 TOT Bus Wash Replacement Facilities/Maintenance 1,000,000$ Medium2021 TOT Bus Turnouts Facilities/Parking Structures 100,000$ Medium

Ventura County Transportation Commission 2018 Ventura County Group TAM Plan
Page 50
8 Other Ventura County Transit Service Providers
Overview and Asset Inventory Portfolio In addition to the Tier II public transit agencies, smaller bus systems that operate in Ventura County with federally funded assets include Ventura Transit System (VTS), Downtown Ventura Partners (DVP) and HELP of Ojai (HOO). VTS is a public transit system that operates with six (6) 2016 Dodge Caravans; DVP owns and operates a newly acquired downtown/Ventura Harbor Trolley; and HOO provides paratransit service for seniors and disabled Ojai residents with a 2017 Ford Transit. Table 8.1. Collective Smaller Operators Transit Asset Inventory Portfolio
Asset Condition Assessment
All assets of the VTS, DVP, and HOO are currently (2018) within their established ULB, thus meeting a state of good repair as shown in the table below:
Asset Category/Class Total Number Avg Age Avg Mileage Avg ValueRevenueVehicles 8 1.0 26,675 $100,666.67AB - Articulated Bus 0 - - -AO - Automobile 0 - - -BR - Over-the-road Bus 0 - - -BU - Bus 0 - - -CU - Cutaway Bus 0 - - -DB - Double Decked Bus 0 - - -FB - Ferryboat 0 - - -MB - Mini-bus 0 - - -MV - Mini-van 6 2.0 59,698 $40,000.00RT - Rubber-tire Vintage Trolley 0 - - -SB - School Bus 0 - - -SV - Sport Utility Vehicle 0 - - -TB - Trolleybus 1 0.0 10,327 $200,000.00VN - Van 1 1.0 10,000 $62,000.00

Ventura County Transportation Commission 2018 Ventura County Group TAM Plan
Page 51
Table 8.2. Collective Smaller Operators Asset Condition Assessment
Management Approach and Prioritized List of Investments
An investment prioritization analysis was performed on the Fleet of smaller operators using the FTA’s “Fleet Retirement and Replacement Computation Module” to generate a yearly expenditures schedule for 2019-2023. When a vehicle reaches its respective ULB, the expectation is to replace that vehicle. Based on the analysis, six (6) Dodge Caravans are identified for replacment in 2022 at a cost of approximately $250,000 for the VTS service, and one (1) Ford Transit at a cost of $64,000 is identified for replacement in 2023 for the Help of Ojai service, as shown in the table below: Table 8.3. Collective Smaller Operators New Fleet Expenditures (2019-2023)
Table 8.4. Smaller Operators Prioritized List of Investments for 2019-2023
Asset Category Asset Class Asset Name CountID/Serial
No.Age (Yrs)
Vehicle Mileage
Replacement Cost/Value
Useful Life Benchmark
(Yrs)
Past Useful Life
BenchmarkRevenueVehicles MV - Mini-van Ventura Transit System 6 6 VTS6 2 59,698 $40,000.00 5 NoRevenueVehicles TB - Trolleybus Downtown Ventura Harbor Trolley 1 DVHT1 0 10,327 $200,000.00 12 NoRevenueVehicles VN - Van Van #8 1 VIN3719 1 20,000 $62,000.00 5 No
Total in Current Year $Inflation RateCompounded InflationTotal in Year of Expenditure $
Fleet Type (Year/Make/Model)
Number Cost in 2018 $ Number Cost in 2018 $ Number Cost in 2018 $ Number Cost in 2018 $ Number Cost in 2018 $
2016 Dodge Caravan 0 $0.00 0 $0.00 0 $0.00 6 $240,000.00 0 $0.00
2018 Hometown Trolley Class E Ford (F550) Medium Duty 0 $0.00 0 $0.00 0 $0.00 0 $0.00 0 $0.00
2017 Ford Transit 0 $0.00 0 $0.00 0 $0.00 0 $0.00 1 $62,000.00
$62,000.003.5% 3.5% 3.5% 3.5% 3.5%
1.035
$248,400.00
1.035
2020 2021 2022 2023
$64,170.00
1.035
2019
$0.00 $0.00 $0.00
1.035
$0.00 $0.00 $0.00 $240,000.00
1.035
Project Year Project Name Asset/Asset Class Cost Priority Funding Source Transit Agency2022 VTS Vehicle Replacement (6) RevenueVehicles 248,500$ High TBD Ventura Transit System2023 HELP of Ojai Vehicle Replacement (1) Revenue Vehicles 64,000$ High TBD HELP of Ojai
Ventura County Transportation Commission 2018 Ventura County Group TAM Plan
Page 52
9 Ventura County Rail
Rail Assets
Metrolink provides regional weekday commuter rail service between Ventura County and Union Station in downtown Los Angeles. There are a total of fourteen (14) daily Metrolink trains that run between Ventura County and Union Station on the “Ventura County Line”. Metro owns the track from Union Station to the LA County line. Union Pacific/VCTC jointly own the rail right-of way (ROW) for approximately fifteen (15) miles from the County line to just west of Moorpark Station. Union Pacific owns the track west of Moorpark. There are a total of five (5) Ventura County Metrolink station stops in Ventura County: Simi Valley, Moorpark, Camarillo, Oxnard and the East Ventura (Montalvo) station. While VCTC and other Ventura County cities own rail assets (station platforms, rail ROW, or parking), neither VCTC nor the cities operate rail therefore are not Tier I agencies nor required to perform or report rail asset condition assessments or provide a prioritized list of rail related investments. Metrolink, as the commuter rail operator servicing the County’s stations, has included an inventory of all Ventura County stations as well as inventory and condition assessment of the Ventura Line track in its TAM Plan. Condition Assessment Metrolink performed a Track RCI Condition Assessment for their TAM Plan and rated the Ventura County Line an average condition of 77 or “Fair.” A track segment rated “Fair” will be in “serviceable condition at the time of rating, but will require rehabilitation of two (2) or more components within five (5) years.” Metrolink also performs a monthly “Station Inspection Survey” of all Ventura County Line stations. August 2018 inspection reports found zero (0) deficiencies at the Ventura (Montalvo), Camarillo and Simi Valley Stations. The August inspection of the Oxnard Station reported 3 deficiencies in: 1) fencing, 2) parking lot surface, and 3) canopy walls, columns and fixtures. The August inspection of the Moorpark Station reported two (2) deficiencies in: 1) fencing and 2) parking lot surface.

Ventura County Transportation Commission 2018 Ventura County Group TAM Plan
Page 53
The following table provides asset inventory and condition assessments for Ventura County’s rail stations:
Table 9. Ventura County Stations
Note: A condition score of 5 on the FTA TERM scale translates to “excellent” condition.
Train Station Owner
Platforn Length (feet)
Rail Car Capacity
Parking Spaces
Overall Condition
TERM ScaleEast Ventura Station (Montalvo) VCTC 510 6 60 5Oxnard City of Oxnard 1090 8 110 5Camarillo VCTC, Union Pacific 800 8 406 5Morpark VCTC, Union Pacific 1086 6 270 5Simi Valley City of Simi Valley, VCTC, UP 800 7 560 5

Ventura County Transportation Commission 2018 Ventura County Group TAM Plan
Page 54
10 VENTURA COUNTY ANNUALIZED PERFORMANCE TARGET & MEASURES While Useful Life Benchmarks (ULBs) for assets are defined at the discretion of a particular agency, Group TAM Plans define shared targets that apply to all participating agencies. The following performance targets have been adopted by the participating agencies of the Ventura County TAM Plan:
Table 10.1. Ventura County Group TAM Plan Targets
ASSETS: Only those for which agency has direct capital responsibility
PERFORMANCE MEASURE
TAM PLAN TARGET
EQUIPMENT: Valued $50k+ and all non-revenue support-service and maintenance vehicles
Measured by age, Percentage of vehicles
met or exceeded Useful Life Benchmark
25%
ROLLING STOCK: Revenue vehicles by mode
Measured by age, Percentage of vehicles
met or exceeded Useful Life Benchmark
10%
FACILITIES: Maintenance and administrative facilities, passenger stations (buildings) and parking facilities
Measured by TERM score, Percentage of assets with condition
rating below 3.0 on FTA TERM Scale
0%
VENTURA COUNTY GROUP TAM PLAN PROJECTED TARGETS

Ventura County Transportation Commission 2018 Ventura County Group TAM Plan
Page 55
Table 10.2. Group TAM Plan Targets
Asset Category - Performance
MeasureAsset Class 2019 Target 2020 Target 2021 Target 2022 Target 2023 Target
AB - Articulated BusAO - AutomobileBR - Over-the-road Bus 10% 10% 10% 10% 10%BU - Bus 10% 10% 10% 10% 10%CU - Cutaway Bus 10% 10% 10% 10% 10%DB - Double Decked BusFB - FerryboatMB - Mini-bus 10% 10% 10% 10% 10%MV - Mini-van 10% 10% 10% 10% 10%RT - Rubber-tire Vintage TrolleySB - School BusSV - Sport Utility VehicleTB - TrolleybusVN - Van 10% 10% 10% 10% 10%Custom 1Custom 2Custom 3
Non Revenue/Service Automobile 25% 25% 25% 25% 25%Steel Wheel Vehicles 25% 25% 25% 25% 25%Trucks and other Rubber Tire Vehicles 25% 25% 25% 25% 25%Custom 1Custom 2Custom 3
Administration 0% 0% 0% 0% 0%Maintenance 0% 0% 0% 0% 0%Parking Structures 0% 0% 0% 0% 0%Passenger Facilities 0% 0% 0% 0% 0%Custom 1Custom 2
Custom 3
Condition - % of facilities with a condition rating below 3.0 on the FTA Transit Economic Requirements Model (TERM) Scale
REVENUE VEHICLES
EQUIPMENT
FACILITIES
Age - % of revenue vehicles within a particular asset class that have met or exceeded their Useful Life Benchmark (ULB)
Age - % of vehicles that have met or exceeded their Useful Life Benchmark (ULB)

Ventura County Transportation Commission 2018 Ventura County Group TAM Plan
Page 56
11 RECORDKEEPING & NTD REPORTING Table 11.TAM Milestones
Timeframes/Reporting TAM Plan The TAM plan must be updated in its entirety at least every four (4) years, with the first completed TAM Plan required by October 2018, and it must cover a horizon period of at least four (4) years. Participating Ventura County Group TAM Plan Agencies may request to amend the TAM Plan at any time and this action should be initiated following any major change to the asset inventory, condition assessment, or capital investment of the transit provider. The TAM Plan should also be updated following any change to the prioritization processes affecting the timing of future projects as agreed to by the participating group agencies. A formal annual review process by all participating agencies will be initiated through the Ventura County Transit Operators Advisory Committee (TRANSCOM).
- Share initial targets with planning partners July 2017- Report FY17 asset inventory module (AIM) data to NTD October- Submit targets for FY18 to NTD (optional) 2017- Complete compliant TAM Plan (1st required) October- Share TAM Plan with planning partners 2018- Report FY18 AIM data to NTD (1st required) October- Submit targets for FY19 to NTD (1st required) 2018- Report FY19 AIM data to NTD October- Submit targets for FY20 to NTD 2019- Submit narrative report to NTD (1st required)- Report FY20 AIM data to NTD October- Submit targets for FY21 to NTD 2020- Submit narrative report to NTD- Complete Updated TAM Plan October- Share TAM Plan with planning partners 2022
DeadlineTAM Milestones

Ventura County Transportation Commission 2018 Ventura County Group TAM Plan
Page 57
NTD Reporting Each entity of the Group TAM Plan will have to report annually to FTA’s National Transit Database (NTD). This submission should include: (1) projected targets for the next fiscal year; (2) condition assessments and performance results; and (3) a narrative report on changes in transit system conditions and the progress toward achieving previous performance targets.

Ventura County Transportation Commission 2018 Ventura County Group TAM Plan
Page 58
12 CONCLUSION
Ventura County Prioritized List of Investments Ventura County’s comprehensive Ventura County Group TAM Plan List of Capital Investments is provided in Table 12.2. This list includes anticipated investments for the Plan’s four (4) year horizon period (2019-2023) and includes all participating Group Plan transit agencies’ proposed projects. Year 2019 includes eight projects totaling approximately $8.84M in costs including three revenue vehicle replacement projects for VCTC Intercity, Simi Valley, and Camarillo Area Transit, rated “high” priority (three of which have secured funding). Year 2020 of the Plan consists of three projects including one Valley Express “high” priority revenue vehicle replacement at a cost of $807,000, and two Thousand Oaks facility and equipment projects, both rated “medium” for a total cost of $500,000. Year 2021 includes three projects for a total of approximately $3.1M, including $2.1M for a TOT EV Bus Purchase rated “high” priority. Year 2022 consists of three projects, including Moorpark, Valley Express and VTS “high” priority vehicle replacements at a collective cost of $2.4M. Year 2023 consists of one project, the HELP of Ojai vehicle replacement for a cost of $64,000. The total estimated cost for projects identified in the Group Plan’s 4 year horizon period is approximately $15.6M. The total value of all Ventura County Group Plan Transit Assets is approximately $56M as shown in Table 12.1. The investment prioritization schedule costs represent 28% of the current replacement value of all Ventura County Transit Assets (excluding GCTD). Table 12.1. Current (2018) Replacement Value of all Ventura County Group Plan Assets
Transit Agency Transit Assets Current Value (2018)Valley Express 1,490,000$ VCTC Intercity 15,986,000$
Camarillo Area Transit 1,480,000$ Moorpark City Transit 2,275,000$
Simi Valley Transit 11,276,000$ Thousand Oaks Transit 23,215,000$ Small Transit Providers 300,000$
TOTAL Ventura County Transit (Group Plan) 56,022,000$

Ventura County Transportation Commission 2018 Ventura County Group TAM Plan
Page 59
Table 12.2. Ventura County Group TAM Plan List of Capital Investments (2019-2023)
The Capital Investment List was reached by consensus by all Ventura County Group TAM Plan member agencies and approved by their designated Accountable Executives.
Project Year Project Name Asset/Asset Class Cost Priority Funding Source Transit Agency2019 VCTC Intercity Vehicle Replacement (3) Revenue Vehicles 2,151,000$ High CMAQ VCTC Intercity2019 Simi Valley Vehicle Replacement (2) Revenue Vehicles 880,000$ High Prop 1B PTSIMEA Simi Valley Transit2019 Camarillo Vehicle Replacement (1) Revenue Vehicles 67,725$ High TBD Camarillo Area Transit2019 TOT Replacement CNG Bus Purchase RevenueVehicles 2,300,000$ High CMAQ, Prop 1B Thousand Oaks Transit2019 TOT Replacement Demand Response Purchase RevenueVehicles/Cutaway Bus 750,000$ High TBD Thousand Oaks Transit
2019TOT Transportation Center Bus Parking and
Pedestrian ImprovementsFacilities/Passenger Facilties 2,375,000$ Medium
TBD Thousand Oaks Transit2019 TOT Bus Turnouts Facilities/Parking Structures 100,000$ Medium TBD Thousand Oaks Transit2019 Simi Valley Non-revenue Replacement (7) Equipment/Non-Revenue Vehicles 200,000$ Medium TBD Simi Valley Transit2020 Valley Express Vehicle Replacement (10) Revenue Vehicles 807,000$ High TBD Valley Express
2020TOT Janss Road Park and Ride Facility
ImprovementsFacilities/Parking Structures 250,000$ Medium
TBD Thousand Oaks Transit2020 TOT Transit Radio Communications Equipment 250,000$ Medium TBD Thousand Oaks Transit2021 TOT EV Bus Purchase RevenueVehicles/Bus 2,000,000$ High TBD Thousand Oaks Transit2021 TOT Bus Wash Replacement Facilities/Maintenance 1,000,000$ Medium TBD Thousand Oaks Transit2021 TOT Bus Turnouts Facilities/Parking Structures 100,000$ Medium TBD Thousand Oaks Transit2022 Moorpark Vehicle Replacement (3) RevenueVehicles 1,412,775$ High TBD Moorpark City Transit2022 VTS Vehicle Replacement (6) RevenueVehicles 248,500$ High TBD Ventura Transit System2022 Valley Express Vehicle Replacement (5) Revenue Vehicles 735,000$ High TBD Valley Express 2023 HELP of Ojai Vehicle Replacement (1) Revenue Vehicles 64,000$ High TBD HELP of Ojai
2019-2023 TOTAL VENTURA COUNTY TAM PLAN 15,691,000$

Ventura County Transportation Commission 2018 Ventura County Group TAM Plan
Page 60
Approval by Agency Accountable Executive _________________________________________________ ___________________ William Golubics Date Deputy Director of Public Works, City of Camarillo

Ventura County Transportation Commission 2018 Ventura County Group TAM Plan
Page 61
Approval by Agency Accountable Executive _________________________________________________ ___________________ Troy Brown Date City Manager, City of Moorpark

Ventura County Transportation Commission 2018 Ventura County Group TAM Plan
Page 62
Approval by Agency Accountable Executive _________________________________________________ ___________________ Ben Gonzales Date Transit Operations Manager, City of Simi Valley

Ventura County Transportation Commission 2018 Ventura County Group TAM Plan
Page 63
Approval by Agency Accountable Executive _________________________________________________ ___________________ Cliff Finley Date Deputy Director of Public Works, City of Thousand Oaks

Ventura County Transportation Commission 2018 Ventura County Group TAM Plan
Page 64
Approval by Agency Accountable Executive _________________________________________________ ___________________ Darren Kettle Date Executive Director, VCTC

Ventura County Transportation Commission 2018 Ventura County Group TAM Plan
Page 65
Attachment A