vercher sanchis, jm.; gil benso, e.; mas tomas, mdla
TRANSCRIPT

Document downloaded from:
This paper must be cited as:
The final publication is available at
Copyright
http://dx.doi.org/10.1061/(ASCE)CF.1943-5509.0000515
http://hdl.handle.net/10251/43295
American Society of Civil Engineers
Vercher Sanchis, JM.; Gil Benso, E.; Mas Tomas, MDLA.; Lerma Elvira, C. (2013).Diagnosis / Intervention criteria in damaged slabs by severe corrosion of prestressed joists.Journal of Performance of Constructed Facilities. (04014040).doi:10.1061/(ASCE)CF.1943-5509.0000515.
Diagnosis / Intervention criteria in damaged slabs by severe corrosion of
prestressed joists
Jose Vercher1, Enrique Gil2, Angeles Mas3, Carlos Lerma4
Abstract
This research defines diagnosis criteria in R/C one-way slabs with severe corrosion at the lower
prestressed reinforcement of the joists and proposes specific actuation criteria and constructive
recommendations to increase the safety. The corrosion of this reinforcement is the most common
damage in building structures, and the use of aluminous cement in the precast joists can
aggravate the corrosion.
The usual cases of entire residential buildings with different degrees of damage and with a few
or all joists affected in a slab have been simulated. ACI-318 is used as an acceptance criterion
for existing structures in the simulations, and a ratio between the ultimate load and the service
load is defined as valuation coefficient. By this way, the residual safety for a damaged structure
is known.
Results are in accordance with the extensive experience in real intervention cases, which often
still have high safety reserves.
1Assistant Professor, Department of Architectural Constructions, Polytechnic University of Valencia,
Camino de Vera s/n, Valencia 46022, Spain, [email protected]
2Titular Professor, Department of Continuum Media Mechanics and Theory of Structures, Polytechnic
University of Valencia, Camino de Vera s/n, Valencia 46022, Spain, [email protected]
3Titular Professor, Department of Architectural Constructions, Polytechnic University of Valencia,
Camino de Vera s/n, Valencia 46022, Spain, [email protected]
4Assistant Professor, Department of Architectural Constructions, Polytechnic University of Valencia,
Camino de Vera s/n, Valencia 46022, Spain, [email protected]
Introduction
In this paper, the diagnosis criteria for a wide range of one-way slabs with severe corrosion are
elaborated. These criteria are constructive and for decision-making, and are based on the slab
thickness. Specifically the 25 and 30 cm thick prestressed one-way slabs are assessed. The
residual safety of a big variety of possibilities is analysed, regarding the number of joists with
corrosion, the degree of corrosion, the presence of spalling and the position in a slab.
Actually, structure finds equilibrium configuration involving the minimum energy transport, acting
simultaneously all kinds of mechanisms, such as bending, arch effect (Coronelli and Gambarova
2004) or membrane effect (Foster et al 2004), formation of struts and ties within the section, and
spatial transmission of the load. Simplification of a member as single line, neutral line, fails to
describe the minimum working equilibrium. Because of this, this research is carried out in spatial
models to get the most accurate results.
Simulations of an entire building are performed in order to assess the remaining safety in each
studied situation. Real geometry of the building is taken into account, using the real spatial
dimensions and exact positions of the constructive elements. The simulation includes aspects of
non-linearity, equilibrium in deflected structures, loss of stiffness caused by concrete cracking
and crushing, and steel yielding and creep.
The idea of the research follows from the detailed observation of buildings that have suffered
major damage – such as the complete corrosion of the active reinforcement in prestressed joists
– yet without much apparent pathology. In the wide experience of thousands of appraisals that
the research team have, there has not been any personal injury.
During surveys, some cases are found in which slabs are supported by joists that have suffered
corrosion along all of the lower reinforcement. Strangely, there is not serious pathology in the
floors or walls and the deflections are not excessive. In some cases, pathology has been found
by removing the false ceiling, as is the case in Fig. 1, which shows a residential dwelling in
Benigánim (Valencia). Only the rust is visible in the photograph, due to the pre-stressing wires
are completely corroded. A few broken wires hanging can still be observed.
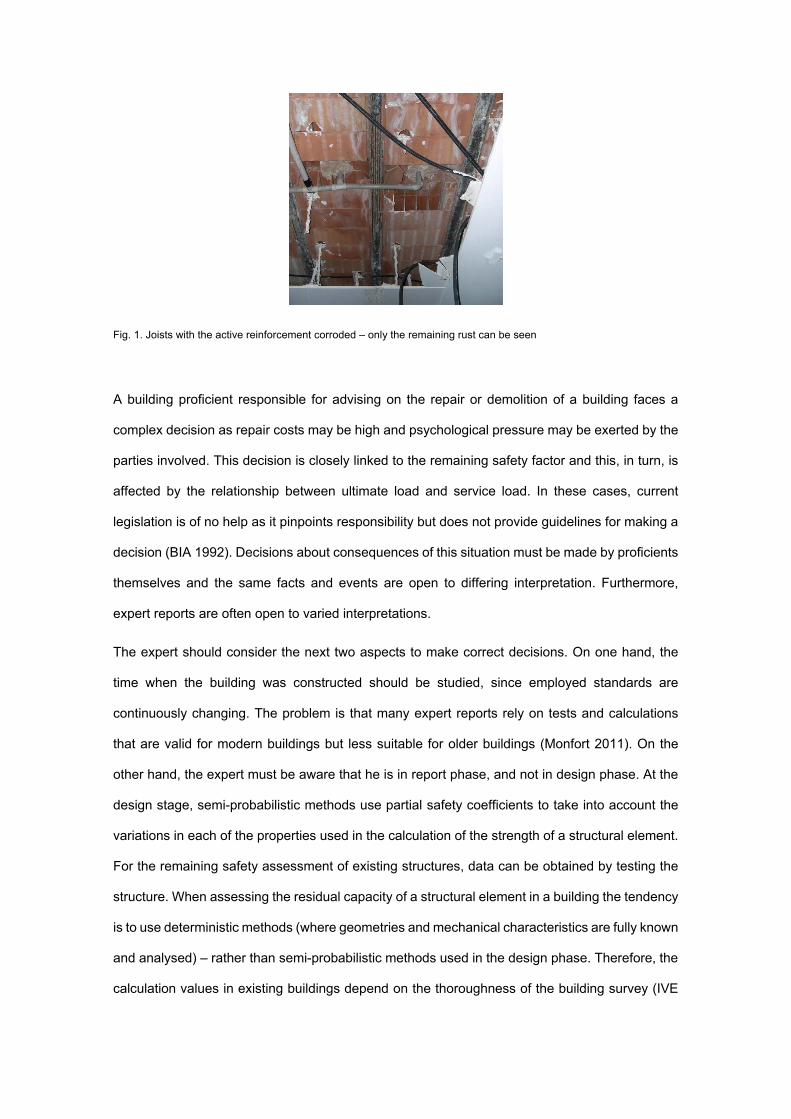
Fig. 1. Joists with the active reinforcement corroded – only the remaining rust can be seen
A building proficient responsible for advising on the repair or demolition of a building faces a
complex decision as repair costs may be high and psychological pressure may be exerted by the
parties involved. This decision is closely linked to the remaining safety factor and this, in turn, is
affected by the relationship between ultimate load and service load. In these cases, current
legislation is of no help as it pinpoints responsibility but does not provide guidelines for making a
decision (BIA 1992). Decisions about consequences of this situation must be made by proficients
themselves and the same facts and events are open to differing interpretation. Furthermore,
expert reports are often open to varied interpretations.
The expert should consider the next two aspects to make correct decisions. On one hand, the
time when the building was constructed should be studied, since employed standards are
continuously changing. The problem is that many expert reports rely on tests and calculations
that are valid for modern buildings but less suitable for older buildings (Monfort 2011). On the
other hand, the expert must be aware that he is in report phase, and not in design phase. At the
design stage, semi-probabilistic methods use partial safety coefficients to take into account the
variations in each of the properties used in the calculation of the strength of a structural element.
For the remaining safety assessment of existing structures, data can be obtained by testing the
structure. When assessing the residual capacity of a structural element in a building the tendency
is to use deterministic methods (where geometries and mechanical characteristics are fully known
and analysed) – rather than semi-probabilistic methods used in the design phase. Therefore, the
calculation values in existing buildings depend on the thoroughness of the building survey (IVE
2008c); and the partial safety coefficients used for evaluation (Micic et al 1995) should be modified
according to the quality of the survey data collected. Currently the problem is neither how to
measure the deviations in the dimensional characteristics of the building elements, nor the
strength of the materials in damaged buildings – given that these subjects are now fairly well
resolved. The essential task is to analyse the variation that these deviations have caused in the
reliability of the element or the structure (Calavera 2003).
Because of these problems, the Valencian Building Institute (Instituto Valenciano de la
Edificación) has published guidelines for the inspection and repair of concrete structures (IVE
2008b; 2008c; 2008d) to facilitate the work of proficients.
A methodology that helps the expert to make decisions is presented in this paper. This
methodology is based on two columns. The first point, which is the main, is the ACI-318 load test
(ACI 2008), which describes a test to determine if an existing structure can remain in use. A
second aspect which is incorporated in this research is the evaluation of Load Factor. It's about
getting the relationship between the load that a specimen supports at an established limit
deformation and the load on a construction according to standards.
Corrosion facilitated by the use of aluminous cement
Considerable effort has been made to understand the causes and mechanisms of the corrosion
of reinforcement; and at the same time, techniques and repair materials have been widely
studied. However, little attention has paid to the residual safety of corroded structures (Coronelli
and Gambarova 2004). Corrosion occurs on the surface of steel bars when depassivation
agents penetrate through the concrete cover. This action decreases the sectional size of the
bars and therefore their mechanical strength. In advanced states, this process can threaten the
safety of a structure. However, long before a significant reduction in the size of sections occurs,
the volumetric expansion of the corrosion will cause internal pressures to crack the concrete
surrounding the bar until the cover spalling (Sanz et al 2008). This situation is worsened in
prestressed elements – given the smaller steel sections of the pre-stressing wires. Moreover,
under certain circumstances, the risk of corrosion under stress is very dangerous because of
the possible brittle breakage of the pre-stressing wires (IVE 2008d) without clear warning signs.

This may occur because there is no necking or ultimate strength is insufficient (Anh et al 2009).
The severity of the damage is a function of how much of the steel section is lost and the loss of
bond between the concrete and the steel – and is difficult to assess.
The problem of corrosion is worse in the case of prefabricated joists realised with aluminous
cement. These joists were often used in Spain during the construction boom of the 1950s, 60s,
and 70s. The aluminous cement was popular because in just a couple of days achieved the
strength that Portland cement achieves in a month. This property meant that it was widely used
in precasting, because although it was around three times more expensive than Portland cement,
its use avoided the need for costly accelerated curing facilities (Calavera 2003). The problem with
the use of aluminous cement in the construction of prefabricated joists is that the cement may
suffer conversion. By absorbing water, monocalcium aluminate produces several hydrates:
hydrated monocalcium aluminate, hydrated dicalcium, and tricalcium hydrate. The first two are
meta-stable, hexagonal in structure, and tend to become tricalcium hydrate at temperatures
above 24ºC. This last compound has a stable cubic structure. This transformation is termed
‘conversion’. This process has been studied in depth by various authors (Ann et al 2010,
Antonovic et al 2013, Luz and Pandolfelli 2011). During the conversion process a significant
amount of water is released, accompanied by a reduction of volume because of the higher density
of cubic crystals. The result is a porous concrete that is easily attacked from the outside and is
less resistant (IVE 2008d).
If, as predicted by researchers, the crystalline conversion and calcification of elements made with
aluminous cement tends to occur within approximately 10 to 30 years (depending on
environmental conditions) and the use of aluminous cement in joists for slabs was mainly between
1950 to 1970-74, then we can expect to see a great amount of cases with this pathology. Experts
must be prepared for early detection and the specification of appropriate treatment in order to
avoid structural collapses (BIA 1992). In Spain, production data for aluminous cement and cement
consumption in the manufacture of joists, suggest that some 400,000 to 800,000 of the 3.4 million
buildings constructed between 1950 and 1970 were built using aluminous elements. Some 25%
of the pre-stressed joists used in the region of Valencia between the early fifties to the late
seventies were made of aluminous cement (IVE 2008a). A building with an aluminous cement
reinforced concrete structure that has been thoroughly studied and found not to be at risk should
remain under periodic inspection – but does not automatically require reinforcement (Calavera
2003). Only in specific cases (where there had been a source of moisture from broken pipes,
faulty roofs and waterproofing, or condensation in humid rooms) can corrosion develop quickly
and create a serious risk (BIA 1992). The presence of water from downpipe leakage produces
many more pathology in aluminous joists than those joists made with Portland cement (IVE
2008a).
Surveillance patterns or diagnosis criteria
In order to assess the real situation of a slab or a slab area with corrosion pathology is necessary
to follow a surveillance patterns or items to be analysed, in order to make the diagnosis as
accurately as possible.
When a slab with corrosion problems is located, the first action to be performed is the study of
the project data. In this way the properties and geometry of the slab in a healthy state are known.
It is necessary to collect information regarding the type of concrete and steel used in both the
reinforced concrete and the employed prestressed joists. Besides knowing the material
properties, one must know the geometric properties of the slab: thickness, spacing between joists
axes, compression layer thickness, welded-wire fabric geometry, the negative reinforcement in
the joists and type of joist employed. The type of joist used in the slab is important, especially to
know how many layers of prestressed wires possess. It is usual to have two or three layers of
tendons. With the disappearance of the lower layer by corrosion, case studied in this research,
remain one or two layers of tendons. As demonstrated in this paper, the joists with two remaining
layers of wires after the disappearance of the bottom layer, have more safety reserve.
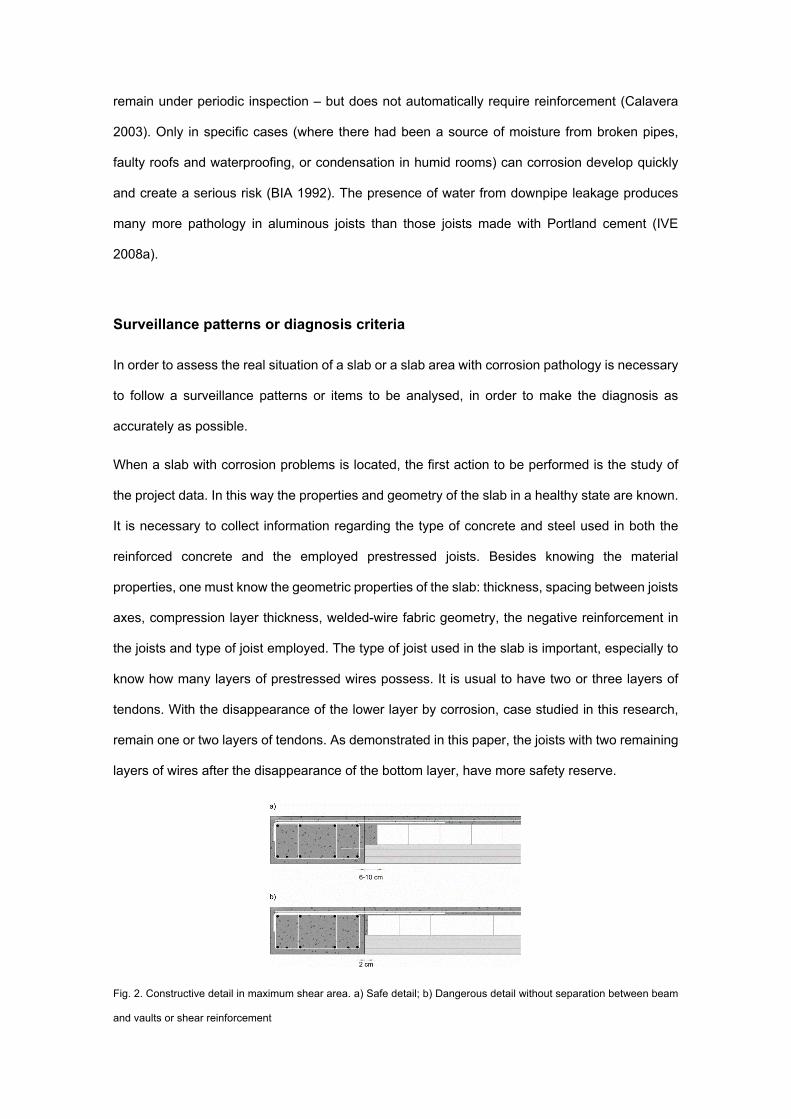
Fig. 2. Constructive detail in maximum shear area. a) Safe detail; b) Dangerous detail without separation between beam
and vaults or shear reinforcement
Another very crucial aspect in surveillance work when the project data are being studied is the
analysis of the constructive detail in the maximum shear area of the joists, where they reach the
beams. Since in this research flat beams slabs are discussed, which are the most common in
Spain, the aspects that must be analysed in the construction detail are shown in Fig. 2: the
separation between the beam and the vaults, the negative reinforcement of the joists and the
presence or absence of shear reinforcement. It is very important to rule out the possible shear
failure. The collapse is dominated by shear in small spans with high loads. If exists shear
reinforcement in this area or sufficient separation between the vaults and beam, there are not
shear problems. If any of the above options do not appear, it is necessary to check that the
negative reinforcement at the joists are working in tensile. This is an indication that there is not
shear problem. If the guarantee that this reinforcement is working in tensile does not exist, it is
necessary to calculate the ultimate shear load of uncracked and no degraded section. Many times
the estimation of the height of the crack is risky, and a structural reinforcement of the side of
safety is carried out. Above all, when the expert observes a shear problem, must underpin and
leave immediately, because of the possibility of brittle fracture. In cases studied in this paper, it
has been found that the collapse is not governed by the shear. It is governed by bending.
An inspection and a data collection of corroded areas must be performed in the second step of
surveillance. First, a visual inspection must be realized, and then an inspection after removal of
the damaged parts of the joists. Thereby, the real state of joists is known. It is necessary to
analyse many respects, as if the aluminous cement has been used in the concrete poured in situ
or in prefabricated concrete joists, and if the concrete has undergone conversion (colour change
is observed). The moisture source should also be located. The possible sources are basically
two, or a problem of waterproofing on decks, or a localized problem of water leakage in the
downspouts. Thus, corrosion problems powered by the use of aluminous cement with the
presence of moisture are found on the roof or on a few joists in a ground floor slab, where facilities
have elbows, which can have leak.
It is necessary to analyse the corrosion level of joists as accurately as possible. The presence of
splitting and spalling is analysed. If there is spalling, it can be total or central. The degree of
corrosion of the lower prestressed wires must also be analysed. This degree corresponds to the
percentage of reinforcement lost by corrosion and the collaboration in the strength of the

remaining reinforcement. This collaboration is very dependent on the bond with the concrete (FIB
2000). The consideration of the complete loss is on the side of safety whether the degree of
corrosion of the lower tendons is total or partial, since the corrosion of a thin prestressed wire
cancels almost completely the bond. This consideration is very usual. It can refine by performing
an actual joist test in a laboratory.
The number of contiguous joists with corrosion and their position in the slab are very crucial to
make a correct diagnosis. This paper presents cases with 1, 2, 3 or all the joists corroded in a
bay, in the different possible positions of a slab.
Fig. 3. Items to be followed in surveillance task
Finally, there is the possibility to extract concrete test specimens and test them in the laboratory.
The real tests are expensive and must be decided as assessed in the second point. This option

has not been taken in this research, as it is considered that a thorough study of the project and a
data collection is sufficient to assess the remaining safety.
To summarize, Fig. 3 shows a diagram with the items to be followed in surveillance task.
Specimens geometry
The specimens under study represent a large amount of the more usual slabs with conventional
spans. The framed structure is made of flat beams and precast pre-stressed joists. The
assessment includes two slab thickness, 25 cm and 30 cm. These cases are analysed because
they are the most common types of affected structures, and the conclusions drawn from this
research will benefit a large number of cases.
The models are made with a high degree of precision. The volumetric finite elements of concrete
and brickwork, together with linear finite elements for the steel reinforcement, are placed in their
exact positions. Any additional strength mechanism appears due to the three-dimensional
models. In this way, the study obtains results as close to reality as possible.
Taking advantage of the fact that the studied models have double symmetry, a quarter of the
building is simulated. The same results as if the entire building had been modelled are obtained
by correctly applying the boundary conditions in the symmetries and ground support conditions,
but with a reduced computational cost.
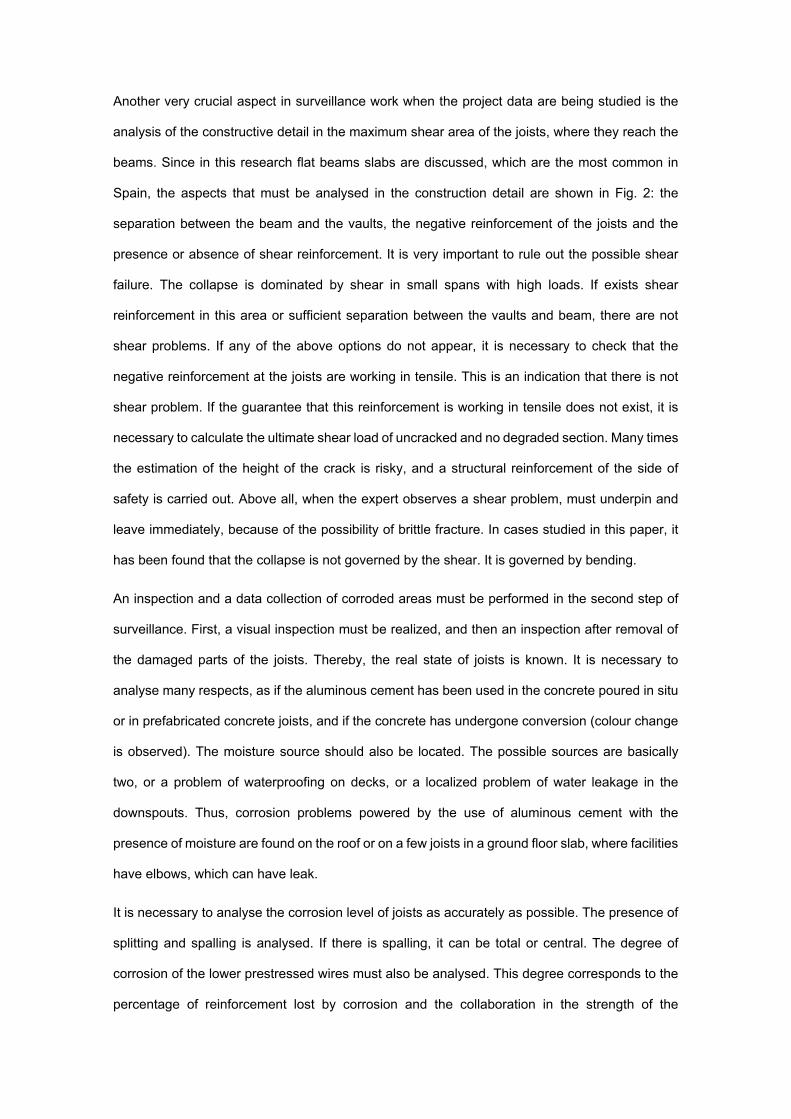
The studied specimens are modelled as accurate as possible. Fig. 4 shows the geometry of the
30 cm of slab thickness model. The 25 cm specimens are exactly alike, with the only variation of
the slab thickness. It is a three storey building with a height of 2.64 + 0.30 m of slab each storey.
It is a framed structure with three spans in the direction of the beams and in the direction of the
joists. The columns measure 30x30, and flat beams measure 60x30, with spans of 4.47 - 5.22 -
4.47 m. The spans in the direction of the joists are of 4.92 - 4.92 - 4.92 m. The spans are measured
from the centre of the columns. The spacing between joists centre-lines is 69 cm.
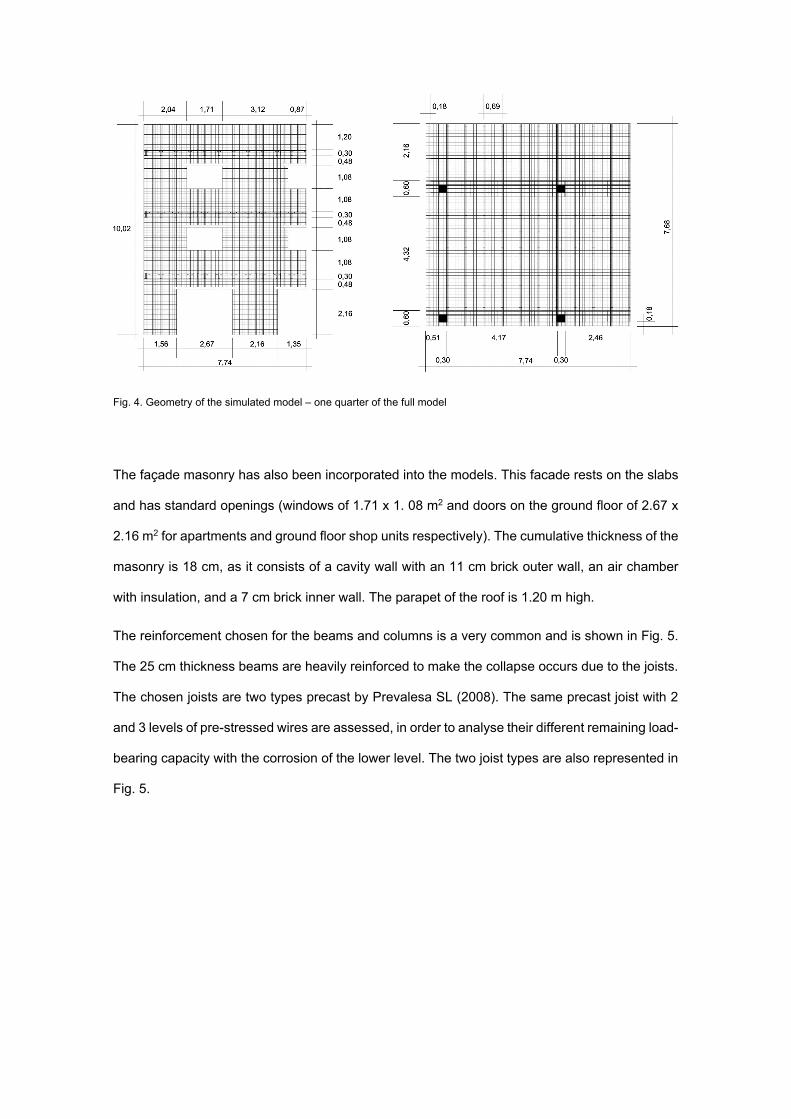
Fig. 4. Geometry of the simulated model – one quarter of the full model
The façade masonry has also been incorporated into the models. This facade rests on the slabs
and has standard openings (windows of 1.71 x 1. 08 m2 and doors on the ground floor of 2.67 x
2.16 m2 for apartments and ground floor shop units respectively). The cumulative thickness of the
masonry is 18 cm, as it consists of a cavity wall with an 11 cm brick outer wall, an air chamber
with insulation, and a 7 cm brick inner wall. The parapet of the roof is 1.20 m high.
The reinforcement chosen for the beams and columns is a very common and is shown in Fig. 5.
The 25 cm thickness beams are heavily reinforced to make the collapse occurs due to the joists.
The chosen joists are two types precast by Prevalesa SL (2008). The same precast joist with 2
and 3 levels of pre-stressed wires are assessed, in order to analyse their different remaining load-
bearing capacity with the corrosion of the lower level. The two joist types are also represented in
Fig. 5.
Fig. 5. Geometry and reinforcement for beams, columns and prestressed joists in assessed specimens
Behaviour of materials
The nonlinear behaviour of materials throughout their entire load range has been taken into
account. The assessed models consist of a complete structure of reinforced concrete with a
masonry façade, and so the three materials that form part of the research are concrete, steel, and
masonry.
All data entering the calculation should be as close as possible to reality because an expert report
is being realized: there is no discussion of confidence limits and reduction coefficients. As the aim
is to be as accurate as possible, average strength values obtained in laboratory tests are used
rather than the characteristic strength values that are used in structural design (Ingeciber 2004).
Table 1 summarises the materials properties used in this research.
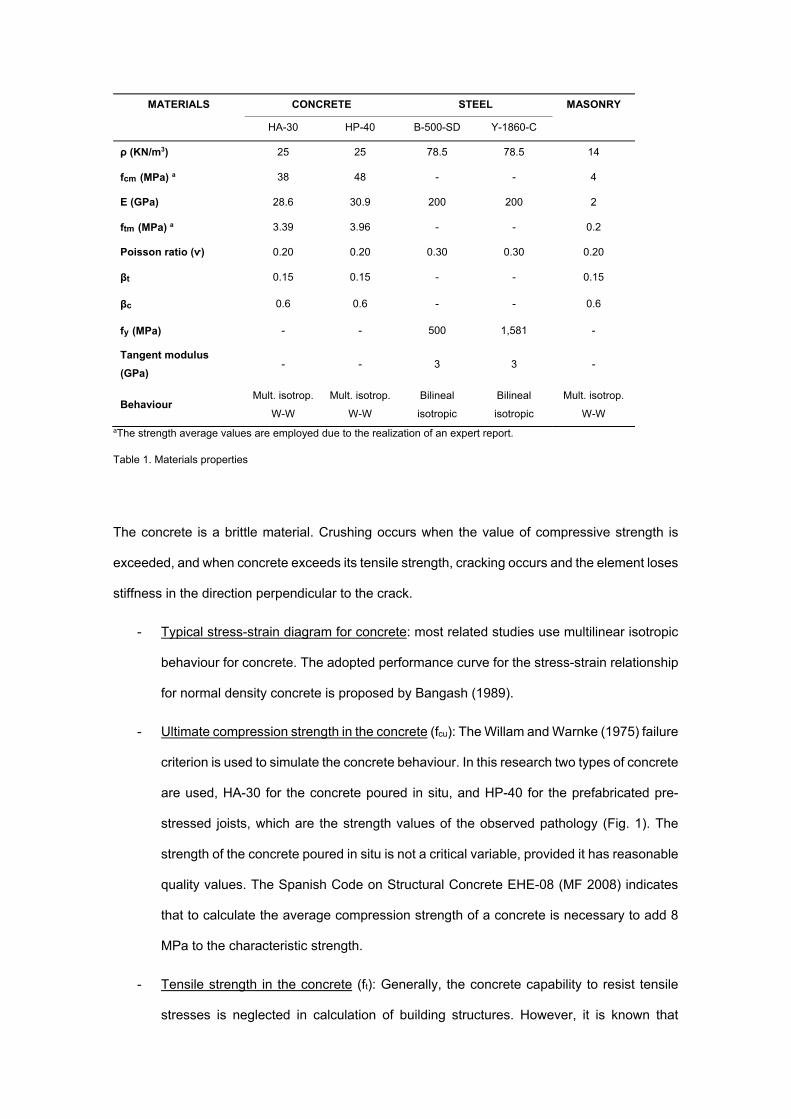
MATERIALS CONCRETE STEEL MASONRY
HA-30 HP-40 B-500-SD Y-1860-C
ρ (KN/m3) 25 25 78.5 78.5 14
fcm (MPa) a 38 48 - - 4
E (GPa) 28.6 30.9 200 200 2
ftm (MPa) a 3.39 3.96 - - 0.2
Poisson ratio (ѵ) 0.20 0.20 0.30 0.30 0.20
βt 0.15 0.15 - - 0.15
βc 0.6 0.6 - - 0.6
fy (MPa) - - 500 1,581 -
Tangent modulus
(GPa) - - 3 3 -
Behaviour Mult. isotrop.
W-W
Mult. isotrop.
W-W
Bilineal
isotropic
Bilineal
isotropic
Mult. isotrop.
W-W
aThe strength average values are employed due to the realization of an expert report.
Table 1. Materials properties
The concrete is a brittle material. Crushing occurs when the value of compressive strength is
exceeded, and when concrete exceeds its tensile strength, cracking occurs and the element loses
stiffness in the direction perpendicular to the crack.
- Typical stress-strain diagram for concrete: most related studies use multilinear isotropic
behaviour for concrete. The adopted performance curve for the stress-strain relationship
for normal density concrete is proposed by Bangash (1989).
- Ultimate compression strength in the concrete (fcu): The Willam and Warnke (1975) failure
criterion is used to simulate the concrete behaviour. In this research two types of concrete
are used, HA-30 for the concrete poured in situ, and HP-40 for the prefabricated pre-
stressed joists, which are the strength values of the observed pathology (Fig. 1). The
strength of the concrete poured in situ is not a critical variable, provided it has reasonable
quality values. The Spanish Code on Structural Concrete EHE-08 (MF 2008) indicates
that to calculate the average compression strength of a concrete is necessary to add 8
MPa to the characteristic strength.
- Tensile strength in the concrete (ft): Generally, the concrete capability to resist tensile
stresses is neglected in calculation of building structures. However, it is known that
concrete has certain tensile strength, although this is much less than the compressive
strength. In order to obtain realistic results, this capability is recognised. According to
Eurocode-2 (AENOR 1993), the tensile strength is obtained by the equation (1).
fctm = 0.30 fck2/3 (1)
- Shear transfer coefficients for concrete (βt, βc): These coefficients quantify the amount of
shear passing from one side to the other of the crack and differentiating as to whether
the crack is open or closed. They can range from 0, indicating a total loss of the transfer,
to 1, which indicates that nothing is lost in transfer. According to a study by Padmarajaiah
and Ramaswamy (2002) the values we can adopt are: βt = 0.1 – 0.5 and βc = 0.7 – 0.9.
The lowest values have been adopted to ensure that fragile and dangerous mechanisms
governed by shear are not hidden.
- Modulus of elasticity for concrete (Ec): EHE-08 (MF 2008) describes the modulus of
elasticity from the average strength in compression of concrete after 28 days (2).
3,
3,0 500,8000,10 jcmjjcmj fEfE
(2)
- Poisson's ratio for concrete (ѵ): This is the ratio between longitudinal and transversal
strain. In concrete, according to the EC-2 (AENOR 1993), the ratio is always 0.20.
The steel is a material that has the same tensile and compressive behaviour. It is used in concrete
to provide tensile strength to the material.
- Typical stress-strain diagram for steel: A simplified bilinear isotropic behaviour is adopted
for the steel in this study. This behaviour is defined by an elastic limit and the tangent
modulus.
This study is conducted with B-500-SD steel and so an elastic limit of 500 MPa is used.
In numerous tension tests of corrugated steel bars – performed in accordance with UNE-
EN 10002-1 (AENOR 2002) in the construction laboratory at the Valencia School of
Architecture (Ibertest STIB 200W machinery) – the elastic limit obtained for the B-500-
SD bars was never less than 550 MPa; while the ultimate strength was always greater
than 650 MPa. The pre-stressed steel used in this research is the Y-1860-C, with an
elastic limit of 1,581 MPa (Prevalesa 2008).
A value of 3 GPa for the tangent modulus is adopted, which corresponds with 1.5% of the
modulus of elasticity. With this value, the problems of convergence are avoided and the
load-displacement diagrams will be more realistic.
- Modulus of elasticity for steel (Es): Both the EC-2 as well as EHE-08 recommend a value
of 200 GPa for steel.
- Poisson's ratio for steel: A value of 0.3 is recommended by Gere and Timoshenko (1997)
and widely accepted in the literature.
Masonry is a heterogeneous and nonlinear material that reveals distinct directional properties
because mortar joints act as planes of weakness or brittleness (Dilrukshi et al 2010).
- Modelling strategies in masonry: There have been numerous attempts to model the
complicated reality of this material. Depending on the level of precision and simplicity
desired, researchers have used a variety of strategies. The most common methods are
the techniques of micro and macro-modelling (Lourenço 2002).
The macro-modelling is used in this research because the main objective is to assess the
safety of slabs. The masonry wall contributes weight and stiffness, but this case is not
evaluating its condition.
- Compression strength in the masonry (fc): the masonry wall is composed of perforated
bricks with cement mortar joints, whose strength is 5 N/mm2. As it is not an isotropic
material, the strength refers to the direction in which the stress is acting. The Spanish
Basic Document on Structure Security for Masonry Walls DB SE-F of the Technical
Building Code (MV 2006) indicates that for a normalised perforated brick with strength of
10 N/mm2 and mortar strength of 5 N/mm2, the average wall strength (ffm) is equal to 4
N/mm2, and this overall value has been adopted.
The data on the behaviour of the masonry has been partially taken from studies by Brencich and
de Felice (2009), by Dilrukshi et al (2010), and by Cubel et al (2012).
Validation of models
Apart from the extensive experience regarding the surveying of buildings with corroded joists, any
tests for buildings with widespread corrosion has not been found in the literature. It is sometimes
difficult to accept the loads that have been supported in structures where all of the reinforcement
has corroded. A very careful calibration of the numeric simulations has been made for these
reasons.
The assessed specimens have a size that does not allow experimental tests to compare the
results, as they are complete buildings. This highly nonlinear simulation is conducted using the
Ansys software. To validate the results obtained with this software, and verify the accuracy of the
hypothesis and models used, simple models analysed by authors in related research are
validated.
- Bending with concrete failure: The studies performed by Barbosa and Ribeiro (1998) have
been simulated. They analyse failure domain governed by concrete in bending elements.
In Barbosa and Ribeiro’s case, shear reinforcement is not available to enhance failure
due to the concrete.
- Bending with steel failure: Fanning (2001) models are also analysed. The failure is
governed by the steel. In Fanning’s study, there is enough shear reinforcement for the
concrete to hold until the steel failure.
- Compression: The studies published by Tavio and Tata (2009) regarding the various
possibilities of stirrups for elements subjected to axial compression have been
reproduced successfully.
- Corrosion of elements subjected to bending: Finally, it is necessary to achieve the
corroded elements response. Because complete buildings tests are not available and the
aspect that governs the failure in this research is the corrosion of some joists, the
validation of corroded simple elements subjected to bending is the foundation that gives
validity to this research. The corroded elements tested by Rodríguez et al (GEOCISA-
Dragados Group) (1997) have been reproduced. Previously they had been simulated by
Coronelli and Gambarova (2004) with Ansys FEM software.

In Rodríguez et al. research there are specimens with bending failure and shear failure.
All specimens have been reproduced successfully in Ansys software, following Coronelli
and Gambarova's specifications. The used shear transfer coefficients allow to reproduce
the shear failure. That is, if an element with a failure governed by shear is simulated, the
software is able to reproduce this kind of failure. With this, the corroded elements
subjected to bending and shear are validated.
Coronelli and Gambarova simulate the corrosion by reducing the section of concrete and
steel and decreasing the strength of both materials. As a sample, Fig. 6 shows the
correlation between the results for specimen 11.5 obtained by our simulation, the
Coronelli and Gambarova’s simulation and the original test or Rodriguez et al.
Fig. 6. Load-displacement curves for specimen 11.5 in the test made by Rodríguez, Ortega, and Casal; the Coronelli and
Gambarova’s study, and our simulation
The worst case is studied in this research, when the lower level of pre-stressing tendons
disappears completely.
The validated results are consistent in all these models, so that both the software and the
properties of the materials are accepted as a valid tool for the research.
Process of load application and emergence of constructive elements
To capture the real performance of all the constructive elements and the entire building, the birth
and death of elements are used. In this way, each element is exerting an influence from the
moment it appears in the construction and each element begins to stiffen at the moment it does
in reality. Load is applied in a series of steps reflecting the order of appearance in the construction.
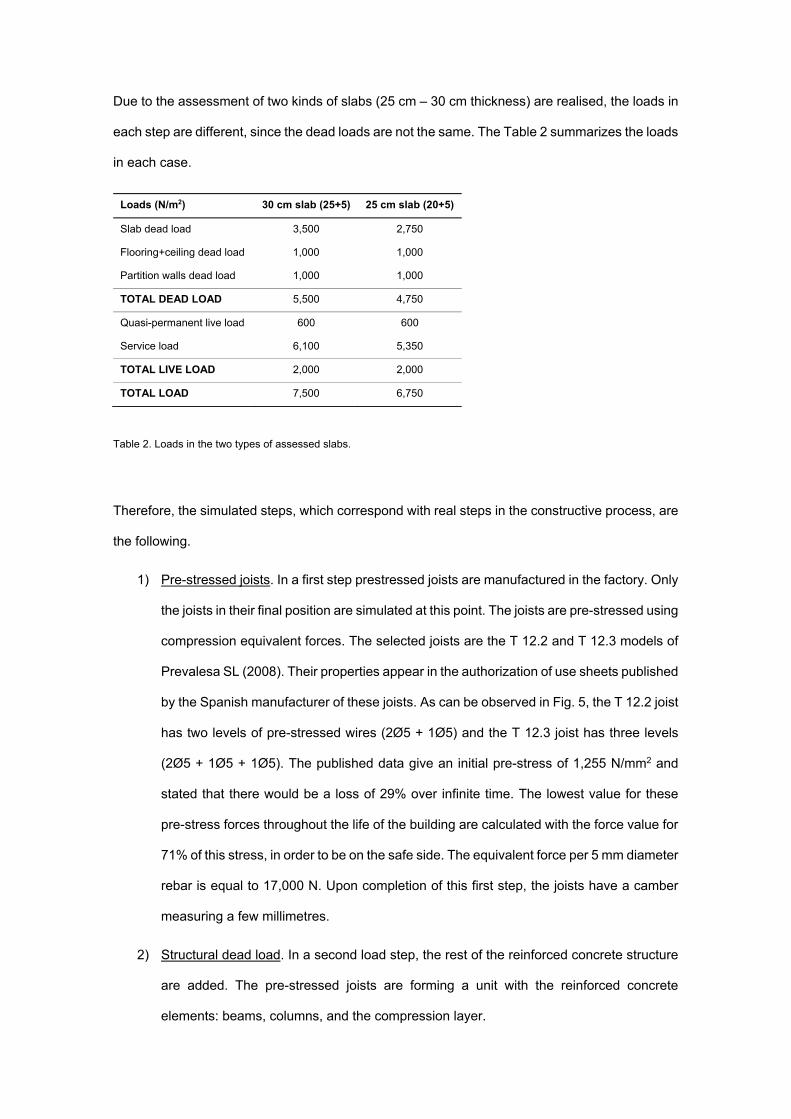
Due to the assessment of two kinds of slabs (25 cm – 30 cm thickness) are realised, the loads in
each step are different, since the dead loads are not the same. The Table 2 summarizes the loads
in each case.
Loads (N/m2) 30 cm slab (25+5) 25 cm slab (20+5)
Slab dead load 3,500 2,750
Flooring+ceiling dead load 1,000 1,000
Partition walls dead load 1,000 1,000
TOTAL DEAD LOAD 5,500 4,750
Quasi-permanent live load 600 600
Service load 6,100 5,350
TOTAL LIVE LOAD 2,000 2,000
TOTAL LOAD 7,500 6,750
Table 2. Loads in the two types of assessed slabs.
Therefore, the simulated steps, which correspond with real steps in the constructive process, are
the following.
1) Pre-stressed joists. In a first step prestressed joists are manufactured in the factory. Only
the joists in their final position are simulated at this point. The joists are pre-stressed using
compression equivalent forces. The selected joists are the T 12.2 and T 12.3 models of
Prevalesa SL (2008). Their properties appear in the authorization of use sheets published
by the Spanish manufacturer of these joists. As can be observed in Fig. 5, the T 12.2 joist
has two levels of pre-stressed wires (2Ø5 + 1Ø5) and the T 12.3 joist has three levels
(2Ø5 + 1Ø5 + 1Ø5). The published data give an initial pre-stress of 1,255 N/mm2 and
stated that there would be a loss of 29% over infinite time. The lowest value for these
pre-stress forces throughout the life of the building are calculated with the force value for
71% of this stress, in order to be on the safe side. The equivalent force per 5 mm diameter
rebar is equal to 17,000 N. Upon completion of this first step, the joists have a camber
measuring a few millimetres.
2) Structural dead load. In a second load step, the rest of the reinforced concrete structure
are added. The pre-stressed joists are forming a unit with the reinforced concrete
elements: beams, columns, and the compression layer.

3) Flooring and ceiling dead load (+1,000 N/m2). The load on the slab reaches 4,500 N/m2
and 3,750 N/m2 in 30 cm and 25 cm thickness slab respectively. This load corresponds
to the phase of the work in which has not yet been built the partition walls and the façade,
and still the live load is not involved. From this point onwards, an active deflection will
occur with respect to the partition walls.
4) Façade and partition walls (+1,000 N/m2). At this point the façade is born. It begins to
stiffen and its dead weight and strength are added. The partition walls are simulated as
a dead load of 1,000 N/m2.
5) Service load. The service load is the load value with which will be subjected the structure
throughout its service life. The live load in Spain is 2,000 N/m2 according to CTE (MV
2006). The entire slab is not loaded with this load continuously. According to this
standard, the quasi-permanent value of the live load is the value that is exceeded during
50% of the reference time, and its value is 600 N/m2. Therefore, the service load is
composed of the overall dead load and the quasi-permanent part of the live load. There
is this load on the slabs in their service life. During the service life is when there are
corrosion problems. Therefore, the corrosion is simulated in the next step.
6) Corrosion. In the sixth load step, the pre-stress of the lower level of wires of some joists
is eliminated – depending on the case studied. The corrosion is simulated with the total
loss of these wires. In some specimens the loss of the lower concrete cover due to
spalling is also simulated (the event that has motivated us to conduct this research). But
the other pre-stressed strands of the prefabricated joists are maintained as they have not
corroded and continue to assist in supporting the slab. When investigating issues related
to corrosion, there are several options for modelling the loss of bond. Some studies
assume complete bond and ignore any slippage (Fanning 2001; Kawakami and Ito 2003;
Kotsovos and Pavlovic 2004; Wolanski 2004; Chansawat et al 2006; Kaewunruen and
Remennikov 2006; Mahmudur and Alam 2006). Another option is to model the complex
phenomenon that occurs in reality and allow some slippage (Padmarajaiah and
Ramaswamy 2002; Thomas and Ramaswamy 2006). This option is appropriate when
analysing a single element. However, in the present case, which is the extreme case of
total loss of the lower tendons in a section, it makes no sense to model adhesion given
that the wires are broken and cannot transmit forces. The fact of simulate the complete
corrosion can provide a lower bound value of the response and failure load, so that it is
in side of the safety.
7) Total live load. A 1,400 N/m2 load is necessary to complete the live load and to meet legal
standards. The Load Factor is obtained making the ratio between the load for which a
specimen achieves the permissible active deflection respect to the partition walls, and
the load that standards accept (7,500 N/m2 and 6,750 N/m2 for 30 and 25 cm thickness
slabs respectively). It quantifies the remaining safety for each case, always meeting
standards.
8) Load until failure. Finally, in an eighth load step, some parts of the slab are loaded until
their collapse – according to the specific case studied.
Remaining safety study
A big amount of healthy and damaged specimens of an entire building of three levels with typical
dimensions are simulated. With the simulations, the load-vertical displacement curves of some
points can be drawn. The study of these behavioural curves can help the proficients in making
decisions about the actions to take. Two aspects can be assessed in these curves and can help
the experts, the ACI-318 (ACI 2008) load test for existing structures and the Load Factor.
The essential tool is the ACI-318 load test, which indicates whether a structure may continue in
use. The Load Factor tool is proposed in this research.
According to ACI-318, the slab analysed area must be loaded to 0.85 (1.4 D + 1.7 L), including
dead load already present. D is the sum of the dead loads, and L is the total live load. Therefore,
the total load value for the load test is equal to 9,435 N/m2 and 8,542.5 N/m2 for slabs of 30 cm
and 25 cm respectively. If the deflection increase caused by the test does not exceed ∆1, being
∆1 ≤ lt2 / 20,000 h, construction can continue in use, where lt is the span between supports (4.92
m in the present research) and h is the slab thickness. Thus, a deflection increase equal to 4.03
mm is allowed in the 30 cm specimens and an increase of 4.84 mm in 25 cm specimens.

Since corrosion appears throughout the service life of the building, the slab will be bearing the
service load when the load test is performed. The slab is loaded from the service load to the total
test load, and the deflection increase limit is allowed. This can be analysed in the load-vertical
displacement curves. When exceeding this limitation, retrieved deformation must be measured
when slab is unloaded, and it should be bigger than 75% of ∆1. In this case, the building is also
accepted to continue in use.
The other tool to help the experts in residual safety assessment is the Load Factor. It is obtained
making the ratio between the load that each model bears and the total load that they must bear.
The maximum allowable active deflection in both the Spanish Code on Structural Concrete (EHE)
(MF 2008) and the Technical Building Code (CTE) (MV 2006) has been adopted in order to
analyse the maximum load that meets standards. The limitation is L / 400, being L the span. The
span of the joists is 4.92 m as measured from the centre of the columns. This gives an allowable
deformation of 1.23 cm. The active deflection for the partition walls is produced from the moment
that the element is constructed (4,500 N/m2 and 3,750 N/m2 in the studied cases), namely the
deflection that has already occurred until the instant that the element is constructed is not
included. Therefore, to get the Load Factor, the vertical displacement that a specimen has at the
previous moment to the partition walls appear must be noted, and add the permissible active
deflection (1.23 cm). The ratio between the supported load at this deflection and the load that
standards establish must be made. An estimation of the remaining safety can be obtained with
this ratio. A ratio below two should not be accepted.
Studied cases and results
The aim of this research is to assess the remaining safety in slabs made with prestressed joists
when they are corroded. In order to propose intervention criteria for the whole casuistry,
numerous variables have been taken into account: the slab thickness, the number of contiguous
joists affected by corrosion, the position of the corroded joists in the slab, the presence of spalling
(total or central), and the number of levels of prestressed wires in the joists.

A quarter of a three-storey building is modelled. This does not imply that the cracking patterns in
slabs are doubly symmetrical. It is only made to reduce the computational cost, obtaining valid
results as the symmetry conditions are well modelled. The corrosion is always simulated on the
second-floor slab to find the ideal intermediate position in the case of a framed structure. As a
result, the influence of the embedded columns found on the ground floor and the lack of upward
continuity in the columns of the third floor are avoided.
Table 3 and table 4 show the simulated specimens, the Load Factor values and the results of
ACI-318 load test. The three slabs are loaded up to service load with the previously discussed
load steps, which take into account the construction process. The corrosion is simulated at this
moment because it appears during service life. It is simulated with prestressed wires and concrete
cover death, depending on the studied case. Then, the corroded areas are loaded until the failure.
Fig. 7. Bays, squares and significant points of the model
Cases A, B and C are specimens of 30 cm thickness slabs, and cases D and E are 25 cm
thickness slabs models. Fig. 7 presents the nomenclature of bays, squares and representative
points.

Slab specimens of 30 cm thick Load at admissible
active deflection (N/m2)
Load Factor
Qadm.act.defl./Qstand.
ACI-318
Load Test
Complete slab Healthy A 14,493 1.93 Right
Outer bay
Healthy B.1. 16,368 2.18 Right
All joists corroded Without spalling B.2.1. 13,135 1.75 Right
Total spalling B.2.2. 12,451 1.66 Right
Total spalling, joists with 1
remaining level of tendons
B.2.3. 10,849 1.45 Right
Square 2 3 joists corroded Without spalling B.3.1. 15,152 2.02 Right
Central spalling B.3.2. 15,040 2.01 Right
Total spalling B.3.3. 15,008 2.00 Right
Total spalling, joists with 1
remaining level of tendons
B.3.4. 13,045 1.74 Right
2 joists corroded Total spalling B.4. 14,802 1.97 Right
Central bay Healthy C.1. 18,698 2.49 Right
All joists corroded Without spalling C.2.1. 15,095 2.01 Right
Total spalling C.2.2. 14,462 1.93 Right
Total spalling, joists with 1
remaining level of tendons
C.2.3. 12,485 1.66 Right
Square 4 3 joists corroded Without spalling C.3.1. 18,226 2.43 Right
Central spalling C.3.2. 17,948 2.39 Right
Total spalling C.3.3. 17,350 2.31 Right
Total spalling, joists with 1
remaining level of tendons
C.3.4. 15,453 2.06 Right
2 joists corroded Total spalling C.4. 17,461 2.33 Right
Table 3. Load Factor and ACI-318 load test in 30 cm thickness slabs.
Case A simulates an entirely healthy building to see how much load can support. As there is no
corrosion, the entire slab 2 is loaded until the collapse in the last load step. B and D specimens
assess the cases in which the corrosion appears in the outer bay, and in C and E specimens the
corrosion is in the central bay.
All the possibilities are simulated (Vercher 2013), but the table 3 and table 4 show the results of
the most representative ones in order to maintain the paper extension. The points 2 and 4 are the
dominant in the outer and central bay respectively. The study is also carried out in points 1 and
3, but no additional information is provided and so they are not shown. In turn, point 2 is more
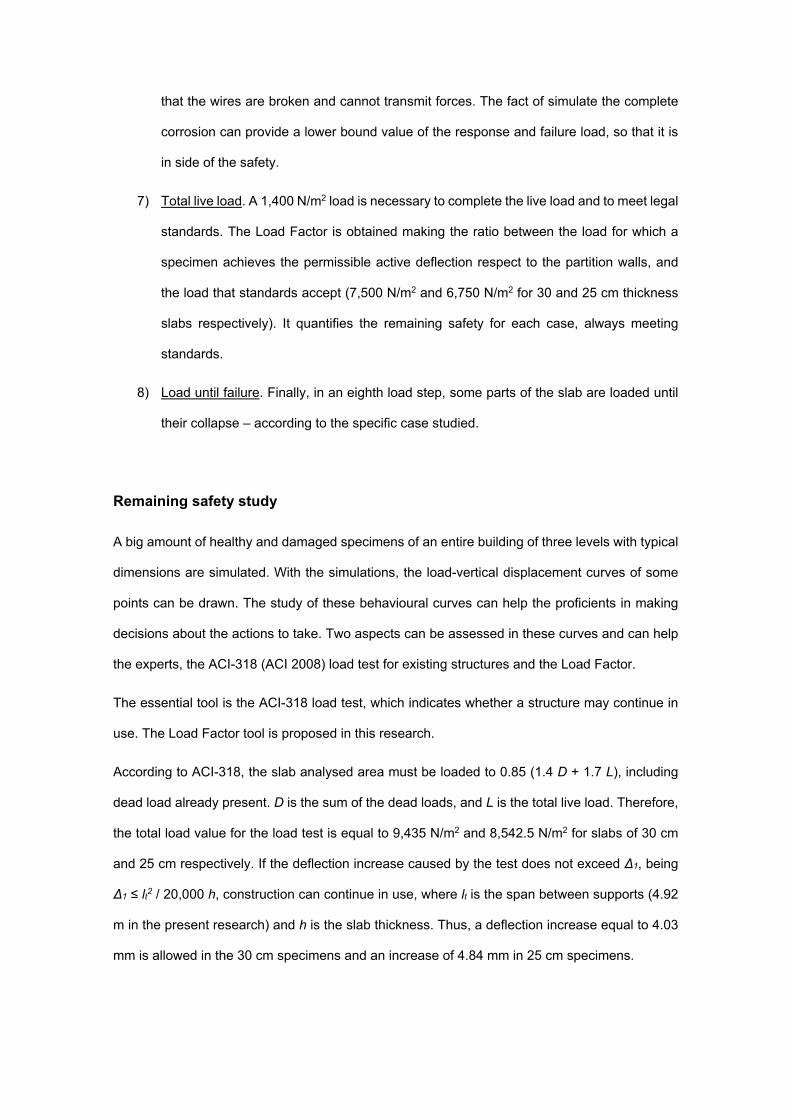
dominant than point 4 because it has more deflection for the same load. Fig. 8 represents load-
vertical displacement curves of B specimens, which have 30 cm thickness slabs and corrosion
appears in the outer bay.
Fig. 8. Load-vertical displacement curves at point 2 for B specimens (30 cm thickness slabs)
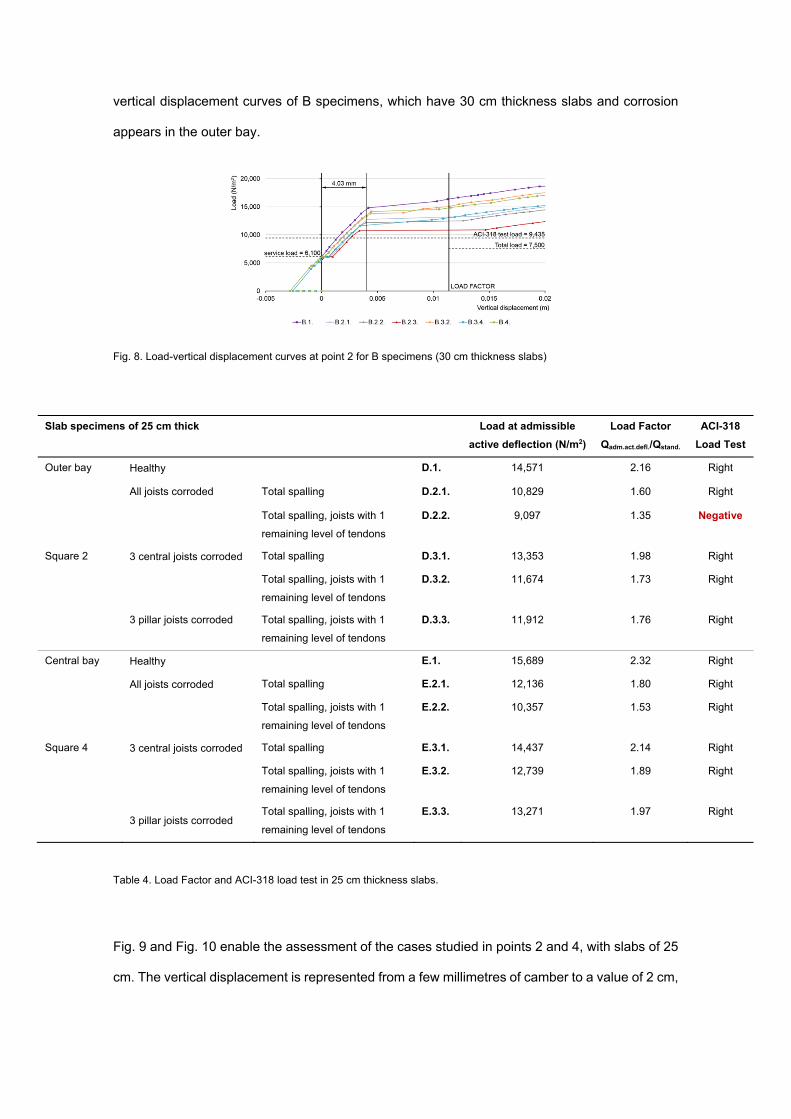
Slab specimens of 25 cm thick Load at admissible
active deflection (N/m2)
Load Factor
Qadm.act.defl./Qstand.
ACI-318
Load Test
Outer bay
Healthy D.1. 14,571 2.16 Right
All joists corroded Total spalling D.2.1. 10,829 1.60 Right
Total spalling, joists with 1
remaining level of tendons
D.2.2. 9,097 1.35 Negative
Square 2 3 central joists corroded Total spalling D.3.1. 13,353 1.98 Right
Total spalling, joists with 1
remaining level of tendons
D.3.2. 11,674 1.73 Right
3 pillar joists corroded Total spalling, joists with 1
remaining level of tendons
D.3.3. 11,912 1.76 Right
Central bay Healthy E.1. 15,689 2.32 Right
All joists corroded Total spalling E.2.1. 12,136 1.80 Right
Total spalling, joists with 1
remaining level of tendons
E.2.2. 10,357 1.53 Right
Square 4 3 central joists corroded Total spalling E.3.1. 14,437 2.14 Right
Total spalling, joists with 1
remaining level of tendons
E.3.2. 12,739 1.89 Right
3 pillar joists corroded Total spalling, joists with 1
remaining level of tendons
E.3.3. 13,271 1.97 Right
Table 4. Load Factor and ACI-318 load test in 25 cm thickness slabs.
Fig. 9 and Fig. 10 enable the assessment of the cases studied in points 2 and 4, with slabs of 25
cm. The vertical displacement is represented from a few millimetres of camber to a value of 2 cm,
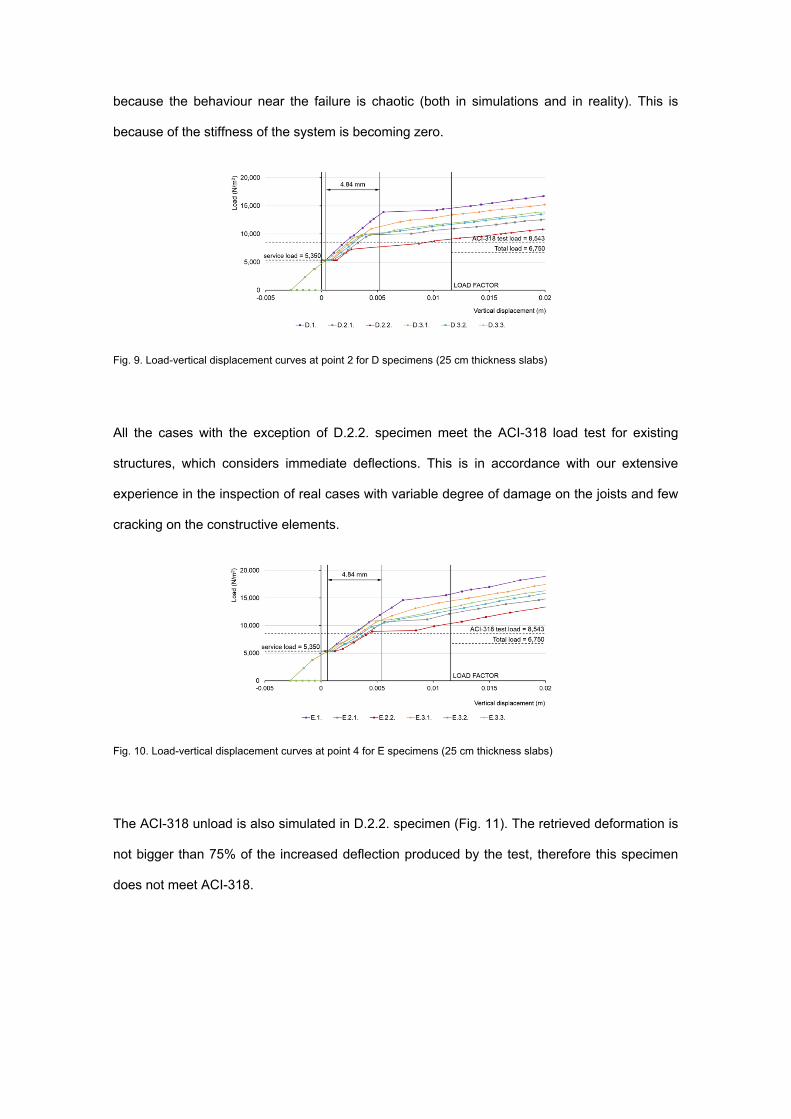
because the behaviour near the failure is chaotic (both in simulations and in reality). This is
because of the stiffness of the system is becoming zero.
Fig. 9. Load-vertical displacement curves at point 2 for D specimens (25 cm thickness slabs)
All the cases with the exception of D.2.2. specimen meet the ACI-318 load test for existing
structures, which considers immediate deflections. This is in accordance with our extensive
experience in the inspection of real cases with variable degree of damage on the joists and few
cracking on the constructive elements.
Fig. 10. Load-vertical displacement curves at point 4 for E specimens (25 cm thickness slabs)
The ACI-318 unload is also simulated in D.2.2. specimen (Fig. 11). The retrieved deformation is
not bigger than 75% of the increased deflection produced by the test, therefore this specimen
does not meet ACI-318.

Fig. 11. Unload for D.2.2. specimen according to ACI-318
The acceptable Load Factor in cases of rehabilitation remains the responsibility of the expert
performing the project, and depends on local standards. Anyway, it seems sensible to assume a
value near to two as a minimum, depending on the reliability of the materials tests. A high reliability
of concrete tests allows the reduction of its partial safety coefficient. Vielma et al (2008) assume
the value of 2 in the safety assessment of R/C buildings in seismic analyses.
All the studied specimens have a Load Factor near to 2, except when joists are all corroded. This
fact allows to define the intervention criteria in a relaxed way.
Summary and conclusions
In case of damage it is always necessary to perform rehabilitation work, even for aesthetic or
social conditions. This work can range from a protective coating to a complete structural
reinforcement. There are specific criteria for deciding on the action to be performed. Definition of
criteria for control and maintenance of the building is also essential in all cases of structural
rehabilitation. Both damaged and healthy joists must always be protected to prevent access of
aggressive agents.
Structural reinforcement is always recommended in cases of severe corrosion of lower tendons
when there is no certainty that failure behaviour is governed by bending. In residential buildings
with heavy façade and usual load range and spans, failure mechanism is often governed by
bending.

The hereunder conclusions and recommendations can be applied in cases with no problems with
the dangerous shear, the upper reinforcement is healthy, and both precast concrete joist and
poured in situ concrete have acceptable mechanical characteristics.
The number of remaining levels of tendons after the corrosion is more determinant than the
amount of spalling. Load Factor approximates 2.00 when there are two remaining levels and is
1.70 when there is one remaining level, in cases of 3 adjacent joists corroded.
A very economical way to design buildings with more residual safety is by placing thicker rebar
for positive reinforcement of the joists and well anchored near to the heads of the columns. This
has been found after an exhaustive study of failure mechanisms. It is favourable to corrosion
effects, dynamic effects and fire.
Conducting a study of results presented in Tables 3 and 4, it can be said:
- In cases up to 3 adjacent corroded joists, even with complete spalling, construction meets
the acceptance criteria of the ACI-318, regardless of the position, of the slab thickness
and the number of levels of prestressed wires. These cases have a Load Factor that
allows to propose a light intervention project. This is the most frequent case and is due
to a punctual leakage of water pipes, which affects less than three contiguous joists (Fig.
7).
- When all joists are corroded in a bay, the situation is alarming and needs immediate
intervention project. The acceptance criteria of the ACI-318 is met in cases where after
lower level of tendons are corroded, two or more healthy levels remain. However, it is
also recommended intensive intervention. This case is usually motivated by a very
widespread moisture, roofs or not ventilated spaces.
A light intervention is enough in the cases in which a reasonable safety is observed in ultimate
limit states. This intervention can be a protective coating and a consolidation that is realised in
the most common cases of corrosion of part of the reinforcement of one of the joists (Fig. 12a).
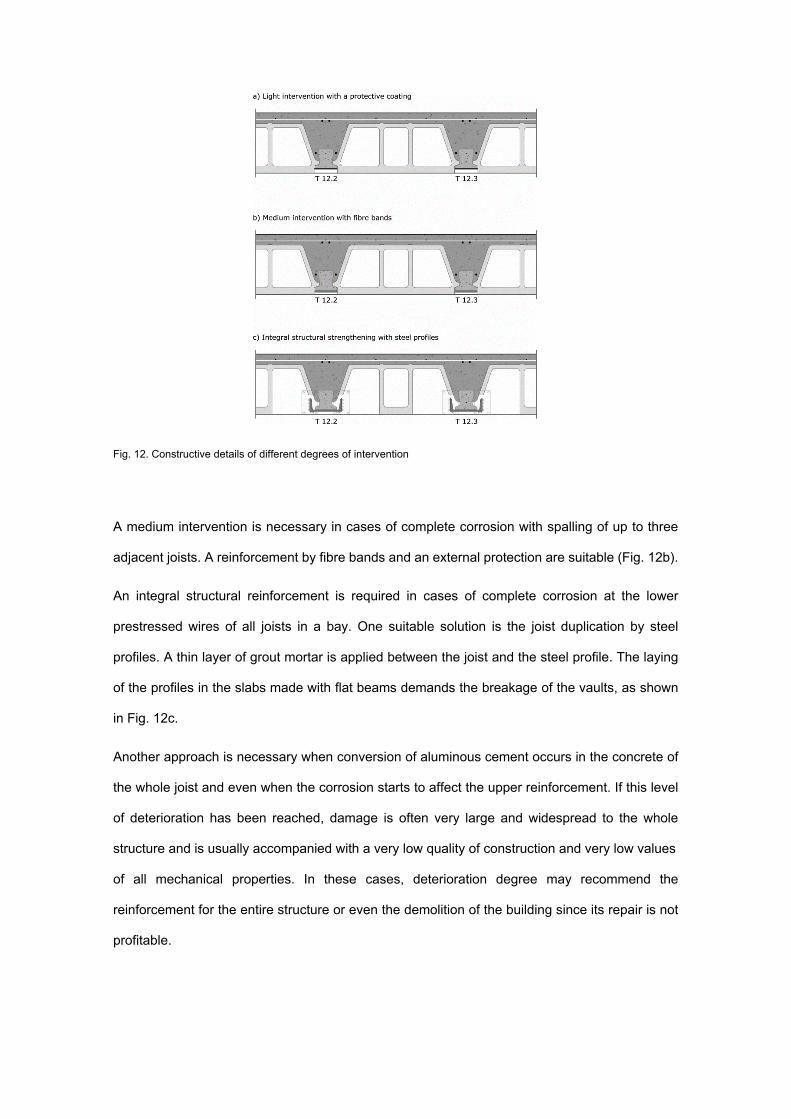
Fig. 12. Constructive details of different degrees of intervention
A medium intervention is necessary in cases of complete corrosion with spalling of up to three
adjacent joists. A reinforcement by fibre bands and an external protection are suitable (Fig. 12b).
An integral structural reinforcement is required in cases of complete corrosion at the lower
prestressed wires of all joists in a bay. One suitable solution is the joist duplication by steel
profiles. A thin layer of grout mortar is applied between the joist and the steel profile. The laying
of the profiles in the slabs made with flat beams demands the breakage of the vaults, as shown
in Fig. 12c.
Another approach is necessary when conversion of aluminous cement occurs in the concrete of
the whole joist and even when the corrosion starts to affect the upper reinforcement. If this level
of deterioration has been reached, damage is often very large and widespread to the whole
structure and is usually accompanied with a very low quality of construction and very low values
of all mechanical properties. In these cases, deterioration degree may recommend the
reinforcement for the entire structure or even the demolition of the building since its repair is not
profitable.
References
American Concrete Institute (ACI). (2008). “Building Code Requirements for Structural Concrete
(ACI 318-08) and commentary. Strength Evaluation of Existing Structures.” ACI, Michigan.
Anh Vu, N., Castel, A., and François, R. (2009). “Effects of stress corrosion cracking on stress-
strain response of steel wires used in prestressed concrete beams.” Corros. Sci., 51, 1453-9.
Ann, K.Y., Kim, T.-S., Kim, J.H., and Kim, S.-H. (2010). “The resistance of high alumina cement
against corrosion of steel in concrete.” Constr. Build. Mater., 24, 1502-1510.
Antonovic, V., Keriene, J., Boris, R., and Aleknevieius, M. (2013). “The Effect of Temperature on
the Formation of the Hydrated Calcium Aluminate Cement Structure.” Proced. Eng., 57, 99-106.
Asociación Española de Normalización (AENOR). (1993). “EUROCÓDIGO-2 (EC-2) Proyecto de
estructuras de hormigón. Parte 1-1: Reglas Generales y Reglas para Edificación.” Ed. AENOR,
Madrid.
Asociación Española de Normalización (AENOR). (2002). “UNE-EN 10002-1: Materiales
metálicos. Ensayos de tracción. Parte 1: Método de ensayo a temperatura ambiente.” Ed.
AENOR, Madrid.
Bangash, M.Y.H. (1989). “Concrete and concrete structures: Numerical modelling and
applications.” Elsevier Applied Science, London and New York.
Barbosa, A.F., and Ribeiro, G.O. (1998). “Analysis of reinforced concrete structures using Ansys
nonlinear concrete model.” Comput. Mech., 1(8), 1-7.
BIA. (1992). “Viguetas con cemento aluminoso: proceso, patología y soluciones.” BIA., 158, 53-
8.
Brencich, A., and de Felice, G. (2009). “Brickwork under eccentric compression: Experimental
results and macroscopic models.” Constr. Build. Mater., 23(5), 1935-1946.
Calavera Ruiz, J. (2003). “Cálculo, construcción, patología y rehabilitación de forjados de
edificación.” Ediciones INTEMAC, Madrid.
Chansawat, K., Yim, S.C.S., and Miller, T.H. (2006). “Nonlinear finite element analysis of FRP-
strengthened reinforced concrete bridge.” J. Bridge. Eng., 11(1), 21-32.

Coronelli, D., and Gambarova, P. (2004). “Structural assessment of corroded reinforced concrete
beams: modelling guidelines.” J. Struct. Eng., 130(8), 1214-1224.
Cubel, F., Más, A., Vercher, J., and Gil, E. (2012). “Design and construction recommendations
for brick enclosures with continuous air chamber.” Constr. Build. Mater., 36, 151-164.
Dilrukshi, K.G.S., Dias, W.P.S., and Rajapakse, R.K.N.D. (2010). “Numerical modelling of cracks
in masonry walls due to thermal movements in an overlying slab.” Eng. Struct., 32, 1411-1422.
Fanning, P. (2001). “Nonlinear models of reinforced and post-tensioned concrete beams.”
Electron. J. Struct. Eng., 2, 111-9.
Federation International du Béton (FIB-2000). (2000). “Bond of reinforcement in concrete. State
of the Art Report.” Bulletin 10. Ed. FIB, Laussane (CH).
Foster, S.J., Bailey, C.G., Burgess, I.W., and Plank, R.J. (2004). “Experimental behaviour of
concrete floor slabs at large displacements.” Eng. Struct., 26, 1231-1247.
Gere, J.M., and Timoshenko, S.P. (1997). “Mechanics of Materials.” PWS Publishing Company,
Boston.
Ingeciber, S.A. (2004). “Elemento Solid65. Recomendaciones de uso con ANSYS / CivilFEM.”
Ingeciber SA, Madrid.
Instituto Valenciano de la Edificación (IVE). (2008a). “Serie guías de la calidad: Experiencia en
Inspección de estructuras en edificios. Comunidad Valenciana 1991-2008.” Conselleria de Medi
Ambient, Aigua, Urbanisme i Habitatge, Valencia.
Instituto Valenciano de la Edificación (IVE). (2008b). “Serie guías de la calidad: Guía de
Intervención en estructuras de hormigón en edificios existentes.” Conselleria de Medi Ambient,
Aigua, Urbanisme i Habitatge, Valencia.
Instituto Valenciano de la Edificación (IVE). (2008c). “Serie guías de la calidad: Guía para la
Inspección y Evaluación Complementaria de estructuras de hormigón en edificios existentes.”
Conselleria de Medi Ambient, Aigua, Urbanisme i Habitatge, Valencia.
Instituto Valenciano de la Edificación (IVE). (2008d). “Serie guías de la calidad: Guía para la
Inspección y Evaluación Preliminar de estructuras de hormigón en edificios existentes.”
Conselleria de Medi Ambient, Aigua, Urbanisme i Habitatge, Valencia.
Kaewunruen, S., and Remennikov, A.M. (2006). “Nonlinear finite element modelling of railway
prestressed concrete sleeper.” Proc. 10th East Asia-Pac. Conf. Struct. Eng. & Const., EASEC-10,
Bangkok, Thailand, 323-332.
Kawakami, M., and Ito, T. (2003). “Nonlinear finite element analysis of prestressed concrete
members using ADINA.” Comput. Struct., 81, 727-734.
Kotsovos, M.D., and Pavlovic, M.N. (2004). “Size effects in beams with small shear span-to-depth
ratios.” Comput. Struct., 82, 143-156.
Lourenço, P.B. (2002). “Computations on historic masonry structures.” Prog. Struct. Eng. Mater.,
4(3), 301-319.
Luz, A.P., and Pandolfelli, V.C. (2011). “Halting the calcium aluminate cement hydration process.”
Ceram. Int., 37, 3789-3793.
Mahmudur, R., and Alam, S.Z. (2006). “Experimental investigation and analytical simulation of
deflection behaviour of continuous RC beams.” Proc. 10th East Asia-Pac. Conf. Struct. Eng. &
Const., EASEC-10, Bangkok, Thailand, 243-247.
Micic, T.V., Chryssanthopoulos, M.K., and Baker, M.J. (1995). “Reliability analysis for highway
bridge deck assessment.” Struct. Saf., 17, 135-150.
Ministerio de Fomento (MF). (2008). “Instrucción de Hormigón Estructural (EHE-08).” Ed. Boletín
Oficial del Estado, Madrid.
Ministerio de Vivienda (MV). (2006). “Código Técnico de la Edificación (CTE).” Ed. Boletín Oficial
del Estado, Madrid.
Monfort, J. (2011). “Ética de la peritación estructural de edificios existentes.” Inf. Constr., 63(524),
75-82.
Padmarajaiah, S.K., and Ramaswamy, A. (2002). “A finite element assessment of flexural
strength of prestressed concrete beams with fiber.” Cem. & Concr. Compos., 24, 229-241.
Prevalesa, S.L. (2008). “Ficha de características técnicas - según EHE-08 - del forjado de
viguetas pretensado modelo DITECO T12.” Prevalesa SL, Valencia.
Rodriguez, J., Ortega, L.M., and Casal, J. (1997). “Load carrying capacity of concrete structures
with corroded reinforcement.” Constr. Build. Mater., 11(4), 239-248.
Sanz, B., Planas, J., Fathy, A.M., and Sancho, J.M. (2008). “Modelización con elementos finitos
de la fisuración en el hormigón causada por la corrosión de las armaduras.” An. Mec. Fract.,
25(102), 623-8.
Tavio, T., and Tata, A. (2009). “Predicting nonlinear behaviour and stress-strain relationship of
rectangular confined reinforced concrete columns with Ansys.” Civ. Eng. Dimens., 11(1), 23-31.
Thomas, J., and Ramaswamy, A. (2006). “Finite element analysis of shear critical prestressed
SFRC beams.” Comput. Concr., 3(1), 65-77.
Vercher, J. (2013). “Seguridad Residual en los Forjados con Corrosión Severa.” PhD thesis,
Universitat Politècnica de València, Valencia.
Vielma, J.C., Barbat, A.H., and Oller, S.H. (2008). “Reserva de resistencia de edificios porticados
de concreto armado diseñados conforme al ACI-318/IBC-2006.” Ing., 18, 121-131.
Willam, K.J., and Warnke, E.D. (1975). “Constitutive model for the triaxial behaviour of concrete.”
Proc. Int. Assoc. Bridge Struct. Eng., ISMES, Bergamo, Italy, 19, 1-30.
Wolanski, A.J. (2004). “Flexural behaviour of reinforced and prestressed concrete beams using
finite element analysis.” Thesis for the Degree of Master of Science, Faculty of the Graduate
School, Marquette University, Milwaukee.