verification of lhp stabilityyy theory part i - tfaws … of lhp stabilityyy theory part i ... •...
TRANSCRIPT

Verification of LHP Verification of LHP Stability Theory Part IStability Theory Part Iy yy y
Triem T. HoangTriem T. HoangTTH R h ITTH R h ITTH Research Inc.TTH Research Inc.
Robert W. BaldauffRobert W. BaldauffGSFC· 2015 U.S. Naval Research LaboratoryU.S. Naval Research Laboratory

Outline
• Loop Heat Pipe (LHP) Stability Theoryp p ( ) y y
• Instability Criterion for Low-Frequency Oscillations
• Theory Verification Process
• Model Predictions vs Test DataModel Predictions vs. Test Data
• Summary / Conclusion
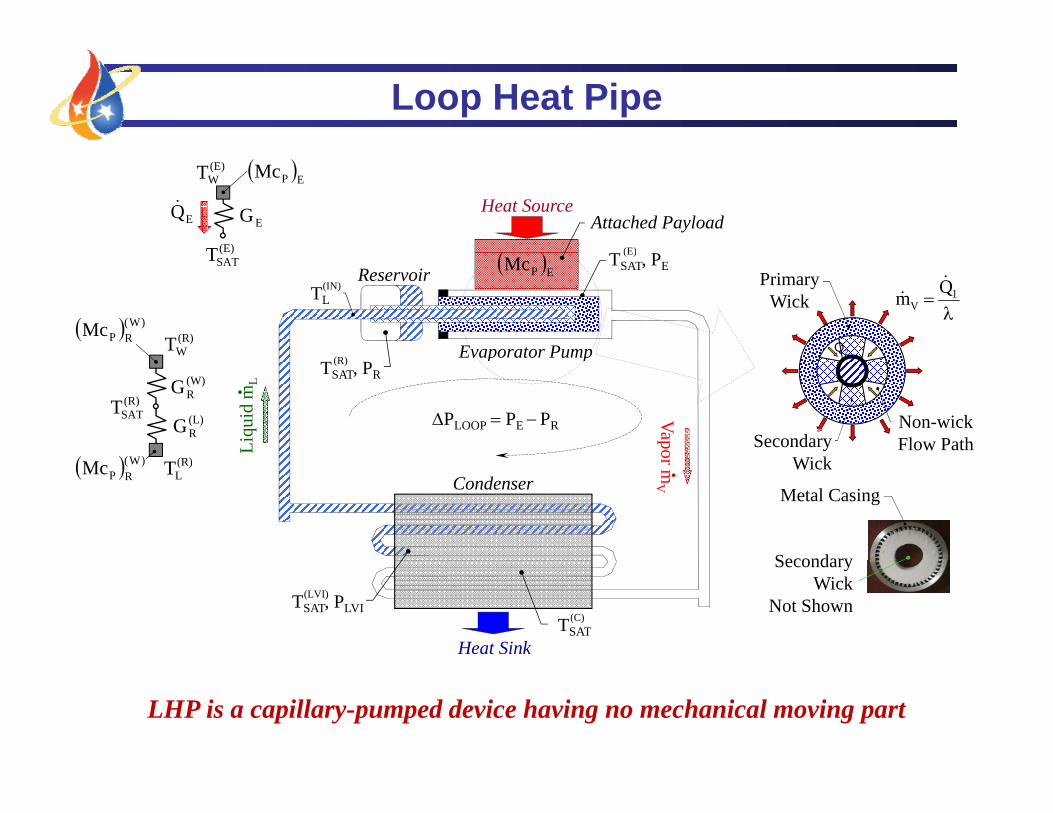
Loop Heat Pipe
(E)T
EG
(E)WT
EQ
EPMc
Heat Source
(E)
Attached Payload
( )SATT
(R)WT
)W(RPMc
Evaporator Pump
ReservoirTSAT, PE
(E)
TL(IN)
EPMc
1
VQm
2Q
PrimaryWick
(R)SATT
(L)RG
(W)RG
W
(R) )W(
Evaporator Pump
VapoLiqu
id m
L
TSAT, PR(R)
PLOOP PE PR Non-wickFlow PathSecondary
Wi k(R)LT )W(
RPMcCondenser
or mV
Wick
Metal Casing
Secondary
Heat Sink
TSAT, PLVI(LVI)
TSAT(C)
Secondary Wick
Not Shown
LHP is a capillary-pumped device having no mechanical moving part
LHP Linear Stability Theory
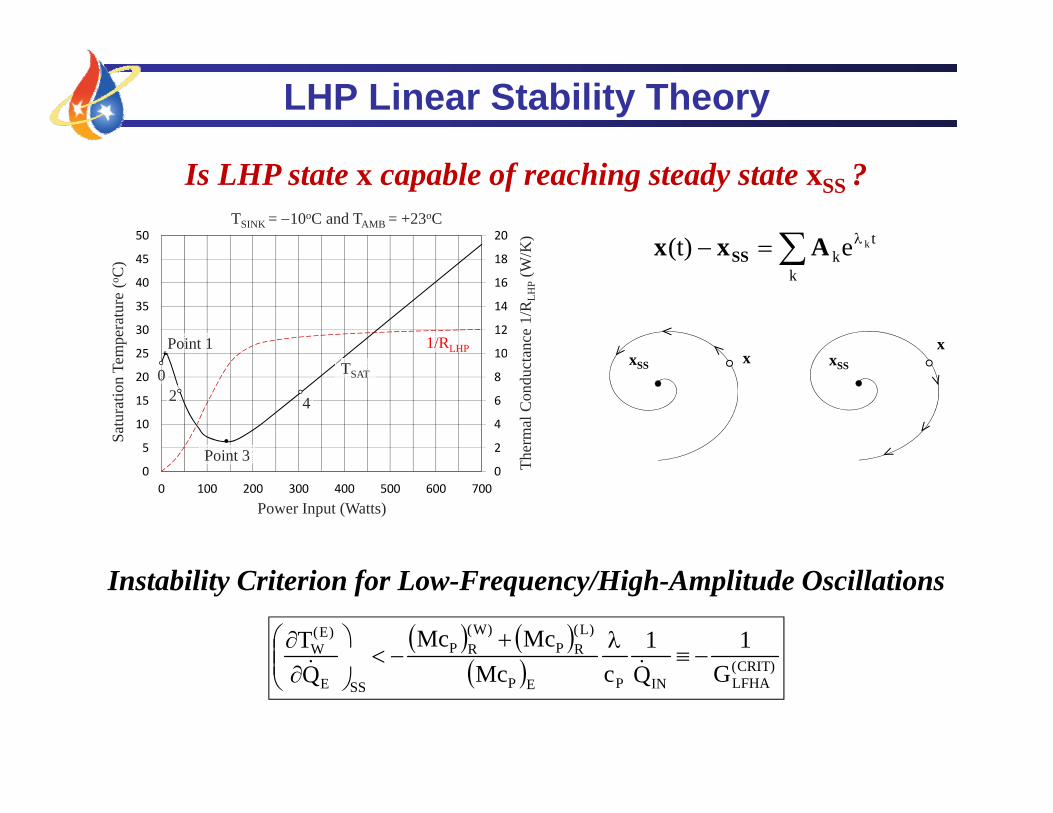
Is LHP state x capable of reaching steady state xSS ?
tk
ke(t) Axx SS2050
/K)
TSINK = 10oC and TAMB = +23oC
x
k
ke(t) Axx SS
10
12
14
16
18
25
30
35
40
45
mpe
ratu
re (o C
)
ance
1/R
LHP
(W/
1/RLHPPoint 1xSS x xSS
2
4
6
8
10
5
10
15
20
25
Satu
ratio
n Te
m
herm
al C
ondu
cta
TSAT
Point 3
02 4
000 100 200 300 400 500 600 700
ThPower Input (Watts)
Point 3
)CRIT(
)L(RP
)W(RP
)E(W 11McMcT
Instability Criterion for Low-Frequency/High-Amplitude Oscillations
)CRIT(LFHAINPEPSSE GQcMcQ
LHP Linear Stability Theory
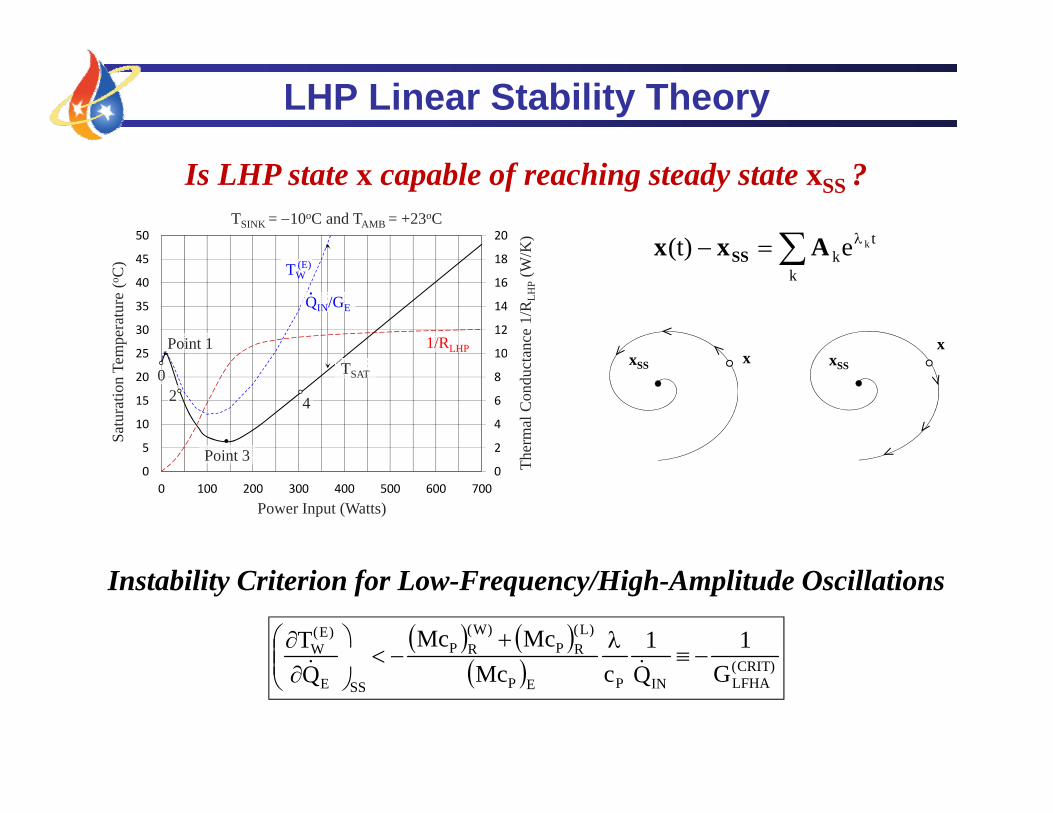
Is LHP state x capable of reaching steady state xSS ?
tk
ke(t) Axx SS2050
/K)
TSINK = 10oC and TAMB = +23oC
x
k
ke(t) Axx SS
10
12
14
16
18
25
30
35
40
45
mpe
ratu
re (o C
)
ance
1/R
LHP
(W/
1/RLHPPoint 1
TW(E)
QIN/GE
xSS x xSS
2
4
6
8
10
5
10
15
20
25
Satu
ratio
n Te
m
herm
al C
ondu
cta
TSAT
Point 3
02 4
000 100 200 300 400 500 600 700
ThPower Input (Watts)
Point 3
)CRIT(
)L(RP
)W(RP
)E(W 11McMcT
Instability Criterion for Low-Frequency/High-Amplitude Oscillations
)CRIT(LFHAINPEPSSE GQcMcQ

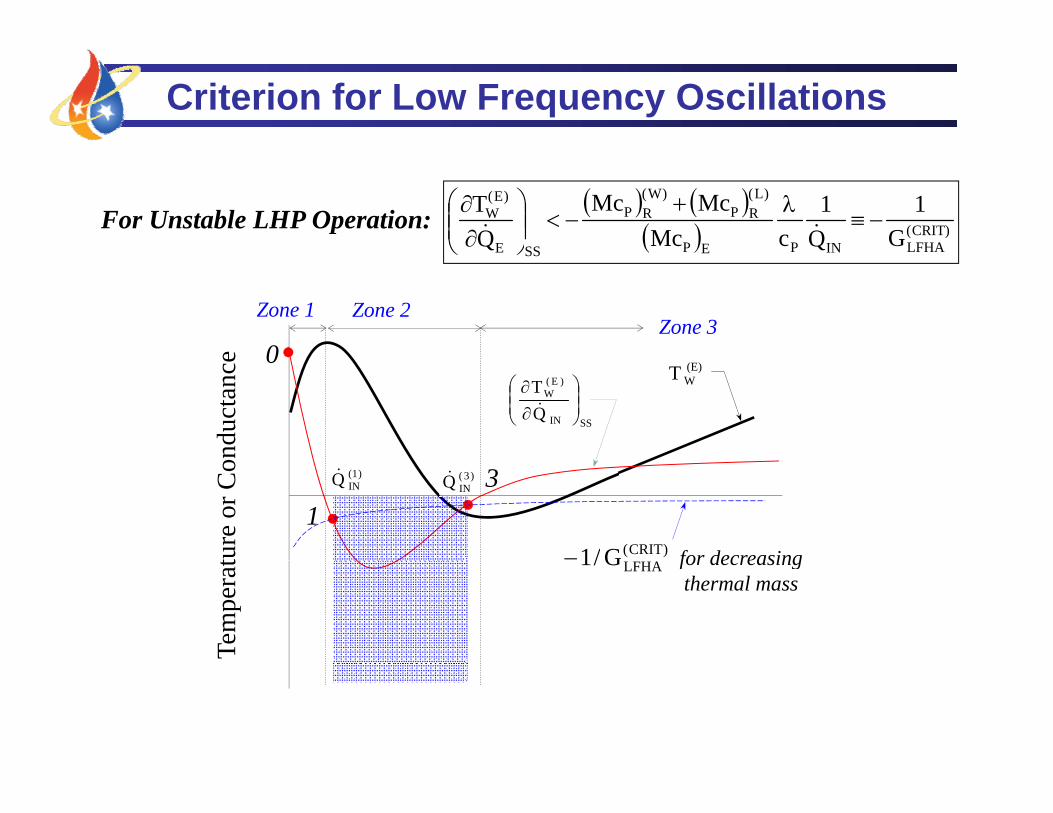
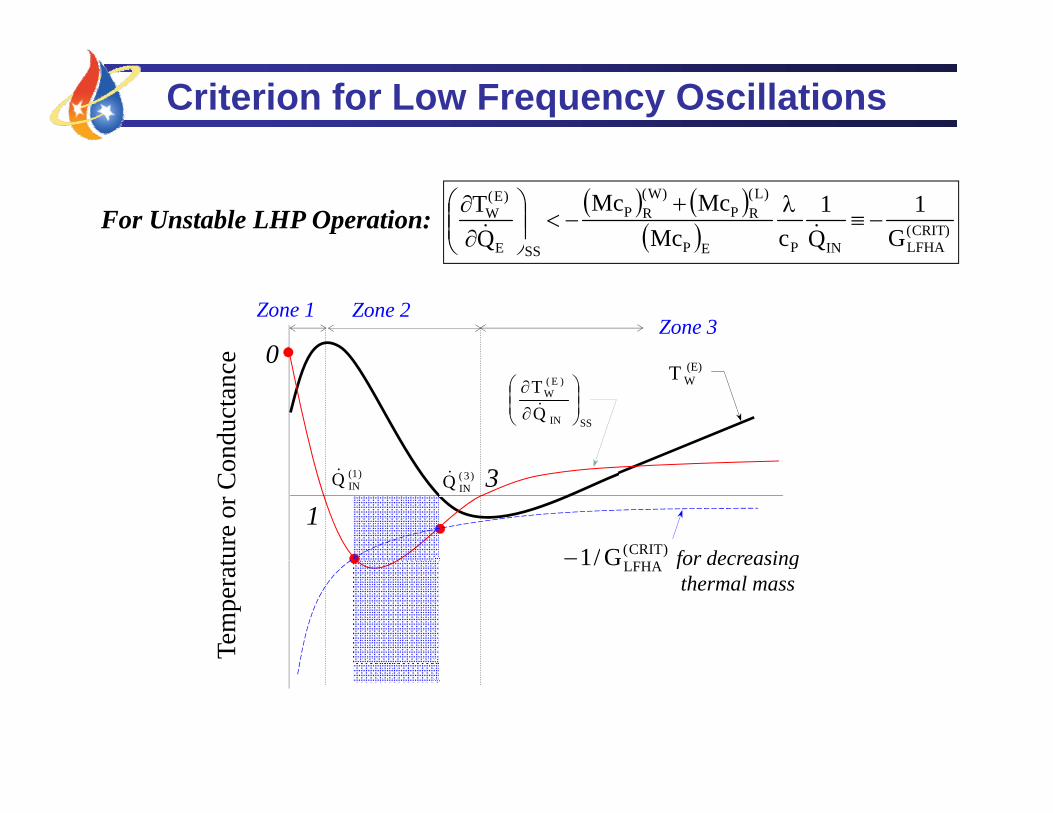
Criterion for Low Frequency Oscillations
)CRIT(
LFHAINPEP
)L(RP
)W(RP
SSE
)E(W
G1
Q1
cMcMcMc
QT
For Unstable LHP Operation:ESS
0e
Zone 1 Zone 2Zone 3
(E)WT
0
SSIN
)E(W
QT
nduc
tanc
e
13
)CRIT(G/1ture
or C
on
)3(INQ)1(
INQ
for large attachedLFHAG/1
Tem
pera
t for large attached thermal mass
Criterion for Low Frequency Oscillations
)CRIT(
LFHAINPEP
)L(RP
)W(RP
SSE
)E(W
G1
Q1
cMcMcMc
QT
For Unstable LHP Operation:ESS
0e
Zone 1 Zone 2Zone 3
(E)WT
0
SSIN
)E(W
QT
nduc
tanc
e
13
)CRIT(G/1ture
or C
on
)3(INQ)1(
INQ
for decreasingLFHAG/1
Tem
pera
t for decreasingthermal mass
Criterion for Low Frequency Oscillations
)CRIT(
LFHAINPEP
)L(RP
)W(RP
SSE
)E(W
G1
Q1
cMcMcMc
QT
For Unstable LHP Operation:ESS
0e
Zone 1 Zone 2Zone 3
(E)WT
0
SSIN
)E(W
QT
nduc
tanc
e
13
)CRIT(G/1ture
or C
on
)3(INQ)1(
INQ
for decreasingLFHAG/1
Tem
pera
t for decreasingthermal mass

Criterion for Low Frequency Oscillations
)CRIT(
LFHAINPEP
)L(RP
)W(RP
SSE
)E(W
G1
Q1
cMcMcMc
QT
For Unstable LHP Operation:ESS
0e
Zone 1 Zone 2Zone 3
(E)WT
0
SSIN
)E(W
QT
nduc
tanc
e
13
)CRIT(G/1ture
or C
on
)3(INQ)1(
INQ
for decreasingLFHAG/1
Tem
pera
t for decreasingthermal mass
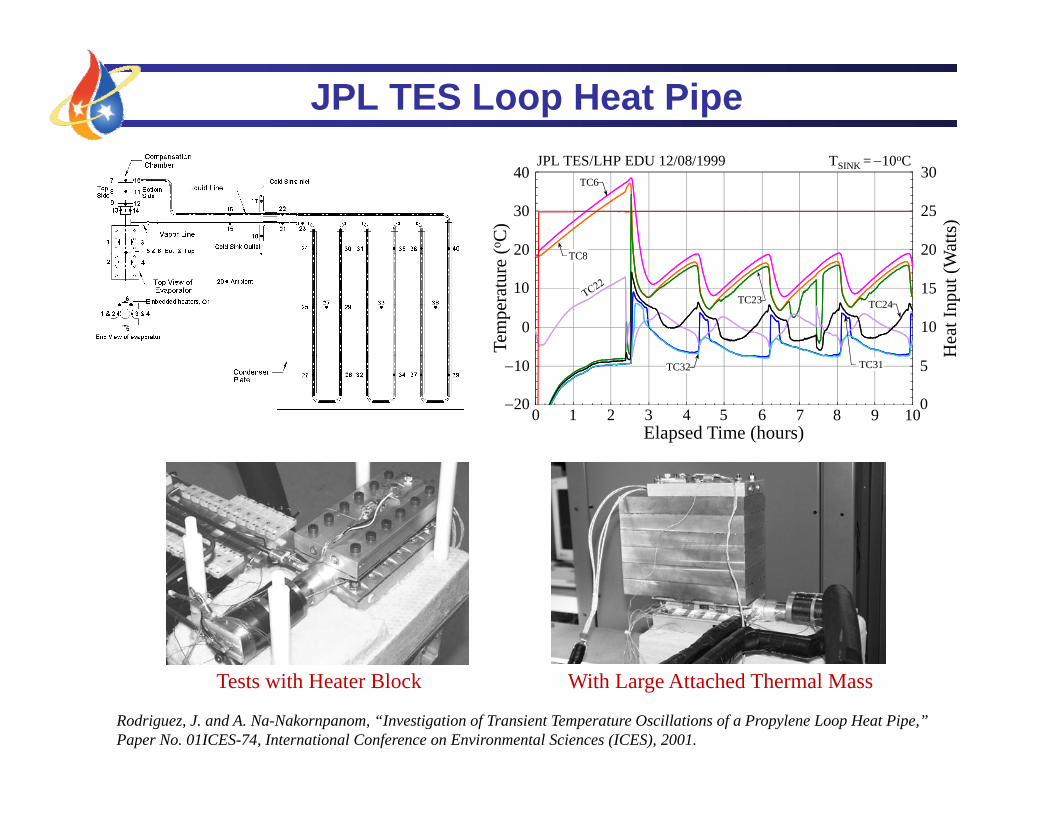
JPL TES Loop Heat Pipe
(o C)
20
30
40
20
25
30
Wat
ts)
JPL TES/LHP EDU 12/08/1999 TSINK = 10oC
TC8
TC6
Tem
pera
ture
(
0
10
20
10
15
20
Hea
t Inp
ut (W
TC8
TC23 TC24
10
Elapsed Time (hours)0 1 2 3 4 5 6 7 8 9 10
H
0
5TC31TC32
20
With Large Attached Thermal MassTests with Heater Block
Rodriguez, J. and A. Na-Nakornpanom, “Investigation of Transient Temperature Oscillations of a Propylene Loop Heat Pipe,” Paper No. 01ICES-74, International Conference on Environmental Sciences (ICES), 2001.

JPL TES Loop Heat Pipe
Evaporator P i Wi k C i /S ddl 1st Wi k d A h d Th l M
Dimensions and Properties of LHP Components
Primary Wick Casing/Saddle, 1st Wick, and Attached Thermal Mass Material: Sintered Powder Nickel Attached Thermal Mass: 9,080J/K Outer Diameter: 24.21mm (0.950”) Thermal Mass-to-Vapor Inner Diameter: 9.525mm (0.375”) Conductance GE: 8.16 W/K Active Length: 0.1524m (6”) Saddle: 7.62cm x 15.24cm x 1.91cm Al 6061 Max. Pore Radius: 1.2m Vapor Grooves Permeability: 4.0x10⁻¹⁴m2 Number of Channels: 4 Effective Conductivity: 7.8W/m-K Hydraulic Diameter: 0.05” Transport LinesTransport Lines Vapor Line Liquid Line Outer Diameter: 5.54mm Outer Diameter: 5.54mm Wall Thickness: 0.508mm Wall Thickness: 0.508mm Length: 1.0m Length: 1.2264m (incl. bayonet) C d R iCondenser Reservoir Number of Parallel Passes 1 Outer Diameter: 43.94mm Heat Exchanger Tubing Wall Thickness: 2.20mm Inner Diameter: 3.99mm Active Length: 0.08023m Length: 3.81m (200”) Thermal Mass (McP)R: 190J/K
)MAX( Conductance :G )MAX(C 25W/K Conductance GR: 22W/K
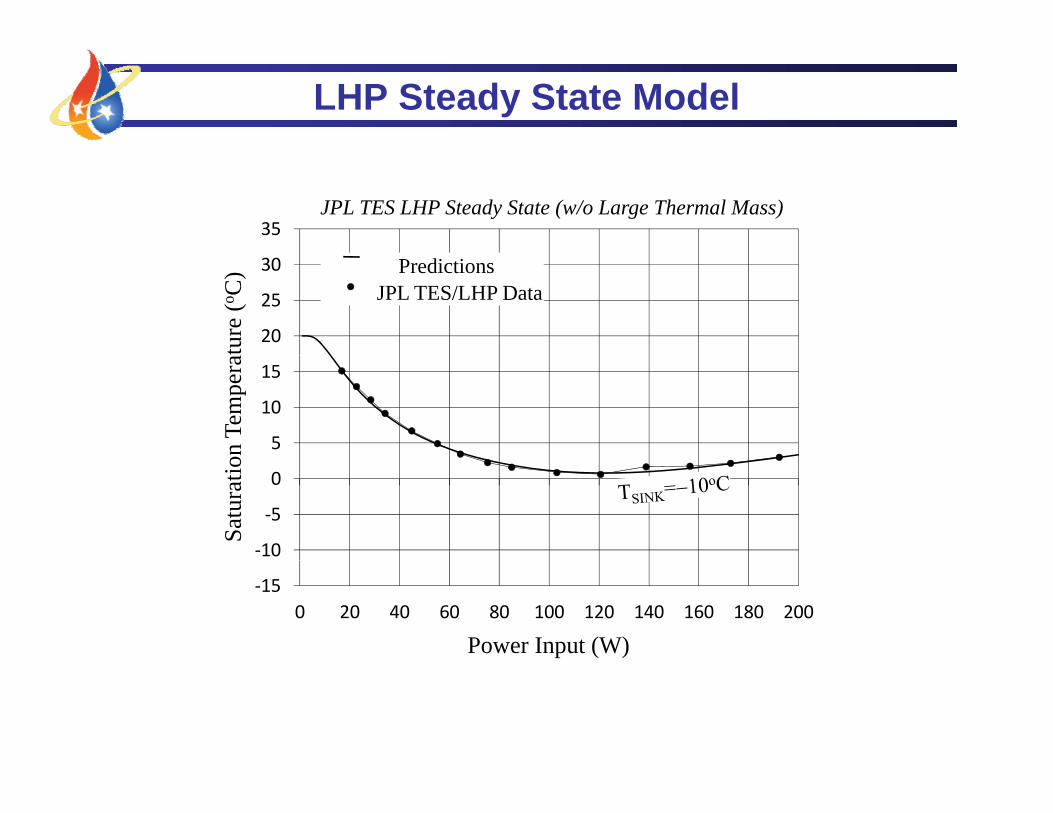
LHP Steady State Model
35JPL TES LHP Steady State (w/o Large Thermal Mass)
20
25
30at
ure
(o C) Predictions
JPL TES/LHP Data
5
10
15
on T
empe
ra
‐10
‐5
0
Satu
ratio
‐150 20 40 60 80 100 120 140 160 180 200
Power Input (W)
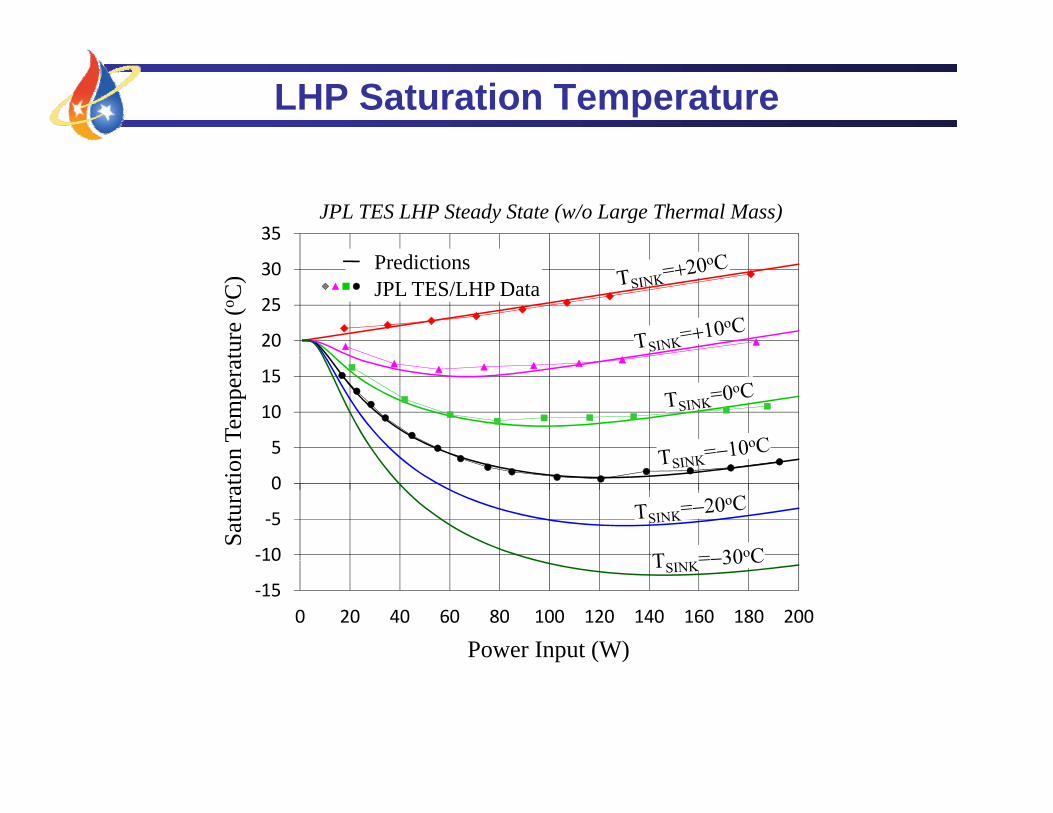
LHP Saturation Temperature
35JPL TES LHP Steady State (w/o Large Thermal Mass)
20
25
30
ture
(o C) Predictions
JPL TES/LHP Data
5
10
15
n Te
mpe
rat
‐10
‐5
0
Satu
ratio
n
‐15
10
0 20 40 60 80 100 120 140 160 180 200
Power Input (W)

Thermal Mass Temperature
30JPL TES LHP Steady State (w/o Large Thermal Mass)
20
25
ratu
re (o C
)
15
20
ass T
empe
r
5
10
Ther
mal
M
00 20 40 60 80 100 120
T
Power Input (W)
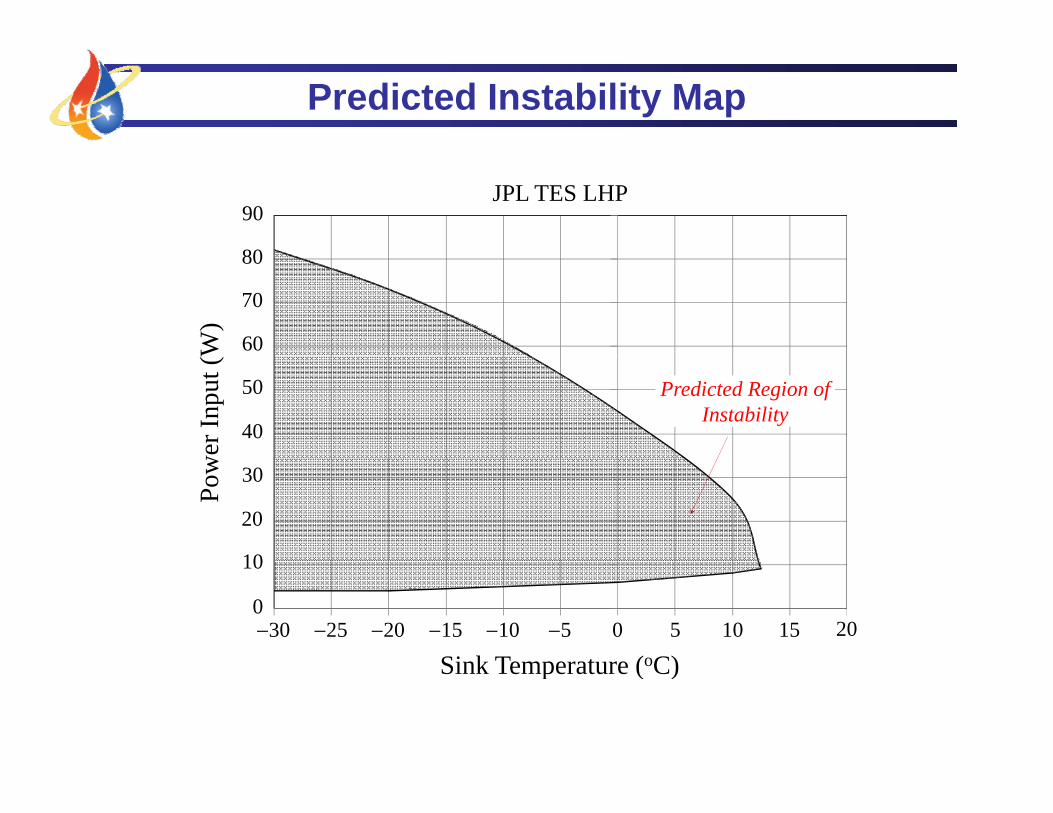
Predicted Instability Map
80
90JPL TES LHP
W)
60
70
80
wer
Inpu
t (W
40
50 Predicted Region of Instability
Pow
10
20
30
Sink Temperature (oC)30 25 20 15 10 5 0 5 10 150
10
20
Sink Temperature (oC)

Predictions vs. Test Data
Test Without Oscillations
JPL TES LHP
80
90W
)
60
70
80
wer
Inpu
t (W
40
50 Predicted Region of Instability
Pow
10
20
30
Sink Temperature (oC)30 25 20 15 10 5 0 5 10 150
10
20
Sink Temperature (oC)
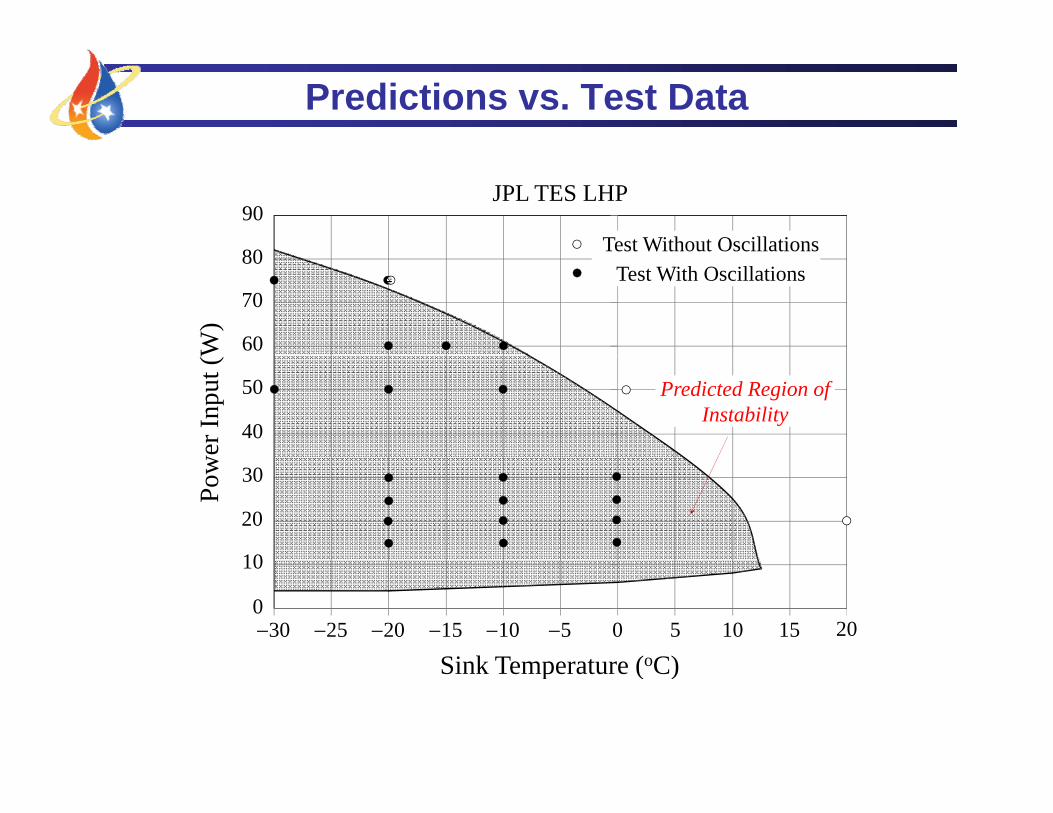
Predictions vs. Test Data
80
90Test Without Oscillations
JPL TES LHPW
)
60
70
80Test With Oscillations
wer
Inpu
t (W
40
50 Predicted Region of Instability
Pow
10
20
30
Sink Temperature (oC)30 25 20 15 10 5 0 5 10 150
10
20
Sink Temperature (oC)
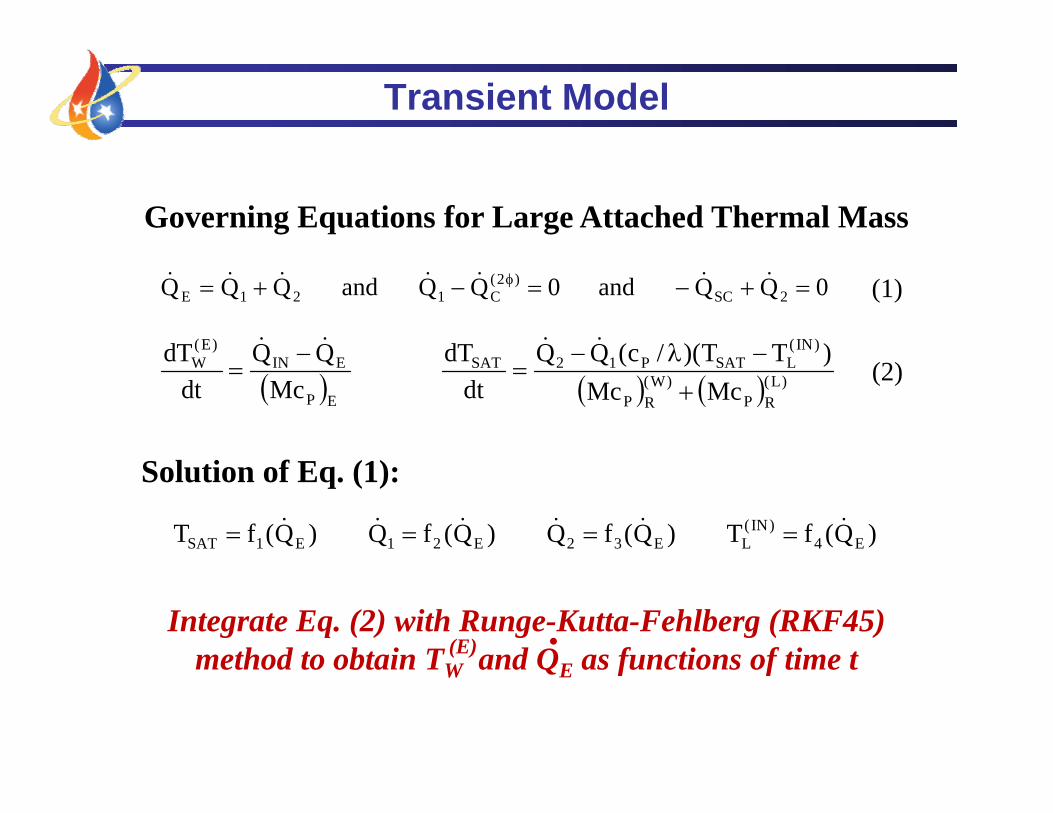
Transient Model
Governing Equations for Large Attached Thermal Mass
)IN()E( )TT)(/c(QQdTQQdT
0 QQ and 0 QQ and QQQ 2SC)2(
C121E (1)
)L(RP
)W(RP
LSATP12SAT
EP
EINW
McMc)TT)(/c(QQ
dtdT
McQQ
dtdT
(2)
Solution of Eq. (1):
)Q(fT )Q(fQ )Q(fQ )Q(fT E4)IN(
LE32E21E1SAT
Integrate Eq. (2) with Runge-Kutta-Fehlberg (RKF45)method to obtain T and Q as functions of time t(E) .method to obtain TW and QE as functions of time t

Predictions vs. Test Data)
20 01/24/2000 TSINK = 10oC
Power Input
Pow
er (W
)
15Evaporator
(Data)
e (o C
) or P
10
empe
ratu
re
5
i
Reservoir(Data)
Evaporator
Te
0 1 2 3 4 5 60
Reservoir(Model)
p(Model)
Elapsed Time (hours)
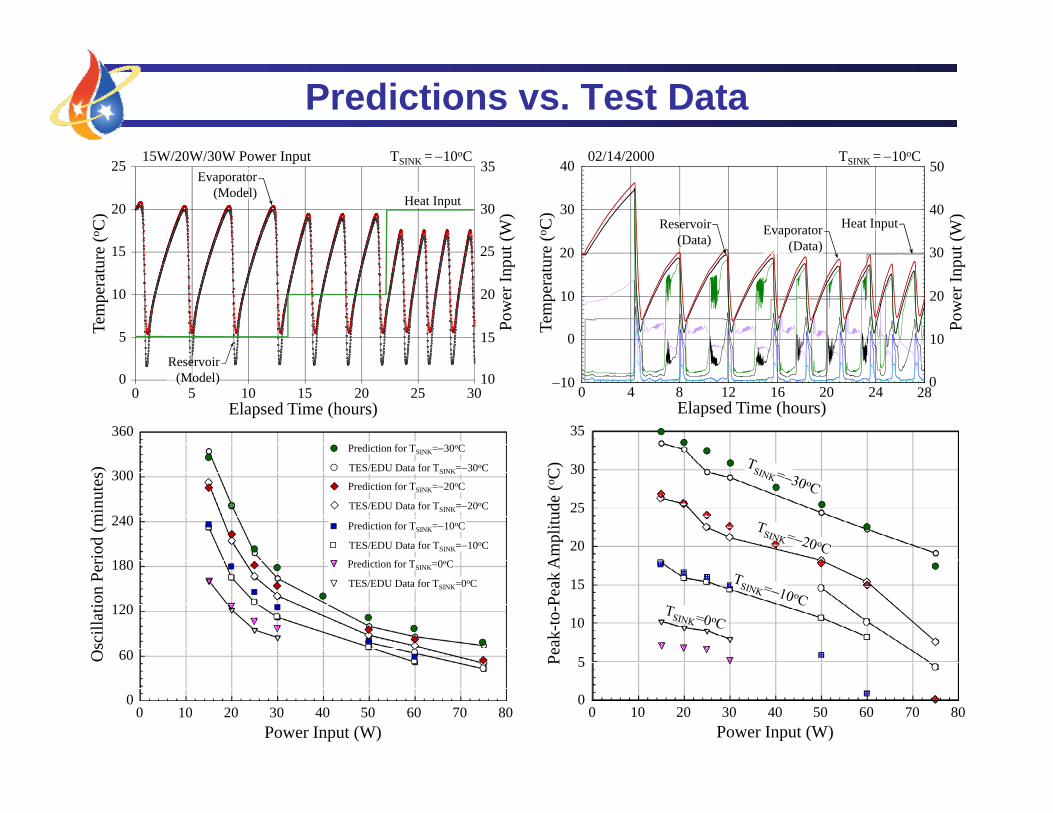
Predictions vs. Test Datae
(o C)
15
20
15W/20W/30W Power Input TSINK = 10oCEvaporator
(Model)
25
Heat Input
25
30
35
ut (W
)
e (o C
)
20
30
02/14/2000 TSINK = 10oC
Reservoir(Data)
Evaporator(Data)
40
Heat Input
30
40
50
ut (W
)
Tem
pera
ture
5
10
15
15
20
25
Pow
er In
pu
Tem
pera
tur
0
10
20 ( )
10
20
30
Pow
er In
pu
0 5 10 15 20 25 300
Elapsed Time (hours)
Reservoir(Model) 10
0 4 8 12 16 20 2410
Elapsed Time (hours)28
0
360Prediction for TSINK=30oC
35
riod
(min
utes
)
180
240
300 TES/EDU Data for TSINK=30oC
Prediction for TSINK=20oC
TES/EDU Data for TSINK=20oC
Prediction for TSINK=10oC
TES/EDU Data for TSINK=10oC
P di i f T 0 C Am
plitu
de (o C
)20
25
30
Osc
illat
ion
Per
60
120
180 Prediction for TSINK=0oC
TES/EDU Data for TSINK=0oC
Peak
-to-P
eak
A
5
10
15
0 10 20 30 40 50 60 70 800
Power Input (W)
P 5
Power Input (W)0 10 20 30 40 50 60 70 80
0

Conclusion / Summary
• LHP Linear Stability Theory– low-frequency/high-amplitude oscillations are caused by large
thermal mass ratio between evaporator and reservoir– unstable range of power input is between those of two
extrema (Points 1 & 2) of TW vs. QIN curve, i.e. dependent on (E) .
environmental heating of liquid line and reservoir– theory is limited to single-pass condenser LHPs
• Theory Verification• Theory Verification– model predictions agreed very well with JPL TES test data– unfortunately, test data from only one LHP are available
• Path Forward– continue with verification when additional data available– add multiple parallel evaporators/condensers to theory