verification of resrad-build computer code, …resrad.evs.anl.gov/docs/verification...
TRANSCRIPT

Verification of RESRAD-BUILD Computer Code, Version 3.1
for
Argonne National Laboratory
Contract No.: 1F-00741
March 2003

Verification of RESRAD-BUILD, Version 3.1
Tetra Tech NUS, Inc. Page iii 03/31/03
TABLE OF CONTENTS
Section Page
Table of Contents ..................................................................................................... iiiList of Tables............................................................................................................ ivList of Figures .......................................................................................................... vExecutive Summary ................................................................................................. ES-1
1 Introduction .............................................................................................................. 11.1 Background ................................................................................................. 11.2 Purpose and Scope ...................................................................................... 1
2 Verification of Deterministic Model ........................................................................ 32.1 Database Verification .................................................................................. 3
2.1.1 ATTEN.DAT.................................................................................. 32.1.2 NUCDCF.DAT .............................................................................. 52.1.3 NUCGAM.DAT............................................................................. 62.1.4 COEFF_BD.LIB ............................................................................ 72.1.5 GP_ABS.LIB.................................................................................. 8
2.2 Parameter Verification ................................................................................ 82.2.1 General Observations ..................................................................... 102.2.2 Time Parameters............................................................................. 112.2.3 Building Parameters ....................................................................... 132.2.4 Receptor Parameters....................................................................... 192.2.5 Source Parameters .......................................................................... 252.2.6 Shielding Parameters...................................................................... 412.2.7 Tritium Model Parameters.............................................................. 432.2.8 Radiological Units.......................................................................... 462.2.9 Parameters Not Covered in Appendix J ......................................... 46
2.3 Individual Pathways Verification................................................................ 482.3.1 Direct External Gamma Pathway ................................................... 492.3.2 Submersion External Gamma Pathway.......................................... 672.3.3 Deposition External Gamma Pathway ........................................... 682.3.4 Radon Inhalation Pathway ............................................................. 702.3.5 Other Inhalation Pathway............................................................... 722.3.6 Direct Ingestion Pathway ............................................................... 742.3.7 Indirect Ingestion Pathway............................................................. 75
2.4 Time Dependency Verification ................................................................... 772.5 Multiple-Room Model Verification ............................................................ 782.6 Multiple Pathways, Receptors, Sources, Times Verification ...................... 79
3 Verification of Uncertainty Model ........................................................................... 813.1 Verification of Parameter Inputs ................................................................. 81
3.1.1 Time Parameters............................................................................. 813.1.2 Building Parameters ....................................................................... 833.1.3 Receptor Parameters....................................................................... 843.1.4 Source Parameters .......................................................................... 853.1.5 Shielding Parameters...................................................................... 883.1.6 Tritium Model Parameters.............................................................. 89
3.2 Input Distribution Verification.................................................................... 1013.2.1 Selected Parameter Distributions ................................................... 101

Verification of RESRAD-BUILD, Version 3.1
Tetra Tech NUS, Inc. Page iv 03/31/03
3.2.2 Crystal Ball Results ........................................................................ 1023.3 Output Distribution Verification ................................................................. 102
3.3.1 Input Parameter Distributions ........................................................ 1033.3.2 Uncertainty Output Tabular Results............................................... 1033.3.3 Uncertainty Output Graphic Results .............................................. 105
4 Evaluation of Other Issues ....................................................................................... 1064.1 Consistency ................................................................................................. 1064.2 User Friendliness......................................................................................... 1074.3 Calculation Methodology ............................................................................ 109
5 Documents Used for Verification............................................................................. 115
List of Tables
Table Page
Table 2-1. Databases and Libraries used by RESRAD-BUILD.......................................... 3Table 2-2. Energy Values for Attenuation Coefficients Used in RESRAD-BUILD (MeV) 4Table 2-3. Comparison of Mass Attenuation Coefficients for Concrete Reported in
ATTEN.DAT and the Radiological Health Handbook...................................... 5Table 2-4. List of RESRAD-Build Parameters Accessible through the User Interface ...... 9Table 2-5. List of RESRAD-BUILD Pathways and Models............................................... 48Table 2-6. Source Type and Shield Material Matrix for Point Source................................ 53Table 2-7. Ratio of RESRAD-BUILD Results to MicroShield Results for Point Source... 55Table 2-8. Ratio of RESRAD-BUILD Results to MicroShield Results for Line Source.... 55Table 2-9. Ratio of RESRAD-BUILD Results to MicroShield Results for Infinite Area
Source ................................................................................................................ 56Table 2-10. Ratio of RESRAD-BUILD Results to MicroShield Results for Finite Area
Source ................................................................................................................ 56Table 2-11. Ratio of RESRAD-BUILD Results to MicroShield Results for Infinite
Volume Source .................................................................................................. 57Table 2-12. Ratio of RESRAD-BUILD Results to MicroShield Results for Finite Volume
Source ................................................................................................................ 57Table 2-13. Ratio of RESRAD-BUILD to MicroShield Area Factors for Area Source ....... 58Table 2-14. Ratio of RESRAD-BUILD to MicroShield Area Factors for Volume Source .. 58Table 2-15. Ratio of RESRAD-BUILD to MicroShield Source-Material-Dependent Doses 59Table 2-16. Ratio of RESRAD-BUILD to MicroShield Doses for Shielded Point Source... 61Table 2-17. Ratio of RESRAD-BUILD to MicroShield Doses for Shielded Line Source.... 63Table 2-18. Ratio of RESRAD-BUILD to MicroShield Doses for Shielded Area Source ... 64Table 2-19. Ratio of RESRAD-BUILD to MicroShield Doses for Shielded Concrete
Volume Source (Air and Shield Material Buildup Factors) .............................. 65Table 2-20. Ratio of RESRAD-BUILD to MicroShield Doses for Shielded Concrete
Volume Source (Source Material Buildup Factors)........................................... 66Table 2-21. Verification of Submersion Pathway Results .................................................... 68Table 2-22. Floor Concentrations Calculated by the Deposition Module ............................. 69Table 2-23. Verification of Deposition External Gamma Pathway Results .......................... 69Table 2-24. Verification of Single-Region Radon Volume Source Injection Module .......... 71Table 2-25. Verification of Multi-Region Radon Volume Source Injection Module ........... 71Table 2-26. Verification of the Radon Inhalation Module .................................................... 72

Verification of RESRAD-BUILD, Version 3.1
Tetra Tech NUS, Inc. Page v 03/31/03
Table 2-27. Verification of Tritium Source Injection Module .............................................. 73Table 2-28. Verification of Inhalation Pathway Results ....................................................... 74Table 2-29. Verification of Direct Ingestion Pathway Results.............................................. 75Table 2-30. Verification of Indirect Ingestion Pathway Results ........................................... 76Table 2-31. Verification of Multiple-Room Model Results .................................................. 79Table 3-1. Parameters, Distributions, and Values Used in Uncertainty Analysis Input Tests 101Table 3-2. Distribution fits obtained by Crystal Ball using the Kolmogorov-Smirnov
Technique........................................................................................................... 102Table 3-3. Parameters, distributions, and values used in uncertainty analysis output tests 103Table 3-4. Ratio between RESRAD-BUILD and Crystal Ball Results for Statistical
Parameters of Output Distributions ................................................................... 104
List of Figures
Figure Page
2-1 Source-Receptor Geometries Used to Test the Direct External Gamma Pathway... 51

Verification of RESRAD-BUILD, Version 3.1
Tetra Tech NUS, Inc. Page ES-1 03/31/03
Verification of RESRAD-BUILD Computer Code, Version 3.1
Executive Summary
RESRAD-BUILD is a computer model for analyzing the radiological doses resulting from theremediation and occupancy of buildings contaminated with radioactive material. It is part of afamily of codes that includes RESRAD, RESRAD-CHEM, RESRAD-RECYCLE, RESRAD-BASELINE, and RESRAD-ECORISK. The RESRAD-BUILD models were developed andcodified by Argonne National Laboratory (ANL); version 1.5 of the code and the user�s manualwere publicly released in 1994. The original version of the code was written for the MicrosoftDOS operating system. However, subsequent versions of the code were written for the MicrosoftWindows operating system.
The purpose and scope of this report (detailed in Section 1), are to provide an independent reviewand verification of the RESRAD-BUILD code under the guidance provided by ANSI/ANS-10.4-1987, Guidelines for the Verification and Validation (V&V) of Scientific and EngineeringComputer Programs for the Nuclear Industry for verification and validation of existing computerprograms. This approach consists of an a posteriori V&V review which takes advantage ofavailable program development products as well as user experience. The purpose, as specified inANSI/ANS-10.4, is to determine whether the program produces valid responses when used toanalyze problems within a specific domain of applications, and to document the level ofverification. The culmination of these efforts is the production of this formal Verification Report.
The verification tasks were conducted in three parts and were applied to version 3.1 of theRESRAD-BUILD code and the final version of the user�s manual, issued in November 2001 (Yuet al. 2001). These parts include the verification of the deterministic models used in RESRAD-BUILD (Section 2), the verification of the uncertainty analysis model included in RESRAD-BUILD (Section 3), and recommendations for improvement of the RESRAD-BUILD userinterface, including evaluations of the user�s manual, code design, and calculation methodology(Section 4).
Any verification issues that were identified were promptly communicated to the RESRAD-BUILD development team, in particular those that arose from the database and parameterverification tasks. This allowed the developers to start implementing necessary database orcoding changes well before this final report was issued.
The deterministic models in RESRAD-BUILD were verified using a bottoms-up approach toimprove task efficiency. Databases that are required to run one or more pathways were verifiedfirst. This was followed by verification of input parameters used in the mathematical models toensure that all were captured in the code. The next step was the verification that mathematicalmodels for individual exposure pathways, as described in the user�s manual, were correctlyimplemented in the code. In addition, the proper implementation of time-dependent calculationswas verified. The final step was the integration of the results of the previous steps to verify theproper summation of dose contributions to multiple receptors from multiple sources and pathwaysat different time intervals. Each of these steps is discussed in greater detail in the Section 2.
No major issues were encountered in verifying the deterministic models. With few exceptions,the database libraries were found to consistent with the literature from which they are derived.Some recommendations are made to improve the error checking routines for many of the inputparameters and to correct some minor problems encountered with the line source model.

Verification of RESRAD-BUILD, Version 3.1
Tetra Tech NUS, Inc. Page ES-2 03/31/03
The RESRAD-BUILD uncertainty model was verified in three steps. The first step focused theresponse of the code to inputs made during the parameter verification phase. The second stepwas to verify that the input data sets produced by the Latin hypercube sampling routinecorresponded to the specified statistical distributions. The third step verified the correctdistribution of output results following uncertainty simulations.
No major issues were encountered in verifying the uncertainty models when entering parameterswithin reasonable ranges. However, some problems were encountered when entering parametervalues that exceed acceptable ranges, as defined in the deterministic models. In addition to performing a strict verification of the deterministic and uncertainty calculationsperformed by RESRAD-BUILD, the following related tasks aimed at improving the code andsupporting documentation were conducted in parallel:
• Review of the code, user�s manual and other ancillary documentation for consistency.• Review of the code functions that do not impact the calculations.• Review of the calculation methodology.
In general, the user�s manual was found to be very well written and easy to follow. Most of thetime, what was written in the manual was reflected in the code. However, there are some areas,highlighted in Section 4, that could be improved to make the RESRAD-BUILD code and theuser�s manual a better product.

Verification of RESRAD-BUILD, Version 3.1
Tetra Tech NUS, Inc. Page ES-1 03/31/03
1 Introduction1.1 Background
RESRAD-BUILD is a computer model for analyzing the radiological doses resulting from theremediation and occupancy of buildings contaminated with radioactive material. It is part of afamily of codes that includes RESRAD, RESRAD-CHEM, RESRAD-RECYCLE, RESRAD-BASELINE, and RESRAD-ECORISK. The RESRAD-BUILD models were developed andcodified by Argonne National Laboratory (ANL); version 1.5 of the code and the user�s manualwere publicly released in 1994. The original version of the code was written for the MicrosoftDOS operating system. However, subsequent versions of the code were written for the MicrosoftWindows operating system.
The code developers have extensively tested all versions released to the public by ANL, fromversion 1.5 to the current version 3.1. These internal verification and validation tasks havecovered all life-cycle development phases of the software, including the definition, design,coding, integration/testing, installation, and operation/maintenance phases defined in ANSI/ANS-10.4-1987, Guidelines for the Verification and Validation of Scientific and Engineering ComputerPrograms for the Nuclear Industry. As defined in ANSI/ANS-10.4, validation consists of theprocess of testing a computer program and evaluating the results to ensure compliance withspecified requirements, whereas verification consists of the process of evaluating the products ofa software development phase to provide assurance that they meet the requirements defined forthem by the previous phase.
1.2 Purpose and Scope
The purpose of the present verification task (which includes validation as defined in the standard)is to provide an independent review of the latest version of RESRAD-BUILD under the guidanceprovided by ANSI/ANS-10.4 for verification and validation of existing computer programs. Thisapproach consists of a posteriori V&V review which takes advantage of available programdevelopment products as well as user experience. The purpose, as specified in ANSI/ANS-10.4,is to determine whether the program produces valid responses when used to analyze problemswithin a specific domain of applications, and to document the level of verification. Theculmination of these efforts is the production of this formal Verification Report.
The first step in performing the verification of an existing program was the preparation of aVerification Review Plan. The review plan consisted of identifying:
• Reason(s) why a posteriori verification is to be performed• Scope and objectives for the level of verification selected• Development products to be used for the review• Availability and use of user experience• Actions to be taken to supplement missing or unavailable development products.
The purpose, scope and objectives for the level of verification selected are described in thissection of the Verification Report. The development products that were used for the review and

Verification of RESRAD-BUILD, Version 3.1
Tetra Tech NUS, Inc. Page 2 03/31/03
any actions that were taken when these items were missing are documented in Section 5 of thisreport. The availability and use of user experience were limited to extensive experience inperforming RESRAD-BUILD calculations by the verification project manager and byparticipation in the RESRAD-BUILD workshop offered by the code developers on May 11, 2001.
The level of a posteriori verification that was implemented is defined in Sections 2 through 4 ofthis report. In general, a rigorous verification review plan addresses program requirements,design, coding, documentation, test coverage, and evaluation of test results. The scope of theRESRAD-BUILD verification is to focus primarily on program requirements, documentation,testing and evaluation. Detailed program design and source code review would be warrantedonly in those cases when the evaluation of test results and user experience revealed possibleproblems in these areas.
The verification tasks were conducted in three parts and were applied to version 3.1 of theRESRAD-BUILD code and the final version of the user�s manual, issued in November 2001 (Yuet al. 2001). These parts include the verification of the deterministic models used in RESRAD-BUILD (Section 2), the verification of the uncertainty analysis model included in RESRAD-BUILD (Section 3), and recommendations for improvement of the RESRAD-BUILD userinterface, including evaluations of the user�s manual, code design, and calculation methodology(Section 4).
Any verification issues that were identified were promptly communicated to the RESRAD-BUILD development team, in particular those that arose from the database and parameterverification tasks. This allowed the developers to start implementing necessary database orcoding changes well before this final report was issued.

Verification of RESRAD-BUILD, Version 3.1
Tetra Tech NUS, Inc. Page 3 03/31/03
2 Verification of Deterministic Model
The deterministic models in RESRAD-BUILD were verified using a bottoms-up approach toimprove task efficiency. Databases that are required to run one or more pathways were verifiedfirst. This was followed by verification of input parameters used in the mathematical models toensure that all were captured in the code. The next step was the verification that mathematicalmodels for individual exposure pathways, as described in the user�s manual, were correctlyimplemented in the code. In addition, the proper implementation of time-dependent calculationswas verified. The final step was the integration of the results of the previous steps to verify theproper summation of dose contributions to multiple receptors from multiple sources and pathwaysat different time intervals. Each of these steps is discussed in greater detail in the followingsections.
2.1 Database VerificationThe bottoms-up approach includes first verifying that common databases and libraries arecorrectly implemented in the code. An example of this includes verification that the databases ofradionuclide dose conversion factors, half-life, and photon emission energies/intensities havebeen accurately transcribed from their original sources. Verification of correct data transcriptionwas not limited to a comparison between the data in the user�s manual and the code, but was alsoextended to the original sources from which these data were obtained (e.g., Federal GuidanceReports 11 and 12). Table 2-1 lists the databases and libraries that are included in RESRAD-BUILD.
Table 2-1. Databases and Libraries used by RESRAD-BUILD
File Name DescriptionATTEN.DAT Material attenuation coefficientsNUCDCF.DAT Nuclide dose conversion factorsNUCGAM.DAT Photon emission energies and yieldsCOEFF_BD.LIB Nuclide photon coefficients for volume sourcesGP_ABS.LIB Material buildup factor coefficients
Where appropriate, an Excel spreadsheet program was used to enter the radionuclide-specific ormaterial-specific data from the original source. For radionuclide-specific databases, thecontribution of short-lived progeny were added to the parent radionuclides based on the definitionof principal and associated radionuclides used in RESRAD-BUILD. These values werecompared to the values taken from the RESRAD-BUILD database by taking the ratio andidentifying any ratios that deviate significantly from the expected ratio of one.
2.1.1 ATTEN.DATThe material attenuation coefficients used for shielding calculations in the external gammapathway are contained in the file ATTEN.DAT. The file simply lists the attenuation coefficientsin 8 blocks containing 26 values each. No material names, energy values, or units are provided.Appendix F of the user�s manual does not list these coefficients, but indicates that the units ofmass attenuation coefficient are in cm2/g. Based on the way in which material types are

Verification of RESRAD-BUILD, Version 3.1
Tetra Tech NUS, Inc. Page 4 03/31/03
displayed in the user�s manual, the order in which the material coefficients are arranged is asfollows: Concrete, Water, Aluminum, Iron, Copper, Tungsten, Lead, Uranium. The energyvalues corresponding to the 26 entries for each material are assumed to be in MeV, as shown inTable 2-2.
Table 2-2. Energy Values for Attenuation Coefficients Used in RESRAD-BUILD (MeV)
1.0E-02 1.3E-02 1.5E-02 2.0E-023.0E-02 4.0E-02 5.0E-02 6.0E-028.0E-02 1.0E-01 1.5E-01 2.0E-013.0E-01 4.0E-01 5.0E-01 6.0E-018.0E-01 1.0E+00 1.5E+00 2.0E+003.0E+00 4.0E+00 5.0E+00 6.0E+008.0E+00 1.0E+01
With the exception of the entry for 1.3E-02 MeV, all the other energy values appear tocorrespond exactly to the energy values reported in Table 5.1, Mass Attenuation Coefficients(cm2/g), of �The Health Physics and Radiological Health Handbook� (RHH; Shleien 1992).Based on a comparison with this reference, it was possible to verify the mass attenuationcoefficients for all materials except uranium and for all energy values except 1.3E-02 MeV.
The mass attenuation coefficient values for 1.3E-02 MeV reported in ATTEN.DAT appear to fallbetween the values reported for 1.0E-02 and 1.5E-02 MeV. Therefore, there is a high degree ofconfidence that the mass attenuation coefficient values at this energy level are correct.
While it was not possible to verify the attenuation coefficients for uranium, these values are ofsimilar magnitudes to the values for lead, the material closest to uranium in terms of atomicnumber (Z = 82 vs. 92). In addition, for all energies at which scattering is the dominantattenuation mechanism, the mass attenuation coefficients for uranium are greater than those forlead, as expected. In addition, the material type is used only as a secondary input to determinethe shielding effectiveness; the primary inputs are the shielding density and thickness. Finally,uranium is not a common shielding material for most RESRAD-BUILD applications. Therefore,the inability to verify the uranium mass attenuation coefficients is not critical.
With the exceptions noted above, the coefficients in ATTEN.DAT exactly matched thecoefficients listed in Table 5.1 of the RHH for all materials and energies except for thecoefficients for concrete at energies between 1.0E-2 and 5.0E-01 MeV. The values inATTEN.DAT were up to 11 percent higher in this energy range, as shown in Table 2-3. Thesediscrepancies are not critical and are likely due to slightly different assumed compositions ofconcrete. Such variability can be expected in the different formulations of concrete that are likelyto be encountered in actual applications of the RESRAD-BUILD code.
No mass attenuation coefficients for air are listed in ATTEN.DAT. While air is not one of thematerial types that can be selected by the user, it appears to be used internally by the code todetermine the attenuation between otherwise unshielded sources and receptors. The user�smanual does not list the mass attenuation coefficients used in the code, and the source code wasnot reviewed. Therefore, it was impossible to directly verify the correct implementation of massattenuation coefficients for air.

Verification of RESRAD-BUILD, Version 3.1
Tetra Tech NUS, Inc. Page 5 03/31/03
Table 2-3. Comparison of Mass Attenuation Coefficients for Concrete Reported inATTEN.DAT and the Radiological Health Handbook
Energy (MeV) ATTEN.DAT RHH Ratio
1.0E-02 26.9 26.1 1.031.3E-02 26.9 n/a n/a1.5E-02 8.24 8.02 1.032.0E-02 3.59 3.47 1.033.0E-02 1.19 1.12 1.064.0E-02 0.605 0.552 1.105.0E-02 0.392 0.353 1.116.0E-02 0.295 0.266 1.118.0E-02 0.213 0.195 1.091.0E-01 0.179 0.167 1.071.5E-01 0.144 0.138 1.042.0E-01 0.127 0.124 1.023.0E-01 0.108 0.107 1.014.0E-01 0.0963 0.0955 1.015.0E-01 0.0877 0.0872 1.016.0E-01 0.081 0.0806 1.008.0E-01 0.0709 0.0708 1.001.0E+00 0.0637 0.0637 1.001.5E+00 0.0519 0.0519 1.002.0E+00 0.0448 0.0448 1.003.0E+00 0.0365 0.0365 1.004.0E+00 0.0319 0.0319 1.005.0E+00 0.029 0.0289 1.006.0E+00 0.027 0.027 1.008.0E+00 0.0245 0.0245 1.001.0E+01 0.0231 0.0231 1.00
2.1.2 NUCDCF.DATThe NUCDCF.DAT file contains the following data, primarily dose conversion factors (DCFs),in columnar form for each of the 67 radionuclides in the RESRAD-BUILD database:
• Principle nuclide name • Principle nuclide decay product (if any)• Ingestion DCF(mrem/pCi)• Inhalation DCF (mrem/pCi), • Immersion DCF (mrem/pCi/m3)• Surface contamination DCF (mrem/yr per pCi/m2)• Volume contamination DCF (mrem/yr per pCi/m3)• Half life (years)• Number of photons (if any)• Nuclide branching ratio (if applicable)
The DCFs for ingestion and inhalation were developed from Federal Guidance Report (FGR) 11(Eckerman et al. 1988) while the immersion, surface and volume contamination DCFs were

Verification of RESRAD-BUILD, Version 3.1
Tetra Tech NUS, Inc. Page 6 03/31/03
developed from FGR 12 (Eckerman and Ryman 1993). The source of the half-life was assumedto be FGR 11. The source of the number of photons and nuclide branching ratio data is notspecified or readily apparent, but such data are available from reference sources such as the RHH.
To verify the dose conversion factors, the contributions from short-lived associated radionuclides(decay products with half-life less than 180 days) had to be calculated first. The DCFs of anyassociated radionuclide were added to the DCF of the principal radionuclide that generated them,after accounting for the decay yield. The DCFs derived from the Federal Guidance Reports werethen converted to the proper units (from SI to standard units) so that ratios could be takenbetween the values listed in NUCDCF.DAT and the values used for verification. The ratio for allinhalation and ingestion DCF values, as well as the half-life values, was unity, indicating perfectagreement with the original source. Most of the ratios for the other pathway DCFs were unity,with the exception of some deviation on the order of 2% or less for Sb-125 (immersion andsurface contamination) and Th-229 (immersion, surface and volume contamination). It ispossible that such small discrepancies could be due to rounding, but they would not havesignificant effects on the dose calculations.
Based on the description of the external gamma model in Appendix F of the user�s manual, thesurface dose factors in this file are not used directly in the calculations. Rather, area sources aretreated as volume sources of small thickness (0.01 cm) with unit density. It is possible thatprevious versions of the RESRAD-BUILD code made use of contaminated surface DCF values,but if indeed these DCFs are no longer used, a note stating this fact should be added to the file.
2.1.3 NUCGAM.DAT
The NUCGAM.DAT file appears to contain a listing of the number of photons, energies, yields,and half-lives for each of the 67 radionuclides in the RESRAD-BUILD database that decays byphoton emission. It also appears to list the inhalation, ingestion, and immersion DCFs for some,but not all radionuclides. Several discrepancies were noted in these DCF values (relative to thevalues reported in NUCDCF.DAT), but the DCFs in NUCGAM.DAT were not formally verifiedas it appeared that RESRAD-BUILD did not use the DCF values from this file.
Only the data on the number of photons, energies and yields was verified for all photon-emittingradionuclides. The comparison was made using the RHH or ICRP Publication38 (ICRP 1983) asthe sources for the original data. The listing for each radionuclide consisted of first the photonenergies corresponding to the number of photons (as many as 20 energy groups per radionuclide).The contributions from associated radionuclides, accounting for yield, were included in theverification. In many cases, the photon groups in NUCGAM.DAT did not correspond to thephoton groups in the RHH or ICRP 38. This made the verification task very tedious, as certainassumptions had to be made regarding the proper grouping of photons corresponding to thegroups in NUCGAM.DAT.
A large number of discrepancies were encountered in verifying the photon energy groups andyields. In many cases, these discrepancies could not be resolved by re-assigning photons todifferent energy groups. However, such discrepancies do not appear to have any impact on thecalculation of external gamma doses in RESRAD-BUILD. The photon energy and yield dataused in these calculations appear to be drawn from another file, CEOFF_BD.LIB, described inthe next section. Therefore, while NUCGAM.DAT was found to contain numerousinconsistencies, this file does not appear to have any use in the current version of RESRAD-

Verification of RESRAD-BUILD, Version 3.1
Tetra Tech NUS, Inc. Page 7 03/31/03
BUILD and may have been retained from earlier versions of the code. If that is the case, a noteshould be added to the file to avoid potential sources of confusion.
2.1.4 COEFF_BD.LIBThe COEFF_BD.LIB file contains data necessary to perform external dose pathway calculations.The data are listed in columns (for each of 67 radionuclides) as follows:
• Volume contamination DCF for an infinite slab source from FGR 12, in (mrem/yr)per (pCi/g), including contributions of any associated decay products
• Fitted parameters Ai, Bi, KAi, and KBi used to calculate depth and cover factors fromTable F.1 in the RESRAD-BUILD user�s manual
• Number of photon groups (0, 1, 2, 3, or 4) that follow• Energy (in MeV) in each of up to 4 photon groups• Yield (fraction) of photons in each of photon energy group• Name of the principle radionuclide and whether it has associated decay products
(identified as �+d180�)
The volume contamination DCFs had already been verified for the file NUCDCF.DAT, butseveral DCF values in COEFF_BD.LIB were inconsistent and incorrect. The ratios of the DCFsfor Ce-144, Th-229, U-238, and Pu-244 were 0.99, 1.01, 0.90, and 3.83. These last two ratiosindicate that, for area and volume sources, the direct gamma doses calculated in RESRAD-BUILD from U-238 would be underestimated by 10 percent, while the doses from Pu-244 wouldbe overestimated by almost a factor of 4.
The fitted parameters Ai, Bi, KAi, and KBi were compared to the values in Table F-5 of the user�smanual and were all found to match with the exception of the KAi value for Eu-154, which was afactor of 10 times higher in Table 5.1 than in COEFF_BD.LIB.
Appendix F of the user�s manual indicates that three constraints were put on the four fittingparameters as follows:
• All the parameters are forced to be positive• A + B = 1• In the limit source depth, ts = zero; the DCF should match the contaminated surface
DCF
The first condition was verified for all radionuclides by visual inspection.
The second condition was verified by summing the Ai and Bi coefficients when these were non-zero to see whether the result was equal to one. A minor discrepancy was found for U-233, forwhich the sum was found to be 1.0001. This is likely due to some rounding and should notsignificantly affect any results.
The third condition was verified by implementing equation F.2 in the user�s manual for the coverand depth factor (FCD). This equation makes use of all four fitting parameters, plus the cover andsource thickness and densities. In the limit as the volume source approaches zero thickness, thevolume source thickness was set to 0.01 cm, the density was set to 1.6 g/cm3, and the coverthickness and density were set to zero. The FCD calculated in this way should approach the ratio

Verification of RESRAD-BUILD, Version 3.1
Tetra Tech NUS, Inc. Page 8 03/31/03
of contaminated surface to volume DCFs from FGR12, corrected for a 0.000001-cm �thick�surface source. In fact, most of the calculated FCD values were within 2% of the FGR 12 surface-to-volume DCF ratios. However, the FGR 12 surface-to-volume DCF ratio calculated for Sm-151 was 25% higher than the calculated FCD value. This indicates a possible error in one or moreof the fitting parameters (Ai, Bi, KAi, and KBi) derived for Sm-151.
2.1.5 GP_ABS.LIB
The GP_ABS.LIB contains buildup factor coefficients for all eight material types accessible toRESRAD-BUILD users, plus the coefficients for air and �S as magnesium�. The reason forincluding the coefficients for sulfur is not clear and no explanation is provided in the RESRAD-BUILD user�s manual.
The source for the buildup factor coefficients is also not provided in the user�s manual. However,a review of the report External Exposure Model Used in the RESRAD Code for VariousGeometries of Contaminated Soil (Kamboj et al. 1998) indicates that the source of thecoefficients and the methodology for calculating the buildup factors is based on NUREG-5740(Trubey 1991). Therefore, the buildup factor coefficients listed in NUREG-5740 were used toverify the buildup coefficients listed in GP_ABS.LIB for air and the eight material types used inRESRAD-BUILD. The coefficients for sulfur were not verified, as there are no explanationprovided regarding their applicability to RESRAD-BUILD. All coefficients in GP_ABS.LIBwere found to match the values reported in Table 5.1 of NUREG-5740.
2.2 Parameter VerificationAfter the databases had been verified, all parameters that are normally accessible to the user wereexamined. The parameter names correspond to the way in which they are listed in the RESRAD-BUILD input files. The majority of these parameters are described in Appendix J of theRESRAD-BUILD user�s manual. A list of these parameters is presented in alphabetical order inTable 2-4 by the name with which they appear in a typical RESRAD-BUILD input file. As notedwhere appropriate, these names did not always match the name in the user�s manual.

Verification of RESRAD-BUILD, Version 3.1
Tetra Tech NUS, Inc. Page 9 03/31/03
Table 2-4. List of RESRAD-Build Parameters Accessible through the User Interface
Parameter Descriptive titleSection in
manualAIRFR Air Release Fraction J.4.7AREA Room Area J.2.5BRTRATE Breathing Rate J.3.5DENSI0 Bulk Density (volume source) J.4.16DKSUS Resuspension Rate J.2.3DLVL Receptor Room J.3.2DOSE_TIME Evaluation Time J.1.4DRYTHICK Dry Zone Thickness (tritium volume source) J.6.1DSDEN Shielding Density J.5.2DSTH Shielding Thickness J.5.1DX Coordinates of Receptor Location J.3.3EFDIF0 Effective Diffusion Coefficient (volume source) J.4.19EMANA0 Radon Emanation Fraction (volume source) J.4.20EROS0 Erosion Rate (volume source) J.4.17FCONT0 Contaminated Region (volume source) J.4.14FTIN Indoor Time Fraction J.1.2H Room Height J.2.4H3POROSITY Porosity (tritium volume source) N/AH3RMVF Fraction of Water Available for Evaporation
(tritium volume source)J.6.4
H3THICK Wet+Dry Zone Thickness (tritium volumesource)
J.6.2
H3VOLFRACT Volumetric Water Content (tritium volumesource)
J.6.3
HUMIDITY Absolute Humidity of Indoor Air (tritium volumesource)
J.6.5
INGE1 Ingestion Rate (direct) J.4.8INGE2 Ingestion Rate (indirect) J.3.6LAMBDAT/LINPUT Building/Room Air Exchange Rate J.2.6MTLC Material Type (shielding) J.5.3MTLS Material Type (source) J.4.21ND Number of Receptors J.3.1NREGIO0 Number of Regions J.4.13NROOM Number of Rooms J.2.1NS Number of Sources J.4.1NTIME Number of Times for Calculations J.1.3NUCSNAM/NNUCS Radionuclide Name/Number of Radionuclides
per SourceN/A
POINT Time Integration J.1.5POROS0 Porosity (volume source) J.4.18Q12/Q21/Q23/Q32/N12/N23 Flow Rates Between Rooms J.2.7QINPUT Flow Rate Between the Interior and the Exterior J.2.8RF0 Time of Source Removal (Lifetime) J.4.10RMVFR Removable Fraction of Source J.4.9RNUCACT Radionuclide Concentration/Activity J.4.12RRF Radon Release Fraction J.4.11

Verification of RESRAD-BUILD, Version 3.1
Tetra Tech NUS, Inc. Page 10 03/31/03
Table 2-4. List of RESRAD-Build Parameters Accessible through the User Interface(Cont�d)
Parameter Descriptive titleSection in
manualSAREA Area (or Length) of Source J.4.6SDIR Source Direction J.4.4SLVL Source Room J.4.2STYPE Source Type (Geometry) J.4.3SX Coordinates of Source Location J.4.5THICK0 Thickness (volume source) J.4.15TITLE Case Title N/ATTIME Exposure Duration J.1.1
TWGHT Receptor Time Fraction J.3.4
U_activity Radiological Activity J.7.1UD Deposition Velocity J.2.2U_dose_unit Radiological Dose J.7.2WALL_DENSITY Bulk Density (tritium volume source) N/A
Any default parameter values displayed in the user interface were compared with the valuereported in both the user manual and in the parameter help screens of the user interface. Inaddition to the defaults, the code was tested by running cases with upper- and lower-bound valuesfor each parameter, as specified in the parameter help screen or user�s manual, or tested usingextremely small or large parameter values where no bounds are specified.
The code was tested to determine whether (and how) the user interface rejects inappropriateinputs for each parameter. Examples of this include testing parameter values outside of thespecified range or alphanumeric inputs entered when only numeric inputs are acceptable. Themanner in which the code handles conflicting parameter values was verified. Examples of suchconflicts include co-located sources/receptors and shielding thickness exceeding the source-receptor distance. In addition, certain parameters and their units may depend on the presence,absence and/or values of other parameters. These dependencies were also tested to ensure theywere handled correctly by the user interface and generated a valid input file.
The parameter test results were documented by using a Input Parameter Verification Checklistform. When test results indicated a problem, any relevant RESRAD-BUILD input and outputfiles were saved. To maintain consistency throughout the review process, the checklist form wasdesigned with a variety of input options. Where appropriate, the reviewer responded by selectingan option from pull-down menus, marking one or more checkboxes or entering values andcomments directly into the checklist form.
2.2.1 General ObservationsParameter-specific observations are listed in detail for each parameter in the CD-ROM appendixto this report and are summarized in Sections 2.2.2 through 2.2.9 for each parameter groupingdefined in Appendix J of the user�s manual. This section summarizes some responses to useractions that are common to a large number of parameters.

Verification of RESRAD-BUILD, Version 3.1
Tetra Tech NUS, Inc. Page 11 03/31/03
Response to entry of inappropriate or out-of-bound values
Entering an inappropriate value (e.g., alphanumeric or out of bounds) for most parametersrequiring typed user input, followed by an attempt to go to another parameter results in thefollowing error message:
X not set appropiately.
Where X would be replaced by the code name of the paramters, such as AIRFR or UD. This isthe correct way to handle such an input error. However, if the user simply tries to run the codeIMMEDIATELY following an unacceptable entry, the code will attempt to run but will report thefollowing error before crashing:
Run-time error '5': Invalid procedure call or argument
The output that is generated in most cases uses the previous (or default) value of parameter X,rather than the inappropriate value. The reason for this is that the user is not allowed to exit the"Details" window by pressing OK or Cancel without first entering a valid value for the parameter.However, in some cases the code actually computes spurious results using the out-of-boundvalues. These exceptions are noted in the parameter-specific discussions.
Response to entry of very small or very large values
Many parameters are defined with input fields that allow the entry of numerical values that areequal to (or slightly greater than) zero or are unbounded (i.e. the upper bound is �infinity�). Thisleads to untrapped errors when the entered values are either very small or very large. In some,but not all, cases, entering a very small value such as 1E-99 resulted in that value being set tozero by the code. However, this is not always the case. For example, in the case of volumesource density, DENSI0, the smallest density accepted without error in the default case is1E-45.Any smaller non-zero numbers cause the code to crash, with errors such as:
Cannot Open Error file "F77L3.EER", error # 6
Entering very large numbers (e.g., greater than 1E+31 for DENSI0) results in the following errormessage:
Cannot Open Error file "F77L3.EER", error #4 (or #104)
These errors are due to the computer limitiations for handling very large or very small numbers.While extreme values are unlikely to be entered by users, the user interface could be improved byincorporating error trapping for such extreme values and limiting the range of values to physicallyrealistic extremes.
2.2.2 Time Parameters
TTIME The general observations apply to this parameter for extreme and out-of-bound values.

Verification of RESRAD-BUILD, Version 3.1
Tetra Tech NUS, Inc. Page 12 03/31/03
The user�s manual specifies that the exposure duration can be any value greater than zero. Avalue of zero should result in zero dose (or be rejected as invalid by the code). However, while itis accepted by input field, the code does not execute properly, either running indefinitely (stuck in�Beginning Calculations�) or resulting in the following error message:
Cannot Open Error file "F77L3.EER", error # 6.
The solution to this is to prevent the user from entering a value of zero.Additional problems related to the execution of the uncertainty analysis module are reported inSection 3.1.1.
FTIN The general comments apply to the indoor fraction parameter for out-of-bound values.
The code does not normally accept out-of-bound values for the indoor fraction, which can rangefrom 0 to 1, inclusive. However, if the user simply tries to run the code IMMEDIATELYfollowing an unacceptable entry, such as '2', the code will initiate a run, but will report thefollowing error before crashing:
Run-time error '5': Invalid procedure call or argument
In addition, a full output report is actually generated for the run. The last page of the reportindicates that the Receptor Doses Received for the Exposure Duration are 1.85E+01 and1.62E+01 for year 0 and year 1, respectively. This is four times the default result and ismathematically consistent with a fourfold increase in the indoor time fraction (from a default of0.5 to 2), but is inconsistent with the defined bounds for this parameter.
The solution to this is to prevent the user from entering a value in excess of the bounding values,and trapping such an error before allowing the program to execute.
Additional problems related to the execution of the uncertainty analysis module are reported inSection 3.1.1.
NTIMENo errors were found in the way that the code processes the number of times for calculations.
DOSE_TIMEThe parameter name for the beginning times for each calculation is referred to as TIME inAppendix J, but is listed as DOSE_TIME in the input file.
Entering '0' or a negative number as a year is not accepted and the input field disappears (thesame effect as hitting the 'remove' button). This is only a nuisance issue, since the codeautomatically calculates the dose at time zero. Entering a number in excess of the upper bounddoes not result in a warning, but the code simply replaces the large number with the upper boundvalue.
The solution to this would be for the code to issue a formal warning to the user that the value thatis being entered is out-of-bounds.

Verification of RESRAD-BUILD, Version 3.1
Tetra Tech NUS, Inc. Page 13 03/31/03
POINTNo errors were found in the way that the code processes the maximum number of integrationpoints.
The space allocated for the parameter name is left blank in Appendix J of the user�s manual, butthe name given to the maximum number of integration points is POINT in the input file.
Running a test on the default case resulted in convergence after selecting only 2 points.Increasing the exposure duration by a factor of 10 resulted in convergence after selecting only 3points. Since many cases will rapidly converge, specifying somewhere in the output file howmany points were actually needed to achieve convergence would provide useful information.
2.2.3 Building Parameters
NROOMThe parameter name for the number of rooms is listed in the user�s manual as "NROOMS" but inthe code input it is listed as "NROOM."
With the default input file in memory, the following actions were performed in the BuildingParameters input panel: Press �Air Flow� button; Select 2 for �Number of Rooms�; Press �AirFlow� button; Select 3 for �Number of Rooms�; Press �Air Flow� button. This sequence ofactions caused three �Room Details� windows to open up on the screen, one for the one-, one forthe two-, and one for the three-room models. This has the potential to cause confusion, as theuser may choose a different number of rooms, but forget to cancel the inappropriate �RoomDetails� window. Inappropriate data may still be present on the screen, possibly covered by alarger sized window. Each of the three windows was found to accept user input even when onlyone would have been appropriate based on the current selection for the number of rooms.
The solution to this is to not allow multiple "Room Detail" windows to appear. Show only the "RoomDetail" window for the selected number of rooms.
UDThe general observations apply to the deposition velocity parameter for extreme and out-of-boundvalues.
If the user simply tries to run the code IMMEDIATELY following an unacceptable entry, such as'-1', the code will initiate a run, but will report the following error before crashing:
Run-time error '5': Invalid procedure call or argument
In addition, a full output report is actually generated for the run, with spurious results. Thefollowing dose summary is produced for the default case at time zero: Receptor External Deposition Immersion Inhalation Radon Ingestion 1 4.62E+00 5.23E-06 ******** ******** 0.00E+00 1.89E-06

Verification of RESRAD-BUILD, Version 3.1
Tetra Tech NUS, Inc. Page 14 03/31/03
Note that the calculated deposition dose with UD = -1 is actually higher than the maximumdeposition dose of 4.84E-6 for the default case at time zero obtained with UD = 1E37. The solution to this is to prevent the user from entering a value in excess of the bounding values,and trapping such an error before allowing the program to execute.
Additional problems related to the execution of the uncertainty analysis module are reported inSection 3.1.2.
DKSUSThe general observations apply to the resuspension rate parameter for extreme and out-of-boundvalues.
If the user simply tries to run the code IMMEDIATELY following an unacceptable entry, such as'-1', the code will initiate a run, but will report the following error before crashing:
Run-time error '5': Invalid procedure call or argument
In addition, a full output report is actually generated for the run, with spurious results. Thefollowing dose summary is produced for the default case at time zero: Receptor External Deposition Immersion Inhalation Radon Ingestion 1 4.62E+00 ******** 8.27E-09 8.09E-07 0.00E+00 ********
The solution to this is to prevent the user from entering a value in excess of the bounding values,and trapping such an error before allowing the program to execute.
Additional problems related to the execution of the uncertainty analysis module are reported inSection 3.1.2.
HThe general observations apply to the room height parameter for extreme and out-of-boundvalues.
It is possible to run the code with the "Room details" window still open, but any changes made tothe room height(s) will not be accepted and the code will run using the previous values. This isthe case with all other user-input parameters in the "Room details" window, as well as for allother input windows requiring an "OK/Cancel" response from the user.
The solution to this is for the code to request that the user either confirm or cancel any changesmade in open windows prior to running the code.
Additional problems related to the execution of the uncertainty analysis module are reported inSection 3.1.2.
AREAThe parameter name for the room area is listed in the user�s manual as "A" but in the code input itis listed as "AREA."

Verification of RESRAD-BUILD, Version 3.1
Tetra Tech NUS, Inc. Page 15 03/31/03
The general observations apply to the room area parameter for extreme and out-of-bound values.
Additional problems related to the execution of the uncertainty analysis module are reported inSection 3.1.2.
LAMBDAT/LINPUTThe general observations apply to the air exchange rate parameters for extreme and out-of-boundvalues.
The user�s manual indicates that the air exchange parameter value must be greater than zero. Avalue of zero should indeed result in problems with the air pathways because there would be aconstant buildup of airborne material over time and no steady state could be achieved. Therefore,it should be rejected as invalid by the code. However, a value of zero is accepted withoutwarning in the input field, but the code does not execute properly, resulting in the following errormessage:
Cannot Open Error file "F77L3.EER", error # 3.
Additional problems related to the execution of the uncertainty analysis module are reported inSection 3.1.2.
Q12/Q21/Q23/Q32/N12/N23If values of any intra-room airflow values are inconsistent with the air flow rates between therooms and the outside, this inconsistency will be highlighted by a red outflow field. The usermust then modify one or more of the airflow parameter values until a consistent airflowconfiguration is achieved. However, in many cases it is possible to enter inconsistent values thatare within acceptable parameter bounds with no warning from the code prior to running thescenario.
In the default 3-room model, entering ANY number other than the default for Q23 and runningthe code results in the following error message:
Physically inconsistent Building air modelPlease review air flow and try again
Also, entering ANY value for Q23 and/or Q32 will change the default values of Q12 and Q21from zero to some unpredictable (and possibly negative) value.
The user interface will accept a value of zero between all rooms as well as a very large number(1E+99).
In the 2-room model, the code accepts, but does not execute correctly, when zero is entered forQ12, Q21 or both, resulting in the following error message:
Physically inconsistent Building air modelPlease review air flow and try again

Verification of RESRAD-BUILD, Version 3.1
Tetra Tech NUS, Inc. Page 16 03/31/03
The same problem occurs when either Q23 or Q32 are set to zero in the 3-room model. This isnot an acceptable response, since it should be possible to specify airflow from one room intoanother, but no return airflow.
When both Q23 and Q32 are set to zero in the 3-room model, and the outside airflow is changedto 72 (as in the 1-room default scenario) the code runs correctly, yielding the same output as the1-room model. However, upon re-entering the "Room Details" window, both Q23 and Q32 arechanged from zero to 2.8421709430404E-14.
The lowest accepted value for Q12 and Q21 for the default 2-room model is 1E-5. A value of 1E-6 or smaller results in the following error message:
Physically inconsistent Building air modelPlease review air flow and try again
Any number greater than 1E-12 entered for Q12 in the default 3-room model will result in Q12being reset to zero. However, the code will accept and retain extremely small numbers (e.g., 1E-99) entered for Q21. The smallest value for Q32 that will not result in an error message is 1E-6.As indicated above, it was not possible to determine the smallest acceptable value for Q23 orQ32, since any value will generate an error message or change the default values for Q12 andQ21. Entering any value for the airflows between Rooms 2 and 3 will change the default airflowsfrom zero to some unpredictable (and possible negative) value.
In the 2-room model, it is possible to set Q12 to 1E99, but the Room 1 outflow field becomesnegative (with a red background). However, setting Q21 to 1E99 then causes the airflows out ofRooms 1 and 2 to be calculated as zero. This is physically impossible, since the airflow out of thebuilding must equal the total airflow into the building of 144 m3/h (84 into Room 1 and 60 intoRoom 2). Attempting to run the code results in the following error message:
Physically inconsistent Building air modelPlease review air flow and try again
The highest acceptable intra-room airflows for the default 2-room model is Q12 = Q21 = 1E17.However, this results in changes in the flows to the outside from Rooms 1 and 2 of 80 and 64m3/h, from 84 and 60 m3/h, respectively. The highest intra-room airflows that do not change thedefault flows from Rooms 1 and 2 to the outside are Q12 = Q21 = 1E16.
As with the 2-room model, it is possible to set all intra-room airflow paramters to 1E99, but theflows to the outside from all 3 rooms are set to zero. Attempting to run the code results in thefollowing error message:
Cannot Open Error file "F77L3.EER", error # 104
The highest intra-room airflows that do not change the default flows from Rooms 1, 2, and 3 tothe outside are Q12 = Q21 = Q23 = Q32 = 1E16. Higher values, such as 1E17 and 1E18 changethe outflow values so that the net building inflow and outflow is not zero, which is physicallyimpossible. However, the code accepts these values, appears to run correctly and DOES NOTreport an error. When inspecting Page 3 of RESRADB.RPT, these outflows are reported at theirdefault values, and are not consistent with the values shown in the "Room Details" window.

Verification of RESRAD-BUILD, Version 3.1
Tetra Tech NUS, Inc. Page 17 03/31/03
Setting a value of zero airflow between rooms (Q12 = Q21 = 0 and/or Q23 = Q32 = 0) shouldisolate adjacent rooms and not allow the movement of contaminants between these rooms.Currently this approach does not work due to the problems encountered with setting theseparameters to zero.
Resolution is required for problems encountered with re-calculations of the values of Q12, Q21,Q23, and/or Q32, as well as changes in the values of airflows from the rooms to the outside afterthe user clicks on the OK button in the "Room Details" window. Modify the interface to checkthat the input values are within the acceptable range before saving the input file and startingcalculations. Allow zero air flows between adjacent rooms. Allow uncertainty analysis, butimplement checks to ensure that the selected range of parameter values is consistent with theirdeterministic limits.
QINPUTWhile the building outdoor inflow and outflow parameters are defined as Q10, Q01, Q 20, Q02,Q30, and Q03 in the user�s manual, they are collectively identified as QINPUT in the input file.
The interface will accept a value of zero in all rooms as well as a very large number (1E+99). Ifall QINPUT values are set to zero in a 2- or 3-room model, the code calculates a value ofLAMBDAT = 0. This value of zero causes problems with the air pathways because there wouldbe a constant buildup of airborne material over time and no steady state could be achieved.Therefore, such combinations should be rejected as invalid by the code. Indeed, while a value ofall zeros is accepted by the interface, the code does not execute properly, resulting in thefollowing error message:
Cannot Open Error file "F77L3.EER", error # 6.
In the 3-room model, a Room 2 inflow of zero was accepted (all other values were left at theirdefaults), and the code appears to run without problems. However, upon re-entering the "RoomDetails" window, both directions of airflow between rooms 1 and 2 are changed from the defaultsof zero to -3.19744231092045E-14. Clicking on either of these fields and attempting to re-exitthe "Room Details" window or moving to another parameter results in the following errormessage:
q12 not set appropiately, orq21 not set appropiately
The code accepts, but does not execute correctly when a zero inflow rate is entered for Room 3instead of Room 2, resulting in the following error message:
Physically inconsistent Building air modelPlease review air flow and try again
In addition, the airflow between rooms 1 and 2 is changed by the code from the defaults of zero to3.19744231092045E-14 (note the positive sign, which does not cause the same error messages forQ12 or Q21 as encountered in the previous test). This is not an acceptable responses, since a zeroflow rate from the outside into any of the rooms (Room 3 in this case) is consistent with modelinga basement with no direct airflow connection to the outside. In addition, a zero flow rate betweenRooms 1 and 2 should not cause a problem, since one may wish to model a source in Room 2affecting a receptor in Room 1 (direct external pathway only from Source 2), while at the same

Verification of RESRAD-BUILD, Version 3.1
Tetra Tech NUS, Inc. Page 18 03/31/03
time allowing a receptor in Room 3 to be exposed to both direct external and air pathways fromthe same source. Note that adding a second receptor in Room 3 and moving the source from thedefault location in Room 1 to Room 2 did not resolve this problem.
Setting the Room 1 inflow rate to zero, with all other fields in the 3-room "Room Details"window left at their defaults, results in the following error message:
Cannot Open Error file "F77L3.EER", error # 3
If such situations cause computational problems in the 3-room model, at the very least the defaultairflows between Rooms 1 and 2 should be changed from zero to some other value, and the usershould not be allowed to enter zero simultaneously in both these fields. This restriction shouldprobably also be extended to the airflows between Rooms 2 and 3. As indicated above, however,such restrictions impose undue limitations on the choice of realistic exposure scenarios.
The smallest inflows that would be accepted and properly executed in the 2-room default scenarioare 1E-14 into Room 1 and zero into Room 2. However, after clicking OK to exit the "RoomDetails" window, the code changes the user-input Room 1 inflow from 0 to 1.008E-14, and theRoom 1 outflow is re-calculated as 1.1E-14. Reversing the flow rates causes the user-input Room1 inflow to be changed by the code from 0 to 7.99999999999997E-17, while the calculated flowout of room 2 changes from 1E-14 to 1.1 E-14.
The smallest inflow that is accepted and properly executed in the 3-room default scenario is 1E-5into Room 1. However, after clicking OK to exit the "Room Details" window, the code changesthe Room 1 inflow 9.99999987527644E-06. Changing the Room 2 inflow to any number otherthan the default of 60 causes the airflows between Rooms 1 and 2 to change from their default ofzero to some other value. In some cases these values are negative and cause the same errormessages for Q12 or Q21 as encountered in previous tests. The same problem occurs whenattempting to change the Room 3 inflows to any value other than the default.
The interface will accept a large number such as 1E+99, but the code does not execute properly,either running indefinetely (stuck in "Beginning Calculations) or resulting in the following errormessage:
Cannot Open Error file "F77L3.EER", error # 104 (or #4).
By trial and error, it was determined that the largest inflow into Room 1 that would be acceptedand properly executed by the default 2- or 3-room scenario was 1E+38.
The upper limit for the inflow into Room 2 is accepted and properly executed by the default 2-room scenario was 1E+4. A larger value (1E+5) is accepted, but results in the following errormessage after attempting to run the code:
Physically inconsistent Building air modelPlease review air flow and try again
Upon review of the "Room Details" window, Q12 and Q21 are changed by the code from theirdefault values of 30 to the inappropriate values of -1000, and Room 1 displays an air exchangerate of -10.

Verification of RESRAD-BUILD, Version 3.1
Tetra Tech NUS, Inc. Page 19 03/31/03
As noted previously, any non-default input for the flow into Room 2 or Room 3 (with all otherparameters at default values) results in automatic changes to the Q12, Q21, Q23, and Q32 valuesfrom their default values. Therefore, it is not possible to verify the maximum Room-2 or Room-3inflow rate for the 3-room model.
Resolutions to these issues are similar to those discussed in the previous section regarding theflows between rooms.
2.2.4 Receptor Parameters
NDThe code appears to be defining the parameter as the numeric number assigned to each receptor,not the total number of receptors as stated in the user�s manual. Although this may not actuallybe inconsistent, it is somewhat confusing.
When more than one receptor is added, and then one or more receptors are removed, the interfacewill not automatically re-number the receptors. As an example, the following sequence isfollowed:
• 9 receptors are added (for a total of 10 receptors)• The x coordinate for Receptors 1-10 is set to equal the receptor number• Receptor 2 is selected and removed• Receptor 4 is selected and removed• Receptor 5 is selected• 1 receptor is added
Upon removing Receptors 2 and 4, the receptor location drop-down menu box, the shieldingparameter table and the graphic display list Receptors 1-10, with Receptors 2 and 4 missing fromthe sequence. However, once the file is run/saved, the receptor location numbers in the input fileand output report are automatically re-numbered as Receptor 1-8, with the parameters forReceptor 3 now assigned to the previously deleted Receptor 2, Receptor 5 --> Receptor 3,Receptor 6 now assigned to previously deleted Receptor 4, Receptor 7 ---> Receptor 5, ---, andReceptor 10 --> Receptor 8. This is a potential source of confusion. It may not be immediatelyobvious to the user that the receptor was successfully removed, since the interface does notautomatically re-number the receptor locations once a receptor is removed until the saved file isloaded back into memory (unless, of course, the receptor location numbers being removed are atthe end of the list).
After Receptors 2 and 4 are removed, adding one receptor back results in this receptor beingassigned the number 2, but the parameter values associated with this new Receptor 2 are not thesame as the parameters assigned to the original Receptor 2; they are the same as the currentlyselected receptor number (in this case, Receptor 5). This is another potential source forconfusion, since the user may not realize that the values associated with this receptor number willprobably differ from the values originally entered. If the interface automatically renumbers thesequence of receptors each time one is removed, then the user may recognize that Receptors 2and 4 in the original listing have been "permanently" removed.

Verification of RESRAD-BUILD, Version 3.1
Tetra Tech NUS, Inc. Page 20 03/31/03
A less critical issue is the order in which the 10th receptor location appears in the pull-down box.It is placed between Receptors 1 and 2. The logical location in the box would be at the end of thelist (after Receptor 9).
There should be a faster way to select the number of receptors than adding or removing one at atime through the main menu bar, which is not intuitive and involves a sequence of two mouseclicks. One way to accomplish this would be to provide add and remove buttons in the "ReceptorParameters" window or in the graphic "Display" window. It would also be advisable to be able todelete a specific receptor number and have the interface automatically re-number the receptors,since this is done anyway when the file is saved and run. Finally, the 10th receptor location listedin the drop-down menu box should appear at the end of the listing, not between Receptors 1and 2. One possible approach would be to create a table (similar a combination of the shieldingtable and the evaluation time table) listing all Receptor properties, including the add/removebuttons, possibly a copy parameters button, and an automatic re-arrangement of remainingreceptors each time one is deleted.
DLVLContrary to what is stated in the Help Screen, the receptor room is not used by the Direct Externalpathway. The exposure from Direct External is independent of the receptor room. The user�smanual states that the air pathways are affected by this parameter but not the direct gammaradiation pathway.
The following sequence is tested, starting with the default case:
• The 3-room model is selected• 5 more receptors are added• Receptors 2 and 3 are assigned to Rooms 2 and 3, respectively• Receptors 4, 5, and 6 are assigned to Rooms 1, 2, and 3, respectively• Receptor 3 is selected• The number of rooms is changed to 2
At this point, the room assigned to Receptor 3 changes from Room 3 to Room 1, but the roomassigned to Receptor 6 changes from Room 3 to Room 2. If, however, any receptor other thanReceptors 3 or 6 is selected, and the number of rooms is changed from 3 to 2 rooms, the roomassigned to Receptor 3 changes from Room 3 to Room 2 (as is the case for Receptor 6). Thistreatment is inconsistent since the room number change appears to depend in part on whether anaffected receptor location is selected.
Note that restoring the problem back to a 3-room model does not automatically restore any priorRoom 3 assignments that had been re-assigned by the code. That is, Receptors 3 and 6 remain intheir re-assigned rooms (Rooms 2 or 1).
Resolutions to these issues include correcting the text in the Help Screen to exclude DirectExternal as a pathway that is affected by this parameter. Correct the problem observed whenchanging the number of rooms (NROOM) from 3 to 2 by ensuring a consistent treatment of theroom into which receptors previously assigned to Room 3 are re-assigned. One way toaccomplish this would be to warn the user that the room number change affects the location ofone or more receptors. The code could then request whether the affected receptor(s) should be re-

Verification of RESRAD-BUILD, Version 3.1
Tetra Tech NUS, Inc. Page 21 03/31/03
assigned to another room, giving a choice between Room 1 or 2 if moving from a 3- to a 2-roommodel, or whether the affected receptor(s) should be deleted.
DXWhile there are no explicit upper or lower bounds specified for the coordinates, the code imposesan effective bound at around +/- 1E+6. Attempting to enter an exponent between 7 and 69 (largerexponents cannot be entered) causes the code to immediately crash after reporting the followingerror message:
Run-time error '6': Overflow
While it is unlikely that a receptor would ever be located so far from the origin (>1,000 km), auser may wish to use large distances to suppress the direct external pathway from a source.
As pointed out in the description, it is up to the user to ensure that the receptor is not co-locatedwith a source (all source types), and is not on the same line (line source) or plane (area/volumesources) of a source. However, the code does not provide an explicit limit on how close to apoint, line, or plane a source and receptor may be located. When the source and receptor are "tooclose" the code behaves in different ways depending on the source type and/or the distancesbetween source and receptor. It is also possible to place a receptor outside of the plane, but"inside" of a volume source. These issues are addressed as part of the extreme/out-of-boundsvalues tests below.
Locating the receptor in the center of a cylindrical volume source does not result in an errormessage, but the results are physically inconsistent. Using the default volume source (15-cmthick, 36 m2 area, on plane normal to x direction) located at (0, 0, 0), the receptor location waschanged to be either 7.5 cm INSIDE the center of the volume source (-0.075, 0, 0) or 7.5 cmoutside the plane of and along the centerline of the source (0.075, 0, 0). In both cases the resultswere identical: a dose of 7.03 mrem from the direct external pathway at time zero.
There are no such volumetric space considerations for the remaining source types. However,there are implicit proximity limits imposed by the code that go beyond the stated exclusion ofreceptors from the same point, line or plane coordinates as a source. For the remaining tests, thereceptor is moved increasingly closer to the origin, where the center of the source is located.
The X coordinate of the receptor is moved at ever-decreasing distances from the default volumesource along the x axis (y and z receptor coordinates set to zero). The following direct externaldoses are calculated at time zero:
X (m) Dose (mrem)1E-1 6.971E-2 7.351E-3 7.721E-4 6.981E-5 7.081E-6 7.111E-7 7.121E-8 7.12
For the default volume source case, the "contact-dose" distance therefore appears to be 1E-7 m.The higher doses at 1E-2 and 1E-3 m are most likely due to integration or convergence issues.

Verification of RESRAD-BUILD, Version 3.1
Tetra Tech NUS, Inc. Page 22 03/31/03
The default source type is changed from volume to area and the receptor is placed at ever-decreasing distances from the source along the x axis (y and z receptor coordinates set to zero).The following direct external doses are calculated at time zero:
X (m) Dose (mrem)1E-1 6.44E-5 1E-2 1.06E-41E-3 1.43E-41E-4 1.31E-41E-5 1.17E-41E-6 1.18E-41E-7 1.18E-4
For the default area source case, the "contact-dose" distance therefore appears to be 1E-6 m. Thehigher doses at 1E-3 and 1E-4 are most likely due to integration or convergence issues, asindicated by the long times required to complete a simple run.
The default source type is changed from volume to line, with the direction set to z. The receptoris placed at ever-decreasing distances from the source along the x axis (y and z receptorcoordinates set to zero). The following direct external doses are calculated at time zero:
X (m) Dose (mrem)1E-1 9.24E-51E-2 9.29E-41E-3 9.31E-31E-4 9.31E-2.. ..1E-19 9.32E+13
Any distance smaller than 1E-19 results in the following error message:
Cannot Open Error file "F77L3.EER", error # 3 (or #36), or
Physically inconsistent source and receptor locationsPlease review locations and try again
The default source type is changed from volume to point. The receptor is placed at ever-decreasing distances from the source along the x axis (y and z receptor coordinates set to zero).The following direct external doses are calculated at time zero:
X (m) Dose (mrem)1E-1 2.96E-4 1E-2 2.97E-21E-3 2.97E+01E-4 2.97E+21E-5 2.97E+4.. ..1E-19 2.97E+32
Any distance smaller than 1E-19 results in the following error message:

Verification of RESRAD-BUILD, Version 3.1
Tetra Tech NUS, Inc. Page 23 03/31/03
Cannot Open Error file "F77L3.EER", error # 4, or
Physically inconsistent source and receptor locationsPlease review locations and try again
Of course, the increases in dose as a function of decreasing distance follow the inverse square (forpoint source) or inverse linear (for line source) law as expected. However, the smallest distanceis also governed by the combination of source activity, external gamma dose factor and the limitson how large a number can be handled by the code.The results of the extreme value tests conducted on the receptor coordinates are consistent withthe tests conducted on the source coordinates.
The code should be modified to limit uppper and lower coordinate values, as well as place limitson small numbers. This would reduce the potential generation of the error messages describedabove. Modify the code to check that a receptor is not located INSIDE a volume source bycomparing volume source thickness with the location of the receptor.
It is recommended that uncertainty analysis be enabled for this parameter. This would beextremely useful if the position of a receptor may change during the exposure duration. It wouldallow the user to model a single receptor at multiple locations within a room without requiring theuse of multiple receptor locations and time fractions. A potential application would be inestimating doses from decontaminating large area or volume sources, which require the worker tobe at different locations along the source over time.
TWGHTThe parameter name for the receptor time fraction in the user�s manual is listed as "TWIGHT"but in the code it is "TWGHT." The description for the receptor time fraction in the user�smanual, stating that the user can input a value greater than one, is not consistent with the code.The user�s manual specifies the range of the parameter as >0, whereas the code and help screenbound the upper value at 1 (the code also allows a value of zero, but this effectively sets the doseto zero). The discussion of collective dose in the user�s manual is consistent with the specifiedlack of an upper bound, but since the input values can not be greater than 1 for each receptor,there is no way to use this feature in the current version of the code.
If the user simply tries to run the code IMMEDIATELY following an unacceptable entry, such as'2', the code will attempt to run but will report the following error before crashing:
Run-time error '5': Invalid procedure call or argument
In addition, a full output report is actually generated for the run. The last page of the reportindicates that the Receptor Doses Received for the Exposure Duration are 9.23 and 8.09 for year0 and year 1, respectively. This is two times the default result and is mathematically consistentwith a twofold increase in the receptor time fraction (from 1 to 2), but is inconsistent with thedefined bounds for this parameter.
It is recommended that the upper bound be increased to a reasonable value consistent with arealistic number of exposed receptors so that collective dose calculations may be performed. Inaddition, this parameter should be eligible for uncertainty analysis since indoor occupancy maybe subject to considerable variability.

Verification of RESRAD-BUILD, Version 3.1
Tetra Tech NUS, Inc. Page 24 03/31/03
BRTRATEThe general observations apply to the breathing rate parameter for extreme and out-of-boundvalues.Since the user�s manual claims that this parameter controls the dose to a receptor from bothparticulate and radon inhalation pathways, Ra-226 was selected as the source radionuclide insteadof the default Co-60. While the code correctly suppressed the particulate inhalation pathway(zero dose) when the breathing rate was set to zero, the radon inhalation was not changed fromthe default dose of 2.27 mrem for year zero. This concern is addressed in more detail as part ofthe radon model verification.
The practical upper bound, from trial-and-error running the default case, appears to be 1E38 (seeExtreme Test results). However, the upper bound of the breathing rate should be set at a muchlower value to reflect the physiological limits of this parameter. In addition, by setting the valueof this parameter sufficiently high, it may be possible to calculate an inhalation of activity thatexceeds the source inventory, resulting in a gross mass-balance error.
If the user simply tries to run the code IMMEDIATELY following an unacceptable entry, such as'-1', the code will attempt to run but will report the following error before crashing:
Run-time error '5': Invalid procedure call or argument
In addition, a full output report is actually generated for the run, with spurious results. Thefollowing dose summary is produced for the default case (with a Ra-226 source) at time zero: Receptor External Deposition Immersion Inhalation Radon Ingestion 1 3.44E+00 5.55E-07 6.24E-09 ******** 2.27E+00 1.51E-05
Recommendations include revising the radon pathway model to incorporate the user-inputbreathing rate. Limit the upper bound of the parameter to a value that is physiologically possible.Provide a mass balance test to ensure that the inhaled activity does not exceed the activity in thesource.
Additional problems related to the execution of the uncertainty analysis module are reported inSection 3.1.3.
INGE2The general observations apply to the indirect ingestion rate parameter for extreme and out-of-bound values. The practical upper bound, from trial-and-error running the default case, appearsto be 1E38. However, the upper bound of the deposited material ingestion rate should be set at amuch lower value to reflect the physiological limits of this parameter. In addition, by setting thevalue of this parameter sufficiently high, it may be possible to calculate an ingestion of activitythat exceeds the source inventory, resulting in a gross mass-balance error.If the user simply tries to run the code IMMEDIATELY following an unacceptable entry, such as'-1', the code will attempt to run but will report the following error before crashing:
Run-time error '5': Invalid procedure call or argument
In addition, a full output report is actually generated for the run, with spurious results. Thefollowing dose summary is produced for the default case at time zero:

Verification of RESRAD-BUILD, Version 3.1
Tetra Tech NUS, Inc. Page 25 03/31/03
Receptor External Deposition Immersion Inhalation Radon Ingestion 1 4.62E+00 6.31E-07 7.20E-09 7.04E-07 0.00E+00 ********
Recommendations include limiting the upper bound of the parameter to a value that isphysiologically possible. A simplistic solution would be to perform a mass balance test to ensurethat the ingested activity does not exceed the activity in the deposited source. A better solutionmay be to include the indirect ingestion rate as a removal mechanism (sink) for the indoor airmodel.
Additional problems related to the execution of the uncertainty analysis module are reported inSection 3.1.3.
2.2.5 Source Parameters
NSThe code appears to be defining the parameter as the numeric number assigned to each source,not the total number of sources as stated in the user�s manual. Although this may not actually beinconsistent, it is somewhat confusing.
When more than one source is added, and then one or more sources are removed, the interfacewill not automatically re-number the sources. As an example, the following sequence isfollowed:
• 9 sources are added (for a total of 10 sources)• The x coordinate for Sources 1-10 is set to equal the source number• Source 2 is selected and removed• Source 4 is selected and removed• Source 5 is selected• 1 source is added
Upon removing Sources 2 and 4, the source location drop-down menu box, the shieldingparameter table and the graphic display list Sources 1-10, with Sources 2 and 4 missing from thesequence. However, once the file is run/saved, the source location numbers in the input file andoutput report are automatically re-numbered as Source 1-8, with the parameters for Source 3 nowassigned to the previously deleted Source 2, Source 5 --> Source 3, Source 6 now assigned topreviously deleted Source 4, Source 7 ---> Source 5, ---, and Source 10 --> Source 8. This is apotential source of confusion. It may not be immediately obvious to the user that the source wassuccessfully removed, since the interface does not automatically re-number the source locationsonce a source is removed until the saved file is loaded back into memory (unless, of course, thesource location numbers being removed are at the end of the list).
After Sources 2 and 4 are removed, adding one source back results in this source being assignedthe number 2, but the parameter values associated with this new Source 2 are not the same as theparameters assigned to the original Source 2; they are the same as the currently selected sourcenumber (in this case, Source 5). This is another potential source for confusion, since the user maynot realize that the values associated with this source number will probably differ from the valuesoriginally entered. If the interface automatically renumbers the sequence of sources each time

Verification of RESRAD-BUILD, Version 3.1
Tetra Tech NUS, Inc. Page 26 03/31/03
one is removed, then the user may recognize that Sources 2 and 4 in the original listing have been"permanently" removed.
A less critical issue is the order in which the 10th source location appears in the pull-down box.It is placed between Sources 1 and 2. The logical location in the box would be at the end of thelist (after Source 9).
There should be a faster way to select the number of sources than adding or removing one at atime through the main menu bar, which is not intuitive and involves a sequence of two mouseclicks. One way to accomplish this would be to provide add and remove buttons in the "SourceParameters" window or in the graphic "Display" window. It would also be advisable to be able todelete a specific source number and have the interface automatically re-number the sources, sincethis is done anyway when the file is saved and run. Finally, the 10th source location listed in thedrop-down menu box should appear at the end of the listing, not between Sources 1 and 2. Onepossible approach would be to create a table (similar a combination of the shielding table and theevaluation time table) listing all Source properties, including the add/remove buttons, possibly acopy parameters button, and an automatic re-arrangement of remaining sources each time one isdeleted.
SLVLContrary to what is stated in the Help Screen, the source room is not used by the Direct Externalpathway. The exposure from Direct External is independent of the source room. The user�smanual states that the air pathways are affected by this parameter but not the direct gammaradiation pathway.
The following sequence is tested, starting with the default case:
• The 3-room model is selected• 5 more sources are added• Sources 2 and 3 are assigned to Rooms 2 and 3, respectively• Sources 4, 5, and 6 are assigned to Rooms 1, 2, and 3, respectively• Source 3 is selected• The number of rooms is changed to 2
At this point, the room assigned to Source 3 changes from Room 3 to Room 1, but the roomassigned to Source 6 changes from Room 3 to Room 2. If, however, any source other thanSources 3 or 6 is selected, and the number of rooms is changed from 3 to 2 rooms, the roomassigned to Source 3 changes from Room 3 to Room 2 (as is the case for Source 6). Thistreatment is inconsistent since the room number change appears to depend in part on whether anaffected source location is selected.
Note that restoring the problem back to a 3-room model does not automatically restore any priorRoom 3 assignments that had been re-assigned by the code. That is, Sources 3 and 6 remain intheir re-assigned rooms (Rooms 2 or 1).
Resolutions to these issues include correcting the text in the Help Screen to exclude DirectExternal as a pathway that is affected by this parameter. Correct the problem observed whenchanging the number of rooms (NROOM) from 3 to 2 by ensuring a consistent treatment of theroom into which sources previously assigned to Room 3 are re-assigned. One way to accomplish

Verification of RESRAD-BUILD, Version 3.1
Tetra Tech NUS, Inc. Page 27 03/31/03
this would be to warn the user that the room number change affects the location of one or moresources. The code could then request whether the affected source(s) should be re-assigned toanother room, giving a choice between Room 1 or 2 if moving from a 3- to a 2-room model, orwhether the affected source(s) should be deleted.
STYPENo errors were found in the way that the code processes the source type.
SDIRIn the input file, the parameter values for source direction are stored as SDIR= SDIR(1),---,SDIR(i),---, SDIR(NS-1), SDIR(NS), where SDIR(i) is expressed as an integer between 1 and 3,inclusive. X = 1, Y = 2, Z = 3. The input file saves the direction of a point source as 1 (default),2 or 3, depending on the direction selected for any other source type previously assigned to thatsource number. While this direction number is meaningless for a point source, it is a possiblesource of confusion for advanced users that might inspect the input file. A more appropriate wayto handle point source direction in the input file may be to assign SDIR = 0 for a point source.However, this would add a layer of complexity, since reverting from point to other source typewould result in having to reset SDIR for that source to either X (1), Y (2), or Z (3). Note thatkeeping the non-zero point-source direction in the input file would not be a source of confusion tousers that do not inspect the input file: this parameter becomes unavailable and invisible in theGUI for a point source, and the code runs fine as is.
SXThe following text should be added for consistency with the receptor coordinates Help Screen andthe user�s manual: "The coordinates of the source location are used only to calculate directexternal exposure; the user must ensure that the source is not on the plane of a receptor so as notto violate this assumption in the calculation of external exposure."
Similar issues arise with both receptor and source placements, since the code calculates thedistance between source and receptor based on their relative coordinates and directions. As withthe discussion on the receptor coordinates, there are implicit proximity limits imposed by thecode that go beyond the stated exclusion of receptors from the same point, line or planecoordinates as a source. For the remaining tests, the receptor is located at the origin, and thecenters of each source are moved increasingly closer to the origin.
The X coordinate of the default volume source is moved at ever-decreasing distances from thereceptor along the x axis (y and z receptor coordinates set to zero). The following direct externaldoses are calculated at time zero:
X (m) Dose (mrem)1E-1 6.971E-2 7.351E-3 7.721E-4 6.981E-5 7.081E-6 7.111E-7 7.121E-8 7.12

Verification of RESRAD-BUILD, Version 3.1
Tetra Tech NUS, Inc. Page 28 03/31/03
For the default volume source case, the "contact-dose" distance therefore appears to be 1E-7 m.The higher doses at 1E-2 and 1E-3 m are most likely due to integration or convergence issues.
The default source type is changed from volume to area and the source is placed at ever-decreasing distances from the receptor along the x axis (y and z receptor coordinates set to zero).The following direct external doses are calculated at time zero:
X (m) Dose (mrem)1E-1 6.44E-5 1E-2 1.06E-41E-3 1.43E-41E-4 1.31E-41E-5 1.17E-41E-6 1.18E-41E-7 1.18E-4
For the default area source case, the "contact-dose" distance therefore appears to be 1E-6 m. Thehigher doses at 1E-3 and 1E-4 are most likely due to integration or convergence issues, asindicated by the long times required to complete a simple run.
The default source type is changed from volume to line, the source direction is changed to z, andthe source is placed at ever-decreasing distances from the receptor along the x axis (y and zreceptor coordinates set to zero). The following direct external doses are calculated at time zero:
X (m) Dose (mrem)1E-1 9.24E-51E-2 9.29E-41E-3 9.31E-31E-4 9.31E-2.. ..1E-19 9.32E+13
Any distance smaller than 1E-19 results in the following error message:
Cannot Open Error file "F77L3.EER", error # 3 (or #36), or
Physically inconsistent source and receptor locationsPlease review locations and try again
The default source type is changed from volume to point. The source is placed at ever-decreasingdistances from the receptor along the x axis (y and z receptor coordinates set to zero). Thefollowing direct external doses are calculated at time zero:
X (m) Dose (mrem)1E-1 2.96E-4 1E-2 2.97E-21E-3 2.97E+01E-4 2.97E+21E-5 2.97E+4.. ..1E-19 2.97E+32

Verification of RESRAD-BUILD, Version 3.1
Tetra Tech NUS, Inc. Page 29 03/31/03
Any distance smaller than 1E-19 results in the following error message:
Cannot Open Error file "F77L3.EER", error # 4,or
Physically inconsistent source and receptor locationsPlease review locations and try again
Of course, the increases in dose as a function of decreasing distance follow the inverse square (forpoint source) or inverse linear (for line source) law as expected. However, the smallest distanceis also governed by the combination of source activity, external gamma dose factor and the limitson how large a number can be handled by the code.
The results of the extreme value tests conducted on the source coordinates are consistent with thetests conducted on the receptor coordinates.
The code should be modified to limit upper and lower coordinate values, as well as place limitson small numbers. This would reduce the potential generation of the error messages describedabove. Modify the code to check that a receptor is not located INSIDE a volume source bycomparing volume source thickness with the location of the receptor.
It is recommended that uncertainty analysis be enabled for this parameter. This would beextremely useful if the position of the source may change during the exposure duration, as wouldbe the case during gradual removal of a source during decontamination. By correlating sourcearea (or length) and source/receptor coordinates, it would possible to model a source that isdecreasing over time and whose center is moving in space.
SAREAIf the selected source type is "line", the Help Screen displays the text for the area, not the length,when this parameters is highlighted and the help button is pressed.
The general observations apply to the source length/area parameter for extreme and out-of-boundvalues. In addition, entering the lower bound of zero area or length is accepted by the interface,but running the code results in the following error message:
Cannot Open Error file "F77L3.EER", error # 6
The exception to the above statement is when the user enters a tritium volume source. In thatcase, the code runs and reports a dose of zero.
The smallest area or length that is accepted by the interface and will not cause an error in thedefault case is 1E-3 m2 (volume source), 1E-5 m2 (area source), or 1E-45 m (line source).
The largest area or length that is accepted by the interface and will not cause an error in thedefault case is 1E+14 m2 (volume and area source) or 1E+19 m (line source). However, thelargest length for a line source that does not result in a "******" being reported for the directexternal dose at time zero is 1E+4 m.

Verification of RESRAD-BUILD, Version 3.1
Tetra Tech NUS, Inc. Page 30 03/31/03
Entering an extremely small or large value for the source area or length results in one of thefollowing error messages, depending on the magnitude of the value entered and/or the source typeselected:
Cannot Open Error file "F77L3.EER", error # 6 (or #16, or #4, or #104)
The input file reports the source area or length as follows: SAREA = SAREA(1), ---, SAREA(i),---, SAREA(NS-1), SAREA(NS), where SAREA(i) the source area or length, depending on theith source type. The input file saves the length of a point source as the source area or lengthpreviously assigned to that source number. While this area/length is meaningless for a pointsource, it is a possible source of confusion for advanced users that might inspect the input file. Amore appropriate way to handle point source area/length in the input file may be to assignSAREA= 0 for a point source. However, this would add a layer of complexity, since revertingfrom point to other source type would result in having to reset SAREA for that source to a non-zero entry. Note that keeping the non-zero point-source area/length in the input file would not bea source of confusion to users that do not inspect the input file; this parameter becomesunavailable and invisible in the interface for a point source, and the code runs fine as is.
Additional problems related to the execution of the uncertainty analysis module are reported inSection 3.1.4.
AIRFRThe general observations apply to the air release fraction parameter for out-of-bound values.
Additional problems related to the execution of the uncertainty analysis module are reported inSection 3.1.4.
INGE1The general observations apply to the direct ingestion rate parameter for extreme and out-of-bound values.
To test this parameter, the deposited material (indirect) ingestion rate was set to zero.
In the default case (volume source), the upper bound appears to be 1E+39 g/h. However, theupper bound of the direct ingestion rate from a volume source should be set at a much lowervalue to reflect the physiological limits of this parameter (i.e., maximum human mass ingestionrate). In addition, by setting the value of this parameter sufficiently high, it may be possible tocalculate an ingestion of source material and activity that greatly exceeds the source inventory,resulting in a gross mass-balance error.
For all other sources, the ingestion rate is calculated as a fraction of the source ingested per hour.The upper bound of the direct ingestion rate appears to be 1E+38/h for non-volume sources. Aswith the volume source, this upper bound is still extremely high, but not for physiologicallimitations since there is no ingestion of mass, just a "massless" fraction of the source activity.Setting this maximum ingestion rate for a point source of 1 pCi Co-60 results in a calculated doseof 2.82E+36 mrem during the exposure duration. Since the ingestion dose factor for Co-60 is2.69E-5 mrem/pCi, ingesting the entire source would result in an ingestion dose that is 41 ordersof magnitude lower than the dose calculated by the code using the maximum direct ingestion rate.

Verification of RESRAD-BUILD, Version 3.1
Tetra Tech NUS, Inc. Page 31 03/31/03
One way to resolve these issues is to limit the upper bound of the parameter to a value that isphysiologically possible. A simplistic solution would be to perform a mass balance test to ensurethat the activity ingested by all receptors does not exceed the activity in the source. A bettersolution may be to include the direct ingestion rate as a source removal mechanism (as is donewith the removal rate, erosion rate and radioactive decay mechanisms).
The direct ingestion dose from tritium in a volume source is always zero, regardless of how highthe ingestion rate and/or erosion rate are set. However, the indirect ingestion dose is not affected(unless the deposition velocity has been set to zero). This is not a problem for all other sourcetypes. The only way to enable the direct ingestion of tritium in a volume source is to set thewater fraction available for evaporation to a value less than the default of 1, but it is not realisticthat a receptor not be permitted to ingest "evaporable" water in a source prior to the evaporationhaving occurred.
Additional problems related to the execution of the uncertainty analysis module are reported inSection 3.1.4.
RMVFRThe general observations apply to the removable fraction parameter for out-of-bound values.
Additional problems related to the execution of the uncertainty analysis module are reported inSection 3.1.4.
RF0The parameter name is identified as SLIFE in the user's manual, but is listed as RF0 in the inputfile.
The general observations apply to the source lifetime parameter for extreme and out-of-boundvalues. In addition, while the value of zero is accepted by the interface, running the default areasource with this lifetime results in the following error message:
Cannot Open Error file "F77L3.EER", error # 3
However, a value of zero would be physically consistent with a "puff" release of the source, butthe code would have to be modified to account for such non-steady state source release.
The smallest and largest numbers that are accepted and executed with a default non-volumesource are 1E-38 and 1E+33, respectively. However, entering an extremely small value for thetime of source removal results in unrealistically high doses from any of the air pathways. Forexample, running the default point source with 1 pCi of Co-60 and a source release lifetime of1E-38 d results in an inhalation dose of 2.36E+30 mrem. This is much higher than the maximumpossible dose of 2.19E-04 mrem that a receptor could incur from instantly inhaling the ENTIREsource.
In addition to the typical error messages incurred after entering extreme values, when a numberbetween 1E+34 and 1E+38 is entered, the following error message is generated:
Beginning Calculations Abnormal program termination: Illegal instructionCS:EIP = 000Fh:00004354h

Verification of RESRAD-BUILD, Version 3.1
Tetra Tech NUS, Inc. Page 32 03/31/03
In the input file, the times of source removal are reported in pairs as follows: RF0(1,1) = lifetimeof Source 1, followed below by RF0(1,2) = 0, . This sequence is repeated for all sourcenumbers, with RF0(i,2) always equal to 0, where i is the source number. The reason for havingthis second RF0 entry for each source is not immediately apparent, since it is independent of theactual time of source removal assigned to each source. The input file saves time of sourceremoval of a volume source as the default of 365 or the values selected for any other source typepreviously assigned to that source number. While this time of source removal is meaningless fora volume source, it is a possible source of confusion for advanced users that might inspect theinput file. A more appropriate way to handle a volume source removable fraction in the input filemay be to assign RF0 = 0 for a volume source. Note that keeping the default volume-source timeof source removal in the input file would not be a source of confusion to users that do not inspectthe input file: this parameter becomes unavailable and invisible in the interface for a volumesource, and the code runs fine as is.
Additional problems related to the execution of the uncertainty analysis module are reported inSection 3.1.4.
RRFThe general observations apply to the radon release fraction for out-of-bound values.
Additional problems related to the execution of the uncertainty analysis module are reported inSection 3.1.4.
RNUCACTThe general observations apply to the radionuclide activity/concentration parameter for extremeand out-of-bound values.
The code should indicate when a selected radionuclide has long-lived progeny and give the userthe option to add all long-lived progeny to the input window (within the 10 nuclide limit). Theinitial concentration can be set to zero, but the user would be allowed to enter a non-zeroconcentration for one or more progeny. This would make the input of radionuclides moreconsistent with the RESRAD code and may save the user some data entry time. Also, theuncertainty analysis module should be available for this parameter to reflect any uncertainties inthe measured values of individual radionuclides in each source.
NREGI0The Help Screen states that "All releases from the source, other than that of radon, are assumed tooccur from region 1." This should actually be written as "All releases from the source, other thanthat of radon, are assumed to start from region 1 and move to posterior regions as the anteriorregions are removed due to erosion." There should be some additional help regarding the releaseof radon and tritium.
The input file reports the number of regions per source as follows: NREGIO0 = NREGIO0(1),---,NREGIO0(i),---, NREGIO0(NS-1), NREGIO0(NS), where NREGIO0(i) is the number of regionsin the ith source. The input file saves the number of regions of a non-volume source as thedefault of 1 or the value selected for the volume source previously assigned to that sourcenumber. While this number of regions is meaningless for a non-volume source, it is a possible
Verification of RESRAD-BUILD, Version 3.1
Tetra Tech NUS, Inc. Page 33 03/31/03
source of confusion for advanced users that might inspect the input file. A more appropriate wayto handle the number of regions in the input file may be to assign NREGIO0 = 0 for a non-volume source, but this would require the code to revert back to the default number of regions ifthe user changes the non-volume source back to a volume source. Note that keeping the numberof regions for a non-volume source in the input file would not be a source of confusion to usersthat do not inspect the input file: this parameter becomes unavailable and invisible in the GUI fora non-volume source, and the code runs fine as is.
There is a serious flaw in the way that the code calculates the direct external dose from a volumesource. While this flaw is not entirely dependent on the number of regions that are selected, it isaccentuated in sources with multiple regions.
The cylindrical volume source modeled in RESRAD-BUILD must have two planar surfacesbounding the source. The coordinates used to locate the source correspond to the center of theplanar surface that is closest to the origin. The region immediately "behind" this surface isdefined as Region 1. "Behind" is defined as the region of space from the surface closest to theorigin in the direction of the second planar surface, which is furthest away from the origin. Notethat this region of space is undefined when the source is located at the origin, but is taken to bethe region of space in the positive direction. The problem arises when receptors are placed atopposite sides of a volume source. If two receptors are on placed on the source centerline,equidistant but in opposite directions from the center of the first planar surface that defines thesource location, it follows that one of these receptors should receive a higher direct external dosethan the other. For example, if a 15-cm thick volume source is located at the origin in the xdirection, the user might consider two receptors, Receptor 1 located at (-1,0,0) and Receptor 2located at (1,0,0), to be equidistant from the source. However, this would not be the case, sincethe finite thickness of the source means that some of the source volume would be closer to one ofthe receptors by an amount equal to the source thickness. The 15-cm thick source at the originoccupies the space in the positive x direction; to be truly equidistant from this source, Receptor 2would have to be located at (1.15,0,0). However, the code does not consider the space occupiedby the source in calculating the direct external dose. The calculated direct external doses to thereceptors that are equidistant from the origin, but on opposite sides of the source, are the same.
Multiple regions further complicate matters, since now receptors on opposite sides of the volumesource may be exposed to different internal shielding geometries. Consider the previousexample, but instead of a single-region source select two regions, each 15-cm thick. Regardlessof which region is selected as the one containing the contamination, it follows that the dose to twoequidistant receptors on opposite sides of the source volume should be different. It also followsthat the dose to the receptor on the side of the source containing the contaminated region shouldbe higher than the dose to the receptor equally distant from the side of the source containing theuncontaminated region. Using the previous example, but adding a second region to the source(contamination in Region 1) results in the dose to receptor 1 being higher than the dose toreceptor 2. This is consistent with the fact that receptor 1 is on the side of the contaminatedregion, whereas receptor 2 is shielded by the uncontaminated region of the source. SelectingRegion 2 as the location of the contamination simply flips the doses to the two receptors.However, the dose to Receptor 2 in this case should be higher than what the dose to Receptor 1was in the first case, since the contaminated region is now 30 cm closer to Receptor 2 than wasthe case for Receptor 1 when the contamination was located in Region 1. This is not the case,and the doses to the receptors on the unshielded side of the source are actually the same as thedoses reported for the single region source.

Verification of RESRAD-BUILD, Version 3.1
Tetra Tech NUS, Inc. Page 34 03/31/03
FCNT0When a volume source is set up for more than one region, it is possible to select a contaminatedregion other than the default Region 1. However, if the user later decides to change the numberof regions in that volume source to a number smaller than the previously selected contaminatedregion, the code will accept this change without warning the user. Upon inspection of the wallregion parameters, all the radio buttons above each region appear to be unchecked (i.e., nocontaminated region appears to be selected). Running the code with no contaminated regionchecked results in the following error message:
Cannot Open Error file "F77L3.EER", error # 16
The code should be modified so that a warning is issued to the user (and/or reset the contaminatedregion) prior to exiting the "Details for Source # i" window if a reduction in the number of wallregions results in the inadvertent �removal� of the contaminated region.
THICK0The general observations apply to the source region thickness parameter for extreme and out-of-bound values. In addition, a value of zero thickness is accepted by the interface in the defaultcase (1-region volume source), but causes the following error message:
Cannot Open Error file "F77L3.EER", error # 6
This is true even for the thickness of a region in a multi-region source that does not contain thecontamination and is located "behind" the contaminated region (e.g., 3-region source withcontamination in Region 2, non-zero thickness in Regions 1 and 2, and zero thickness inRegion 3). The correct response for the code should be to either warn the user that zero isinappropriate, or accept zero thickness as a way to remove individual regions (similar to what isdone for the unsaturated zone thicknesses in the RESRAD code).
The smallest thickness that is accepted in the default case is 1E-43. However, the direct externaldose is reported to be zero for any thickness less than 1E-20. The air pathway doses, excludingradon, and the direct ingestion pathway are not affected by the differences in thickness of anextremely thin source, even though inhalation or ingestion of the entire source inventory wouldbe incapable of producing the calculated dose. For example, a source whose area is 36 m2, is 1E-20 cm thick and 2.4 g/cc dense, contaminated with 1 pCi/g of CO-60, contains 8.6E-17 pCi. Theinhalation dose factor for CO-60 is 2.19E-4 mrem/pCi, resulting in a maximum dose of 1.9E-20mrem if the entire source is inhaled. However, the reported inhalation dose is 7.83E-9 mrem. Totest the sensitivity of the source thickness to the air pathways calculations, 10 one-region volumesources are defined. The following thicknesses (with all other parameters at their default values)result in the following inhalation doses calculated at time zero:

Verification of RESRAD-BUILD, Version 3.1
Tetra Tech NUS, Inc. Page 35 03/31/03
Thickness (cm) Dose (mrem)1E-1 7.04E-71E-2 7.04E-71E-3 7.04E-71E-4 7.04E-71E-5 7.04E-71E-6 8.55E-81E-7 7.83E-91E-8 7.83E-91E-9 7.83E-91E-10 7.83E-9
Since the erosion rate controls the material removal rate from the source, increasing or decreasingthe value of this parameter will also change the source thickness at which the minimum airpathway doses occur. The impact of such changes is discussed in erosion rate parameterchecklist.
Very large thicknesses are accepted by the code, but a maximum thickness of 1E+25 cm can beentered in the default case without an error message.
Additional problems related to the execution of the uncertainty analysis module are reported inSection 3.1.4.
DENSI0The general observations apply to the source density parameter for extreme and out-of-boundvalues. In addition, a value of zero density is accepted by the interface in the default case (1-region volume source), but causes the following error message:
Cannot Open Error file "F77L3.EER", error # 6
This is true even for the density of a region in a multi-region source that does not contain thecontamination and is located "behind" the contaminated region (e.g., 3-region source withcontamination in Region 2, non-zero density in Regions 1 and 2, and zero density in Region 3).The correct response for the code should be to warn the user that zero is inappropriate.
The smallest density that is accepted in the default case is 1E-45. However, the direct externaldose is reported to be zero for any density less than 1E-20.
Very large densities are accepted by the code, and a maximum density of 1E+31 can be entered inthe default case without an error message. Physically, the material density cannot exceed that ofthe densest material typically available. For most practical cases, that is the density of uraniummetal. The RESRAD code uses a maximum density of 22.5 g/cc (and this is the stated limit inthe user�s manual). NOTE: as the material density for a contaminated region is increased, thedirect external dose approaches a maximum value, while the air pathways and direct ingestionpathways continue to increase proportionally to the increase in density. This is the expectedbehavior, since the concentration is expressed in activity per unit mass, and the source massincreases proportionally to the density. At higher densities, the external dose from the increasedinventory is countered by additional self-shielding of the source mass.

Verification of RESRAD-BUILD, Version 3.1
Tetra Tech NUS, Inc. Page 36 03/31/03
Additional problems related to the execution of the uncertainty analysis module are reported inSection 3.1.4.
EROS0The general observations apply to the source erosion rate parameter for extreme and out-of-boundvalues.
When both the "Details for Source i" and the "Wall Region Parameters" windows are still on thescreen, it is possible to select a different source number, add/remove radon precursors, change thesource type and/or change the number of regions in a volume source. While the "Details.."window reflects any changes made to either number of regions, source type or source number, the"Wall Region Parameters" window does not keep up with these changes unless the user first exitsand then re-enters this window. This may be a source of confusion if the user inadvertentlyforgets to exit this screen before modifying or moving on to another source. This could result inincorrect wall region parameters being assigned to a source.
The solution to this would be to require the user to exit or confirm the values in the "WallRegions Parameter" window prior to selecting a new source, changing the source type,adding/removing radon precursors, or changing the number of wall regions.
The erosion rate for a tritium source will result in a dose even when the Wet+Dry zone thickness= Dry zone thickness, as long as the volume fraction available for evaporation is less than 1.There is no apparent limit to the volume of bound tritium that could be removed, since the normalthickness parameter (THICK0) for a volume source does not apply in this case. Also, the erosionrate has no apparent impact on the time-dependent values of the Dry/Wet+Dry zone thicknesses.It is conceivable that the removal of surface layers could occur at a rate that is greater than theevaporation rate used in the model to remove the tritium from the source.
Additional problems related to the execution of the uncertainty analysis module are reported inSection 3.1.4.
POROS0In the Help File for the porosity, the range is indicated as being 0 to 1 INCLUSIVE. A value ofzero will cause the code to crash and a value of 1 is physically impossible. The correct phraseshould be "not inclusive." The user�s manual also should be edited to specify that 0 and 1 are notincluded in the range.
The general observations apply to the source porosity parameter for extreme and out-of-boundvalues. In addition, a value of zero is accepted by the interface, but attempting to run the coderesults in the following error message:
Cannot Open Error file "F77L3.EER", error # 3
An error occurs regardless of whether the region of the source with zero porosity is contaminatedor not. In the latter case, the error message is:
Cannot Open Error file "F77L3.EER", error # 6

Verification of RESRAD-BUILD, Version 3.1
Tetra Tech NUS, Inc. Page 37 03/31/03
Zero porosity should be accepted by the code to allow the user to suppress the radon pathway.This is how one might model a volume source region to simulate an impermeable barrier. Inaddition, the code should be able to calculate the diffusion of radon out of a multi-region sourcewhen one side of the region containing the contamination is sealed but the other is not. For a 1-region source, the smallest value for the porosity that does not result in an error messageis 1E-38. However, even such a low porosity value does not change the default radon dose of2.27 mrem from a Ra-226 source, indicating a possible problem with the calculation.
The smallest value for a 2-region source that does not result in an error message is 1E-45 when itis applied to the non-contaminated region. Not unrealistically small values of porosity applied tothe contaminated Region 2 of a 2-region source result in spurious results for the radon inhalationdose at time zero, as indicated below:
Porosity Dose
1E-1 2.27E+01E-2 2.27E+01E-3 2.27E+01E-4 2.21E+01E-5 2.71E+01E-6 6.86E+01E-7 ********1E-8 1.48E+21E-9 1.13E+01E-10 1.13E+0
At very small values of porosity, the results are even more extreme (e.g., a radon inhalation doseof 1.35E+21 with a porosity of 1E-27). The smallest value that does not result in an errormessage is 1E-31, but the reported radon inhalation dose is 1.11E+25.
The above results are highly dependent on which of the two regions is selected to contain thecontamination. If Region 1, rather than Region 2 as tested above, contains the contamination, thedose does not change from the default value of 2.27, regardless of the porosity value used inRegion 1.
Similar spurious results are observed when a third region is added, with the contaminated regionnow bounded by the two uncontaminated regions.
Setting the porosity in the default 1-region source to the upper bound value of 1 does not changethe radon inhalation dose from the default of 2.27 mrem, which is a suspect result. A porosity of1 is equivalent to vacuum, so any region with a porosity of 1 could not contain any material,contaminated or otherwise. This value should be rejected by the code.
The material density and porosity are closely linked properties. Logically, any material cannot bevery dense and very porous at the same time. There should be a correlation function betweendensity and porosity which should be checked and the code should provide warnings if the userexceeds these realistic bounds.
In addition to the usual error messages encountered with extreme values, in a 1-region source,entering a number between 1E-39 and 1E-45 results in the following error message:

Verification of RESRAD-BUILD, Version 3.1
Tetra Tech NUS, Inc. Page 38 03/31/03
Phar Lap fatal err 10049: Ran out of stack buffers.
It is important to resolve the problem that is causing spurious output to be generated at very lowor very high values of porosity. In addition, the codes should compare the material densities andporosities in each region to ensure that the user has entered values that are within realisticconstraints. The algorithm that uses the porosity to calculate the radon diffusion needs to bechecked, since radon doses appear to be very insensitive to changes in this parameter.
Additional problems related to the execution of the uncertainty analysis module are reported inSection 3.1.4.
EFDIF0The range for the effective diffusion coefficient in the user�s manual places an upper bound onthe value of 1.1E-5, but neither code nor Help Screen specify this. In fact, the default value of2E-5 lies outside of this range.
The general observations apply to the radon effective diffusion coefficient for extreme and out-of-bound values. In addition, a value of zero is accepted by the interface, but attempting to runthe code results in the following error message:
Cannot Open Error file "F77L3.EER", error # 3
This error occurs regardless of whether the region of the source with zero effective diffusioncoefficient is contaminated or not. A zero effective diffusion coefficient should be accepted bythe code to allow the user to suppress the radon pathway. This is how one might model a volumesource region to simulate an impermeable barrier. In addition, the code should be able tocalculate the diffusion of radon out of a multi-region source when one side of the regioncontaining the contamination is sealed but the other is not.
The smallest value for the effective diffusion coefficient that does not result in an error messageis 1E-11 for a one- or two-region source. Once more, this limiting value is independent ofwhether the region contains the contamination or not. However, the default radon dose does notchange when a very low effective diffusion rate is entered in the uncontaminated region of a two-region source. Some problems arise when a 3-region source is set up with the contamination inRegion 2. In this case, the smallest effective diffusion coefficient in the two outer regions thatwill not cause the code to report an error message or a radon dose of '******' is 1E-9.
Large values of effective diffusion coefficients may result in several different problems. Theseproblems are reported in the following two tests.
The first test consists of the default single-region source with a large effective diffusioncoefficient. As a baseline, the default effective diffusion coefficient (0.00002) results in a radondose of 2.27 mrem. Increasing the diffusion coefficient should result in a higher radon dose, butthis is not the case. The following doses are calculated by the code at time zero using thefollowing values for effective diffusion coefficient (EDC):

Verification of RESRAD-BUILD, Version 3.1
Tetra Tech NUS, Inc. Page 39 03/31/03
EDC Dose (mrem)1E+1 2.271E+2 2.271E+3 2.251E+4 2.211E+5 2.461E+6 2.731E+7 1.701E+8 9.44E-111E+9 9.44E-111E+10 9.44E-11
The dose of 9.44E-11 is reported for effective diffusion coefficients as large as 1E+31, beyondwhich the code reports an error message. The response of the code to large effective diffusioncoefficients is inconsistent with the expected response, since the dose appears to first decreaseslightly, then increase slightly, and finally drop dramatically to a limiting value as the effectivediffusion coefficient is increased by factors of ten. This limiting value is the contribution fromthe RA-226 that is eroded from the surface and will depend on the erosion rate (it will be zero ifthe erosion rate is set to zero).
The second test consists of a two-region volume source, with the contamination in Region 2.Increasing the effective diffusion coefficient in Region 1 (all other parameters at default) resultsin the following doses:
EDC Dose (mrem)1E+1 ********1E+2 1.131E+3 1.131E+4 3.58E+41E+5 ********1E+6 1.131E+7 ********>1E+7 Error message
Increasing the effective diffusion coefficient in the uncontaminated side of the source only shouldnot affect the radon dose to a receptor to such an extreme and erratic extent. It is interesting tonote that the most common dose that appears in the previous table is 1.13 mrem. This happens tobe half of the dose to a receptor from the default 1-region source. It appears that the code is notable to correctly calculate the diffusion of radon across the boundary between Regions 2 and 1when the diffusion rate in Region 1 is much larger than the diffusion rate in Region 2.
Radon precursors that are far up the decay chain (e.g., CM-252) may not be present in sufficientactivities in the source to generate much radon immediately following time zero. This results inthe radon dose being shown as '*******' in the output report. There is no explanation given forthis display. The user should be either warned that the radon dose is too small, or the radon doseshould simply be set to zero under these circumstances.
Additional problems related to the execution of the uncertainty analysis module are reported inSection 3.1.4.

Verification of RESRAD-BUILD, Version 3.1
Tetra Tech NUS, Inc. Page 40 03/31/03
EMANA0The radon emanation fraction is applicable only to the region that contains the contamination.However, in a multi-region source, the interface displays input fields for the radon emanationfraction even for those regions that are not contaminated. Entering any value between the lowerand upper bounds in these fields has no effect on the calculation.
The general observations apply to the radon emanation fraction for extreme and out-of-boundvalues.Additional problems related to the execution of the uncertainty analysis module are reported inSection 3.1.4.
MTLSThe input file reports the source material type as follows: MTLS = MTLS (1),---, MTLS (i),---,MTLS (NS-1), MTLS (NS), where MTLS (i) is the material type of the ith source. The sourcematerial is identified by an integer between 1 and 8, inclusive. Concrete = 1, water = 2,aluminum =3, iron = 4, copper = 5, tungsten = 6, lead = 7, uranium =8. The input file saves thesource material type of a non-volume source as the default of 1 or the value selected for thevolume source previously assigned to that source number. While this source material type ismeaningless for a non-volume source, it is a possible source of confusion for advanced users thatmight inspect the input file. A more appropriate way to handle source material type in the inputfile may be to assign MTLS = 0 for a non-volume source, but this would require the code torevert back to the default source material type if the user changes the non-volume source back toa volume source. Note that keeping the source material type for a non-volume source in the inputfile would not be a source of confusion to users that do not inspect the input file: this parameterbecomes unavailable and is invisible in the interface for a non-volume source, and the code runsfine as is.
A symbol is used to represent the last six source material types. This is inconsistent with the fullnames that are used to identify the material types when defining external shielding properties.
To test each material type, these steps are followed starting with the default case:
• Add 7 sources for a total of 8 sources, all located at (0,0,0)• Leave the material type for Source 1 at Concrete (1)• Change the material type (but not thickness or density) for Sources 2-8 to water (2),
aluminum (3), iron (4), copper (5), tungsten (6), lead (7), and uranium (8), respectively
The resulting direct external doses from each source at time zero are:
1 2 3 4 5 6 7 8 4.62E+00 4.56E+00 4.75E+00 4.51E+00 4.50E+00 3.43E+00 3.14E+00 2.80E+00
As expected, the material with the most effective self-shielding is uranium, but the lowereffectiveness of aluminum (which has a higher atomic number) relative to water and concreteneeds to be investigated.

Verification of RESRAD-BUILD, Version 3.1
Tetra Tech NUS, Inc. Page 41 03/31/03
2.2.6 Shielding Parameters
DSTHThe general observations apply to the shielding thickness parameter for extreme and out-of-boundvalues. In addition, if the user simply tries to run the code IMMEDIATELY following anunacceptable entry, such as '-1', the code will attempt to run but will report the following errorbefore crashing:
Run-time error '5': Invalid procedure call or argument
A full output report is actually generated for the run, with spurious results. The direct externaldose at time zero is reported to be 4.64 mrem, which is greater than the default dose with noshielding of 4.62 mrem.
Physically, the shielding thickness between a receptor and source pair cannot exceed the distanceseparating the two (in the direction normal to the source). However, it is possible to enter a valuegreater than 100 cm for the default case, where the receptor is located 1 m from the source (alongthe x axis). Any amount of shielding thickness that exceeds this distance has the effect ofreducing the direct external dose to levels that are not physically possible. The code does notprovide any warning alerting the user of this inconsistency.
When a non-zero parameter is entered for the shielding thickness, it appears on a yellowbackground in the "Source Receptor Table" window. This is inconsistent with the table legend,which shows the shielding thickness as having a blue background.
The "Shielding Parameters" window shows the active Source#/Receptor#. Since the receptorparameters are above and the source parameters are below, this order may lead to confusion andthe proper order should be Receptor#/Source#. There is also an inconsistency in the name of the"Source/Receptor Table" window. The receptor numbers are listed on the left, while the sourcenumbers are listed on the top, going towards the right. The window title should be renamed as"Receptor/Source Table"
Additional problems related to the execution of the uncertainty analysis module are reported inSection 3.1.5.
DSDENThe general observations apply to the shielding density parameter for extreme and out-of-boundvalues.
The effective upper bound in the default case (with zero shielding thickness) is 1E+35. Largervalues are accepted, but result in error messages. Physically, the shielding density cannot exceedthat of the densest material typically available for shielding. For most practical cases, that is thedensity of uranium metal. The RESRAD code uses a maximum density of 22.5 g/cc, which isalso the upper bound listed in the user�s manual.
To verify the effect of very large shield densities (but less than 1E+35), a small (but non-zero)shielding thickness was introduced. This had the expected effect of reducing the direct externaldose to zero.

Verification of RESRAD-BUILD, Version 3.1
Tetra Tech NUS, Inc. Page 42 03/31/03
To verify the lower bound of the density range, a non-zero shielding thickness (10 cm) is entered,keeping concrete as the shield material. After running the problem with the default density, thedensity is reduced by one order of magnitude for each step, with the following results for thedirect external dose:
Density (g/cc) Dose (mrem)
2.4E-0 0.9762.4E-1 3.982.4E-2 4.382.4E-3 4.412.4E-4 4.402.4E-5 4.40
This dose of 4.40 mrem does not change for densities approaching perfect vacuum (1E-99 g/cc).Reducing the shield thickness to 1 cm produces a maximum direct external dose of 4.59 mrem,regardless of the density. The default direct external dose (zero shield thickness) is 4.62.Therefore, there appears to be an error in the way the code handles the combination of shieldingthickness and density. The above differences in the maximum direct external doses are quitesignificant. The direct external dose from a shielded source should equal the dose from theunshielded source (zero thickness) when the density approaches zero, regardless of the shieldthickness that is entered by the user. NOTE: this issue appears to affect only the volume andarea sources. For point and line sources, the direct external doses from unshielded and shieldedsources are equivalent as the shield density approaches zero.
Additional problems related to the execution of the uncertainty analysis module are reported inSection 3.1.5.
MTLCTo test each material type, these steps are followed starting with the default case:
• Change the source type to "point"• Change the receptor location to (0,0,1)• Add 7 receptors for a total of 8 receptors, all located at (0,0,1)• Change the shielding thickness to 1 cm between all 8 receptors and Source 1• Leave all densities at 2.4 g/cc• Leave the shielding material for Receptor 1 at Concrete (1)• Change the shielding material for Receptors 2-8 to water (2), aluminum (3), iron (4), copper
(5), tungsten (6), lead (7), and uranium (8), respectively

Verification of RESRAD-BUILD, Version 3.1
Tetra Tech NUS, Inc. Page 43 03/31/03
The resulting direct external dose to each receptor at time zero is:
Source: 1Receptor External 1 2.86E+06 2 2.87E+06 3 2.87E+06 4 2.83E+06 5 2.83E+06 6 2.73E+06 7 2.70E+06 8 2.65E+06
As expected, the material with the greatest efficiency per unit mass is uranium. To determine theimpact of buildup factors over several mean free paths, the shielding thickness is increased from 1to 100 cm, with the following results at time zero:
Source: 1 Receptor External 1 7.58E+01 2 2.38E+01 3 1.19E+02 4 1.26E+02 Source: 1 Receptor External 5 1.45E+02 6 1.63E+01 7 5.83E+00 8 1.15E+00
As expected, the differences are now much more dramatic due to the greater amount of buildupoccurring in a thick shield. Water, despite having the lowest average Z value, appears to be amuch more effective shield in this case compared to all other materials except the last three(tungsten, lead, and uranium). While this is not necessarily a problem, it warrants furtherinvestigation into the relationships between attenuation and buildup.
2.2.7 Tritium Model Parameters
DRYTHICKThe user�s manual does not specify the name of this parameter. The second paragraph of theHelp Screen is duplicated for both the Dry zone thickness and the Wet+Dry zone thickness. Thistext describing the tritium volume source model should be deleted from these parameters' HelpScreens and instead should be cross-referenced through a link from the Help Screens of all theparameters that are used in the tritium volume source model.
The general observations apply to the Dry zone thickness parameter for extreme and out-of-bound values. Entering a value greater than the current value of the Wet+Dry zone thickness andattempting to go to another parameter results in the following error message:
Wet and Dry zone thickness cannot be less than Dry zone thickness

Verification of RESRAD-BUILD, Version 3.1
Tetra Tech NUS, Inc. Page 44 03/31/03
This is the correct way to handle such an input error. However, trying to run the code results inthe usual Run-time error report. Note that if the Wet+Dry zone thickness is zero and the Dryzone thickness in non-zero, no error message is generated but the resulting dose will be zero.
Additional problems related to the execution of the uncertainty analysis module are reported inSection 3.1.6.
H3THICKThe Help Screen description should be made consistent with the actual input parameter definition(i.e., provide help on Wet+Dry zone thickness, not the Wet zone thickness, which is not the actualparameter used).
The general observations apply to the Wet+Dry zone thickness parameter for extreme and out-of-bound values and the specific observations are similar to those made for the dry zone thickness.
Additional problems related to the execution of the uncertainty analysis module are reported inSection 3.1.6.
H3VOLFRACTThe general observations apply to the volumetric water content parameter for extreme and out-of-bound values.
It is possible for the user to enter a moisture content that exceeds the porosity, but is still less thanor equal to 1. This is physically impossible, as indicated in the Help Screen and user�s manual,but no warning is issued. A good solution to this problem would be to re-define the parameter asa fraction of the pore space, and not of the bulk material. That way, the volumetric water contentwould always be less than or equal to the porosity. A better name for such a parameter would be"pore water fraction" or "pore water content."
Recommendations for improvements include warning the user if the volumetric water contentexceeds the porosity (as is currently done for the Wet+Dry zone thickness and the Dry zonethickness) or re-define the parameter as the fraction of pore space that is occupied by water.
Additional problems related to the execution of the uncertainty analysis module are reported inSection 3.1.6.
H3RMVFThe general observations apply to the water fraction available for vaporization parameter for out-of-bound values.
Additional problems related to the execution of the uncertainty analysis module are reported inSection 3.1.6.
HUMIDITYThe general observations apply to the humidity parameter for extreme and out-of-bound values.

Verification of RESRAD-BUILD, Version 3.1
Tetra Tech NUS, Inc. Page 45 03/31/03
A very large humidity value is accepted by the code, despite the limitation of 100 g/m3 indicatedin the user�s manual. A maximum humidity of 1E+38 can be entered in the default case withoutan error message. However, such large values are physically impossible. The absolute humiditycannot exceed the carrying capacity of the air at normal building temperatures; the maximumvalue is not much higher than the default humidity. Condensation will remove any excess watervapor from the air.
Additional problems related to the execution of the uncertainty analysis module are reported inSection 3.1.6.
H3POROSITYThe user�s manual does not list this parameter. Note: this porosity parameter is distinct from theporosity parameter used to define a multi-region volume source (POROS0). This should beclearly indicated in the Help Screen. In addition, the reference to a region and the link to thedefinition of a region are inappropriate in this case, since there is only one region that can bedefined for a tritium volume source. A cautionary note should be included that the porositycannot be less than the volumetric water content.
The general observations apply to the tritium volume source porosity parameter for extreme andout-of-bound values.
It is possible for the user to enter a porosity that is less than the volumetric water content, but isstill greater than zero. This is in conflict with the requirement that the volumetric water contentbe less than the porosity. As indicated previously, a good way to resolve this issue is to re-definethe volumetric water content as the fraction of the available pore space, and not the fraction of thebulk volume.
Setting the porosity to the upper bound value of 1 is equivalent to vacuum, so any region with aporosity of 1 could not contain any material (unless the material is entirely water). This valueshould be rejected by the code.
The material density and porosity are closely linked properties. Logically, any material cannot bevery dense and very porous at the same time. There should be a correlation function betweendensity and porosity which should be checked and the code should provide warnings if the userexceeds these realistic bounds.
Additional problems related to the execution of the uncertainty analysis module are reported inSection 3.1.6.
WALL_DENSITYThe user's manual does not list this parameter. Note: this density parameter is distinct from thedensity parameter used to define a multi-region volume source (DENSI0). This should be clearlyindicated in the Help Screen. In addition, the reference to a region and the link to the definitionof a region are inappropriate in this case, since there is only one region that can be defined for atritium volume source.
The general observations apply to the tritium volume source density parameter for extreme andout-of-bound values.
Verification of RESRAD-BUILD, Version 3.1
Tetra Tech NUS, Inc. Page 46 03/31/03
A value of zero is accepted by the interface, and a non-zero dose is calculated for the default caseat time zero (1.19E-04 mrem). A zero density is not physically possible, and is incompatible witha tritium concentration expressed as activity per unit mass (rather than per unit volume).
Very large densities are accepted by the code, and a maximum density of 1E+31 can be entered inthe default case without an error message. Physically, the material density cannot exceed that ofthe densest material typically available. For most practical cases, that is the density of uraniummetal. The RESRAD code uses a maximum density of 22.5 g/cc. However, since a volumesource containing tritium has to be porous, the upper bound density will likely be even lower andcloser to the typical densities of concrete materials.
The material density and porosity are closely linked properties. Logically, any material cannot bevery dense and very porous at the same time. There should be a correlation function betweendensity and porosity which should be checked and the code should provide warnings
Additional problems related to the execution of the uncertainty analysis module are reported inSection 3.1.6.
2.2.8 Radiological Units
U_activityChanging the radiological units for activity is effective only for the duration of the currentRESRAD-BUILD session. Closing and then opening RESRAD-BUILD causes the units to revertto the default (pCi). Having to reset the units can become tedious for users that run the codeusing exclusively SI units or units other than the defaults.
One possible solution would be to display a dialog box asking the user if he/she wishes to savethe current activity units as the defaults (if these are different from the current saved defaults)upon exiting RESRAD-BUILD.
U_dose_unitChanging the radiological units for dose is effective only for the duration of the currentRESRAD-BUILD session. Closing and then opening RESRAD-BUILD causes the units to revertto the default (mrem). Having to reset the units can become tedious for users that run the codeusing exclusively SI units or units other than the defaults.
One possible solution would be to display a dialog box asking the user if he/she wishes to savethe current dose units as the defaults (if these are different from the current saved defaults) uponexiting RESRAD-BUILD.
2.2.9 Parameters Not Covered in Appendix J Several parameters were not described in Appendix J of the user�s manual. Two of theseparameters, H3POROSITY and WALL_DENSITY, are similar to the parameters POROS0 andDENSI0, but apply only to the tritium volume source model. The verification of these twoparameters is discussed in Section 2.2.7. Other parameters not covered in the manual are TITLEand NUCSNAM/NNUCS. The verification of these parameters is discussed below.

Verification of RESRAD-BUILD, Version 3.1
Tetra Tech NUS, Inc. Page 47 03/31/03
TITLEThe HELP Screen specifies that upper bound for the case title to be a 70-character alphanumerictitle. The following dummy 70-character alphanumeric title was entered to test the upper bound:
123456789a123456789b123456789c123456789d123456789e123456789f123456789g
This title was correctly reported in the input file, but the output file truncated the last 30characters.
A dummy 71-character alphanumeric title was accepted and correctly reported in the input file,despite the 70-character limitation reported in the help screen. However, as in the upper-boundtest, the output file displayed only the first 40 characters.
These issues can be resolved by allowing a 0-70 character title to be fully displayed in the outputfile and incorporating an error-checking routine to ensure that the 70-character limit is notexceeded by the user in the entry screen.
NUCSNAM/NNUCSThe code behaved as expected following a battery of the following four tests:
(1) Add more than 10 radionuclides to a source(2) Remove all radionuclides from a source(3) Add tritium to a volume source containing other radionuclides(4) Add other radionuclides to a volume source with tritium
Test (1) results in the following warning:
'Sorry, cannot have more than 10 radionuclides in a source. Please add a new source to put theadditional radionuclides'
Test (2) results in the following warning:
'A source must contain at least one radionuclide'
Test (3) resulted in the following warning:
'Please delete all other radionuclides before adding tritium'
Test (4) resulted in the following warning:
'Please delete tritium before adding other radionuclides'
In all cases where tritium is included in a source, the following warning is issued:
'Please note that the deposition velocity is the same for all radionuclides. Please see depositionvelocity help for further details.'

Verification of RESRAD-BUILD, Version 3.1
Tetra Tech NUS, Inc. Page 48 03/31/03
2.3 Individual Pathways VerificationThis portion of the verification task was an extension of the previous task. The Input ParameterVerification Checklist served as a means to identify the pathways that are affected or could besuppressed/activated depending on the parameter value. While RESRAD-BUILD does not allowthe user to suppress individual pathways, setting to zero a number of parameters that affect theother pathways can accomplish the same result. Going through this process had the additionaladvantage of identifying different ways of suppressing pathways. Table 2-5 shows the individualpathways that were tested. Several of these pathways share radionuclide release and transportmodels, which are indicated in Table 2-5. These common models were constructed individuallyon a spreadsheet based on the equations contained in the user�s manual. Where applicable, thesecommon models were linked to generate a complete, source-to-receptor pathway model. Thispermitted a single solution to be obtained for each model, which could then be shared amongthose pathways that have these models in common. For example, the Deposition External andIndirect Ingestion pathways share the Source Injection, Indoor Air Quality, and Depositionmodel. The only differences between these two pathways are the dose conversion factors andconsumption/occupancy rates. This model was linked to the Source Injection model. The outputfrom the Indoor Air Quality Model was then used as input to other �downstream� models such asthe Radon Dose model or the Deposition model. The spreadsheets for the individual pathwaymodels were linked to the various contributing models. When dictated by the complexity of thepathway model, other methods were used. For example, the direct external dose from a shieldedvolume source was set up using an industry-standard code such as MicroShield (Grove 1996).While it is recognized that this amounts to benchmarking, it is a reasonable and effectiveverification method when the industry-standard code itself has been extensively verified andvalidated. The limitations of the MicroShield methodology were noted, particularly in areaswhere it differed significantly from the methodology used in RESRAD-BUILD.
Table 2-5. List of RESRAD-BUILD Pathways and Models
Pathway Description: Models(s)
Direct External External gamma from point, line, area and volume source:Shielding Model
Submersion External External gamma from submersion in contaminated air: SourceInjection Model/Indoor Air Quality Model
Deposition External External gamma from surfaces contaminated by deposition:Source Injection Model/Indoor Air Quality Model/DepositionModel
Radon Inhalation Inhalation of radon and short-lived progeny: Radon DiffusionModel (volume source)/Indoor Air Quality Model/ProgenyEquilibrium Model/Radon Dose Model
Other Inhalation Inhalation of particulates and tritium: Source InjectionModel/Indoor Air Quality Model/Tritium Release Model(volume source)
Direct Ingestion Ingestion of contaminated material directly from the sourceIndirect Ingestion Ingestion of material from surfaces contaminated by
deposition: Source Injection Model/Indoor Air QualityModel/Deposition Model

Verification of RESRAD-BUILD, Version 3.1
Tetra Tech NUS, Inc. Page 49 03/31/03
For this task, all parameters that affected the outcome of a particular pathway model wereexamined as a group. A reasonable number of scenarios were constructed for each exposurepathway in RESRAD-BUILD, using default or other reasonable parameters when the defaultswere not appropriate.
The sources in the base-case scenarios included several radionuclides with a wide range of doseimpacts and transport properties. The verification cases included a representative set of alpha,beta and gamma emitters, as well as any radionuclides with special transport and exposureproperties (e.g., tritium and radon). For some pathways, multiple scenarios were assessed. Forexample, potential scenarios involving the direct gamma exposure pathway were verified for eachsource type (point, line, area, and volume), with or without shielding, and using differentshielding materials and density. Similarly, multiple scenarios were used to verify the calculationof air pathway doses when one, two, or three rooms are selected, with sources in one room andreceptors in another.
The individual pathway models were also verified qualitatively by entering extreme (orbounding) values for each model parameter to determine its impact on the overall calculation (seeSection 2.2). The purpose of this strategy was to uncover potential errors in the implementationof the model equations. An example is the detection of potential �divide-by-zero� or �overflow�errors that would not arise under �normal� conditions.
An evaluation was prepared for each pathway, outlining the models and scenarios that weretested, the radionuclides and parameter values used in each scenario, the result of the tests, andany discrepancies between the test results and the output generated by RESRAD-BUILD.
The pathway verification was initially set up to test the results for time zero, with no provision forradioactive decay or physical removal of the source material (other than to generate an airbornesource term). The verification of time-dependent calculations is discussed in Section 2.4.
The spreadsheet model and comparison files used in the verification of the RESRAD-BUILDpathways, as well as any RESRAD-BUILD and MicroShield input and output files, are includedin the CD-ROM appendix to this report.
2.3.1 Direct External Gamma PathwayThe direct external gamma pathway required extensive review and verification relative to theother five pathway models. While the calculation models used in RESRAD-BUILD were notreproduced in a spreadsheet, the models were tested by comparison with an industry-standardexternal gamma source and shielding model, MicroShield 5.0. MicroShield 5.0 is a point-kernelshielding code that has been rigorously verified. Appendix F of the RESRAD-BUILD user�smanual indicates that the area and material factors used in RESRAD-BUILD are derived usingthe point-kernel method. Therefore any benchmarking of RESRAD-BUILD results againstMicroShield results under similar assumptions and conditions can serve to evaluate the accuracyof the calculations in RESRAD-BUILD.
As indicated in Section 2.1.4, the primary radionuclide specific parameters used in the directexternal gamma pathway models have been simplified to allow for more efficient dosecalculations. For example, a maximum of four energy groups is used by RESRAD-BUILD forpoint and line sources, whereas MicroShield incorporates the unabridged energy groups fromICRP 38. In addition, MicroShield uses the point kernel method to break a line, area, or volume

Verification of RESRAD-BUILD, Version 3.1
Tetra Tech NUS, Inc. Page 50 03/31/03
source into segments to compute the attenuation along the trajectory from the source elementthrough any shielding, and integrates the contribution at the receptor location from this largenumber of �point� sources. RESRAD-BUILD uses analytical expressions and approximations forsource and shielding geometries, including the use of a depth-and-cover factor, area factor, andsource-receptor offset factor. The use of such expressions becomes less accurate for complexshielded sources, with a receptor positioned at a location offset from the source axis. In addition,RESRAD-BUILD and MicroShield use different methods to calculate the buildup factor.
Therefore, it was expected that RESRAD-BUILD and MicroShield would yield the best matchesfor an unshielded point source containing a high-energy gamma emitters at locations closest tothe receptor. The greatest discrepancies were expected in the comparison of shielded volumesources with offset receptor locations farther from the source. While discrepancies do notnecessarily indicate that RESRAD-BUILD is improperly calculating the doses based on thesimplified external gamma model, they do point out to inaccuracies and limitations inherent inthis method.
Source � Receptor GeometriesFigure 2-1 illustrates the source-receptor geometries used to define each scenario for each sourcetype. For each source type, four receptor locations were selected relative to the source centered atthe origin of the coordinate system. The four receptors were located at (1,0,0), (10,0,0), (1,1,0),and (10,10, 0). These coordinates were chosen to test the effects of moving the receptor alongand away from the source centerline (except for the point source geometry where there is no off-set). These geometries were tested in the absence and presence of shielding materials of varyingthickness and material type. For volume sources, both external and internal shieldingconfigurations were tested. Internal shields were created in RESRAD-BUILD using a volumesource with two regions and assigning the contamination to the second region, effectively makingthe first region a shield.
The line source was made to be 1-m long, and the area and volume sources each had a surfacearea of 1 m2; the contaminated region of the volume source was set to 10 cm. Since RESRAD-BUILD uses an area factor to scale the doses from finite sources, additional cases were run withboth codes to evaluate doses from area and volume sources of �infinite� area. The ratio offinite/infinite area results was then used as a measure of the �effective� area factor calculated forMicroShield and RESRAD-BUILD sources.

Verification of RESRAD-BUILD, Version 3.1
Tetra Tech NUS, Inc. Page 51 03/31/03
Figure 2-1. Source-Receptor Geometries Used to Test the Direct External Gamma Pathway
Radionuclide Selection and ActivityTen radionuclides were selected for testing based on the following considerations:
• C-14 First photon emitter in the list of radionuclides in the COEFF_BD file.• Co-60 Photon emitter with 1 photon in the COEFF_BD file.• Sr-90 Photon emitter with the lowest yield in the COEFF_BD file.• Ag-110m Photon emitter with the highest yield in the COEFF_BD file.• Cs-137 Photon emitter with 2 energies in the COEFF_BD file.• Ra-226 Photon emitter with 4 energies in the COEFF_BD file.• Th-228 Photon emitter with the highest energy in the COEFF_BD file.
Area Source Volume Source
Point Source Line Source

Verification of RESRAD-BUILD, Version 3.1
Tetra Tech NUS, Inc. Page 52 03/31/03
• Np-237 Photon emitter with 3 energies in the COEFF_BD file.• Pu-239 Photon emitter with the lowest energy in the COEFF_BD file.• Cf-252 Last photon emitter in the list of radionuclides in the COEFF_BD file.
These criteria cover the full spectrum of possible combinations, and the results from any other ofthe photon-emitting radionuclides considered in RESRAD-BUILD will be bounded by this list.
Appropriate unit activities or concentrations were entered for each source type within RESRAD-BUILD. For the point and line sources created in MicroShield, the default energy-group datawere replaced with the four-group energy spectra in the COEFF_BD file, and the source activitieswere scaled to reflect the photon emission frequencies for each energy group per unit activity orconcentration. Since RESRAD-BUILD does not use the four-group energy spectra for the areaand volume sources, the MicroShield source activities were entered exactly as they were enteredin RESRAD-BUILD.
Receptor Occupancy FactorThe time parameters in the RESRAD-BUILD code were set so that a receptor is exposed to thesource for one hour. In addition, the number of points for decay and ingrowth calculations wasset to 1 (no decay). This facilitated the comparison with the MicroShield results, which are givenin mrem/h.
Shielding Materials and DimensionsAll eight shielding materials available in RESRAD-BUILD were tested for cases involvingshields. The density of each shield was set to its default physical density. The shieldingthickness was selected considering the shield density and the photon energies emitted by sourcein order to avoid excessive or inadequate attenuation factors. For two radionuclides, Co-60 andPu-239, all eight materials were tested for all four source types. The other eight radionuclideswere tested with two source materials, using different materials for each source type, to ensurethat each possible radionuclide/shield material combination was tested. Table 2-6 presents asource type and shield material matrix indicating the material types and densities as well as theshield thickness used in each source and radionuclide combination. The blank cells in Table 2-6indicate combinations that were not tested.
In addition to the shielded source cases, tests were run to determine the impact of changes to thesource material type and density on the doses from an unshielded volume source. For these tests,the source material and radionuclide combinations were selected in accordance with the samematerial/radionuclide matrix for the volume source as listed in Table 2-6.

Verification of RESRAD-BUILD, Version 3.1
Tetra Tech NUS, Inc. Page 53 03/31/03
Table 2-6. Source Type and Shield Material Matrix for Point Source
Material and Material Density (g/cm3)SourceType andNuclide Concrete Water Aluminum Iron Copper Tungsten Lead Uranium
2.4 1 2.7 7.87 8.96 19.3 11.35 19.1Point Shielding Thickness (cm)C-14 4 0.2Co-60 15 30 15 5 5 2 3 2Sr-90 1 0.001Ag-110m 15 1.5Cs-137 15 5Ra-226 30 5Th-228 15 2Np-237 0.5 1Pu-239 1 1 1 1 1 0.001 0.01 0.002Cf-252 1 0.075
Line Shielding Thickness (cm)C-14 17 0.035Co-60 15 30 15 5 5 2 3 2Sr-90 0.05 0.001Ag-110m 15 5Cs-137 30 5Ra-226 15 2Th-228 4 3Np-237 0.7 0.3Pu-239 0.1 1 0.1 0.005 0.005 0.001 0.001 0.002Cf-252 9 0.7
Area Shielding Thickness (cm)C-14 4 0.04Co-60 15 30 15 5 5 2 3 2Sr-90 0.1 0.004Ag-110m 30 5Cs-137 12 1.5Ra-226 4 0.3Th-228 2 0.1Np-237 10 0.1Pu-239 0.1 1 0.1 0.005 0.003 0.001 0.002 0.003Cf-252 1 0.0005
Volume Shielding Thickness (cm)C-14 0.1 0.01Co-60 15 25 10 5 5 2.5 3 2Sr-90 1 0.002Ag-110m 10 1Cs-137 3 2Ra-226 1 0.1Th-228 5 0.1Np-237 5 10Pu-239 4 10 5 1 0.5 0.04 0.03 0.06Cf-252 2 0.03

Verification of RESRAD-BUILD, Version 3.1
Tetra Tech NUS, Inc. Page 54 03/31/03
Dosimetric and Buildup Factor ConsiderationsMicroShield calculates several different dosimetric quantities applicable to external gammaexposure scenarios. In RESRAD-BUILD a single direct external dose is reported, but the user�smanual does not specify the type of dose quantity used by the code. The effective doseequivalent for a whole body rotational exposure with photon buildup calculated by MicroShieldwas used for dose comparison purposes, as it appeared to be the dosimetric quantity that bestrepresented the doses calculated in RESRAD-BUILD for simple point sources.
Equation F.7 in Appendix F of the RESRAD-BUILD user�s manual indicates that thickness-weighted buildup factors for the air between the source and receptor, the source material (volumesources only) and the shield material (if applicable) are all used in determining a �composite�buildup factor. This is one limitation identified in the MicroShield code, which allows only theuse of a single material to calculate buildup factors. The impact of this limitation is mostapparent for a shielded volume source. Therefore, in these cases, two MicroShield runs weremade when two different materials were used for the source and shield to bound the results.
Air is not expected to have a large effect on buildup and attenuation for high-energy photonemitters located close to the receptor. However, this can be a significant source of discrepanciesbetween MicroShield and RESRAD-BUILD for low energy photon emitters located at distancethat result in substantial air attenuation and buildup. It is not possible to view or change theproperties of air (density) in either code, or the buildup factor coefficients for air are notcontained in any of the RESRAD-BUILD data files. It is therefore assumed that such propertiesare contained in the source code.
Criteria for Evaluating ResultsAs indicated above, there are several sources of discrepancies that could affect the resultscalculated by either code. Therefore, no single factor was applicable to all cases. Such criteriawould be highly dependent on the specific source/shield/receptor geometry and the photonenergies. Any significant deviations between RESRAD-BUILD and MicroShield results, andtheir possible reason, are discussed qualitatively.
Results - Unshielded CasesTable 2-7 shows the ratio between the of RESRAD-BUILD and MicroShield results for anunshielded point source. All of the ratios are within 20 percent, and the greatest deviations arenoted for radionuclides with relatively low energies. Since MicroShield was set up to use theRESRAD-BUILD energy groups to calculate point source doses, the major contributors to anydiscrepancies are likely to be factors affecting attenuation and buildup in air.

Verification of RESRAD-BUILD, Version 3.1
Tetra Tech NUS, Inc. Page 55 03/31/03
Table 2-7. Ratio of RESRAD-BUILD Results to MicroShield Results for Point Source
Receptor CoordinatesRadionuclide 1 (1,0,0) 2 (10,0,0) 3 (1,1,0) 4 (10,10,0)C-14 1.03 1.11 1.04 1.09Co-60 1.00 1.00 1.00 1.00Sr-90 1.16 0.99 1.15 0.92Ag-110m 1.00 1.00 1.00 1.00Cs-137 0.99 1.00 1.00 1.00Ra-226 1.00 1.00 1.00 1.00Th-228 1.04 1.05 1.04 1.05Np-237 1.02 1.01 1.02 1.01Pu-239 1.19 1.00 1.17 0.96Cf-252 1.01 1.07 1.02 1.08
Table 2-8 shows the ratio between the of RESRAD-BUILD and MicroShield results for anunshielded line source. With the exception of the distant receptors for the Pu-239 and Sr-90sources, all of the ratios are again within 20 percent, and the greatest deviations are noted forradionuclides with relatively low energies. At large distances, RESRAD reports extremely low orzero doses from Pu-239 and Sr-90 sources. A low dose is not unexpected from two radionuclideswith low photon energies and yields. However, it is surprising considering that doses from pointsource with the same total activity as the line source yielded slightly higher doses for the receptorlocated a 1 meter, but much higher results for the receptor at 10 meters. If anything, a 1-m linesource should be approximated by a point source much better at 10 meters distance. Thus, thereappears to be a problem in the way RESRAD-BUILD calculates doses from low energy linesources at large distances. For high-energy photon emitters such as Co-60, the results that werecalculated by RESRAD-BUILD for line source and point source at 10 meters are almost identical,as is expected.
Table 2-8. Ratio of RESRAD-BUILD Results to MicroShield Results for Line Source
Receptor CoordinatesRadionuclide 1 (1,0,0) 2 (10,0,0) 3 (1,1,0) 4 (10,10,0)C-14 1.03 1.11 1.01 0.92Co-60 1.00 1.00 0.99 0.98Sr-90 1.16 0.00 1.13 0.00Ag-110m 1.00 0.99 0.99 0.97Cs-137 1.00 1.00 1.00 0.97Ra-226 1.00 1.00 0.99 0.97Th-228 1.00 0.99 1.00 0.93Np-237 1.01 0.97 1.01 0.83Pu-239 1.18 0.00 1.16 0.00Cf-252 1.01 1.07 1.00 0.91
As discussed earlier, three steps were required to evaluate unshielded area and volume sources. Inthe first step, �absolute� dose results were compared for infinite sources. In the second step,�absolute� dose results were compared for finite sources. The default MicroShield energy groupswere used for all radionuclides except for C-14 and Sr-90, which are not in the MicroShielddatabase. The energy groups from the COEFF_BD file were used for these two radionuclides,

Verification of RESRAD-BUILD, Version 3.1
Tetra Tech NUS, Inc. Page 56 03/31/03
despite that fact that these are not used directly by RESRAD-BUILD in calculating the dosesfrom area and volume sources. RESRAD-BUILD uses approximations based on the doseconversion factors in FGR12 for a volume source of infinite extent.
Tables 2-9 and 2-10 show the ratio between the RESRAD-BUILD and MicroShield results forinfinite and finite area sources, respectively. Very large discrepancies were found for Th-232doses and lesser discrepancies for Np-237. The reason for the large difference in the Th-232calculations cannot be readily explained, since Th-232 does not have any short lived daughtersthat might be contributing to the much higher dose calculated by RESRAD-BUILD. Most likelythis is due to differences between the MicroShield data library and the FGR12 database. Inaddition, the dose ratios fluctuated between higher in MicroShield and higher in RESRAD-BUILD for Sr-90 and Pu-239 sources at different distances. As with the point and area sources,higher energy photon emitters such as Co-60, Ag-110m and Cs-137 yielded the closest results.
Table 2-9. Ratio of RESRAD-BUILD Results to MicroShield Results for Infinite AreaSource
Receptor CoordinatesRadionuclide 1 (1,0,0) 2 (10,0,0) 3 (1,1,0) 4 (10,10,0)C-14 0.00 0.00 0.00 0.00Co-60 0.93 0.99 0.94 0.99Sr-90 0.78 0.77 0.79 0.77Ag-110m 0.95 1.01 0.96 1.01Cs-137 0.91 0.97 0.92 0.97Ra-226 0.01 0.01 0.01 0.01Th-228 508.91 559.37 512.45 559.93Np-237 6.99 7.52 7.10 7.53Pu-239 1.45 0.52 1.46 0.52Cf-252 1.63 12.92 1.66 12.82
Table 2-10. Ratio of RESRAD-BUILD Results to MicroShield Results for Finite AreaSource
Receptor CoordinatesRadionuclide 1 (1,0,0) 2 (10,0,0) 3 (1,1,0) 4 (10,10,0)C-14 0.00 0.00 0.00 0.00Co-60 0.98 0.98 0.98 0.98Sr-90 1.02 0.86 1.00 0.79Ag-110m 1.01 1.01 1.01 1.01Cs-137 0.96 0.96 0.96 0.96Ra-226 0.01 0.01 0.01 0.01Th-228 483.06 607.66 489.19 612.38Np-237 7.13 7.65 7.16 7.62Pu-239 3.22 0.64 2.79 0.58Cf-252 0.62 3.21 0.66 6.58
Tables 2-11 and 2-12 show similar results for the infinite and finite volume sources, respectively,but here the discrepancies are slightly higher (except for the very large difference for Sr-90). Insome cases, such as Ra-226, the ratio is now more than two hundred times greater than one,

Verification of RESRAD-BUILD, Version 3.1
Tetra Tech NUS, Inc. Page 57 03/31/03
whereas it was on the order of one hundred times smaller than one for the area source. Again, theratios for the three high-energy gamma emitters are all within five-percent agreement.
Table 2-11. Ratio of RESRAD-BUILD Results to MicroShield Results for Infinite VolumeSource
Receptor CoordinatesRadionuclide 1 (1,0,0) 2 (10,0,0) 3 (1,1,0) 4 (10,10,0)C-14 6.62 6.11 6.70 6.11Co-60 1.03 1.04 1.03 1.05Sr-90 1.04E+06 7.44E+05 3.02E+06 1.55E+06Ag-110m 1.04 1.05 1.04 1.05Cs-137 0.99 1.00 0.99 1.00Ra-226 350.04 353.61 349.94 354.10Th-228 1368.98 1405.92 1371.10 1405.32Np-237 14.74 15.35 14.78 15.37Pu-239 1.24 1.12 1.29 1.13Cf-252 2.40 3.39 3.26 3.55
Table 2-12. Ratio of RESRAD-BUILD Results to MicroShield Results for Finite VolumeSource
Receptor CoordinatesRadionuclide 1 (1,0,0) 2 (10,0,0) 3 (1,1,0) 4 (10,10,0)C-14 6.35 6.20 6.35 6.15Co-60 0.95 0.94 0.95 0.95Sr-90 8.85E+05 7.51E+05 1.98E+06 1.69E+06Ag-110m 0.97 0.97 0.98 0.98Cs-137 0.94 0.94 0.95 0.94Ra-226 263.69 262.93 282.76 294.97Th-228 925.64 942.36 1026.51 1104.31Np-237 12.81 12.97 13.64 14.40Pu-239 1.28 1.04 1.32 1.10Cf-252 1.96 3.11 2.96 3.60
An effective area factor can be calculated when the dose from a finite source is divided by thedose from an infinite source located at the same distance from the receptor. These ratios for areaand volume sources were calculated for each radionuclide in both MicroShield and RESRAD-BUILD. The ratios of area factors for area and volume sources are presented in Tables 2-12 and2-14, respectively, and they provide an indication of how accurately RESRAD-BUILD is able toestimate this parameter. Ratios that deviate from unity by more than 20% are highlighted inboldface.

Verification of RESRAD-BUILD, Version 3.1
Tetra Tech NUS, Inc. Page 58 03/31/03
Table 2-13. Ratio of RESRAD-BUILD to MicroShield Area Factors for Area Source
Receptor CoordinatesRadionuclide 1 (1,0,0) 2 (10,0,0) 3 (1,1,0) 4 (10,10,0)C-14 1.03 1.08 1.02 1.06Co-60 1.06 0.99 1.05 1.00Sr-90 1.31 1.11 1.27 1.02Ag-110m 1.06 1.00 1.04 1.00Cs-137 1.05 0.99 1.04 0.99Ra-226 1.14 1.11 1.13 1.08Th-228 0.95 1.09 0.95 1.09Np-237 1.02 1.02 1.01 1.01Pu-239 2.22 1.24 1.91 1.12Cf-252 0.38 0.25 0.40 0.51
Table 2-14. Ratio of RESRAD-BUILD to MicroShield Area Factors for Volume Source
Receptor CoordinatesRadionuclide 1 (1,0,0) 2 (10,0,0) 3 (1,1,0) 4 (10,10,0)C-14 0.96 1.02 0.95 1.01Co-60 0.92 0.91 0.92 0.91Sr-90 0.85 1.01 0.66 1.09Ag-110m 0.94 0.92 0.94 0.93Cs-137 0.96 0.94 0.96 0.94Ra-226 0.75 0.74 0.81 0.83Th-228 0.68 0.67 0.75 0.79Np-237 0.87 0.84 0.92 0.94Pu-239 1.03 0.93 1.03 0.97Cf-252 0.82 0.92 0.91 1.01
As expected, the ratios are much more consistent than the ratios for absolute doses from finitesources. However, some significant deviations in the relative dose reduction from infinite tofinite source are evident. The most significant deviation is reported for the Pu-239 and Cf-252area factors for the finite area source, which in some cases exceeded a factor of two. It is alsointeresting to note that RESRAD-BUILD calculates a higher area factor for Pu-239, whereasMicroShield calculates a higher area factor for Cf-252. Finally, when observing the area-factorratios calculated for area and volume sources, it is apparent that RESRAD-BUILD calculateshigher area factors than MicroShield for the majority of the area sources, while the oppositeappears to be the case for volume source area factors. As expected, the best agreements areobtained for the three high-energy gamma emitters identified previously.
The final tests performed on unshielded sources were done to determine the differences betweenthe RESRAD-BUILD and MicroShield results due to source material selection. These testsinvolved two steps. First, the absolute doses were calculated with each code for the selectedsource material/radionuclide combinations. This first step had already been performed forconcrete, since this is the default material used in previous unshielded volume source tests.Additional tests were conducted for all the other 7 material types. The second step involvedtaking the direct ratio of the RESRAD-BUILD and MicroShield results for each sourcematerial/radionuclide combination.

Verification of RESRAD-BUILD, Version 3.1
Tetra Tech NUS, Inc. Page 59 03/31/03
The results of the second step are presented in Table 2-15. Note that the ratios for the concretevolume source in Table 2-15 are the same as those reported in Table 2-12.
Table 2-15. Ratio of RESRAD-BUILD to MicroShield Source-Material-Dependent Doses
Receptor CoordinatesShieldMaterial Radionuclide 1 (1,0,0) 2 (10,0,0) 3 (1,1,0) 4 (10,10,0)Concrete
Co-60 0.95 0.94 0.95 0.95Pu-239 1.28 1.04 1.32 1.10Th-228 925.64 942.36 1026.51 1104.31Np-237 12.81 12.97 13.64 14.40
WaterCo-60 0.40 0.40 0.40 0.40Pu-239 0.89 0.46 0.75 0.41Np-237 3.05 3.03 3.08 3.10Sr-90 275405.26 235988.20 274271.84 218639.80
AluminumCo-60 1.06 1.06 1.06 1.06Pu-239 1.40 1.16 1.46 1.21Cf-252 2.23 3.45 3.39 3.97Ag-110m 1.09 1.08 1.09 1.09
IronCo-60 2.78 2.76 2.77 2.77Pu-239 6.26 6.06 6.29 6.13C-14 20.64 20.35 39.51 41.28Cs-137 2.77 2.75 2.75 2.76
CopperCo-60 3.22 3.20 3.21 3.21Pu-239 7.38 7.15 7.30 7.21Sr-90 1.61E+08 3.25E+12 4.31E+28 4.47E+27Ra-226 2597.65 2769.58 2710.52 2907.09
TungstenCo-60 6.13 6.10 6.13 6.11Pu-239 39.16 19.72 9729.33 10892.56Ag-110m 6.47 6.47 6.51 6.46Th-228 145722.61 160611.26 315832.65 374309.25
LeadCo-60 3.58 3.56 3.58 3.57Pu-239 15.23 7.74 123.19 78.39Cs-137 3.64 3.64 3.65 3.65Cf-252 18.55 18.47 589.86 870.73

Verification of RESRAD-BUILD, Version 3.1
Tetra Tech NUS, Inc. Page 60 03/31/03
Table 2-15. Ratio of RESRAD-BUILD to MicroShield Source-Material-Dependent Doses(Cont�d)
Receptor CoordinatesShieldMaterial Radionuclide 1 (1,0,0) 2 (10,0,0) 3 (1,1,0) 4 (10,10,0)Uranium
Co-60 5.87 5.87 5.90 5.88Pu-239 13.44 7.43 72.54 49.75Ra-226 31341.99 33739.20 230878.19 314075.63C-14 680.11 2683.36 2.55E+13 4.78E+15
A very large range of results can be observed in Table 2-15, with the greatest discrepanciesobserved in radionuclides with lower photon energy emissions. The greatest observed differencewas a RESRAD-BUILD dose 28 orders of magnitude higher than MicroShield for Sr-90 incopper.
There are known (reported) problems with the MicroShield code under certain conditions, whichcould possibly be responsible for the observed discrepancies in source-material-dependent doses.Another possible reason for such large differences is that RESRAD-BUILD calculates multiplematerial buildup factors based on a thickness-weighted average of air and source materialbuildup. Therefore, especially for distant receptors and relatively thin sources of high-atomic-number material, RESRAD may overestimate the external gamma dose compared toMicroShield, where the buildup is calculated only from the source material properties. EquationF.7 of Appendix F in the RESRAD-BUILD user�s manual does not appear to consider the degreeof attenuation in each material traversed, only the absolute distance through the material. Sincethe buildup factors in air are significantly higher than the buildup factors in high-atomic-numbermaterials such as uranium, RESRAD-BUILD will significantly overestimate the external dosefrom these sources, especially for low energy photon emitters with multiple mean-free-paths inthe source material.
Results - Shielded CasesMultiple tests of shielded point, line, area and volume sources were conducted by the includingthe external shields defined in Table 2-6. The first set of tests was done by specifying that thebuildup factor properties used by MicroShield were those of air. A second set of tests wasconducted by specifying the buildup factor properties of the shield material. A third set of tests,valid only for the volume sources, was conducted by specifying the buildup factor properties ofthe source material.
Table 2-16 lists the ratios between RESRAD-BUILD and MicroShield for a point source byshield material, radionuclide, receptor location and buildup material. It appears that, in general,the best matches were obtained for point sources shielded by low-atomic number materials.
There appears to be a significant difference in the way the shield is configured in RESRAD-BUILD and in MicroShield. The offset receptor doses calculated by RESRAD-BUILD areconsistently higher than the offset doses calculated by MicroShield. The reason for this is due tothe fact that a shielding thickness is specified in RESRAD-BUILD, and the shield thickness istaken along line-of-sight trajectory between the source and receptor. In MicroShield the shieldingmaterial has a specific orientation relative to the source, not the receptor. While the source-shield-receptor geometries are identical for the receptors located on the x-axis, for off-setreceptors the �effective shielding thickness� in MicroShield is approximately 1.4 times higher

Verification of RESRAD-BUILD, Version 3.1
Tetra Tech NUS, Inc. Page 61 03/31/03
than in the equivalent RESRAD-BUILD case due to the 45-degree angle of incidence through theshield material. Therefore, greater attenuation is expected in the offset MicroShield cases.
Table 2-16. Ratio of RESRAD-BUILD to MicroShield Doses for Shielded Point Source
Receptor Coordinates
(1,0,0) (10,0,0) (1,1,0) (10,10,0) (1,0,0) (10,0,0) (1,1,0) (10,10,0)ShieldMaterial Radionuclide Air Buildup Factors Shield Buildup FactorsConcrete
Co-60 0.90 0.90 1.51 1.52 0.98 0.98 1.70 1.71Pu-239 0.76 0.73 0.75 0.73 1.01 0.99 1.03 1.04C-14 0.12 0.11 0.34 0.32 0.76 0.75 2.95 2.91Cs-137 0.81 0.81 1.63 1.64 0.99 0.99 2.09 2.11
WaterCo-60 0.99 0.99 1.58 1.59 0.99 0.98 1.57 1.58Pu-239 1.01 0.93 1.46 1.08 1.00 0.91 1.44 1.07Sr-90 1.00 0.84 1.64 1.29 0.99 0.82 1.61 1.26Ra-226 1.00 0.99 1.68 1.69 0.99 0.98 1.67 1.68
AluminumCo-60 0.90 0.89 1.60 1.61 0.98 0.98 1.80 1.81Pu-239 0.76 0.73 0.75 0.74 1.00 0.99 1.03 1.04Ag-110m 0.85 0.85 1.72 1.72 0.99 0.99 2.06 2.07Th-228 0.90 0.91 1.55 1.55 1.01 1.01 1.70 1.70
IronCo-60 0.80 0.80 1.37 1.37 0.98 0.98 1.75 1.76Pu-239 0.45 0.41 0.47 0.43 0.92 0.92 1.28 1.30Cs-137 0.62 0.61 1.28 1.28 0.97 0.97 2.24 2.26Cf-252 0.01 0.01 0.05 0.05 0.48 0.47 3.52 3.47
CopperCo-60 0.81 0.81 1.58 1.58 1.03 1.03 2.12 2.12Pu-239 0.87 0.31 0.38 0.34 0.87 0.87 1.36 1.36Ra-226 0.73 0.74 1.52 1.53 1.04 1.04 2.17 2.17C-14 0.03 0.03 0.11 0.10 0.54 0.54 3.39 3.32
TungstenCo-60 0.48 0.48 0.83 0.82 0.89 0.89 1.79 1.80Pu-239 0.80 0.87 1.27 1.09 1.00 1.21 1.60 1.70Th-228 0.61 0.61 1.04 1.04 0.95 0.95 1.66 1.66Np-237 0.11 0.11 0.19 0.18 0.76 0.76 2.14 2.14
LeadCo-60 0.46 0.45 0.75 0.73 0.87 0.87 1.71 1.71Pu-239 0.64 0.72 0.64 0.74 1.00 1.29 1.09 1.48Np-237 0.05 0.05 0.14 0.13 0.66 0.66 3.10 3.11Sr-90 1.39 1.51 2.61 2.73 1.81 2.14 3.56 4.06
UraniumCo-60 0.36 0.35 0.67 0.66 0.82 0.82 1.92 1.93Pu-239 0.57 0.61 0.88 0.75 0.75 0.92 1.24 1.27Cf-252 0.01 0.01 0.03 0.03 0.39 0.39 3.19 3.15Ag-110m 0.27 0.26 0.52 0.50 0.85 0.85 2.21 2.22

Verification of RESRAD-BUILD, Version 3.1
Tetra Tech NUS, Inc. Page 62 03/31/03
Another observation that was made is that the use in MicroShield of the shield material buildupfactors, rather than the air buildup factors, results in somewhat higher doses for low atomicnumber material and significantly lower doses for high atomic number materials. This isexpected, but adds another level of complexity to the evaluation of the results.
Table 2-17 lists the ratios between RESRAD-BUILD and MicroShield for a line source by shieldmaterial, radionuclide, receptor location and buildup material. The results are similar to those forthe point source, with two important differences. First, the cases with Sr-90 and Pu-239 exhibitedproblems similar to those that were encountered in the unshielded line sources when the receptoris at larger distances from the source. Second, the differences in the dose ratios for the offsetreceptors are less pronounced than for the point source. The reason for this is that the incidentangles through the shield in the MicroShield cases are closer to 90 degrees for the portions of theline source closest to the receptor. Therefore, these parts of the line source contributedisproportionably more to the dose than the distant portions. RESRAD-BUILD uses a shieldthickness that is the same for all parts of the line source. Geometrically, this is equivalent tosaying that the receptor is located on the longitudinal axis of a cylindrical shield of the specifiedthickness.
Table 2-18 lists the ratios between RESRAD-BUILD and MicroShield for an area source byshield material, radionuclide, receptor location and buildup material. Differences were muchmore pronounced than for the point and line sources. However, unlike the case with the point andline sources, the dose ratios for the offset receptors are very similar to the dose ratios for on-axisreceptors. The reason for this is that RESRAD-BUILD appears to consider the area sources andvolume sources to be shielded by a layer of material whose surface is parallel to the sourcesurface. This is the same geometry used in the MicroShield cases.
Table 2-19 lists the ratios between RESRAD-BUILD and MicroShield for a volume source byshield material, radionuclide, receptor location and buildup material. The ratios for the source asthe buildup material are presented separately in Table 2-20. In Table 2-20, the values forconcrete shield are the same as in Table 2-19, with concrete as the buildup material for bothshield and source. The results in Table 2-19 follow a pattern that is similar to what is seen inTable 2-20 for the area source. As with the area source, similar patterns can be observed withhow the two codes calculate the results.
A final test was performed to verify that RESRAD-BUILD calculates consistent results when theshielding material is external to a volume source or when it is part of the source. The latterrequires that a 2-region volume source be defined with essentially the same geometry andsource/shielding properties as the single-region volume source with external shielding. Thereceptor coordinates were adjusted to compensate for the thickness of the first region (which wasmade to be the shield region in the two-region volume source) making it equivalent to a single-region volume source with external shielding. The test was done for Co-60 and Pu-239 using aconcrete layer, with receptors at the 4 locations previously specified. For most cases, the 2-regionvolume source results indicated good agreement (deviations of less than 5%) with the previousRESRAD-BUILD calculations using an equivalent external shield. The only exception to thiswas the case for the 2-region source containing Co-60 and a receptor at one meter from thesource, where the dose from the source with an internal shield layer was 25% higher than thesource with an equivalent external source. The cause for this discrepancy was investigated, butcould not be ascertained.

Verification of RESRAD-BUILD, Version 3.1
Tetra Tech NUS, Inc. Page 63 03/31/03
Table 2-17. Ratio of RESRAD-BUILD to MicroShield Doses for Shielded Line Source
Receptor Coordinates
(1,0,0) (10,0,0) (1,1,0) (10,10,0) (1,0,0) (10,0,0) (1,1,0) (10,10,0)ShieldMaterial Radionuclide Air Buildup Factors Shield Buildup FactorsConcrete
Co-60 0.94 0.90 1.40 1.50 1.03 0.99 1.56 1.69Pu-239 0.87 0.36 1.19 0.00 1.04 0.44 1.43 0.00Cf-252 0.11 0.10 0.26 0.32 0.79 0.69 2.31 3.34Ag-110m 0.90 0.85 1.44 1.58 1.05 0.99 1.71 1.90
WaterCo-60 1.03 0.99 1.48 1.57 1.02 0.99 1.47 1.57Pu-239 1.04 0.17 1.37 0.00 1.03 0.16 1.35 0.00C-14 1.03 0.93 2.20 2.69 0.93 0.85 1.97 2.38Cs-137 1.05 1.00 1.67 1.84 1.04 0.99 1.64 1.80
AluminumCo-60 0.94 0.90 1.46 1.59 1.03 0.98 1.63 1.79Pu-239 0.84 0.41 1.17 0.00 1.01 0.50 1.40 0.00Sr-90 0.91 0.00 1.15 0.00 1.07 0.00 1.38 0.00Ra-226 0.90 0.85 1.46 1.60 1.04 0.99 1.71 1.88
IronCo-60 0.83 0.80 1.26 1.36 1.03 0.98 1.60 1.75Pu-239 0.84 0.45 1.18 0.00 1.04 0.59 1.45 0.00Ag-110m 0.75 0.71 1.22 1.34 1.05 0.99 1.79 2.01Th-228 0.82 0.79 1.12 1.19 1.02 0.99 1.38 1.45
CopperCo-60 0.86 0.81 1.41 1.57 1.10 1.03 1.86 2.10Pu-239 0.77 0.70 1.07 0.10 0.95 0.92 1.30 0.14Cs-137 0.65 0.60 1.25 1.46 1.12 1.03 2.34 2.86Cf-252 0.01 0.01 0.03 0.03 0.41 0.35 1.49 2.50
TungstenCo-60 0.51 0.47 0.77 0.81 0.94 0.89 1.60 1.79Pu-239 0.84 0.00 1.17 0.00 1.05 0.00 1.47 0.00Ra-226 0.55 0.52 0.85 0.91 1.01 0.96 1.62 1.78C-14 0.04 0.03 0.09 0.10 0.73 0.63 2.12 3.05
LeadCo-60 0.48 0.45 0.70 0.73 0.93 0.88 1.53 1.69Pu-239 1.37 0.00 1.88 0.00 1.71 0.00 2.37 0.00Th-228 0.62 0.60 0.90 0.96 0.99 0.95 1.47 1.58Np-237 0.11 0.10 0.16 0.16 0.83 0.75 1.77 2.20
UraniumCo-60 0.38 0.35 0.61 0.66 0.88 0.82 1.65 1.92Pu-239 0.59 0.38 0.82 0.00 0.79 0.57 1.15 0.00Np-237 0.12 0.11 0.17 0.17 0.85 0.78 1.74 2.11Sr-90 0.72 0.00 0.95 0.00 0.89 0.00 1.21 0.00
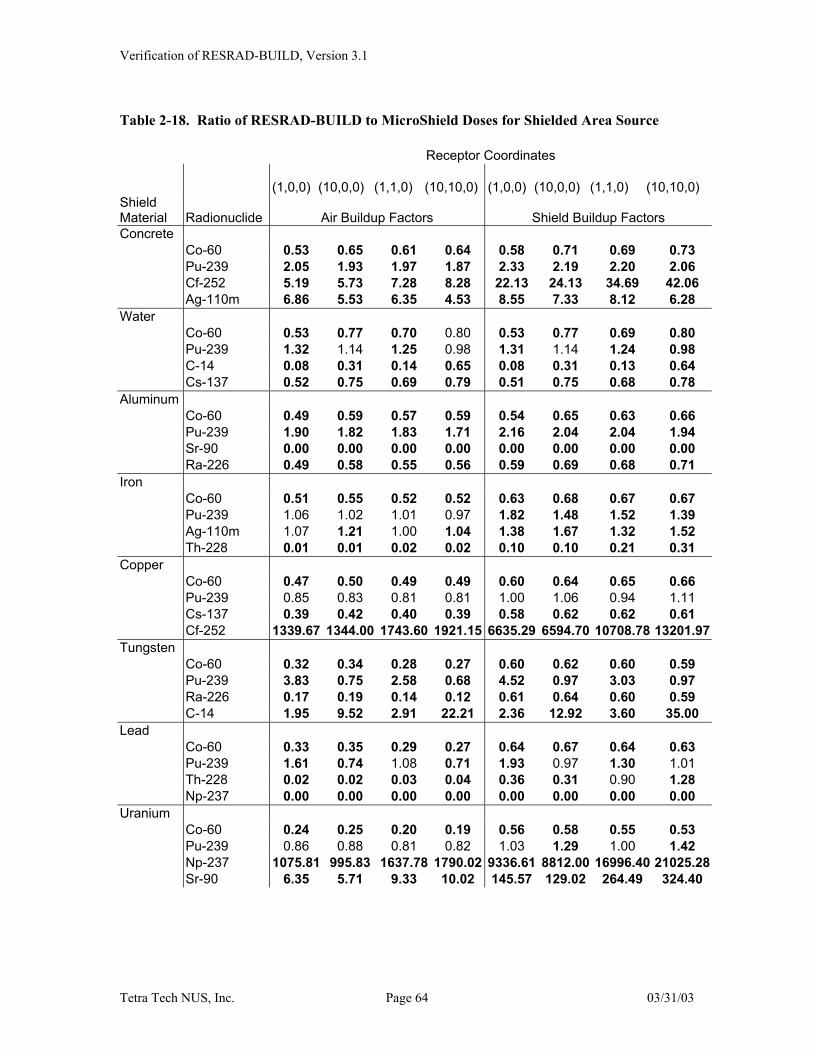
Verification of RESRAD-BUILD, Version 3.1
Tetra Tech NUS, Inc. Page 64 03/31/03
Table 2-18. Ratio of RESRAD-BUILD to MicroShield Doses for Shielded Area Source
Receptor Coordinates
(1,0,0) (10,0,0) (1,1,0) (10,10,0) (1,0,0) (10,0,0) (1,1,0) (10,10,0)ShieldMaterial Radionuclide Air Buildup Factors Shield Buildup FactorsConcrete
Co-60 0.53 0.65 0.61 0.64 0.58 0.71 0.69 0.73Pu-239 2.05 1.93 1.97 1.87 2.33 2.19 2.20 2.06Cf-252 5.19 5.73 7.28 8.28 22.13 24.13 34.69 42.06Ag-110m 6.86 5.53 6.35 4.53 8.55 7.33 8.12 6.28
WaterCo-60 0.53 0.77 0.70 0.80 0.53 0.77 0.69 0.80Pu-239 1.32 1.14 1.25 0.98 1.31 1.14 1.24 0.98C-14 0.08 0.31 0.14 0.65 0.08 0.31 0.13 0.64Cs-137 0.52 0.75 0.69 0.79 0.51 0.75 0.68 0.78
AluminumCo-60 0.49 0.59 0.57 0.59 0.54 0.65 0.63 0.66Pu-239 1.90 1.82 1.83 1.71 2.16 2.04 2.04 1.94Sr-90 0.00 0.00 0.00 0.00 0.00 0.00 0.00 0.00Ra-226 0.49 0.58 0.55 0.56 0.59 0.69 0.68 0.71
IronCo-60 0.51 0.55 0.52 0.52 0.63 0.68 0.67 0.67Pu-239 1.06 1.02 1.01 0.97 1.82 1.48 1.52 1.39Ag-110m 1.07 1.21 1.00 1.04 1.38 1.67 1.32 1.52Th-228 0.01 0.01 0.02 0.02 0.10 0.10 0.21 0.31
CopperCo-60 0.47 0.50 0.49 0.49 0.60 0.64 0.65 0.66Pu-239 0.85 0.83 0.81 0.81 1.00 1.06 0.94 1.11Cs-137 0.39 0.42 0.40 0.39 0.58 0.62 0.62 0.61Cf-252 1339.67 1344.00 1743.60 1921.15 6635.29 6594.70 10708.78 13201.97
TungstenCo-60 0.32 0.34 0.28 0.27 0.60 0.62 0.60 0.59Pu-239 3.83 0.75 2.58 0.68 4.52 0.97 3.03 0.97Ra-226 0.17 0.19 0.14 0.12 0.61 0.64 0.60 0.59C-14 1.95 9.52 2.91 22.21 2.36 12.92 3.60 35.00
LeadCo-60 0.33 0.35 0.29 0.27 0.64 0.67 0.64 0.63Pu-239 1.61 0.74 1.08 0.71 1.93 0.97 1.30 1.01Th-228 0.02 0.02 0.03 0.04 0.36 0.31 0.90 1.28Np-237 0.00 0.00 0.00 0.00 0.00 0.00 0.00 0.00
UraniumCo-60 0.24 0.25 0.20 0.19 0.56 0.58 0.55 0.53Pu-239 0.86 0.88 0.81 0.82 1.03 1.29 1.00 1.42Np-237 1075.81 995.83 1637.78 1790.02 9336.61 8812.00 16996.40 21025.28Sr-90 6.35 5.71 9.33 10.02 145.57 129.02 264.49 324.40

Verification of RESRAD-BUILD, Version 3.1
Tetra Tech NUS, Inc. Page 65 03/31/03
Table 2-19. Ratio of RESRAD-BUILD to MicroShield Doses for Shielded Concrete Volume Source(Air and Shield Material Buildup Factors)
Receptor Coordinates
(1,0,0) (10,0,0) (1,1,0) (10,10,0) (1,0,0) (10,0,0) (1,1,0) (10,10,0)ShieldMaterial Radionuclide Air Buildup Factors Shield Material Buildup FactorsConcrete
Co-60 0.44 0.53 0.52 0.53 0.49 0.59 0.59 0.61Pu-239 0.85 0.82 1.03 1.10 2.44 2.37 3.37 3.90Th-228 617.56 655.23 823.99 961.88 1632.23 1744.77 2312.93 2805.49Np-237 5.58 5.89 6.62 7.17 19.90 21.18 26.28 30.40
WaterCo-60 0.37 0.53 0.46 0.51 0.37 0.53 0.46 0.50Pu-239 0.86 0.82 1.05 1.11 0.82 0.78 0.99 1.04Np-237 4.77 5.41 5.63 6.10 4.48 5.07 5.25 5.66Sr-90 6.99E+08 5.72E+08 1.35E+09 1.11E+09 6.84E+08 5.58E+08 1.31E+09 1.07E+09
AluminumCo-60 0.25 0.31 0.25 0.24 0.27 0.33 0.27 0.27Pu-239 1.06 1.00 1.43 1.59 3.26 3.10 5.02 6.04Cf-252 0.47 0.47 0.43 0.40 1.87 1.92 1.94 1.96Ag-110m 0.54 0.61 0.58 0.59 0.62 0.70 0.68 0.70
IronCo-60 0.41 0.44 0.43 0.42 0.53 0.56 0.56 0.56Pu-239 1.16 1.09 1.61 1.81 15.06 14.36 27.30 36.36C-14 0.95 0.91 0.80 0.69 9.97 10.10 9.96 10.03Cs-137 0.56 0.58 0.56 0.56 0.85 0.88 0.91 0.93
CopperCo-60 0.38 0.40 0.40 0.40 0.50 0.53 0.54 0.54Pu-239 0.84 0.80 1.01 1.07 8.38 8.29 12.85 16.11Sr-90 7.48E+05 6.00E+05 1.43E+06 1.18E+06 9.94E+05 8.54E+05 2.09E+06 1.84E+06Ra-226 221.06 221.19 258.60 279.14 1040.31 1059.40 1491.47 1821.82
TungstenCo-60 0.17 0.18 0.13 0.12 0.80 0.79 0.90 0.92Pu-239 1.31 1.20 1.89 2.14 16.91 15.49 31.72 42.28Ag-110m 0.71 0.72 0.69 0.68 1.57 1.58 1.68 1.73Th-228 1806.06 1765.95 2287.54 2522.70 15427.62 15507.03 25031.85 32497.91
LeadCo-60 0.24 0.25 0.22 0.20 0.53 0.55 0.54 0.53Pu-239 0.79 0.76 0.93 0.98 3.87 3.78 5.06 5.67Cs-137 0.13 0.14 0.11 0.09 0.58 0.60 0.57 0.55Cf-252 0.44 0.42 0.40 0.37 5.94 6.13 6.71 7.39
UraniumCo-60 0.17 0.18 0.15 0.14 0.47 0.48 0.45 0.44Pu-239 0.79 0.77 0.94 0.99 11.84 12.03 18.75 24.03Ra-226 490.29 464.15 803.47 980.14 6981.57 6511.63 15337.22 22491.52C-14 0.77 0.75 0.63 0.53 11.56 11.68 11.45 11.43

Verification of RESRAD-BUILD, Version 3.1
Tetra Tech NUS, Inc. Page 66 03/31/03
Table 2-20. Ratio of RESRAD-BUILD to MicroShield Doses for Shielded Concrete VolumeSource (Source Material Buildup Factors)
Receptor Coordinates
(1,0,0) (10,0,0) (1,1,0) (10,10,0)SourceMaterial Radionuclide Source Material Buildup FactorsConcrete
Co-60 0.49 0.59 0.59 0.61Pu-239 2.44 2.37 3.37 3.90Th-228 1632.23 1744.77 2312.93 2805.49Np-237 19.90 21.18 26.28 30.40
WaterCo-60 0.41 0.59 0.52 0.57Pu-239 2.52 2.44 3.50 4.04Np-237 15.80 18.15 20.94 24.43Sr-90 9.02E+08 7.78E+08 1.88E+09 1.64E+09
AluminumCo-60 0.27 0.34 0.27 0.27Pu-239 3.47 3.30 5.38 6.50Cf-252 1.98 2.04 2.07 2.10Ag-110m 0.62 0.70 0.69 0.71
IronCo-60 0.46 0.49 0.48 0.48Pu-239 3.90 3.69 6.25 7.67C-14 4.68 4.65 4.44 4.26Cs-137 0.68 0.70 0.70 0.70
CopperCo-60 0.43 0.45 0.46 0.46Pu-239 2.36 2.28 3.21 3.69Sr-90 9.50E+05 8.07E+05 1.98E+06 1.72E+06Ra-226 407.47 410.65 523.75 597.01
TungstenCo-60 0.39 0.40 0.41 0.40Pu-239 4.67 4.27 7.82 9.66Ag-110m 0.81 0.82 0.81 0.80Th-228 3191.95 3152.10 4322.01 4976.97
LeadCo-60 0.27 0.28 0.24 0.23Pu-239 2.15 2.10 2.86 3.26Cs-137 0.16 0.17 0.14 0.12Cf-252 1.78 1.78 1.85 1.89
UraniumCo-60 0.20 0.20 0.17 0.15Pu-239 2.20 2.18 2.99 3.42Ra-226 1158.55 1090.56 2106.90 2729.41C-14 4.45 4.44 4.15 3.92

Verification of RESRAD-BUILD, Version 3.1
Tetra Tech NUS, Inc. Page 67 03/31/03
2.3.2 Submersion External Gamma PathwayEquation F.13 in Appendix F of the user�s manual forms the basis for verifying the calculation ofthe submersion dose.
Five radionuclides were selected for these tests: • H-3 (first radionuclide listed in the RESRAD-BUILD database and pure beta emitter)• Co-60 (default radionuclide, strong gamma-emitter)• Sr-90 (strong beta-emitting radionuclide)• Ra-226 (Rn-222 precursor, decay chain, alpha-gamma emitter)• Cf-252 (last radionuclide listed in the RESRAD-BUILD database, decay chain, alpha-gamma
emitter)
The components of this pathway were broken down into 4 sub modules tracking the movementfrom the source (injection), impact on indoor air quality (concentration in air), receptorcharacteristics (occupancy), and exposure point (dose).
Each individual module was set up as a spreadsheet linked to the other modules, each of which isdescribed below.
Source Injection ModuleTwo source types, area and volume, were set up in the source injection module using theRESRAD-BUILD defaults. The verification was not extended to point and line sources since thetransport mechanisms from these source types are the same as for the area source type. In fact,for all pathways except the direct external gamma pathway, the same results are obtained whenrunning point, line, or area sources with equivalent radionuclide inventories and equivalentexposure conditions. With the exception of the tritium volume source, the injection rate for eachradionuclide is independent of the properties of the radionuclide, but depends only on theproperties of the source. For the line and area models, the spreadsheet results of 5.71E-8 pCi/sexactly matched the results listed in the DIAG.OUT file generated by RESRAD-BUILD. Thesame was true for the spreadsheet result of 2.40E-8 pCi/s generated for the non-tritium volumesources.
Since the injection of tritiated water vapor from a volume source into the building air flow affectsonly the inhalation dose from tritium, the special tritium volume source model is verified inSection 2.3.5. Similarly, a special model applies to the release of radon, which has a separateinhalation model that differs significantly from the particulate inhalation model. The sourceinjection module for the radon pathway is verified in Section 2.3.4.
Air Flow ModuleThe indoor air quality model described in Appendix A of the user�s manual was set up on aspreadsheet with the RESRAD-Build default parameters. This module receives the output of thesource injection module as input and has a dependency on the half-life of each radionuclide. Theoutput from this module is the concentration of the radionuclide in air. The results for bothsource types exactly matched the concentrations reported in the RESRAD-BUILD DIAG.OUTfile, indicating that the code is correctly implementing the indoor air quality module for the oneroom model.

Verification of RESRAD-BUILD, Version 3.1
Tetra Tech NUS, Inc. Page 68 03/31/03
Receptor ModuleThe receptor spreadsheet module incorporates the receptor-specific parameters in addition to thetotal exposure time and fraction indoors. It uses these parameters to calculate the occupancyfactors (in exposure-years) used for the submersion and deposition external gamma pathwaymodules. It also is used calculates the volume of contaminated air inhaled by the receptor usedby the inhalation module and the amount of ingested �area� used by the indirect ingestionpathway module. For the submersion pathway, the exposure factor was based on the product ofthe default exposure duration (365 d), indoor fraction (0.5), and receptor fraction (1), divided by atime conversion factor (365 d/y), resulting in 0.5 exposure-years. These results are independentof the radionuclide.
Submersion ModuleThis module simply takes the output from the airflow module (concentration) and the receptormodule (exposure-years) to calculate the dose from the submersion external gamma pathwayusing the DCF for submersion based on FGR 12.
Table 2-21 provides a comparison of the submersion dose calculated with RESRAD-BUILD andverified by the spreadsheet modules. The only discrepancy is the calculated value for the tritiumarea source. The reason for this difference is that RESRAD-BUILD uses a DCF of zero ofsubmersion in tritium, whereas the submersion DCF in FGR 12 is a non-zero value, which likelytakes into account dermal absorption (see also Section 2.3.5). RESRAD-BUILD takes intoaccount dermal absorption of tritium by increasing the inhalation dose by 50%. The calculatedsubmersion dose for all other radionuclides and source types was an exact match with the resultsreported in the RESRAD-BUILD output files.
Table 2-21. Verification of Submersion Pathway Results
Dose (mrem) RatioRadionuclide RESRAD-BUILD SS Verification RB/SSVH-3 Area 0.00E+00 5.19E-14 0.00CO-60 Area 1.83E-08 1.83E-08 1.00CO-60 Volume 7.69E-09 7.70E-09 1.00SR-90 Area 3.21E-11 3.21E-11 1.00SR-90 Volume 1.35E-11 1.35E-11 1.00RA-226 Area 1.48E-08 1.48E-08 1.00RA-226 Volume 6.24E-09 6.22E-09 1.00CF-252 Area 6.53E-13 6.52E-13 1.00CF-252 Volume 2.75E-13 2.74E-13 1.00
2.3.3 Deposition External Gamma PathwayThe user�s manual does provide an explanation of how the RESRAD-BUILD code calculates theexternal gamma dose from deposited radionuclides. Tests were conducted on the sameradionuclides and source types described in Section 2.3.2. This pathway depends on the sourceinjection rate and indoor air concentrations, both of which were verified in Section 2.3.2, as wellas the same receptor exposure time derived for the submersion external gamma pathway. In

Verification of RESRAD-BUILD, Version 3.1
Tetra Tech NUS, Inc. Page 69 03/31/03
addition to these two modules, the spreadsheet verification included a deposition module and agroundshine module, which are discussed below.
Deposition ModuleThis spreadsheet module was developed to calculate the concentration on the room floor based onthe concentration in the room air generated by the airflow module. The calculation of depositedactivity is done by multiplying the deposition velocity by the room air concentration, taking intoaccount resuspension by dividing by the sum of the radionuclide decay and resuspension rates.The resulting output is then used in the calculation of external gamma from an area source, aswell as for the ingestion of deposited material (see Section 2.3.7).
Table 2-22 shows the room floor concentrations calculated using the deposition module. It wasnot possible to verify these intermediate results, as these are not available in any of the RESRAD-BUILD output files.
Table 2-22. Floor Concentrations Calculated by the Deposition Module
RadionuclideConcentration
pCi/m2
H-3 Area 5.35E-02CO-60 Area 4.93E-02CO-60 Volume 2.07E-02SR-90 Area 5.55E-02SR-90 Volume 2.33E-02RA-226 Area 5.70E-02RA-226 Volume 2.40E-02CF-252 Area 4.34E-02CF-252 Volume 1.82E-02
Groundshine ModuleThe groundshine module takes the floor concentration calculated by the deposition module andmultiplies it by the exposure time from the receptor module. This product is then multiplied bythe appropriate surface source DCF derived from FGR12. The results are presented inTable 2-23, where they are compared with the results calculated using RESRAD-BUILD.
With the exception of the tritium area source, all the other sources result in lower doses calculatedby RESRAD-BUILD. These ratios are similar for different source types, but are not the same fordifferent radionuclides, indicating that the differences are likely to be associated with parametersunique to each radionuclide. This could be the surface source DCF, an undocumented area factorcalculation, or some other radionuclide-specific parameter used to by RESRAD-BUILD tocalculate the external dose from deposited surface contamination. Appendix F of the user�smanual does not provide any information on the possible use of an area factor for calculatingexternal doses from deposited radionuclides.
It is unlikely that the problem lies with the calculation of the deposited floor concentrations, asthese same concentrations were used to successfully verify the indirect ingestion pathway (seeSection 2.3.7).
Table 2-23. Verification of Deposition External Gamma Pathway Results

Verification of RESRAD-BUILD, Version 3.1
Tetra Tech NUS, Inc. Page 70 03/31/03
Dose (mrem) RatioRadionuclide RESRAD-BUILD SS Verification RB/SSVH-3 Area 0.00E+00 0.00E+00 N/ACO-60 Area 1.60E-06 6.77E-06 0.24CO-60 Volume 6.74E-07 2.85E-06 0.24SR-90 Area 1.34E-08 1.82E-08 0.74SR-90 Volume 5.64E-09 7.65E-09 0.74RA-226 Area 1.32E-06 5.54E-06 0.24RA-226 Volume 5.55E-07 2.33E-06 0.24CF-252 Area 4.59E-10 1.83E-09 0.25CF-252 Volume 1.93E-10 7.70E-10 0.25
2.3.4 Radon Inhalation PathwayAppendix C of the user�s manual provides a description of how the RESRAD-BUILD codecalculates the inhalation dose from radon. The models for the release and inhalation of radon andits progeny differ significantly from the models for the release and inhalation of particulateradionuclides. This pathway depends on the indoor air concentrations and the receptor exposuretime, both of which were verified in Section 2.3.2. Therefore, only the radon source injection andinhalation modules are verified separately in this section. In addition, the multi-region radonvolume source injection module was verified for two, three, four, and five regions.
Source Injection Module (Radon Source)
Section C.1 in the user�s manual provides the equations used to calculate injection (also called theflux) of radon from an indoor source. In the case of point, line, or area sources, the calculation ofthe radon injection rate is a straightforward application of Equation C.1 in the user�s manual.This calculation was verified for an area source using the default parameters. The release rates of4.49E-02 for Rn-220 and 7.55E-06 pCi/s for Rn-222 calculated by the spreadsheet modelmatched the results reported in the RESRAD-BUILD DIAG.OUT file, indicating that the code iscorrectly implementing the injection module for the radon area source. This verification extendsin a similar manner to the point and line source models, since both implement the same equationfor the injection rate as the area source.
Equations C.2 through C.17 of the user�s manual are used to calculate the multi-region radoninjection module for a volume source containing a radon parent within one of the regions. Theapproach to verifying the multi-region radon module was to first verify the calculations for asingle-region volume source by implementing Equations C.2 through C.17 in a spreadsheet. Themulti-region source was then verified by determining whether a multi-region source could beconstructed to yield the same results as the single-region source.
Table 2-24 shows the results of the single-region calculations for Rn-220 and Rn-222 usingdefault parameter values. In addition, all parameters affecting only the radon injection rate, suchas source thickness, area, diffusion, porosity, and emanation fraction, were reduced by 10% totest whether small deviations from the default parameters would result in correct calculations ofthe radon flux. As can bee seen in Table 2-24, the results of the spreadsheet calculations matchthe results calculated and reported the RESRAD-BUILD DIAG.OUT file, indicating that the codeis correctly implementing the injection module for the single-region radon volume source.

Verification of RESRAD-BUILD, Version 3.1
Tetra Tech NUS, Inc. Page 71 03/31/03
Table 2-24. Verification of Single-Region Radon Volume Source Injection ModuleInjection Rate (pCi/s) Ratio
Radionuclide RESRAD-BUILD SS Verification RB/ SSVDefaults
Rn-222 5.44E+00 5.44E+00 1.00Rn-220 1.65E+04 1.65E+04 1.00
90% of DefaultsRn-222 3.21E+00 3.21E+00 1.00Rn-220 1.01E+04 1.01E+04 1.00
Table 2-25 shows the results for the multi-region model compared with the single-region model.In this case, only Rn-220 was used due to the much shorter half-life, which in turn affects theamount of radon generated that is able to diffuse out of the source. The total source dimensionsand all other parameters are the same as the single-region source, but the thickness of each regionis calculated by taking the single-region source thickness and dividing it by the number ofregions. For each multi-region volume, the source was alternately placed in each one of theregions, and the injection rate was calculated for each case. The injection rates for each multi-region volume source were then summed to obtain the total injection rate.
Table 2-25. Verification of Multi-Region Radon Volume Source Injection ModuleSelected Number of Regions in Source
Region 1 2 3 4 5Region Thickness (cm) 15 7.5 5 3.725 3Injection Rate 1 (pCi/s) 1.65E+04 8.23E+03 6.51E+03 5.41E+03 4.67E+03Injection Rate 2 (pCi/s) N/A 8.23E+03 3.45E+03 2.81E+03 2.57E+03Injection Rate 3 (pCi/s) N/A N/A 6.51E+03 2.81E+03 1.99E+03Injection Rate 4 (pCi/s) N/A N/A N/A 5.41E+03 2.57E+03Injection Rate 5 (pCi/s) N/A N/A N/A N/A 4.67E+03Total Injection Rate(pCi/s) 1.65E+04 1.65E+04 1.65E+04 1.64E+04 1.65E+04
The total injection rates for all of the multi-region models are effectively identical, and theintermediate results show how the contributions from each region change as a function of thesource location within each volume. Since the totals match the result from the single-regionsource, using default values for Rn-220, the multi-region model is validated. As expected, theflux profile in each of these volume sources exhibits symmetry about the volume mid-plane, withthe regions closest to the exposed surfaces contributing more to the total flux than the centermostregions.
Inhalation Module (Radon)The inhalation module takes the radon air concentration calculated by the airflow module andestimates the activity of radon progeny, expressed in units of working levels. The estimation ofradon progeny concentrations are described in Section C.2 and C.3 of the user�s manual.
Perhaps counter-intuitively, inhalation rates are not used to calculate radon inhalation doses.Rather, the radon inhalation model calculates dose from the receptor time parameters, coupled

Verification of RESRAD-BUILD, Version 3.1
Tetra Tech NUS, Inc. Page 72 03/31/03
with factors used to convert from concentration to dose. This methodology is described inSections C.4 and C.5 of the user�s manual.
Equations C.18 through C.39 in Appendix C of the user�s manual were implemented in aspreadsheet model for both Rn-220 and Rn-222. In testing the radon inhalation model, thedefault parameter values were applied, except for the number of points for time integration, whichwas changed from 17 to 1 in order to simplify the calculations. However, the default values fortwo parameters, the attachment rate and the plate-out rate, which are required to calculateconcentrations of radon progeny in two of the three possible states, are not listed in Table C.1 orelsewhere in the user�s manual. In addition, these parameters are not directly accessible from theuser interface. The values of the attachment rate and the plate-out rate used by RESRAD-BUILDwere taken from Figure 5.3 of the internal RESRAD-BUILD verification report (Kamboj et al.2001). In that figure, both values are listed as 108/h, equivalent to 0.03/s. This value is acceptablesince it falls within the upper end of the range of values provided in Table C.1 of the user�smanual.
Table 2-26 shows the results of this verification by comparing the concentrations calculated byRESRAD-BUILD and the spreadsheet model for Rn-220, Rn-222, and progeny, the totalconcentrations of progeny expressed as working levels, and the inhalation doses. Theconcentrations (pC/m3 and WL) calculated by RESRAD-BUILD are reported in the DIAG.OUTfile. The only discrepancy between the spreadsheet implementation of the equations in the user�smanual and the results reported by RESRAD-BUILD was the calculation of the Rn-220 progenyWL and dose. The source of this discrepancy was determined to be an error in Equation C-33 ofthe user�s manual, where the correct coefficient for Bi-212 should be 1.17 × 10⁻⁵, not 1.17 × 10⁻⁴.After this correction, the ratio between RESRAD-BUILD and the spreadsheet model is one.
Table 2-26. Verification of the Radon Inhalation Module
Radionuclide RESRAD-BUILD SS VerificationRatio
RB/SSVConcentrations (pCi/m3 or WL)
Rn-220 1.44E+04 1.44E+04 1.00Po-216 1.43E+04 1.44E+04 1.00Pb-212 3.57E+01 3.58E+01 1.00Bi-212 1.47E+00 1.47E+00 1.00Rn-220 Progeny WL 4.42E-03 4.58E-03 0.96Rn-222 2.70E+02 2.69E+02 1.00Po-218 7.57E+01 7.57E+01 1.00Pb-214 6.87E+00 6.87E+00 1.00Bi-214 8.03E-01 8.02E-01 1.00Rn-222 Progeny WL 1.16E-04 1.16E-04 1.00
Radon Inhalation Dose (mrem)Rn-220 1.67E+01 1.74E+01 0.96Rn-222 2.27E+00 2.27E+00 1.00
This pathway was verified with this limited set of input parameters. Verification of the model atextreme input parameters was not possible due to issues identified in Section 2.2 and detailed inSection 4.3.Other Inhalation Pathway

Verification of RESRAD-BUILD, Version 3.1
Tetra Tech NUS, Inc. Page 73 03/31/03
Appendix D of the user�s manual provides a description of how the RESRAD-BUILD codecalculates the inhalation dose from airborne radionuclides. Equation D.3 of the user�s manualforms the basis for the verification of this pathway. Tests were conducted on the sameradionuclides and source types described in Section 2.3.2. The particulate and tritium inhalationpathways depend on the source injection rate and indoor air concentrations, both of which wereverified in Section 2.3.2. The source injection module for the tritium volume source model,which differs significantly from the particulate source injection module, is verified below. Inaddition, the spreadsheet verification for the inhalation pathway makes use of the receptor moduleand the inhalation module, which are also discussed below.
Source Injection Module (Tritiated Volume Source)
Section G.4 in Appendix G of the user�s manual contains a detailed description of the tritiumvolume source transport model. Equations G.2 through G.13 in Appendix G were implementedin a spreadsheet to calculate the fraction of the tritium in a volume source that would be releasedto the room air. These calculations were performed using the default parameter values for thetritium volume source, but the exposure duration was made to range from 10 days to 160 days.The reason for choosing this range was due to the calculated time it would take to evaporate theentire tritium source, which was found to be just under 153 days when using the defaultparameters.
Table 2-27 lists the values for the fraction of source remaining as a function of time since therelease starts, as calculated by the spreadsheet model. This time was also entered as the exposureduration in RESRAD; the dose to a receptor based on this exposure duration was calculated andpresented in this table. The maximum dose corresponds to an exposure duration of 153 days, asexpected from the spreadsheet model that implemented the equations in Appendix G of the user�smanual. This maximum dose does not increase with exposure durations exceeding 153 days, dueto the depletion of the tritium volume source.
The dose at times less than 153 days was divided by the maximum dose to estimate the fraction ofthe original source removed during that time. This fraction was then compared to the sourcefraction calculated using the spreadsheet model. The fact that the ratios are very close to unityverifies that the RESRAD-BUILD tritium volume source model is correctly implementing theequations in Appendix G of the user�s manual.
Table 2-27. Verification of Tritium Source Injection Module
ExposureDuration(days)
FractionEvaporated
(SS Verification)RESRAD-BUILD
Dose (mrem)Fraction ofMax. Dose
Ratio ofFractionsRB/SS
10 0.256 2.50E-03 0.259 1.0150 0.573 5.58E-03 0.578 1.01100 0.810 7.87E-03 0.815 1.00150 0.992 9.61E-03 0.995 1.00151 0.996 9.65E-03 0.999 1.00152 0.999 9.66E-03 1.000 1.00153 1.002 9.66E-03 1.000 n/a160 1.025 9.66E-03 1.000 n/a
Receptor Module

Verification of RESRAD-BUILD, Version 3.1
Tetra Tech NUS, Inc. Page 74 03/31/03
The receptor spreadsheet module incorporates the receptor-specific parameters in addition to thetotal exposure time and fraction indoors. Another receptor parameter that is used in thecalculations of inhalation dose is the breathing rate. The module uses these parameters tocalculate the volume of inhaled air during the time spent at the receptor locations. For theinhalation pathway, the total inhaled volume of air was based on the product of the defaultexposure duration (365 d), indoor fraction (0.5), receptor fraction (1), and breathing rate (18m3/d)resulting in an inhaled volume of 3290 m3. These results are independent of the radionuclide.
Inhalation ModuleThe inhalation module takes the air concentration calculated by the airflow module and multipliesit by the inhaled volume from the receptor module. This product is then multiplied by theappropriate inhalation DCF derived from FGR11. The results are presented in Table 2-28, wherethey are compared with the results calculated using RESRAD-BUILD.
Table 2-28. Verification of Inhalation Pathway Results
Dose (mrem) RatioRadionuclide RESRAD-BUILD SS Verification RB/SSVH-3 Area 8.46E-10 5.64E-10 1.50CO-60 Area 1.79E-06 1.78E-06 1.00CO-60 Volume 7.51E-07 7.50E-07 1.00SR-90 Area 1.20E-05 1.19E-05 1.01SR-90 Volume 5.03E-06 5.02E-06 1.00RA-226 Area 8.06E-05 8.06E-05 1.00RA-226 Volume 3.39E-05 3.39E-05 1.00CF-252 Area 1.14E-03 1.14E-03 1.00CF-252 Volume 4.78E-04 4.78E-04 1.00
With the exception of the tritium area source, the results of the verification calculations andRESRAD-BUILD were perfect matches for all radionuclides and source types. As stated inAppendix G of the user�s manual in the case of tritium, the code is increasing the inhalation doseby 50% to account for dermal absorption.
2.3.6 Direct Ingestion PathwaySection E.1 of Appendix E of the user�s manual provides a description of how the RESRAD-BUILD code calculates the dose from the ingestion of radionuclides directly from a source.Equation E.1 of the user�s manual forms the basis for the verification of this pathway. Tests wereconducted on the same radionuclides and source types described in Section 2.3.2. RESRAD-BUILD sums the contributions from the direct and indirect ingestion pathways. Therefore, theindirect ingestion rate was set to zero so that the summed contribution of direct and indirectingestion doses would only contain the direct component. The direct ingestion pathway does notdepend on the source injection rate and indoor air concentrations, since the receptor must be indirect contact with the source. However, verification of the direct ingestion dose requires someof the source parameters specified in the source injection module, which is described inSection 2.3.2. In addition to this module, verification of the direct ingestion pathway makes useof the ingestion module, which is described below.

Verification of RESRAD-BUILD, Version 3.1
Tetra Tech NUS, Inc. Page 75 03/31/03
Source Injection ModuleTwo source types, area and volume, and their respective ingestion rates, were set up in the sourceinjection module using the RESRAD-BUILD defaults. However, the default direct ingestionrates were changed from zero to 0.01 g/h (this corresponds roughly to 100 mg/day) for thevolume sources and to 0.0001/h for the area sources. The source injection module is then used tocalculate the total activity. In the case of an non-volume source, the amount available foringestion also depends on the removable fraction for that source. There are no such limitation fora volume source, all of which is available for ingestion even if the erosion rate of the source is setto zero.
Ingestion ModuleThe ingestion module consists of three sections: one used to calculate direct ingestion, the secondto calculate indirect ingestion, and the third to sum the dose contributions from these twopathways. The section of the ingestion module used to calculate the dose from the directingestion pathway receives input from the source injection module in the form of ingestion rate,activity/concentration, and the removable fraction (non-volume sources only). It also receives thesame input from the receptor module (exposure-years) that was used for the submersion anddeposition external gamma pathways. The dose is obtained from the product of the sourceinventory (for area source) or concentration (for volume source), the applicable direct ingestionrate, the exposure years, and the removable fraction (set to 1 for a volume source). The resultingactivity ingested is then multiplied by the appropriate ingestion DCF derived from FGR11 toobtain the dose. The results are presented in Table 2-29, where they are compared with theresults calculated using RESRAD-BUILD.
Table 2-29. Verification of Direct Ingestion Pathway Results
Dose (mrem) RatioRadionuclide RESRAD-BUILD SS Verification RB/SSVH-3 Area 5.05E-07 5.05E-07 1.00CO-60 Area 2.12E-04 2.12E-04 1.00CO-60 Volume 1.18E-03 1.18E-03 1.00SR-90 Area 1.21E-03 1.21E-03 1.00SR-90 Volume 6.70E-03 6.71E-03 1.00RA-226 Area 1.05E-02 1.05E-02 1.00RA-226 Volume 5.83E-02 5.81E-02 1.00CF-252 Area 8.51E-03 8.55E-03 1.00CF-252 Volume 4.73E-02 4.75E-02 1.00
In all cases, the results of the verification calculations and RESRAD-BUILD were perfectmatches for all radionuclides and source types. Additional runs were made to support theverification of the uncertainty module using the direct ingestion pathway. These tests aredescribed in Section 3.3. The direct ingestion pathway is therefore considered fully verified.
2.3.7 Indirect Ingestion PathwaySection E.2 of Appendix E of the user�s manual provides a description of how the RESRAD-BUILD code calculates the dose from the ingestion of deposited radionuclides. Equation E.3 of

Verification of RESRAD-BUILD, Version 3.1
Tetra Tech NUS, Inc. Page 76 03/31/03
the user�s manual forms the basis for the verification of this pathway. Tests were conducted onthe same radionuclides and source types described in Section 2.3.2. The direct ingestion rate wasreset to the default of zero so that the summed contribution of direct and indirect ingestion doseswould only contain the indirect component. As with other pathways that originate with therelease of particulates to room air, the indirect ingestion pathway depends on the source injectionrate and indoor air concentrations, both of which were verified in Section 2.3.2. This pathwayalso requires the floor surface concentrations calculated with the deposition module, which isdescribed in Section 2.3.3. In addition to these three modules, the spreadsheet verification for theindirect ingestion pathway makes use of variations to the receptor module and the ingestionmodule, which are discussed below.
Receptor ModuleThe receptor spreadsheet module incorporates the receptor-specific parameters in addition to thetotal exposure time and fraction indoors. Another receptor parameter that is used in thecalculations of inhalation dose is the breathing rate. The module uses these parameters tocalculate the volume of inhaled air during the time spent at the receptor locations. For theinhalation pathway, the total inhaled volume of air was based on the product of the defaultexposure duration (365 d), indoor fraction (0.5), receptor fraction (1), indirect ingestion rate(0.0001/h), and time conversion factor (24 h/d) resulting in an ingested �area equivalent� of0.438 m2. These results are independent of the radionuclide.
Ingestion ModuleOne section of the ingestion module is used to calculate the dose from the indirect ingestionpathway. The dose is obtained from the product of the floor concentration (see Table 2-22), theingested area equivalent calculated by the receptor module, and the appropriate ingestion DCFderived from FGR11. The results are presented in Table 2-30, where they are compared with theresults calculated using RESRAD-BUILD.
Table 2-30. Verification of Indirect Ingestion Pathway Results
Dose (mrem) RatioRadionuclide RESRAD-BUILD SS Verification RB/SSVH-3 Area 1.50E-09 1.50E-09 1.00CO-60 Area 5.81E-07 5.81E-07 1.00CO-60 Volume 2.44E-07 2.44E-07 1.00SR-90 Area 3.72E-06 3.72E-06 1.00SR-90 Volume 1.56E-06 1.57E-06 1.00RA-226 Area 3.32E-05 3.31E-05 1.00RA-226 Volume 1.40E-05 1.39E-05 1.01CF-252 Area 2.05E-05 2.06E-05 1.00CF-252 Volume 8.62E-06 8.66E-06 1.00
In all cases, the results of the verification calculations and RESRAD-BUILD were perfectmatches for all radionuclides and source types. The indirect ingestion pathway uses the samefloor concentrations as the deposition external gamma pathway. Therefore, verification of thispathway also verifies that the floor concentrations in RESRAD-BUILD are being calculatedcorrectly and that these are not the source of the significant errors found in verifying thedeposition external gamma pathway.

Verification of RESRAD-BUILD, Version 3.1
Tetra Tech NUS, Inc. Page 77 03/31/03
Time Dependency VerificationThe RESRAD-BUILD code allows the user to enter multiple time steps to calculate the doses attimes beyond time zero. In addition, the code also allows the user to enter different values for thetime integration parameters applied to the exposure duration. It is important to verify that thecode is correctly implementing radioactive decay and ingrowth models. In some cases,mechanical erosion or removal also contributes to the reduction of the radioactive source overtime. Verification of the time-dependent calculations was accomplished in three separate steps.
The first step addressed the ability of the code to calculate radioactive decay and ingrowth. A testwas run to compare the results obtained by a standard radioactive decay and ingrowth calculatoravailable on the Internet (WISE 2000) and a RESRAD-BUILD source containing one curie(3.7E10 Bq) each of Cf-252, Cm-243, Am-243, Pu-242, and Pu-241. Erosion and removal wereset to zero to focus only on radioactive decay and ingrowth. Decay and ingrowth were calculatedover 100 years. The results for each of these radionuclide series were within a 1% error range,probably due to round-off error, except for the Cf-252 series. Here the results calculated after U-236 differed due to an incorrect half-life value for U-236 in the decay calculator database, notRESRAD-BUILD. This test covered the majority of radionuclides in RESRAD-BUILD that arepart of large decay chains, and therefore serves to validate the process by which RESRAD-BUILD calculates the decay and ingrowth of radionuclides in a source.
A second test was done to ensure that all radionuclides in the RESRAD-BUILD database decayedcorrectly according to the half-lives listed in the database files. For each radionuclide, theexposure times were set to the half-life of each radionuclide whenever such half-life was less thanthe RESRAD-BUILD limit of 100,000 years. At an exposure time of one half-life, theconcentration is expected to be one half of the original value. If the half-life was greater than theRESRAD-BUILD time limit, the decay up to 100,000 years was calculated and compared to thecorresponding decay using the standard decay equation and the appropriate half-life for theselonger lived radionuclides. In all cases, the RESRAD-BUILD results were found to be in perfectagreement with the expected results.
A third test was done to assess the accuracy of the concentration averaging routine described inAppendix H of the user�s manual. This routine is used by RESRAD-BUILD to calculate theintegrated doses when the user selects more than one integration point; the default is set to 257points. Five radionuclides were selected for this test, based on increasing half-live values: Au-195, Co-60, Bi-207, Am-241, and C-14. A volume and an area source were set up for eachradionuclide, and the exposure duration was set to equal the half-life. While this is not realisticfor Am-241 and C-14, the purpose of this exercise was to determine the mathematicalimplementation of this routine. The volume source was made sufficiently thick so that therewould be no significant erosion over the exposure duration. In addition, the removal fraction forthe area sources was set to 1, but the lifetime was set to twice the half-life. Thus, at the end ofeach radionuclide�s exposure duration, there would be one half the source left due to radioactivedecay. In the case of the area source, another half would be gone due to the removal function.The doses from two pathways were reviewed: the direct external gamma pathway and theinhalation pathway, since different mechanisms affect how much of the source contributes to thereceptor dose.
A spreadsheet formula was set up to test the number of integration points. For the 1-pointintegration, there is no actual integration, but the doses are based on the concentrations present inthe source at time zero. A second time step (set at the time of each radionuclide�s half-life) was

Verification of RESRAD-BUILD, Version 3.1
Tetra Tech NUS, Inc. Page 78 03/31/03
selected to verify that the source had indeed decayed and been removed correctly. The dose fromthe second time step was also used to verify that RESRAD-BUILD correctly averaged theconcentration when using the 2-step integration formula. For the 3-, 5-, and 9-step integration,Simpson�s rule was implemented in the spreadsheet and was used to verify the correct integrationof the RESRAD-BUILD code over each exposure duration. It was found that the code needed nomore than 9 time steps to achieve convergence, even when a separate test was done for Au-195over 7 half-lives. In all cases, the RESRAD-BUILD results exactly matched the expected resultscalculated by the spreadsheet formulas for both external gamma and inhalation pathways.
These three tests positively verify that RESRAD-BUILD is correctly implementing the time-dependent calculations.
2.5 Multiple-Room Model VerificationSection 2.2.3 of this report describes the verification of parameters used by RESRAD-BUILD indefining one-, two-, or three-room models used in the indoor air flow calculations. Although theone-room air flow model was verified in Section 2.3, some problems were encountered withcertain parameter values that prevented a full verification of the two- and three-room models,including the inability to properly set some of the air flow parameter values to zero.
However, it was still possible to perform a limited verification of the full indoor air flow modelsby using non-zero air flow parameter values. The strategy used to verify the two- and three-room air flow models was to create a building model with two or three rooms that yieldedequivalent results to those already verified for the one room model. This was accomplished bysetting up a two- or three-room model so that it would have the same air flow properties as theone room model as follows:
• In the two-room model, the floor area in each room was reduced to one half of the floorarea in the one-room model; in the three-room model, the floor area in each room wasreduced by one third. In this way, the building�s total floor area was equivalent to thefloor area of the one-room model.
• The air flows between each room and the outside air were reduced by one half and onethird for the two- and three-room models, respectively. This resulted in an equivalentbuilding air exchange rate for the one-, two-, and three-room models.
• The net air flows between rooms (in the two- and three-room models) were set to zero,but the magnitude of the air flows in the positive and negative directions were increasedeach time by a factor of ten. Setting increasingly higher inter-room air exchange ratesrelative to the air exchange rate with outdoor air results in a better approximation to theperfect mixing that is assumed to occur within each room.
Table 2-31 provides a comparison of the air concentrations calculated by RESRAD-BUILD foreach room, starting with the default parameter values for the one-room model and extending theseparameters to equivalent two- and three-room models. The RESRAD-BUILD results for airconcentrations in each room are reported in the DIAG.OUT file following each run.
It is apparent from the results presented in Table 2-31 that RESRAD-BUILD correctlyimplements the multiple-room models for cases in which the air-flow rates are non-zero. Theaverage concentrations in the two- and three-room models are equal to the concentration in theone-room model, as expected, for all indoor air flow rates. In addition, as the air flow ratebetween rooms is increased, the concentration in all rooms tends to approach, as expected, the

Verification of RESRAD-BUILD, Version 3.1
Tetra Tech NUS, Inc. Page 79 03/31/03
concentration in the one-room model. Similar observations would result by progressivelyreducing the outdoor air flow rate while holding constant the air flow between rooms.
Table 2-31. Verification of Multiple-Room Model Results
Outdoor Air Flow (m3/r)
Model
FloorArea(m2)
RoomHeight
(m) Room 1 Room 2 Room 3
Bldg.Exch.
Rate (/h)One Room 36 2.5 72 N/A N/A 0.8Two Rooms 18 2.5 36 36 N/A 0.8Three Rooms 12 2.5 24 24 24 0.8
Indoor Air Flow(m3/h) Concentration in Air (pC/m3)
ModelRoom 1-Room 2
Room 2-Room 3 Room 1 Room 2 Room 3 Average
Relative toOne
RoomOne Room
N/A N/A 1.04E-06 N/A N/A 1.04E-06 1.00
Two Rooms10 N/A 1.75E-06 3.40E-07 N/A 1.05E-06 1.00100 N/A 1.22E-06 8.66E-07 N/A 1.04E-06 1.00
1000 N/A 1.07E-06 1.02E-06 N/A 1.05E-06 1.00
Three Rooms10 10 2.44E-06 5.44E-07 1.45E-07 1.04E-06 1.00100 100 1.43E-06 9.57E-07 7.50E-07 1.05E-06 1.01
1000 1000 1.09E-06 1.04E-06 1.01E-06 1.05E-06 1.01
2.6 Multiple Pathways, Receptors, Sources, Times VerificationThe final step in verifying the deterministic RESRAD-BUILD calculations was to compile ascomprehensive a scenario as possible. By combining scenarios and results from previous stepsinto a single run, this verification task incorporated as many radionuclides, receptor locations,source types, and time steps as possible. The goal of this exercise was to verify that summationsover pathways, receptors and sources are properly executed by the code.
In practice, this task was accomplished by copying the individual values (bysource/receptor/pathway/radionuclide) generated in the RESRAD-BUILD output file. Thesewere then be tabulated and summed across receptors and pathways and compared to the summeddose contributions reported in the RESRAD-BUILD output report.
A test file was created, starting with the default, by following these steps:• Add 10 receptors (all located at the default coordinates)• Add 10 sources (all located at the default coordinates)• Add 8 times (3, 10, 30, 100, 300, 1000, 3000, and 10000 years)• Change the first three sources to point, line, and area, respectively

Verification of RESRAD-BUILD, Version 3.1
Tetra Tech NUS, Inc. Page 80 03/31/03
• Add 10 radionuclides to each of the first nine sources (a unit activity/concentration), goingdown the entire list of radionuclides and repeating as necessary once having reached the lastin the list of 67 radionuclides;
• Make the last source a tritium volume source• Set the number of rooms to 3• Set the room number for the first three sources and receptors to correspond to the source and
receptor number, and then start the sequence over again for each additional source/receptorpair (i.e., Source 1 and Receptor 1 in Room 1, Source 2 and Receptor 2 in Room 2, Source 3and Receptor 3 in Room 3, Source 4 and Receptor 4 in Room 1, etc.)
• Set the number of points for integration to 3 (done in an effort to speed up the calculations)
The code ran at a reasonable pace for the first evaluation until it appeared to stop progressingonce it started processing the 10th source. This was the single tritium volume source, and it tookmore than twice as long to process this source as the first nine sources combined, each of whichhad 10 radionuclides each. Subsequent evaluation times followed this same pattern.
As expected, this case took a very long time to run (over one hour on a Pentium III running at 700MHz), and yielded a very large output file (223 pages). The results were compiled and copiedonto a spreadsheet, focusing on the results tabulated in RESRAD-BUILD and labeled as:
1. Source Contributions to Receptor Doses (Receptor/Source Dose Matrix)2. Pathway Detail of Doses (Receptor/Pathway Dose Matrix - 10 tables by source for each time)3. Nuclide Detail of Doses (Nuclide/Receptor Dose Matrix - 10 tables by source for each time)4. Receptor Doses Received for the Exposure Duration (Receptor/Exposure Duration � 1 table)
The first set of tables was verified for all times, including time zero, whereas the next two sets oftables were verified for time zero and at 100 and 10,000 years. Item 4 is the last table inRESRAD-BUILD and represents a grand total summary over time and receptors that wascompared with the totals reported in the first set of tables.
In all cases, the ratios between the totals calculated and reported by RESRAD-BUILDcorresponded to the totals calculated independently by summing up the individual dosecomponents (by columns and rows) on the spreadsheet. Minor deviations from a ratio of 1.00were attributed to simple rounding errors.
In reviewing the cases at times beyond time zero, it was noted that RESRAD-BUILD does notconsistently implement the methodology for reporting zero doses in the Pathway and NuclideDetails tables. For example, at time 100 years, the tenth source (tritium volume source) isreported to result in a zero dose to all receptors, whereas at time 10,000 years this table is actuallyomitted from the output report without notice. Also, while many nuclides that were originallypresent (but have since decayed and contribute zero dose) are not even listed in some of theNuclide Details tables, in many cases a zero dose is in fact listed for a radionuclide even when itis zero for all receptors.
A unrelated problem that did not ultimately affect the ability to run this case was encounteredafter ten receptors and ten sources were entered and an attempt was made to view the ShieldingParameters table. After clicking on the �View Table� button, the code returned the followingerror message before crashing:
Run-time error �7�: Out of memory

Verification of RESRAD-BUILD, Version 3.1
Tetra Tech NUS, Inc. Page 81 03/31/03
3 Verification of Uncertainty Model
The RESRAD-BUILD uncertainty model was verified in three steps. The first step focused theresponse of the code to inputs made during the parameter verification phase. The second stepwas to verify that the input data sets produced by the Latin hypercube sampling (LHS) routinecorresponded to the specified statistical distributions. The third step verified the correctdistribution of output results following uncertainty simulations.
3.1 Verification of Parameter Inputs As noted in Section 2.2, many errors were found in attempting to verify the response of theuncertainty analysis module to different parameter input distributions. These responses aredescribed in the following sections, organized by the parameter groupings as listed in Appendix Jof the user�s manual.
The verification of the parameter input distributions is an extension of the parameter verificationfor the deterministic portion of the code, and the detailed results were documented on the InputParameter Verification Checklist forms generated for each parameter. Unless otherwise specifiedin each of the following sections, the settings for the sample specification were kept at thedefaults used by RESRAD-BUILD, namely Latin Hypercube method using a random seed of1000, with 100 observations and 3 repetitions, uncorrelated or correlated groupings, for a total of300 iterations. Where indicated (e.g., in Section 3.1.2), the number of observations was reducedfrom 100 to 10 in order to speed up some of the calculations. This also had the effect of verifyingthat it was possible to correctly change this parameter.
3.1.1 Time ParametersThe time parameters eligible for uncertainty analysis include TTIME and FTIN. A uniformdistribution was assigned to TTIME, since the code does not provide a default for that parameter.The default values for the continuous distribution were used for FTIN. In both cases, noproblems were encountered running the uncertainty analysis module under normal parameterranges. However, tests for out-of-bounds conditions resulted in errors.
In the case of TTIME, the code correctly rejects entries for a uniform distribution in which theMin and Max are equal or when the Min is greater than the Max (by using a pink background inthe input fields). However, the code does not reject a range of parameters in which 50% of thesampled values will yield incorrect results (values ranging from �1 to 1). After completing theruns for all 300 sampled values, the MC output reports the following doses at time zero:
Statistics of Dose (mrem) Summed over Radionuclide
Statistic CO-60 Minimum ******** Maximum 1.34E-02 Average ******** Std.Dev 7.79E-03

Verification of RESRAD-BUILD, Version 3.1
Tetra Tech NUS, Inc. Page 82 03/31/03
Percentile Distribution Table
Statistic CO-60 5% 0.00E+00 10% 0.00E+00 15% 0.00E+00 20% 0.00E+00 25% 0.00E+00 30% 0.00E+00 35% 0.00E+00 40% 0.00E+00 45% 0.00E+00 50% 2.80E-05 55% 1.35E-03 60% 2.84E-03 65% 4.12E-03 70% 5.43E-03 75% 6.75E-03 80% 8.11E-03 85% 9.45E-03 90% 1.08E-02 95% 1.22E-02 100% 1.34E-02
These results clearly indicate a problem with the range of input values from a uniformdistribution ranging from -1 to 1, but the code does not warn the user that half of the values areinvalid entries.
For the parameter FTIN, the extremes of �1 and 2 used to test the uniform distribution are outsidethe normal bounds of 0 to 1 and correspond to the extreme values used in the deterministic test.The code does not reject this range of parameters, but presents a mathematically correct result.After completing the runs for all 300 sampled values, the MC output reports the following dosesat time zero:
Statistics of Dose (mrem) Summed over Radionuclide
Statistic CO-60 Minimum ******** Maximum 1.84E+01 Average 4.61E+00 Std.Dev 7.99E+00

Verification of RESRAD-BUILD, Version 3.1
Tetra Tech NUS, Inc. Page 83 03/31/03
Percentile Distribution Table
Statistic CO-60 5% 0.00E+00 10% 0.00E+00 15% 0.00E+00 20% 0.00E+00 25% 0.00E+00 30% 0.00E+00 35% 5.01E-01 40% 1.91E+00 45% 3.29E+00 50% 4.64E+00 55% 6.01E+00 60% 7.53E+00 65% 8.84E+00 70% 1.02E+01 75% 1.15E+01 80% 1.29E+01 85% 1.43E+01 90% 1.57E+01 95% 1.71E+01 100% 1.84E+01
These results clearly indicate a problem with the range of input values from a uniformdistribution ranging from -1 to 2 but again the code does not warn the user that two thirds of thevalues are invalid entries.
3.1.2 Building ParametersThe building parameters that are eligible for uncertainty analysis include UD, DKSUS, H, AREA,and LAMBDAT. In all cases, no problems were encountered running the uncertainty analysismodule under normal parameter ranges and default distributions. However, several errors wereencountered when changing the distribution ranges to go out of the normal parameter rangesand/or selecting an alternative distribution.
Out of bounds tests were not possible with the default loguniform distributions assigned to UDand DKSUS or the truncated lognormal-n distribution assigned to LAMBDAT because this typeof distribution does not allow the input of negative numbers, and there are no upper limitsimposed on these three parameters. Negative numbers, zero, or a minimum value greater than amaximum value, are not accepted and are highlighted in red to warn the user. This is the correctresponse by the code to entries for a loguniform distribution. However, the use of a non-defaultdistribution, such as uniform distribution, allows the acceptance of negative input values. Theseresulted in spurious results similar to those reported in Section 3.1.1.
In the case of LAMBDAT, a truncated lognormal-n distribution was tested with: Mu = +/- 1E4;Sigma = -1, 0, or 1E4; LQ = -1, 0; UQ = 1; LQ>UQ. A large negative or positive mean (Mu) ofthe underlying normal is accepted (as is a large positive value of Sigma), and the code willexecute the uncertainty module. However, the uncertainty results are meaningless. A large value

Verification of RESRAD-BUILD, Version 3.1
Tetra Tech NUS, Inc. Page 84 03/31/03
of Mu and/or Sigma cause an error to be reported in the LHS.ERR file, but there is no warning tothe user of such error. Entering any of the other values above for Sigma, LQ and UQ is notaccepted and the incorrect inputs are highlighted in red to warn the user. This is the correctresponse by the code.
The default distribution for the two remaining parameters, H and AREA, is triangular. Noproblems were encountered running the default cases.
For H, a series of out-of-bounds test was made using the triangular distribution with the followingparameter values: Min = -2.5, Mode = 0, Max = 2.5; Min>Max; Mode>Max; Mode<Min. Thecode accepts the inappropriate negative/zero values in the input parameter range and appears torun the uncertainty module until reaching the final iteration. At that point, the code crashes withthe following message:
Run-time error '55': File already open
It was not possible to determine which file was open.Attempting to enter a Min>Max, Mode>Max, and/or Mode<Min is not accepted by the code andthe incorrect inputs are highlighted in red to warn the user. This is the correct response by thecode.
For AREA, the same series of out-of-bounds tests was performed, but this time the followingparameter values were used: Min = -36, Mode = 0, Max = 36. This resulted in the same responseas was found with H, indicating that this is problem common to these two parameters.
One more issue was uncovered that is not addressed in the user�s manual. Selecting a value of 2or 3 for NROOM appears to disable the uncertainty module for H and/or AREA. However, if theuser had previously selected uncertainty analysis for the height of Room 1 in the 1-room model,this is retained in the 2- or 3-room models. While the code appears to excecute the uncertaintyanalysis on the Room 1 height correctly in the 2- and 3-room models, it may not be apparent tothe user that only the Room 1 height is subject to the uncertainty analysis. The solution to this isto enable uncertainty analysis of this parameter in the 2- and 3-room model independently of theRoom 1 parameter values.
3.1.3 Receptor ParametersOnly two receptor parameters, BRTRATE and INGE2, are eligible for uncertainty analysis,although it is recommended that this feature be extended to the DX and TWGHT parameters. Forboth eligible parameters, no problems were encountered running the uncertainty analysis moduleunder the default case with normal parameter ranges and default distributions. However, severalerrors were encountered when changing the distribution ranges to go out of the normal parameterranges and/or selecting an alternative distribution.
In the case of BRTRATE, the default triangular distribution range was change to: Min = -1, Mode= 0, Max = 1. The code accepts the inappropriate negative values in the input parameter range.After running 10 observations and 3 repetitions, the minimum and average inhalation doses werereported as "********" and all inhalation doses up to the 50th percentile are reported as zero. Asexpected from the deterministic run, no variation in the radon inhalation dose is reported, despitethe inclusion of a Ra-226 volume source.

Verification of RESRAD-BUILD, Version 3.1
Tetra Tech NUS, Inc. Page 85 03/31/03
In the case of INGE2, the default loguniform distribution did not allow testing of out-of-boundvalues. However, replacing this distribution with a uniform distribution, and setting the minimumto a negative number, results in spurious results similar to those previously described for theBRTRATE parameter.
With both parameters, there is a problem in the way the uncertainty analysis module handles theaddition and removal of receptors. To illustrate the problem, the following test sequence wasfollowed for BRTRATE:
• Select uncertainty analysis for Receptor 1 breathing rate• Add a receptor• Select uncertainty analysis for Receptor 2 breathing rate• Click on Receptor 1 and remove, leaving only Receptor 2• View "Uncertainty Analysis Input Summary" window
When one of two receptors is removed (in this case, Receptor 1), both Receptor 1 and 2 stillappear to be set up for uncertainty analysis. The code apparently does not automatically removethe selected receptor breathing rate from the uncertainty input screen, even though that receptor(and all associated receptor parameters) has been removed from the deterministic input screen. Infact, the code runs the uncertainty module and reports the input parameters for both Receptor 1and 2, but calculates the uncertainty statistics for the receptor that was removed in thedeterministic run. That is, the distribution/parameters originally assigned to Receptor 1, whichwas subsequently removed, are used to calculate the uncertainty analysis for the remainingreceptor - Receptor 2. The same observations apply to the INGE2 parameter.
3.1.4 Source ParametersSeveral source parameters, including SAREA, AIRFR, INGE1, RMVFR, RF0, RRF, THICK0,DENSI0, EROS0, POROS0, EFDIF0, and EMANA0 are eligible for uncertainty analysis. Inaddition, it is recommended that SX and RNUCACT be made eligible for uncertainty analysis infuture versions of the code.
For eligible parameters, no problems were encountered running the uncertainty analysis moduleunder the default case with normal parameter ranges and default distributions. However, severalerrors were encountered when changing the distribution ranges to go out of the normal parameterranges and/or selecting an alternative distribution.
In the case of SAREA, no default distribution is assigned, so a test was made with the defaultcase using a uniform distribution and the following bounds: with Min = -36, Max = 36. Thenegative minimum bound appears to be accepted in the uncertainty module. However, nouncertainty output is generated, and the uncertainty run is interrupted with the following errormessage:
Cannot Open Error file "F77L3.EER", error # 94
A similar problem is encountered with the parameter EFDIF0.

Verification of RESRAD-BUILD, Version 3.1
Tetra Tech NUS, Inc. Page 86 03/31/03
In the case of AIRFR, the default distribution is triangular, with: Min = 0.000001, Mode = 0.07,Max = 1. There is no good reason why the minimum default air release fraction cannot be set tozero. Since this is not a logarithmic distribution, and the maximum default is set to one, 0.000001is essentially equal to zero and will result in the same uncertainty statistics being generated.
When the upper and lower bounds of the triangular distribution for AIRFR are set to �1 and 2,both of which are outside the range of 0 to 1, the following inhalation doses are reported for thedefault case at time zero:
Statistic Inhalation Minimum ******** Maximum 1.20E-05 Average 4.47E-06 Std.Dev 4.30E-06
Percentile Distribution Table
Statistic Inhalation 5% 0.00E+00 10% 0.00E+00 15% 0.00E+00 20% 1.57E-07 25% 8.38E-07 30% 1.69E-06 35% 2.73E-06 40% 4.19E-06 45% 4.20E-06 50% 5.56E-06 55% 5.61E-06 60% 6.44E-06 65% 6.63E-06 70% 7.56E-06 75% 7.65E-06 80% 8.80E-06 85% 9.13E-06 90% 1.05E-05 95% 1.09E-05 100% 1.20E-05
The maximum inhalation dose reported above is almost twice as high as the maximum inhalationdose of 7.04E-06 calculated when the air release fraction is set to the upper bound of 1. Whilethe above results are mathematically correct, they are invalid since air release fractions of -1 and2 are not meaningful. Similarly spurious results were obtained when entering out-of-boundranges for INGE1, RMVFR, RF0, RRF, THICK0, DENSI0, EROS0, POROS0, and EMANA0.
The label for AIRFR in the "Uncertainty Analysis Input Summary" window is "Air fraction of i",where i is the number of the source. The proper name for the parameter should be "Air releasefraction" and the word "source" should follow the word "of". A more appropriate label would be"Air release fraction of source i". Similarly, the word �source� is missing in the label for all othersource parameters eligible for uncertainty analysis.

Verification of RESRAD-BUILD, Version 3.1
Tetra Tech NUS, Inc. Page 87 03/31/03
The label for RF0 in the "Uncertainty Analysis Input Summary" window is "Release time of i",where i is the number of the source. The word "source" should follow the word "of". Also, theterm "release time" is inconsistent with other names used for this parameter. The Help File usesthe term "time of source removal" and the input field name for this parameter is "lifetime". Thisinconsistent terminology should be resolved. In the interest of brevity, it is recommended that theterm "lifetime" be used in both the help and the uncertainty modules. A more appropriate label inthe uncertainty summary for this parameter would therefore be "Lifetime of source i".
There is a general problem in how the uncertainty analysis module handles adding and removingsources. This is similar to the problem that was encountered with the addition and removal ofreceptors, discussed in the previous section. The following test sequence was followed startingwith the default case, and using SAREA as an example:
• Select uncertainty analysis for Source 1 area• Select Uniform distribution with Min = 1 and Max = 2• Add a source• Select uncertainty analysis for Source 2 area• Select Uniform distribution with Min = 2 and Max = 3• Add a source• Select uncertainty analysis for Source 3 area• Select Uniform distribution with Min = 0 and Max = 1• Click on Source 2 and remove that source, leaving only Source 1 and 3• View "Uncertainty Analysis Input Summary" window
When one of three sources is removed (in this case, Source 2), the area for Source 2 still appearsto be set up for uncertainty analysis. The code does not automatically remove this sourceparameter from the uncertainty input screen, even though that source (and all associated sourceparameters) has been removed from the deterministic input screen. In fact, the code runs theuncertainty module and reports the uncertainty input parameters for the Source1, Source 2, andSource 3 area. However, the uncertainty statistics indicate that the doses from Source 3 (re-numbered and identified as Source 2 in the output) are higher than the doses from Source 1. Thiscan be very confusing, because the code is using the uncertainty input parameters for the area ofthe deleted source (formerly Source 2) instead of those for Source 3 (now renumbered asSource 2). The uncertainty input parameters for Source 3 are smaller than those for Source 1, sothe dose from Source 3 should be lower, not higher.
Problems similar to the one reported above were encountered with AIRFR, INGE1, RMVFR,RF0, RRF, THICK0, DENSI0, EROS0, POROS0, EFDIF0, and EMANA0.
Another general problem occurs when changing from a non-volume source and to a volumesource. To describe this problem, the following test sequence is followed starting with the defaultcase, using RMVFR as an example:
• Change the source type to Area• Select uncertainty analysis for Source 1 removable fraction• Keep the default values for the triangular distribution• Change the source type back to Volume• View "Uncertainty Analysis Input Summary" window

Verification of RESRAD-BUILD, Version 3.1
Tetra Tech NUS, Inc. Page 88 03/31/03
When a source is changed from a non-volume source to a volume source, the removable fractionis no longer available for the deterministic calculation. However, this parameter is notautomatically removed from the uncertainty module. Even though this parameter is no longerused, the code will execute the uncertainty module. As expected, the results indicate no changein the receptor dose from all pathways.
Problems similar to the one reported above were encountered with RF0 and RRF, since they arealso only available for non-volume sources.
A related problem occurs when switching from volume to non-volume sources for parametersonly available in volume sources. To describe this problem, the following test sequence isfollowed starting with the default case, using THICK0 as an example:
• Select uncertainty analysis for Source 1 thickness• Keep the default values for the triangular distribution• Change the source type to Area• View "Uncertainty Analysis Input Summary" window
When a source is changed from a volume source to a non-volume source, the source thickness isno longer available for the deterministic calculation. However, this parameter is notautomatically removed from the uncertainty module. Even though this parameter is no longerused, the code will execute the uncertainty module. As expected, the results indicate no changein the receptor dose from all pathways.
Problems similar to the one reported above were encountered with THICK0, DENSI0, EROS0,POROS0, EFDIF0, and EMANA0.
One general problem was found to affect only the radon-specific volume source parametersPOROS0 and EFDIF0, and EMANA0. This problem arises when one or more of theseparameters is selected for uncertainty analysis and all radon precursors are subsequently removedfrom that source. The response of the code is similar to the case where a source is changed fromvolume to area.
The last general problem arises when multiple regions of a volume source are selected foruncertainty analysis, and the number of regions in that volume source is later reduced. Thereduction in the number of regions does not automatically delete the uncertainty analysis for themulti-region volume source parameters of any regions that have been removed by such action.This problem was encountered with THICK0, DENSI0, EROS0, POROS0, EFDIF0, andEMANA0.
3.1.5 Shielding Parameters Two shielding parameters, DSTH and DSDEN, are eligible for uncertainty analysis. For theseparameters, no problems were encountered running the uncertainty analysis module under thedefault case with normal parameter ranges and default distributions. However, several errorswere encountered when the distribution range exceeds the parameter bounds.
In the case of DSTH, as was the case for the deterministic test for negative shielding thickness,the code accepted and ran the uncertainty analysis with a distribution containing negativeshielding thicknesses. While the deterministic run with a negative thickness resulted in errormessages, the uncertainty run did not. In fact, the code calculated a maximum direct external

Verification of RESRAD-BUILD, Version 3.1
Tetra Tech NUS, Inc. Page 89 03/31/03
dose at time zero that was greater than the dose without shielding, which is physically impossible.It appears that a negative shielding thickness produces the opposite effect of a positive shieldingthickness.
In the case of DSDEN, as was the case for the deterministic test for negative shielding density,the code accepted and ran the uncertainty analysis with a distribution containing negativeshielding densities. However, in this case, no uncertainty output was generated because theuncertainty run is interrupted with the following error message:
Cannot Open Error file "F77L3.EER", error # 94
There is a problem in the uncertainty analysis module when more than one shield is selectedbetween multiple receptors and/or sources. The following test sequence was followed, usingDSTH as an example:
• Select uncertainty analysis for Receptor 1/Source 1 shielding thickness• Add a receptor• Select uncertainty analysis for Receptor 2/Source 1 shielding thickness• Add a source• Select uncertainty analysis for Receptor 2/Source 2 shielding thickness• Click on Receptor 1 and remove that receptor, leaving only Receptor 2• View "Uncertainty Analysis Input Summary" window
When one of two receptors is removed (in this case, Receptor 1), the shielding between Receptor1 and Source 1 still appears to be set up for uncertainty analysis. The code apparently does notautomatically remove the shielding thickness between Receptor 1 and any of the sources from theuncertainty input screen, even though that receptor (and all associated receptor parameters) hasbeen removed from the deterministic input screen. In fact, the code runs the uncertainty moduleand reports the input parameters for Receptor 1/Source1, Receptor 2/Source 1, and Receptor2/Source 2 shielding thickness. However the uncertainty statistics show no variation in the directexternal dose to Receptor 2 (re-numbered and identified as Receptor 1 in the output) fromSource 2, even though the distribution of shielding thicknesses should result in a range of directexternal doses.
A similar problem occurs when one or more sources are removed. The above problem alsoapplies to the uncertainty analysis for DSTH.
3.1.6 Tritium Model ParametersThe user�s manual for one of the tritium model parameters, DRYTHICK, does not indicatewhether this parameter is eligible for uncertainty analysis, and does not indicate any defaultdistribution. However, the code allows uncertainty analysis on this and all the other tritiummodel parameters H3THICK, H3VOLFRACT, H3RMVF, and HUMIDITY. In addition,uncertainty analysis is enabled for two other tritium model parameters, H3POROSITY andWALL_DENSITY, which are not listed Appendix J of the user�s manual.
For these parameters, no problems were encountered running the uncertainty analysis moduleunder the default case with normal parameter ranges and default distributions, except forH3VOLFRACT, where the default uncertainty range overlaps the default value for

Verification of RESRAD-BUILD, Version 3.1
Tetra Tech NUS, Inc. Page 90 03/31/03
H3POROSITY. In addition, several errors were encountered when the distribution range exceedsthe parameter bounds or conflicts with other correlated parameters.
DRYTHICK and H3THICK are correlated and in the deterministic model, DRYTHICK cannotexceed H3THICK, or an error message will result. Therefore, the following test was conductedto determine how the code responded when the range of one or the other parameter violated thiscondition. The distribution for DRYTHICK was set as follows in two cases:
• Uniform with Min = 5, Max = 15, and Wet+Dry zone thickness = 10; • Uniform with Min = -10, Max = 10, and Wet+Dry zone thickness = 10In the first test, the Dry zone thickness is greater than the Wet+Dry zone thickness in one out oftwo samples, resulting in the following output at time zero:
Statistic H-3 Minimum 0.00E+00 Maximum 5.31E-03 Average 1.51E-03 Std.Dev 1.85E-03
Percentile Distribution Table
Statistic H-3 5% 0.00E+00 10% 0.00E+00 15% 0.00E+00 20% 0.00E+00 25% 0.00E+00 30% 0.00E+00 35% 0.00E+00 40% 0.00E+00 45% 0.00E+00 50% 4.35E-04 55% 8.55E-04 60% 2.01E-03 65% 2.03E-03 70% 2.75E-03 75% 3.29E-03 80% 3.68E-03 85% 4.18E-03 90% 4.77E-03 95% 5.01E-03 100% 5.31E-03
In the second test, the Dry zone thickness is negative in one out of two samples, resulting in thefollowing output at time zero:
Statistic H-3 Minimum 6.45E-04 Maximum 9.55E-03 Average 5.44E-03 Std.Dev 2.93E-03

Verification of RESRAD-BUILD, Version 3.1
Tetra Tech NUS, Inc. Page 91 03/31/03
Percentile Distribution Table
Statistic H-3 5% 6.65E-04 10% 1.25E-03 15% 1.73E-03 20% 1.97E-03 25% 2.92E-03 30% 3.02E-03 35% 3.93E-03 40% 4.68E-03 45% 4.70E-03 50% 5.77E-03 55% 6.25E-03 60% 6.77E-03 65% 7.18E-03 70% 7.56E-03 75% 8.22E-03 80% 9.10E-03 85% 9.11E-03 90% 9.51E-03 95% 9.52E-03 100% 9.55E-03
This result is statistically identical to the results from the "Reasonable Values Test" (i.e., uniformdistribution ranging from 0 to 10), which are reported below:
Statistic H-3 Minimum 3.33E-04 Maximum 9.64E-03 Average 5.61E-03 Std.Dev 2.99E-03
Percentile Distribution Table
Statistic H-3 5% 7.68E-04 10% 9.85E-04 15% 1.86E-03 20% 2.12E-03 25% 3.14E-03 30% 3.23E-03 35% 4.19E-03 40% 5.05E-03 45% 5.20E-03 50% 6.05E-03 55% 6.46E-03 60% 7.56E-03 65% 7.58E-03 70% 8.22E-03

Verification of RESRAD-BUILD, Version 3.1
Tetra Tech NUS, Inc. Page 92 03/31/03
Percentile Distribution Table (cont�d)
Statistic H-3 75% 8.66E-03 80% 8.94E-03 85% 9.25E-03 90% 9.52E-03 95% 9.59E-03 100% 9.64E-03
The code apparently converted negative values of the Dry zone thickness to positive values.Similar problems were encountered when focusing on H3THICK using two test cases with thefollowing distributions for H3THICK:
• Uniform with Min = 5, Max = 30, and Dry zone thickness = 10; • Uniform with Min = -20, Max = 10, and Dry zone thickness = 0
In the first test, the Wet+Dry zone thickness is less than the Dry zone thickness in one out of fivesamples, resulting in the following output at time zero:
Statistic H-3 Minimum 0.00E+00 Maximum 9.36E-03 Average 5.73E-03 Std.Dev 4.05E-03
Percentile Distribution Table
Statistic H-3 5% 0.00E+00 10% 0.00E+00 15% 0.00E+00 20% 0.00E+00 25% 2.47E-04 30% 1.60E-03 35% 3.40E-03 40% 6.26E-03 45% 6.27E-03 50% 9.24E-03 55% 9.36E-03 60% 9.36E-03 65% 9.36E-03 70% 9.36E-03 75% 9.36E-03 80% 9.36E-03 85% 9.36E-03 90% 9.36E-03 95% 9.36E-03 100% 9.36E-03
Verification of RESRAD-BUILD, Version 3.1
Tetra Tech NUS, Inc. Page 93 03/31/03
In the second test, the Wet+Dry zone thickness is negative in two out of three samples (with 15observations), resulting in the following output at time zero:
Statistic H-3 Minimum 1.24E-04 Maximum 1.48E-02 Average 7.76E-03 Std.Dev 4.69E-03
Percentile Distribution Table
Statistic H-3 5% 5.72E-04 10% 1.40E-03 15% 3.05E-03 20% 3.37E-03 25% 3.66E-03 30% 4.19E-03 35% 5.13E-03 40% 6.51E-03 45% 6.70E-03 50% 7.02E-03 55% 8.21E-03 60% 8.91E-03 65% 9.21E-03 70% 1.02E-02 75% 1.16E-02 80% 1.35E-02 85% 1.48E-02 90% 1.48E-02 95% 1.48E-02 100% 1.48E-02
The maximum dose is greater than the dose from the deterministic run (9.66E-03 mrem). Thecode appears to be converting negative values to positive values, since the deterministic dose fora 20-cm Wet+Dry zone thickness is 1.48E-02 mrem.
This hypothesis was tested by selecting a �Uniform*� distribution with 10 observations in theinterval from 0 to 10 (equivalent to the range -10 to 10), and 5 observations in the interval from10 to 20 (equivalent to the range from -20 to -10). This results in the following output at timezero:
Statistic H-3 Minimum 5.49E-04 Maximum 1.48E-02 Average 7.65E-03 Std.Dev 4.68E-03

Verification of RESRAD-BUILD, Version 3.1
Tetra Tech NUS, Inc. Page 94 03/31/03
Percentile Distribution Table
Statistic H-3 5% 8.06E-04 10% 1.63E-03 15% 2.03E-03 20% 2.89E-03 25% 3.85E-03 30% 4.57E-03 35% 5.10E-03 40% 5.94E-03 45% 6.42E-03 50% 7.04E-03 55% 7.88E-03 60% 8.72E-03 65% 9.39E-03 70% 1.02E-02 75% 1.26E-02 80% 1.34E-02 85% 1.46E-02 90% 1.48E-02 95% 1.48E-02 100% 1.48E-02
This distribution of results is statistically equivalent to that obtained in the second test.Therefore, it is verified that the code uses the absolute value of negative thickness numbers.
In the case of H3VOLFRACT, the default distribution (uniform from 0.04 to 0.25) has beenselected so that a sampled value will always exceed the default volumetric water content (0.03).In addition, the sampled value will exceed the default porosity value (0.1) more than 50% of thetime, which is in conflict with the requirement that the volumetric water content be less than orequal to the porosity. Coincidentally, the default distribution for the volumetric water content isthe same as the default distribution used for the porosity. A better default distribution of valuesfor the volumetric water content would be Min = 0 and Max = 0.1.
Two test cases were run for H3VOLFRACT:
• Uniform with Min = 0, Max = 2; • Uniform with Min = -1, Max = 0
In the first test, one out of two sampled values of the volumetric water content exceeds the upperbound, resulting in the following output at time zero:
Statistic H-3 Minimum 3.29E-03 Maximum 9.69E-03 Average 4.28E-03 Std.Dev 1.50E-03

Verification of RESRAD-BUILD, Version 3.1
Tetra Tech NUS, Inc. Page 95 03/31/03
Percentile Distribution Table
Statistic H-3 5% 3.30E-03 10% 3.30E-03 15% 3.32E-03 20% 3.33E-03 25% 3.38E-03 30% 3.38E-03 35% 3.44E-03 40% 3.52E-03 45% 3.54E-03 50% 3.65E-03 55% 3.72E-03 60% 4.00E-03 65% 4.01E-03 70% 4.29E-03 75% 4.60E-03 80% 4.91E-03 85% 5.51E-03 90% 6.90E-03 95% 7.96E-03 100% 9.69E-03
Half of the doses are less than the minimum dose (3.59E-03 mrem) calculated using a volumetricwater content of 1. Since the dose is inversely proportional to this parameter, it appears that thecode is using the higher values in a mathematically correct manner, but inconsistent with theparameter definition.
In the second test, the use of a negative volumetric water content causes the code to issue thefollowing error message:
Cannot Open Error file "F77L3.EER", error # 94
Similar problems were encountered when applying the same two tests to the parameterH3POROSITY, but with a slight variation in the results from the first test.
In the first test, one out of two sampled values of the porosity exceeds the upper bound, resultingin the following output at time zero: Statistic H-3 Minimum 9.57E-03 Maximum 9.75E-03 Average 9.74E-03 Std.Dev 3.54E-05

Verification of RESRAD-BUILD, Version 3.1
Tetra Tech NUS, Inc. Page 96 03/31/03
Percentile Distribution Table
Statistic H-3 5% 9.68E-03 10% 9.70E-03 15% 9.73E-03 20% 9.74E-03 25% 9.74E-03 30% 9.74E-03 35% 9.75E-03 40% 9.75E-03 45% 9.75E-03 50% 9.75E-03 55% 9.75E-03 60% 9.75E-03 65% 9.75E-03 70% 9.75E-03 75% 9.75E-03 80% 9.75E-03 85% 9.75E-03 90% 9.75E-03 95% 9.75E-03 100% 9.75E-03
Since the dose approaches a maximum value of 9.75E-3 before the maximum porosity of 1 isreached, it appears that the code is using the higher values in a mathematically correct manner,but inconsistent with the parameter definition.
As with the previous two parameters, similar problems were encountered when applying the sametwo tests to the parameter H3RMVF, but with a slight variation in the results, as follows.
In the first test, one out of two sampled values of the fraction available for vaporization exceedsthe upper bound, resulting in the following output at time zero:
Statistic H-3 Minimum 5.55E-04 Maximum 1.86E-02 Average 9.34E-03 Std.Dev 5.51E-03
Percentile Distribution Table
Statistic H-3 5% 1.08E-03 10% 1.49E-03 15% 2.52E-03 20% 3.39E-03 25% 4.06E-03 30% 4.98E-03 35% 6.22E-03 40% 8.21E-03 45% 8.22E-03

Verification of RESRAD-BUILD, Version 3.1
Tetra Tech NUS, Inc. Page 97 03/31/03
Percentile Distribution Table (cont�d)
Statistic H-3 50% 1.03E-02 55% 1.04E-02 60% 1.18E-02 65% 1.21E-02 70% 1.37E-02 75% 1.39E-02 80% 1.56E-02 85% 1.60E-02 90% 1.75E-02 95% 1.79E-02 100% 1.86E-02
Half of the doses are greater than the maximum dose (9.66E-03 mrem) calculated using thedefault evaporable water fraction of 1. Since the dose is proportional to this parameter, it appearsthat the code is using the higher values in a mathematically correct manner, but inconsistent withthe parameter definition. Note: after 1 year (when all the evaporable water has been removed),the doses are all from the particulate air pathway, and are summarized below:
Statistic H-3 Minimum ******** Maximum 8.55E-10 Average 2.79E-11 Std.Dev 5.21E-10
Percentile Distribution Table
Statistic H-3 5% 0.00E+00 10% 0.00E+00 15% 0.00E+00 20% 0.00E+00 25% 0.00E+00 30% 0.00E+00 35% 0.00E+00 40% 0.00E+00 45% 0.00E+00 50% 6.96E-11 55% 1.37E-10 60% 3.22E-10 65% 3.25E-10 70% 4.42E-10 75% 5.28E-10 80% 5.91E-10 85% 6.72E-10 90% 7.68E-10 95% 8.06E-10 100% 8.55E-10

Verification of RESRAD-BUILD, Version 3.1
Tetra Tech NUS, Inc. Page 98 03/31/03
In the second test, the use of a negative evaporable water fraction results in no doses fromevaporation at time zero. The doses from particulate releases after one year are reported below(for comparison with the previous output):
Statistic H-3 Minimum 9.33E-10 Maximum 1.79E-09 Average 1.37E-09 Std.Dev 2.60E-10
Percentile Distribution Table
Statistic H-3 5% 9.68E-10 10% 9.85E-10 15% 1.06E-09 20% 1.08E-09 25% 1.16E-09 30% 1.17E-09 35% 1.24E-09 40% 1.31E-09 45% 1.32E-09 50% 1.39E-09 55% 1.43E-09 60% 1.52E-09 65% 1.52E-09 70% 1.58E-09 75% 1.62E-09 80% 1.65E-09 85% 1.70E-09 90% 1.74E-09 95% 1.76E-09 100% 1.79E-09
The above output distribution appears to be a continuation of the previous output distribution.While mathematically correct, the use of a negative value for the evaporable water fraction toincrease the dose from particulate releases is inconsistent with the definition of this parameter.
To test the HUMIDITY parameter, a single uniform distribution was selected, ranging from �1 to1. In this case, one out of two sampled values of the humidity is negative, resulting in thefollowing output at time zero: Statistic H-3 Minimum 0.00E+00 Maximum 9.73E-03 Average 9.02E-03 Std.Dev 2.07E-03

Verification of RESRAD-BUILD, Version 3.1
Tetra Tech NUS, Inc. Page 99 03/31/03
Percentile Distribution Table
Statistic H-3 5% 4.07E-03 10% 5.77E-03 15% 9.56E-03 20% 9.59E-03 25% 9.66E-03 30% 9.66E-03 35% 9.68E-03 40% 9.70E-03 45% 9.70E-03 50% 9.71E-03 55% 9.71E-03 60% 9.72E-03 65% 9.72E-03 70% 9.72E-03 75% 9.72E-03 80% 9.72E-03 85% 9.73E-03 90% 9.73E-03 95% 9.73E-03 100% 9.73E-03
The negative humidity values are accepted, but the resulting doses are reported as incorrectlycalculated using negative values to increase the maximum dose. Since the dose is inverselyproportional to humidity, the maximum dose of 9.70E-03 can only occur at the minimumhumidity of zero.
The test on WALL_DENSITY used the same distribution, but resulted in half the values (thoseless than 0) setting the lower 50% percentile of the dose distribution to zero.
There are common problems affecting all tritium parameters when multiple sources are involvedor when removing a source, removing tritium from a source or changing the source type. Anexample of such problems is illustrated below, using DRYTHICK as an example.
Start with a single tritium volume source of unit concentration, and set the Dry zone thickness toa uniform distribution between 0 and 5. The doses at time zero are summarized below:
Source 1
Statistic H-3 Minimum 5.79E-03 Maximum 9.66E-03 Average 8.15E-03 Std.Dev 1.24E-03
Now add a second identical source, but set the Dry zone thickness for this source to a uniformdistribution between 5 and 10. The doses for source 1 and 2 at time zero are summarized below:

Verification of RESRAD-BUILD, Version 3.1
Tetra Tech NUS, Inc. Page 100 03/31/03
Source 1 Statistic H-3 Minimum 1.30E-04 Maximum 5.62E-03 Average 2.85E-03 Std.Dev 1.66E-03
Source 2 Statistic H-3 Minimum 1.23E-04 Maximum 5.59E-03 Average 2.83E-03 Std.Dev 1.65E-03
Note that there is no significant difference in the statistics of Source 1 and 2 in the two-sourcerun, despite the clear difference in the distribution of the Dry zone thickness. Note also that theresults for Source 1 with and without Source 2 are significantly different, although they should bethe same since the distribution of input values was not changed for Source 1. It appears that thecode is applying the distribution defined for Source 2 to both sources.
Now click on Source 1 and remove it. View the "Uncertainty Analysis Input Summary" window;the code does not remove the Source 1 uncertainty analysis parameters. The doses from Source 2(renamed Source 1 after the run) are summarized below:
Statistic H-3 Minimum 5.79E-03 Maximum 9.66E-03 Average 8.14E-03 Std.Dev 1.23E-03
Note that the doses for this source are statistically equivalent to the doses reported above forSource 1 (single-source run), but Source 1 is the source that was removed. It appears that thecode is assigning the distribution from Source 1 (the one that was removed prior to theuncertainty analysis run) to Source 2.
Now remove the uncertainty parameters for Source 1 (the source that was removed from thedeterministic run). The doses from Source 2 (renamed Source 1 after the run) are summarizedbelow:
Statistic H-3 Minimum 9.66E-03 Maximum 9.66E-03 Average 9.66E-03 Std.Dev 0.00E+00
Note that there is no variation in the doses. This appears to be caused by an indexing problem,since the source is renumbered (from Source 2 to Source 1) in the deterministic input file, but theuncertainty parameter is not renumbered in the uncertainty input file, leading to a mismatch.

Verification of RESRAD-BUILD, Version 3.1
Tetra Tech NUS, Inc. Page 101 03/31/03
Now change Source 2 to an area source. The code runs the uncertainty module, despite the factthat there are no volume sources and the fact that the area source does not use this parameter. Novariation is observed in the reported doses, as expected.
Finally, change Source 2 back to a volume source, but replace the tritium in Source 2 withCO-60. The code runs the uncertainty module, despite the fact that there are no volume sourcescontaining tritium. No variation is observed in the reported doses, as expected.
The above problems were encountered with H3THICK, H3VOLFRACT, H3RMVF, andHUMIDITY.
3.2 Input Distribution VerificationAfter the user enters a distribution and the associated statistics for a parameter, RESRAD-BUILDgenerates a file containing a set of parameter values from the specified distribution. The numberof parameters generated will be the product of the selected number of repetitions andobservations. One method for verifying that RESRAD-BUILD is generating a consistent set ofparameter values is to generate a similar set of values using an industry-standard spreadsheet add-in such as Crystal Ball, entering the same statistical distribution parameters specified inRESRAD-BUILD. The two independently generated data sets can then be tested to ensure thatthey are statistically equivalent. An alternate verification strategy that works well for commondistributions is the use of the curve fitting routine in Crystal Ball to determine which distributiontypes most closely fit the data sets generated by the RESRAD-BUILD LHS routine. However,this alternate strategy can only be applied when the data sets have been generated from acontinuous distribution. This process was repeated for five parameters for which uncertaintyanalysis is available and focused on the default or commonly used continuous distribution typesavailable in both RESRAD-BUILD and Crystal Ball (uniform, triangular, normal, exponential,and lognormal). Unfortunately, the log-uniform distribution is not available in Crystal Ball.
3.2.1 Selected Parameter DistributionsTable 3-1 lists the selected parameters, distribution types, and values for which statistical testswere conducted. The range of values was selected to be consistent with the limits imposed byRESRAD-BUILD on these parameters.
Table 3-1. Parameters, Distributions, and Values Used in Uncertainty Analysis Input Tests
Parameter (Units) DistributionMin or0.1%
Most Likelyor Mean
Std. Deviationor Lambda
Max or99.9%
DENSI0 (g/cm Uniform 2.2 N/A N/A 2.6BRTRATE (m3/d) Triangular 12 33.6 N/A 46AREA (m) Normal N/A 36 3 N/AAIRFR (-) Exponential N/A N/A 7 N/ALAMBDAT (1/h) Lognormal-B 0.15 N/A N/A 15.0

Verification of RESRAD-BUILD, Version 3.1
Tetra Tech NUS, Inc. Page 102 03/31/03
3.2.2 Crystal Ball ResultsThe RESRAD-BUILD file that generates the uncertainty analysis input values for eachparameter, LHSBIN.DAT, was transferred to a spreadsheet. The five sets of parameter valuesgenerated by RESRAD-BUILD were then subjected to a Crystal Ball distribution fit test. Thistest compares each data set to a list of 11 continuous distributions. Three testing methods, chi-squared, Kolmogorov-Smirnov, and Anderson-Darling, are used to determine the best fit amongthese 11 distribution types. All three techniques correctly determined the underlying distributionsof the data sets generated by RESRAD-BUILD for DENSI0 and LAMDAT. The chi-squaredtechnique also correctly determined the underlying distribution for AIRFR, while the Anderson-Darling technique correctly determined the underlying distribution for BRTRATE. However,only the Kolmogorov-Smirnov technique correctly predicted the underlying distribution for allfive parameters. Table 3-2 lists the distribution fits obtained by Crystal Ball using theKolmogorov-Smirnov technique.
Table 3-2. Distribution fits obtained by Crystal Ball using the Kolmogorov-SmirnovTechnique
Parameter (Units) DistributionMin or0.1%
Most Likelyor Mean
Std. Deviationor Lambda
Max or99.9%
DENSI0 (g/cm Uniform 2.199 N/A N/A 2.599BRTRATE (m3/d) Triangular 12.269 33.185 N/A 46.342AREA (m) Normal N/A 35.997 2.989 N/AAIRFR (-) Exponential N/A N/A 7.025 N/ALAMBDAT (1/h) Lognormal N/A 1.973 1.685 N/A
A comparison between Tables 3-1 and 3-2 verifies that the parameter distribution data setsgenerated by RESRAD-BUILD correctly represent the user-selected distribution and associatedparameters.
3.3 Output Distribution VerificationThe verification of the uncertainty analysis tests conducted for single parameters was extended byapplying uncertainty analysis to multiple parameters in a pathway model. This was useful inunderstanding the impact from parameters that apply to only one pathway, compared toparameters that apply to all pathways and/or source types.
In verifying the deterministic results for most pathways, excluding the external gamma pathway,results were obtained by coding the pathway equations in an Excel spreadsheet. Thedeterministic spreadsheet model was extended by assigning distributions using the Exceluncertainty analysis add-on Crystal Ball. Distributions equivalent to those allowed in RESRAD-BUILD were defined for the appropriate input parameters, and the simulations were run undersimilar conditions (i.e., Latin Hypercube with 300 iterations). While results from Crystal Balland RESRAD-BUILD simulations are not expected to be identical due to different random-number generation, tests on the output distributions were used to verify that any differences areonly due to statistical chance.
The direct ingestion pathway was selected for the output distribution verification because it isrelatively simple, but incorporates multiple parameters that are eligible for uncertainty analysis.Since the algorithms used in the uncertainty analysis module are independent of which pathway is

Verification of RESRAD-BUILD, Version 3.1
Tetra Tech NUS, Inc. Page 103 03/31/03
selected, verifying the correct implementation of the uncertainty analysis module to a singlepathway is sufficient to demonstrate verification for all pathways. This conclusion is subject tothe limitations and errors noted in Section 3.1 that apply to individual parameters eligible foruncertainty analysis.
3.3.1 Input Parameter DistributionsThe equation for the direct ingestion of removable material is provided in Appendix E of theuser�s manual for both volume (Equation E.1) and non-volume (Equation E.2) sources. Two testswere conducted, one for each equation, using the default parameters for each parameter eligiblefor uncertainty analysis. These parameters, distributions, and values are listed in Table 3-3. Thedistributions were selected to represent a number of the most popular distribution types likely tobe used. With the exception of the air release fraction (and the source type in the second test), alldeterministic parameter values were left as the default. To assess only the direct component ofthe ingestion dose, the value for the air removal fraction (AIRFR) was set to zero, effectivelysuppressing the air-dependent pathways. In addition, only time zero was assessed, and thenumber of integration points was set to 1 (no correction for decay and removal). The sourceconcentration was set to 100 pCi/g of Co-60. In the second test, the default volume source waschanged to an area source, and the source concentration was set to 100 pCi/m2. Of the parametersexercised in the uncertainty output tests, one parameter applies only to the direct ingestionpathway (INGE1), but is used differently in calculating volume or non-volume sources, anotherparameter applies to only non-volume sources (RMVFR) and the remaining parameters affectedall pathways and sources (TTIME and FTIN).
Table 3-3. Parameters, distributions, and values used in uncertainty analysis output tests
Volume Source
Parameter/Units Distribution MinMost Likely orMean Standard Deviation Max
INGE1 (g/h) Normal N/A 0.01 0.001 N/ATTIME (d) Triangular 0 90 N/A 365FTIN (-) Uniform 0 N/A N/A 1
Area Source
Parameter/Units Distribution MinMost Likely orMean
Std. Deviation orLambda Max
INGE1 (1/h) Exponential N/A N/A 10000 N/ATTIME (d) Triangular 0 90 N/A 365FTIN (-) Uniform 0 N/A N/A 1RMVFR (-) Bnd-Normal 0 0.75 0.25 1
No correlation between variables was assumed in the first set of tests (all variables areindependent). A second set of tests was conducted by positively and negatively correlatingTTIME and FTIN with correlation coefficients of +0.99 and �0.99, respectively.
3.3.2 Uncertainty Output Tabular ResultsTable 3-4 summarizes the results obtained using Crystal Ball and RESRAD-BUILD. In general,the uncertainty analysis results obtained with Crystal Ball and RESRAD-BUILD were very

Verification of RESRAD-BUILD, Version 3.1
Tetra Tech NUS, Inc. Page 104 03/31/03
similar, as indicated by ratio between statistical parameters very close to unity for the mostimportant parameters, such as the mean (ratio within 6 percent), median (ratio within 16 percent)and standard deviation (ratio within 20%). The ratio in the average deviation between thecumulative values (excluding the intervals containing the minima and maxima) was calculated foreach 10th-percentile interval; this ratio indicates good agreement, within 10% or less, in thecumulative distribution for each result. The minimum and maximum values are single values outof 300 that are generated; therefore, they are subject to much greater variability than the mean ormedian values. Considering that the range of direct ingestion doses calculated by RESRAD-BUILD spanned 2-4 orders of magnitude for the volume source and 4-6 orders of magnitude forthe area source, such close agreement indicates that the uncertainty module in RESRAD- BUILDis correctly calculating the distribution of doses.
Table 3-4. Ratio between RESRAD-BUILD and Crystal Ball Results for StatisticalParameters of Output Distributions
No Correlation Positive Correlation Negative CorrelationStatistic Volume Area Volume Area Volume AreaMinimum 1.03 0.24 1.88 8.36 3.13 2.30Maximum 0.65 0.84 0.65 0.75 0.89 1.09Mean 0.99 1.06 1.00 1.04 1.00 0.96Median 1.16 1.09 1.08 0.98 1.10 1.00Std. Dev. 0.80 1.06 0.94 1.00 0.81 0.93Av. %ileDeviation*
1.08 0.99 1.07 0.95 1.04 1.04
*This represents the average deviation in the 10-percentile cumulative distribution of results,excluding the upper and lower 10th percentile, which contain the minima and the maxima.
The degree of dependency (sensitivity) of the results on each parameter can be determined byviewing the rank observations in RESRAD-BUILD (or the sensitivity chart in Crystal Ball).RESRAD-BUILD consistently ranked FTIN and TTIME as the most important parametersaffecting the ingestion dose, regardless of whether these two parameters were correlated or not.RESRAD-BUILD also consistently ranked the direct ingestion rate for the volume source lowerthan the direct ingestion rate for the area source, despite the fact that the dose from the areasource was typically two orders of magnitude lower than the dose from the volume source. Sincemost of the dose from the volume source is due to external gamma, whereas the ingestionpathway dominates the area source calculation, this is not unexpected; it is the relative change inthe dose and not the magnitude of the dose that matters as far as sensitivity is concerned. CrystalBall correctly identified FTIN and TTIME as important parameters, but also ranked the directingestion rate for the volume source among the top three parameters. In the case of negativecorrelation between FTIN and TTIME, Crystal Ball identified the opposite effects that these twoparameters have on the dose, and ranked the direct ingestion rate for the volume source as themost important parameter, whereas RESRAD-BUILD did not. Because the variations in thetotal dose in the volume source is much greater than the ingestion dose, the regression andcorrelation coefficients of total dose against the ingestion rate indeed turn out to relativelyunimportant for the volume source. These inconsistencies may be due in large part to differencesin how Crystal Ball and RESRAD-BUILD report their correlation coefficients.

Verification of RESRAD-BUILD, Version 3.1
Tetra Tech NUS, Inc. Page 105 03/31/03
3.3.3 Uncertainty Output Graphic ResultsThe primary objective in verifying the output distributions is the comparison of the tabulations ofstatistical properties generated by RESRAD-BUILD and Crystal Ball (i.e., minimum, maximum,mean, median and percentiles). An attempt was made to also compare the graphical outputgenerated by RESRAD-BUILD with the graphical output from the Crystal Ball simulations todetermine whether this component of the statistics package has been implemented correctly.Unfortunately, the graphic output from RESRAD-BUILD was not available. After running theuncertainty module, attempting to select �View, Uncertainty Graphics� from the main menuresulted in the following error message: �Component �VCFI32.OCX� or one of its dependenciesnot correctly registered: a file is missing or invalid.� This error was also duplicated on anothercomputer and indicates a possible problem with the RESRAD-BUILD installation program.

Verification of RESRAD-BUILD, Version 3.1
Tetra Tech NUS, Inc. Page 106 03/31/03
4 Evaluation of Other Issues
In addition to performing a strict verification of the deterministic and uncertainty calculationsperformed by RESRAD-BUILD, the following related tasks aimed at improving the code andsupporting documentation were conducted in parallel:
• Review of the code, user�s manual and other ancillary documentation for consistency.• Review of the code functions that do not impact the calculations.• Review of the calculation methodology.
In general, the user�s manual was found to be very well written and easy to follow. Most of thetime, what was written in the manual was reflected in the code. However, there are some areas,highlighted below, that could be improved to make the RESRAD-BUILD code and the user�smanual a better product.
4.1 ConsistencyThe purpose of this task was to identify inconsistencies between what is stated in the codedocumentation and what is actually performed or described in the code. Potential issues included,but were not limited to, inconsistent information (parameter values/bounds/descriptions) in theuser�s manual and in the parameter help screens, omissions in the code and/or its documentation,and editorial changes. As such issues were uncovered, they were documented along withsuggestions for possible resolutions. Most of these inconsistencies have already been addressedin Section 2.2 and 3.1 of this report. Additional minor typos and inconsistencies are addressed inthe parameter-specific checklist reports included in the CD-ROM appendix included with thisverification report.
Some issues that do not involve parameters or models were uncovered that may affect the abilityof a user to take full advantage of the features described in the user�s manual. These issues aredescribed below.
Installation Problems
The user�s manual indicates that RESRAD-BUILD may be installed on a computer running oneof the following operating systems: �Windows 95, 98, NT, 2000, or later versions.� The code wassuccessfully tested on a computer running Windows 2000 Professional and ME.The code also appeared to install correctly under the Windows XP operating system. Thegraphical user interface is fully functional, and the user is able to create and save input files.However, requesting the code to run an input file results in the following error message:
Abnormal program termination: Stack faultCS:EIP = 000Fh:00001373h
This problem, which prevents the code from performing any calculations, was reproduced on twodifferent computers running the Windows XP Professional operating system. Even runningRESRAD-BUILD under an emulation of an earlier version of Windows did not resolve thisproblem. Future releases of RESRAD-BUILD should be tested to ensure compatibility with thelatest Windows operating system.

Verification of RESRAD-BUILD, Version 3.1
Tetra Tech NUS, Inc. Page 107 03/31/03
Graphical Problems
After running the uncertainty module, attempting to select �View, Uncertainty Graphics� fromthe main menu resulted in the following error message: �Component �VCFI32.OCX� or one of itsdependencies not correctly registered: a file is missing or invalid.� This was duplicated on twoother computers.
General Typos/Inconsistencies
1. The error message that follows the input of an inappropriate value (e.g., alphanumeric or outof bounds) is �X not set appropiately,� where X would be replaced by the code name of theparameters, such as AIRFR or UD. The word "appropiately" is an embedded typo; it shouldbe corrected to "appropriately" in the error message.
2. There is a typo in the �Uncertainty Analysis Input Summary� window. Under �Samplespecifications � Grouping of observations� the word �Uncorrlelated� is misspelled (should bechanged to �Uncorrelated�). Also, a blank line should be inserted between paragraphs under�Information about current selection� for each applicable selection on this screen.
3. The capitalization of the tab headings in the �Uncertainty Analysis Input Summary� windowis inconsistent. Either capitalize every word OR just capitalize the first word in each tabheading.
4. When no default distribution is available to conduct uncertainty analysis on certainparameters (e.g., source area), the �Parameter distributions� tab in the �Uncertainty AnalysisInput Summary� window displays a paragraph requesting the user to select from the list ofdistributions. The second sentence in this paragraph contains a misspelled word,�distirbuition,� which should be changed to �distribution�. The word �inputs� in thissentence should also be changed to the singular �input�.
4.2 User FriendlinessThe purpose of this task was to consider those issues that do not impact the calculations, butshould be addressed to improve the user-friendliness of the code. Potential issues include, but arenot limited to, layout of input screens, organization of output reports, graphical or visual displays,and menu navigation. Many of the comments in this section have already been reported inprevious sections of this report. Suggestions for improvements are provided when applicable.
File Save
1. When viewing the output file for a deterministic run, the �Save� command does not appear tobe working. No file is saved under the filename specified by the user (in this caseTitletest.txt).
2. When viewing the output file for a deterministic run, the first time a �Save All� command isissued following a run with no uncertainty analysis the code will rename any existinguncertainty input files (*.SAM, *.PRB) under the filename assigned to the current run.
3. Saving a file where the user has set up parameters with uncertainty analysis does not result inthe uncertainty analysis parameters being saved along with the input file. If a file which had

Verification of RESRAD-BUILD, Version 3.1
Tetra Tech NUS, Inc. Page 108 03/31/03
been previously run with some parameters selected for uncertainty analysis is saved and thenopened at a later time, all previously �saved� uncertainty analysis settings are gone.
Help Function
1. Clicking on the Help Button [?] in the tool bar or the F2 function key (or selecting �Help,Index� from the main menu bar) when no parameter is highlighted does not work the firsttime it is attempted. Repeating this attempt, however, invokes the list of help topics. Thegeneral list of help topics should appear after the first time the Help Button or F2 functionkey is pressed, or the first time that �Help, Index� is selected.
2. The Help Screens, while now similar to those in the RESRAD code, are not as informative.In earlier versions of the RESRAD-Build code, the Help Screens for each parameter includedthe default and bounding values for that parameter. This provided some useful informationfor the user, especially when the default parameter was changed.
Default Parameter Values
1. To provide consistency with the treatment of parameters in RESRAD, the default parametervalues should be on a yellow background, which changes to a white background afterentering a non-default value. This is already implemented in the uncertainty module andshould be extended to the deterministic input as well.
2. There should be a simple mechanism for resetting a single parameter to its default value. Thecode currently only allows the user to change ALL parameter to the default. In essence, thisis just like starting a new input file.
Multiple Screen Windows
1. With the default input file in memory, the following actions were performed in the BuildingParameters input panel: Press �Air Flow� button; Select 2 for �Number of Rooms�;Press �Air Flow� button; Select 3 for �Number of Rooms�; Press �Air Flow� button.This sequence of actions caused three �Room Details� windows to open up on the screen, onefor the one-, one for the two-, and one for the three-room models. This has the potential tocause confusion, as the user may choose a different number of rooms, but may forget tocancel the inappropriate �Room Details� window. Inappropriate data may still be present onthe screen, possibly covered by a larger sized window. Each of the three windows was foundto accept user input even when only one would have been appropriate based on the currentselection for the number of rooms.
2. It is possible to run the code with the "Room Details" window still open after changes havebeen entered, but the code will run using the previous values. Changes made to any of theparameters in this window will not be saved unless the window is closed by pressing either�OK� or �Cancel�. This was also found to be the case for other windows that are accessedfrom the main input windows (e.g., Evaluation Times, Details for Source #N, Wall RegionParameters, and Source Receptor Table). The code should request that the user eitherconfirms or cancels any changes made in open windows prior to running the code.

Verification of RESRAD-BUILD, Version 3.1
Tetra Tech NUS, Inc. Page 109 03/31/03
Uncertainty Module
1. While in the uncertainty analysis input window, clicking on the �Help� button will invoke agraphical display of the currently selected distribution and parameters. In most cases,entering an inappropriate parameter value causes the code to warn the user without crashingthe code (by changing the input field background to red). However, some problems mayarise with lognormal-type distributions. If the parameter value selected for the mean and/orstandard deviations is inappropriately large (in either negative or positive direction), it maystill be accepted and the code may run. However, if the user clicks on �Help� before runningthe code, the code crashes with one of the following messages: Runtime error �11� (divisionby zero) or �6� (overflow).
2. The order in which the pathways are listed differs in the deterministic and uncertainty outputreport. In the deterministic output report, the pathways are listed in the following order:External, Deposition, Immersion, Inhalation, Radon, and Ingestion. In the uncertainty outputreport, the pathways are listed in the following order: External, Inhalation, Deposition,Immersion, Ingestion, Radon, and Total. This different ordering has the potential to result inerrors of transcription, but this can easily be remedied. Since the deterministic output reportis the one that is most frequently viewed by typical users, it is recommended that the order ofthe pathway doses presented in the uncertainty output report be arranged to match the orderof presentation in the deterministic output report.
3. The column listing the total dose in the uncertainty output report may not necessarily matchthe sum of the individual pathway doses listed on the same row. That is because somepathways may be sensitive or insensitive to one or more parameter that are the subject of theuncertainty analysis and some parameters may have opposite effects in different pathways.For example, the deposition and indirect ingestion pathway are directly proportional to thedeposition velocity, but the inhalation and immersion are inversely proportional to thisparameter. The opposite is true for the resuspension rate. This is a potential source ofconfusion and should be clarified.
Miscellaneous Issues
1. Changing the radiological units for activity and dose is effective only for the duration of thecurrent RESRAD-BUILD session. Closing and then opening RESRAD-BUILD causes theunits to revert to the defaults (pCi and mrem). Having to reset the units can become tediousfor users that run the code using exclusively SI units or units other than the defaults.Displaying a dialog box asking the user if he/she wishes to save the current units as thedefaults (if these are different from the current saved defaults) upon exiting RESRAD-BUILD would resolve this issue.
4.3 Calculation MethodologyThe purpose of this task was to review the calculation methodology to determine whether it isadequate for the intended purpose of the code. The primary focus of this review was on thefollowing complex models:
• External Radiation Exposure• Indoor Air Quality• Deposition Model

Verification of RESRAD-BUILD, Version 3.1
Tetra Tech NUS, Inc. Page 110 03/31/03
• Radon and Progeny Model• Tritium Model• Ingestion/Inhalation Models
The limitations of each of these models were identified, along with the availability of moreappropriate models if applicable. Simpler calculation models were also reviewed to determine ifthey are adequate for the purpose of producing reasonable or conservative results. The results ofthis review are documented below.
It was understood that any computer model has to strike a balance between degree of modelcomplexity, parameter availability, and computation time. Therefore, any suggestions forimprovements in the calculation methodology were made in consideration of the intendedapplications.
External Radiation Models
The external radiation model is described in Appendix F of the user�s manual and has alreadybeen extensively reviewed in Sections 2.3.1 through 2.3.3.
In assessing the methodology used by RESRAD-BUILD for direct gamma exposures, theMicroShield code was used as a benchmark. Several limitations were encountered in theRESRAD-BUILD methodology that have been overcome in MicroShield.
1. The point and line source models use a 4-group energy spectrum that may not adequatelycharacterize the emissions from radionuclides with complex spectra. This problem isaccentuated when shielding is applied due to differences in buildup and attenuation factorsfor different photon energies. The differences may not be conservative, depending on theradionuclide and shield material type.
2. The analytical line source model is adequate for the unshielded calculations, but yieldsunreliable results when shielding is added. This is due to the assumption that there is aconstant shielding thickness between source and receptor. However, the specified thicknessis only applicable to the radiation emitted from the line center point; for all other portions ofthe line, the �effective� shield thickness will be different depending on the geometry betweenthe line and the receptor. This problem is accentuated for large line sources and may result inconservative doses. The differences may not be conservative, depending on the radionuclideand source-receptor geometry.
3. The area and volume sources are circular and cylindrical, respectively. This is not the normalgeometry of most cases for which RESRAD-BUILD might be applied. Most contaminatedsurfaces and volumes will be rectangles or parallelepipeds (walls, floors, etc.). Use of acircular geometry will overestimate the doses from rectangular area or volume of the samesize, as long as the receptor is located along the center point. However, this dose may not beconservative if the receptor is located near the corner of a rectangular source.
4. The use of a cover and depth factor, as well as an area and off-set factor, to adjust the dosesfrom areas and volumes of infinite extent is useful in realistically modeling finite shieldedsources. These area factors were derived based on point-kernel integration methodologiessuch as those used by MicroShield. Actual doses, however, are calculated using interpolationor coefficients derived from fitting a curve to the point-kernel results. As such, there is someloss of accuracy relative to direct application of a point-kernel code such as MicroShield. Inaddition, there is no flexibility in defining the shield geometry, and partial shields cannot be

Verification of RESRAD-BUILD, Version 3.1
Tetra Tech NUS, Inc. Page 111 03/31/03
directly modeled in RESRAD-BUILD. These limitations may not lead to conservativeresults, depending on the radionuclide and source-shield-receptor geometry.
5. RESRAD-BUILD uses up to 3 materials to calculate an effective build-up factor (air, and/orsource material, and/or shield material). Most point-kernel codes, such as MicroShield,attribute the buildup factor over the entire attenuation path to a single material. In shieldingpractice, this is usually the material in which the photons undergo the greatest attenuation, orthe last material in the path between source and receptor. Therefore, RESRAD-BUILDresults will always be inconsistent with results obtained by traditional point-kernel codes.These differences may not lead to conservative results, depending on the radionuclide andair/source/shield material properties and source-shield-receptor geometry.
6. The immersion external gamma dose model, as discussed in the user�s manual, does not takeany credit for a limited room size. This may significantly overestimate doses from high-energy emitters, but this conservative dose model will only have a significant impact on thetotal doses in limited cases. These cases may include receptors not located in the same roomas the source and/or cases when the inhalation pathway is greatly reduced or eliminated, asmight be the case for receptors using respirators.
7. The deposition external gamma model is not described in the user�s manual, but presumablyfollows the same methodology as that for an unshielded area source. However, since there isno way to define the coordinates of the receptor with respect to this secondary source, theRESRAD-BUILD likely models this exposure pathway by assuming the floor to be a circulararea source with the receptor located one meter above the center of the floor. The code ispossibly applying an area factor to account for the finite dimensions of the floor. All of theabove, however, is speculation. The verification of this pathway yielded results that appearedto underestimate the doses in all cases that were tested. Such results will not likely havesignificant impacts on the overall dose in most typical cases. However, calculated doses maynot be insignificant when calculated for cases similar to those described for the submersionmodel.
Indoor Air Quality Model
The RESRAD-BUILD indoor air quality model is described in Appendix A of the user�s manual.Its purpose is to calculate time dependent concentrations of radionuclides that are released fromsources and transported in the air flow between one, two, or three rooms and the externalenvironment.
The one-room model verification is documented in Section 2.3 of this report. However, while apartial verification of the two- and three-room models was performed in Section 2.5, it was notpossible to fully verify the correct implementation of the two- and three-room model due toproblems encountered with the input parameters for this model that govern the flow of airbetween multiple rooms and the outside. These problems are described in Section 2.2.3 of thisreport. In particular, the code does not appear to be capable of accommodating zero air flows atboundaries between adjacent rooms or between rooms and the outside air (such as might be thecase in a basement).
One simplification of this model is the assumption of steady state concentrations andinstantaneous mixing, although the concentrations are corrected for decay, ingrowth, and removalover the exposure duration. However, it is not possible to model any variability in the airexchange rates over time, and uncertainty analysis is not enabled for most parameters that go intothe air quality model. For most applications, such simplifications will be adequate, but the

Verification of RESRAD-BUILD, Version 3.1
Tetra Tech NUS, Inc. Page 112 03/31/03
limitations of the code in estimating air concentrations in the room air due to varying ventilationparameters should be addressed in the user�s manual.
Air Particulate Deposition Model
The air particulate deposition model is described in Appendix B of the user�s manual. Thismodel is an integral part of the indoor air quality model and is the primary model used to estimateexternal gamma doses and ingestion doses from deposited material. The most significantobservation is that the deposition of material on the floor is assumed to be in steady state with theresuspension of material, resulting in a concentration on the floor that is only a function of airconcentration, deposition rate and resuspension rate. There is no consideration for the gradualchange in concentration due to a buildup or depletion of material over time. In a real situation,the concentration on a previously uncontaminated floor will be zero at time zero and graduallybuild up until a steady state is reached between deposition and resuspension, after which theconcentration will change as the room air concentration changes or the resuspension anddeposition parameters change. This assumption leads to an overestimate of doses when thesource is releasing contamination to the air, especially at time zero. However, the dose will beunderestimated for those times when the initial source is no longer releasing material throughmechanical erosion. In those cases, RESRAD-BUILD calculates a zero dose from depositedmaterial, when in reality the deposited material is still contributing to the indirect ingestion anddeposition external gamma doses as well as to the inhalation and submersion external gammadoses (from resuspended material). In most cases, the doses from these pathways will likely besmall relative to the initial doses, but ingrowth from short-lived, less hazardous radionuclides(e.g. Pu-241 to Am-241) may actually result in higher doses over time from these secondarysources where the code calculates a zero dose.
Radon Model
The RESRAD-BUILD radon model is a complex model described in Appendix C of the user�smanual. Some problems arose when attempting to verify the RESRAD-BUILD radon model.Several of these problems have been addressed in Section 2.2.5 with regards to the inputparameters used by the volume source radon model. Other issues were identified in Section 2.3.4of this report.
In particular, the current RESRAD-BUILD user�s manual contains a typographical error inEquation C.33 on page C-21. The coefficient for Bi-212 used to calculate the Rn-220 progenyworking levels was reported to be 1.17 × 10⁻⁴. The correct value of 1.17 × 10⁻⁵, as reported in theprevious RESRAD-BUILD user�s manual, should be used in the next revision of the RESRAD-BUILD user�s manual. The user�s manual should also cite the original source for thesecoefficients as well as the source for other factors used in the model, such as the radon inhalationK factors and the dose conversion factors.
In addition to the issues identified previously, the RESRAD-BUILD radon model appears to havethe following limitations.
1. The volume source radon model assumes that diffusion is the dominant transport mechanismfrom source to the room air. This may underestimate the true concentration in the room airbecause it neglects the effects of advective transport mechanisms. Such mechanisms maydominate the transport pathways for certain porous materials or for rooms with changing
Verification of RESRAD-BUILD, Version 3.1
Tetra Tech NUS, Inc. Page 113 03/31/03
pressure differentials over time, such as when a ventilation system alternates between on andoff, as is the case in many residential settings.
2. The rate constants used in the RESRAD-BUILD radon progeny model in Table C.1 of theuser�s manual. There is no way for the user to adjust the attached fractions for the radonprogeny in the current version of the code. In addition, Table C.1 provides a range of valuesfor attachment rate and the plate-out rate that span one and two orders of magnitude,respectively. The code uses only a single value from this range, but this value is not specifiedin Appendix C of the user�s manual. The values of these parameters may be very differentfor the range of possible RESRAD-BUILD scenarios, ranging from demolition (high averagedust loading and inhalation rates) to residential (low average dust loading and inhalationrates). Therefore, it is recommended that the user be given access to these parameters, andthe user�s manual expand on Table C.1 by providing default values for a representative rangeof scenarios.
3. The radon dosimetry is based on the concept of working level months (WLM), a measure ofdose specific to radon exposures, and is not directly tied to the inhaled concentrations ofradon progeny as might be calculated by an inhalation rate. According to Appendix C of theuser�s manual, some adjustment using a �K� factor and dose conversion factors is made toconvert from WLM to standard dose units. This multiplication factor takes into considerationthe different effects of indoor occupancy, typical dust loading, and inhalation rates relative toexposures in radon in mine workers. While the user�s manual provides the default values for�K� used by the code, the user cannot change this factor. However, the RESRAD-BUILDradon model should be more flexible since it can apply to a large number of differentexposure scenarios, ranging from demolition (high average dust loading and inhalation rates)to residential (low average dust loading and inhalation rates). Therefore, it is recommendedthat the user be given access to this parameter, and the user�s manual be revised to include atable of default values of �K� for a representative range of scenarios.
Tritium Model
The tritium model, described in detail in Appendix G of the user�s manual, was verified for allsource types, but in greater detail for the volume source. There were some issues that arose withhow RESRAD-BUILD calculates the tritium dose to an exposed individual. The methodologydescribed in the user�s manual, and verified in this report, is to account for the dose by dermalabsorption by increasing inhalation dose by 50%. This methodology suffers from an obviousflaw in those cases where the inhalation rate is set to zero for receptors assumed to be wearingrespirators, resulting in an inhalation and dermal absorption dose of zero. One solution to thiscase is to include a parameter for the respiratory protection factor for tritiated water vapor (orother gases). This parameter could also be extended to account for respiratory protection fromparticulates only, so that radon and tritium inhalation doses might still be incurred by the receptorwithout having to set the inhalation rate to zero to model the use of respirators. Since onlytritiated water vapor would contribute significantly to the dermal absorption dose, this solutionwould also more accurately model the contributions of tritium released as, or attached to,particulates.
Regarding the volume source model, the model considers only diffusion, rather than advection,possibly underestimating the release rate. In addition, the model does not consideradsorption/desorption, atomic exchanges with hydrogen, or isotopic effects. Some of theselimitations are recognized in the user�s manual, but the impacts of neglecting these effects are notquantified.

Verification of RESRAD-BUILD, Version 3.1
Tetra Tech NUS, Inc. Page 114 03/31/03
Additional problems were identified when reviewing the tritium volume source parameters.These problems are described in Section 2.2.7 and prevented the full verification of the tritiumvolume source model. While there may be no need to increase the complexity of the tritiummodel, the problems identified in the existing model should be fixed. The current user�s manualsimply recommends that the vaporization model in RESRAD-BUILD be used for screeningpurposes only, but does not specify whether the calculated results are conservative. The manualshould be updated to give the user a better sense of the tritium model�s strengths or weaknesses intypical RESRAD-BUILD applications.
Mass Balance Issues (Ingestion/Inhalation Models)
The RESRAD-BUILD code does not check whether the amount of source intake exceeds theavailable source. It is possible to adjust parameters such as breathing and ingestion rates to farexceed the inventory of the source. While the user�s manual provides a warning that the userneeds to check the parameter values that are used, the code could do a better job at limitinginadvertent user errors. At a minimum, the code should limit the breathing and ingestion rates tophysiologically realistic maxima. Another simple solution would be to compare the total activityintake summed over all the receptors against the source inventory for each radionuclide. Othermore sophisticated diagnostic tests may be feasible, but these two methods would provide asimple first step towards warning to the user that there is a gross mass balance problem.

Verification of RESRAD-BUILD, Version 3.1
Tetra Tech NUS, Inc. Page 115 03/31/03
5 Documents Used for Verification
The following list of reference documents includes all of those that were used to verify theRESRAD-BUILD code. There was some initial delay during the verification project in acquiringthe main source document, the RESRAD-BUILD user�s manual. This required that theverification tasks be suspended until this document became available. There were no otherdifficulties in obtaining the remaining documents.
Eckerman et al. 1988
K.F. Eckerman, A.B. Wolbarst, and A.C.B. Richardson, Limiting Values of RadionuclideIntake and Air Concentration and Dose Conversion Factors for Inhalation, Submersion,and Ingestion, EPA 520/1-88-020, Federal Guidance Report No. 11, U.S. EnvironmentalProtection Agency.
Eckerman and Ryman 1993
Eckerman, K.F. and Ryman, J.C, External Exposure to Radionuclides in Air, Water, andSoil, EPA-402-R-93-081, Federal Guidance Report No. 12, Environmental ProtectionAgency.
Grove 1996
Grove Engineering, �MicroShield 5.0,� Rockville, Maryland.
ICRP 1983
International Commission on Radiological Protection, Radionuclide Transformations,Energy and Intensity of Emissions, ICRP Publication 38, Annals of the ICRP, PergamonPress.
Kamboj et al. 1998
S. Kamboj, C. Yu, and D.J. LePoire, External Exposure Model Used in the RESRADCode for Various Geometries of Contaminated Soil, ANL/EAD/TM-84, EnvironmentalAssessment Division, Argonne National Laboratory, September.
Kamboj et al. 2001
S. Kamboj, C. Yu, B.M Biwer, and T. Klett, RESRAD-BUILD Verification,ANL/EAD/TM-115, Environmental Assessment Division, Argonne National Laboratory,October.
Shleien 1992
B. Shleien, editor, The Health Physics and Radiological Health Handbook, RevisedEdition, Scinta Publishers, Silver Springs, MD.
Trubey 1991
D.K. Trubey, New Gamma-Ray Buildup Factor Data for Point Kernel Calculations:ANS-6.4.3 Standard Reference Data, NUREG-5740, ORNL/RSIC-49, prepared by OakRidge National Laboratory, Oak Ridge, TN, for U.S. Nuclear Regulatory Commission,Washington, D.C., August.

Verification of RESRAD-BUILD, Version 3.1
Tetra Tech NUS, Inc. Page 116 03/31/03
WISE 2000
WISE Uranium Project, Universal Decay Calculator, November 27. Available online at:http://www.antenna.nl/wise/uranium/rcc.html
Yu et al. 2001
C. Yu, D.J. LePoire, J.-J. Cheng, E. Gnanapragasam, S. Kamboj, J. Arnish, B.M. Biwer,A.J. Zielen, W.A. Williams, A. Wallo III, H. Peterson, Jr., User�s Manual for RESRAD-BUILD Version 3, ANL/EAD-5, Environmental Assessment Division, Argonne NationalLaboratory, November.