verification report smartcim system, smart interoperable
TRANSCRIPT

Verification Report
ETV02/2017
SmartCIM system, smart interoperable electronic
active valve, with control software eco-system
By Cav. Uff. Cimberio Spa
Author: Giuseppe Lo Grasso
Reviewed by: Sabrina Melandri
Approved by: Claudia Gistri
Version: rev_final_20171117

Verification Report _rev_final_20171117_CIMBERIO_SMARTCIM Pag. 2
ETV02/2017
Table of Contents
1. INTRODUCTION
1.1 Name of technology
1.2 Name and contact of Proposer
1.3 Name of verification body and responsible for verification
1.4 Organization of verification, experts, verification process
1.5 Changes vs the specific verification protocol
2. DESCRIPTION OF TECHNOLGY AND APPLICATION
2.1 Summary description of the technology 2.2 Application and relevant alternative
2.3 Environmental benefits
3. EXISTING DATA
3.1 Existing data and evaluation of the need of specific tests
4. DESCRIPTION OF LABORATORY TEST ON EQUIPMENT
4.1 Description of test elaboration and installation of equipment
4.2 Main objectives of tests and description of instruments
5. EVALUATION
5.1 Evaluation of test results
5.2 Verification parameters and tests results
5.3 Evaluation of uncertainty and stability of measures
5.4 Test run conditions evaluation
5.5 Test results quality evaluation
6. VERIFICATION RESULTS
6.1 Performance claim
6.2 Conclusions and considerations
7. QUALITY ASSURANCE OF VERIFICATION PROCESS
8. REFERENCES
9. ANNEXES
ANNEX 1. CIMBERIO _CQY_MOD QUICK SCAN ETV_29052017 signed
ANNEX 2. SPECIFIC VERIFICATION PROTOCOL rev_final_20170731
ANNEX 3. TESTPROCEDURE_SMARTCIM_FINAL
ANNEX 4. TEST REPORT – ReLAB - ENE-RE-C0217-RP-01_firmato

Verification Report _rev_final_20171117_CIMBERIO_SMARTCIM Pag. 3
ETV02/2017
1. INTRODUCTION Environmental technology verification (ETV) is an independent assessment of the performance of a
technology or a product for a specified application, under defined conditions and quality assurance
1.1 Name of technology
SmartCIM system, smart interoperable electronic active valve, with control software eco-system.
1.2 Name and contact of Proposer
cav. uff. GIACOMO CIMBERIO s.p.a
28017 San Maurizio d'Opaglio (NO) - Italy - Via Torchio, 57 - C.P. 106
Tel. +39 0322 923001 - Contact person: Tiziano Guidetti
Email: [email protected]
1.3 Name of verification body and responsible for verification
The verification is performed by Certiquality S.r.L. Via G. Giardino 4, 20123 Milano
Telephone: + 39028069171
The appointed verification expert is: Giuseppe Lo Grasso ;
Phone +39 071 7822095; +334 5727136
Email: [email protected]
1.4 Organization of verification, experts, verification process
As mentioned above the verification was managed by Certiquality according to the flow chart of the
organizations involved in the process:
Figure 1: Organizations involved in the EU ETV pilot:
The Certiquality expert will be supported by an external qualified person on laboratory quality.
Lab quality expert: Dr. Marina Mari
Certiquality auditor/expert: Ing. Giuseppe Lo Grasso
Proposer
Verification Body (CQY)
External Expert
Internal Expert
Test Body
RELAB - ENERSEM

Verification Report _rev_final_20171117_CIMBERIO_SMARTCIM Pag. 4
ETV02/2017
This innovative technology is at a pilot stage, but almost ready to the market. To conduct the tests for EU
ETV the proposer chose ENERSEM srl to prepare the test procedure and the test plan and RELAB laboratory
located at Department of Energy, Politecnico of Milano-Bovisa to run the performance tests.
The verification process will follow the steps listed below with the relevant documentations:
Table 1: Main phases of the verification process:
Step Responsible Document
Preparation Verification Body Quick Scan
Contract with Proposer
Specific Verification Protocol
Testing Test Body Test Plan
Test Report
Verification Verification Body Verification Report
Statement of Verification
The statement of verification will be issued by Certiquality after conclusion of the verification process.
A detailed table in section 7 Quality assurance of verification process provides more explanation.
1.5 Changes vs the specific verification protocol
There were not significant changes to the protocol: the proposed schedule were followed.
2. DESCRIPTION OF TECHNOLOGY AND APPLICATION
2.1 Summary description of the technology
The project relates to the development of an innovative product-service offer that intends to revolutionise
the hydronic market. SmartCIM value aims at transforming water distribution valves from simple actuators
of the Heating Ventilating Air Conditioning (HVAC) distribution systems into smart active nodes that can
control with great accuracy quantities flowing through and interoperate with other components of the
system (coils, thermostat, pumps) in such a way as to deliver the exact amounts of heat/cooling in each
zone served with minimal amount of water and losses. In a nutshell, smart valves shall enable smart,
efficient HVAC plants.
The new valve technology is based on the deep integration of sensors and actuators; software eco-system
makes the valve interoperable with other hydronic components, enables seamless implementation of
advanced controls and allows monitoring from the internet. SmartCIM is among the first valves with IoT
(Internet of Things) features, including monitoring/user feedback on mobile devices (at present there are
only few companies manufacturing valves which can be run by Internet).
2.2 Application and relevant alternative
In HVAC plants heating and cooling are regulated by balance of heat/cool load served from the heat/cool
terminals. In such conditions, it is possible to regulate the flow to the terminals, opening the valves, while
reducing pump velocity, as none of the terminal requests a different power level. The saving is less when
the thermal load is unbalanced, as one or more of the rooms served by the plant would need more power
than the others, so a certain degree of dissipation will occur in the terminals serving the less requesting
rooms, where the valves will be partially closed to reduce the flow.

Verification Report _rev_final_20171117_CIMBERIO_SMARTCIM Pag. 5
ETV02/2017
At present PICVs (Pressure Independent Control Valves) represent the most advanced and relevant
alternative and the state-of-art; they feature an internal mechanical device (diaphragm) to regulate the
flow rate regardless of pressure fluctuations. An electric actuator modulates the flow rate in response to
the Building Management System (BMS). Then PICVs are not active and control elements, but rather
passive actuators operated by an external BMS control, with self-adjusting mechanical adaptation to plant
conditions. PICVs allow indirect control of HVAC plants, where actuators (generators, valves, pumps, fan
coils) are regulated to achieve a target set point of ambient temperature in each zone where a thermostat
is on. Actuation is controlled by the BMS using room temperature as the measured output. Control is
indirect because there are two systems in between actuators and output, i.e. the building and hydronic
plant with their characteristics. This creates lags and imprecision in control resulting in losses and
instabilities. A typical situation occurs when valves are opened until air reaches set point. When differential
over-pressure (>2,5bar) occurs in the plant, valves have trouble maintaining proper flow and closing against
that pressure. Under such common circumstances, valves could take up to 30 minutes to respond to
flow/temperature changes. Meanwhile, a lot of chilled water passed through the system, causing
unnecessary operational costs. Another typical situation occurs when actuators are not precise enough to
reach set point temperature and control bounces on and off until the target is reached. Such ‘hunting’
causes discomfort and unnecessary losses.
On the other hand the control enabled by SmartCIM is direct and provides much richer information, since
each valve measures flow rate, temperature and heat flow passing through, giving following advantages:
• control of flow rate is direct for each valve, thus giving the possibility to perform optimal zone control
with minimal amount of water (savings in the pump) in any service conditions
• combined control of valve-fan coil is implemented, fan speed can be adjusted depending on flow rate
• heat flow delivered in each fan coil/radiator is measured by the valve, thus allowing refined analysis of
consumption in each zone served
• flow rate and pressure measured in each valve contain detailed information on the operation of each
branch of the hydronic plant, suitable to allow early detection of drifts or malfunctioning
• flow rate measure in combination with wireless communication enables a smart commissioning
procedure where the target flow rate can be set up in less than one minute using the actuator as the tuner.
The valve becomes an active node of the distribution plant that enables smarter controls and demand
management strategies.
2.3 Environmental benefits
Benefits in application are substantial in terms of electrical power savings by: 1) drastically reduce power
for pumping; 2) cut parasitic losses due to membrane pre-load in PICVs.
At present, no other environmental benefits can be considered.
3. EXISTING DATA
3.1 Existing data and evaluation of the need of specific tests
Since at the beginning of the verification process no fully reliable performance data were available, the
Proposer and the Verification Body agreed to develop specific test plan in order to verify and validate the
claim. In the next chapter it is described the summary of the agreed test plan.

Verification Report _rev_final_20171117_CIMBERIO_SMARTCIM Pag. 6
ETV02/2017
4. DESCRIPTION OF LABORATORY TEST ON EQUIPMENT
4.1 Description of test elaboration and installation of equipment
The tests were organized and managed by ENERSEM srl, a new spin-off company (founded 2016) which
develops broad-spectrum innovative solutions in the energy sector, on the basis of expertise generated
from research projects at Politecnico of Milano.
As stated in verification protocol, no official method are available for the type of parameters which were
verified. The test methodology was developed by Enersem S.r.l. [see ANNEX 3. TEST
PROCEDURE_SMARTCIM_FINAL] and performed by ReLAB laboratory, a well equipped Laboratory of
Politecnico, located at new Department of Energy, Politecnico of Milano-Bovisa. ReLAB is accredited for UNI
CEI EN ISO/IEC 17025:2005 [See also ANNEX 3 and ANNEX 4 of Specific Verification Protocol for
accreditation details].
The panel with all equipment to be tested (the complete hydraulic scheme) were prepared by Cimberio
R&D Department and was placed in the climatic chamber maintained at a temperature of 25°C± 2 °C.
The hydraulic scheme of circuit, shown in figure 2, consists in: 3 parallel branches in which 3 pressure
independent control valves (PICV) used for the comparison, 3 smart control valves (SmartCIM) e 3
flowmeters were installed. A series of manual valves allowed the selection of the pressure independent
control valves (PICV) instead of smart control valves (SmartCIM) and vice versa. While hydraulic lines,
between the branches, and further manual valves allowed the connection in series of the flow rate meters.
The 3 flowmeters allowed independent flow rate measurements of each branch. These measurements
were not used as reference.
Figure 2 test facility:
Verification Report _rev_final_20171117_CIMBERIO_SMARTCIM Pag. 7
ETV02/2017
The reference flowmeter was installed in place of the stub pipe; while the hydraulic circuit was filled with
tap water through the filling tap and pressurized until 3 bar. The pump and the electric board were
“energized” through “metered” sockets. A temperature probe (PT100) was installed for monitoring the
water temperature within the hydraulic circuit during the tests; two differential pressure gauges were
installed close by the two balancing valves: one for measuring the pressure drop at balancing valve M1; the
other one for measuring the pressure drop at the 3 branches (M2).
4.2 Main objectives of tests and description of instruments
The main objective of the tests is to assess the performances of the SmartCIM valve compared to the Best
Available Technique (BAT). At present the Pressure Independent Control Valve (PICV) valve is the only
available best technology for commissioning and tuning of HVAC plants.
At the beginning of the experimentation the Proposer Cimberio had to choose a PICV valve suitable to be
compared with the new SmartCim system. Among different manufacturer datasheets, they checked the
technical characteristics of each valve and mainly the value of start-up pressure: this parameter shows the
minimum pressure needed in the pipe at which the PICV valve starts opening and working in the right way,
giving constant flow rate in a specific range. As it can be seen in different datasheets, the start-up pressure
value is quite different for all manufacturers, ranging from 16 kPa to 50 kPa and depending on the valve
size and actual flow rate inside. For this reason the Proposer decided to use, as a comparison, a PICV valve
of his standard production, i.e. model 717HF DN15 (with a nominal start-up pressure value of 13-19 kPa),
corresponding to the lower value of previous range: so the tests did not aid the new SmartCim system in
any way, as they were run against a PICV valve with one of the minimum head loss among the competitors.
All datasheets used for comparison are available upon request.
Main data of tested valves are listed in table 2:
Table 2: tested valves
Denominazione Internal lot Type – Nominal flow
SmartCIM valve 1717 SmartCim 15 – 600 l/h
PICV valve 1440 Cim 717HF 96 – 483 l/h
The comparison was made by monitoring the electrical power requested among 3 different scenarios:
A) PICV valve, the BAT and also the reference BASELINE, was compared with scenarios B) and C) that
performed a lower electric power, mainly the last C).
B) new SmartCIM valve with a steady flow rate given from circulation pump
C) new SmartCIM valve with advanced control strategy by automatic adjustment of pump rotational speed
All comparisons have been made among scenarios B) and C) towards scenario A) i.e. the BASELINE, which is
so the baseline for each parameter.
To better compare the two different technologies in different working conditions, a total of 28 tests were
carried out, choosing rate that are representative of two different terminals at two levels of nominal flow
full load, i.e. Q nom 650 l/h and 1230 l/h. Then 3 partial flows were tested too, to appraise the savings at
terminal partial load, so the equipment was tested at 100%, 75%, 50%, 25% for each Q nom: in this way all

Verification Report _rev_final_20171117_CIMBERIO_SMARTCIM Pag. 8
ETV02/2017
the possible plant conditions were simulated and the results of tests can give a complete picture of the real
working of a standard HVAC plant: for better understanding when speaking of Q nom, its value is referred
to total flow rate measured by main Fr instrument, that measures the sum of flow rate of the three valves,
i.e. in each valve flows 1/3 of total Q nom.
As described in Test Procedure SmartCIM 20170710, the following devices, instruments and related
variables were utilized and measured:
- 1 variable speed pump with remote control;
- 2 manual balancing valves for the local pressure drops; only M1 is regulated, while M2 must be
always shut;
- 1 Electric board located on the back of the panel in which also the control was included;
- 2 taps: one for filing and the other for emptying hydraulic circuit;
- 1 reference (laboratory’s) flowmeter, Fr
- 2 reference (laboratory’s) differential pressure drops , Dp1, Dp2
- 2 reference (laboratory’s) energy meter, EE1, EE2
- 1 reference (laboratory’s) water temperature (PT100)
- In controlled ambient air (temperature, humidity and pressure)
All references of instruments are reported in final test report page 18 released by RELAB [see ANNEX 4.
TEST REPORT – ReLAB - ENE-RE-C0217-RP-01_firmato].
5. EVALUATION
5.1 Evaluation of test results
The complete campaign of tests has been carried out by RELAB Laboratory on July 12-14th 2017 according
to the standards mentioned in “TEST PROCEDURE_SMARTCIM_FINAL”.
The first step was the VERIFICATION PHASE consisting on checking the 3 flow rate meters F1, F2, F3 in
comparison with the reference meter Fr. To simplify this test, it was set up a special distribution network
by opening and closing the manual valves, in order to send the same flow rate in each flowmeter, one
another put in series, as described in table 1 page 8 of final TEST REPORT.
The tested mass flow rates were 100, 150, 300, and 450 l/h for each flow rate meter. These checks were
repeated twice with a total of 8 tests. The whole set of checks showed acceptable values of measurement
error, measurement stability and uncertainty of measure also for commercial meters, not periodically
calibrated, as showed in tables 4, 5 and 6, see page 11-12 of TEST REPORT final by RELAB.
The second step, after this preliminary Verification Phase, the most important one, was the POWER
REDUCTION ASSESSMENT whose scope was to measure the real performance of the new technology
SmartCIM in comparison with present BAT (PICV valve). To better compare the two different technologies
in different working conditions, a total of 28 tests were carried out. The test scenarios identified as A), B)
and C) are described in previous paragraph 4.2.
In this Verification Report are enclosed only the main results of tests. In final test report released by RELAB,
[ANNEX 4. TEST REPORT – ReLAB - ENE-RE-C0217-RP-01_firmato] is enclosed the complete results and data
elaboration.
Verification Report _rev_final_20171117_CIMBERIO_SMARTCIM Pag. 9
ETV02/2017
The results of final test report show that the new SmartCIM valve can save electrical energy, decreasing
the power requested by circulation pump. It must be added that the most power saving is obtained at low
flow rates into the distribution network of a HVAC plant.
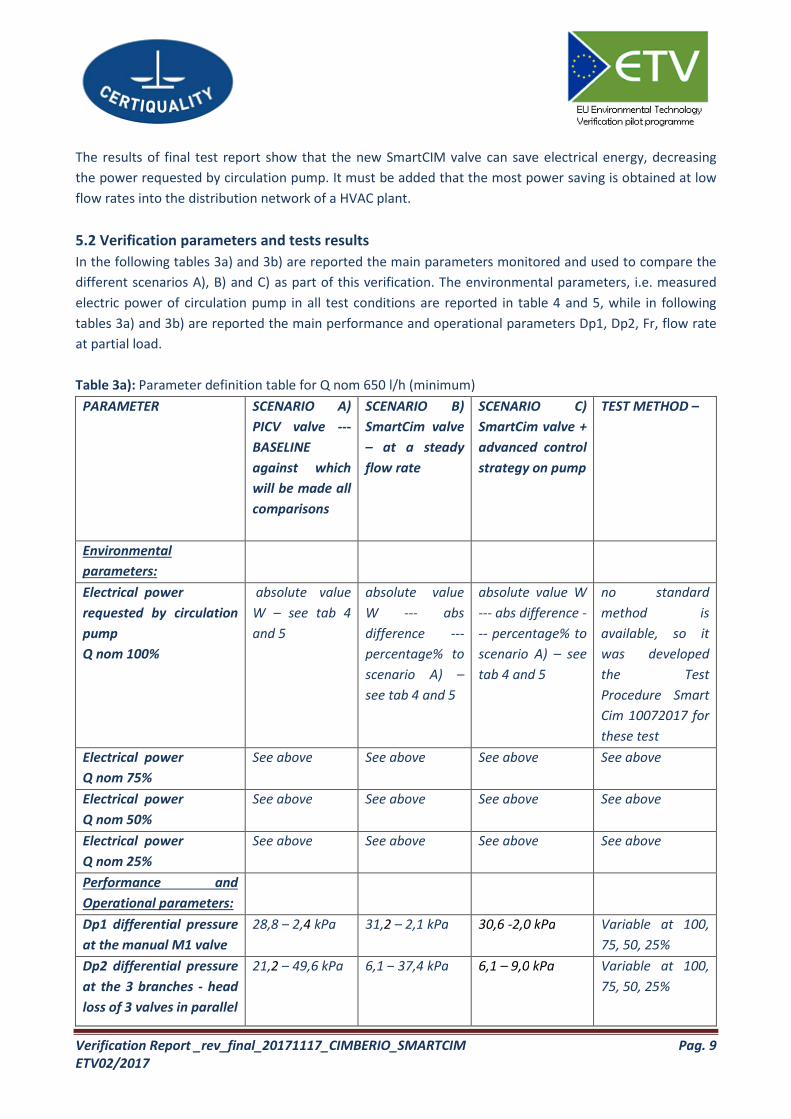
5.2 Verification parameters and tests results
In the following tables 3a) and 3b) are reported the main parameters monitored and used to compare the
different scenarios A), B) and C) as part of this verification. The environmental parameters, i.e. measured
electric power of circulation pump in all test conditions are reported in table 4 and 5, while in following
tables 3a) and 3b) are reported the main performance and operational parameters Dp1, Dp2, Fr, flow rate
at partial load.
Table 3a): Parameter definition table for Q nom 650 l/h (minimum)
PARAMETER SCENARIO A)
PICV valve ---
BASELINE
against which
will be made all
comparisons
SCENARIO B)
SmartCim valve
– at a steady
flow rate
SCENARIO C)
SmartCim valve +
advanced control
strategy on pump
TEST METHOD –
Environmental
parameters:
Electrical power
requested by circulation
pump
Q nom 100%
absolute value
W – see tab 4
and 5
absolute value
W --- abs
difference ---
percentage% to
scenario A) –
see tab 4 and 5
absolute value W
--- abs difference -
-- percentage% to
scenario A) – see
tab 4 and 5
no standard
method is
available, so it
was developed
the Test
Procedure Smart
Cim 10072017 for
these test
Electrical power
Q nom 75%
See above See above See above See above
Electrical power
Q nom 50%
See above See above See above See above
Electrical power
Q nom 25%
See above See above See above See above
Performance and
Operational parameters:
Dp1 differential pressure
at the manual M1 valve
28,8 – 2,4 kPa 31,2 – 2,1 kPa 30,6 -2,0 kPa Variable at 100,
75, 50, 25%
Dp2 differential pressure
at the 3 branches - head
loss of 3 valves in parallel
21,2 – 49,6 kPa 6,1 – 37,4 kPa 6,1 – 9,0 kPa Variable at 100,
75, 50, 25%
Verification Report _rev_final_20171117_CIMBERIO_SMARTCIM Pag. 10
ETV02/2017
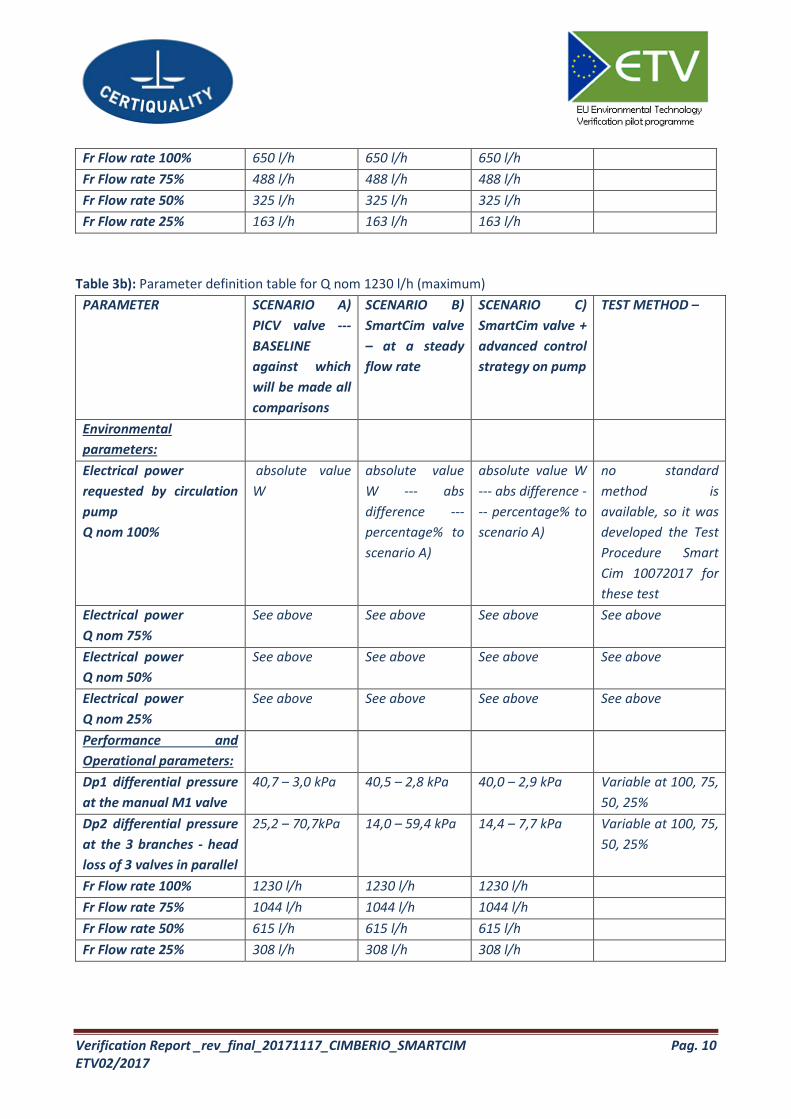
Fr Flow rate 100% 650 l/h 650 l/h 650 l/h
Fr Flow rate 75% 488 l/h 488 l/h 488 l/h
Fr Flow rate 50% 325 l/h 325 l/h 325 l/h
Fr Flow rate 25% 163 l/h 163 l/h 163 l/h
Table 3b): Parameter definition table for Q nom 1230 l/h (maximum)
PARAMETER SCENARIO A)
PICV valve ---
BASELINE
against which
will be made all
comparisons
SCENARIO B)
SmartCim valve
– at a steady
flow rate
SCENARIO C)
SmartCim valve +
advanced control
strategy on pump
TEST METHOD –
Environmental
parameters:
Electrical power
requested by circulation
pump
Q nom 100%
absolute value
W
absolute value
W --- abs
difference ---
percentage% to
scenario A)
absolute value W
--- abs difference -
-- percentage% to
scenario A)
no standard
method is
available, so it was
developed the Test
Procedure Smart
Cim 10072017 for
these test
Electrical power
Q nom 75%
See above See above See above See above
Electrical power
Q nom 50%
See above See above See above See above
Electrical power
Q nom 25%
See above See above See above See above
Performance and
Operational parameters:
Dp1 differential pressure
at the manual M1 valve
40,7 – 3,0 kPa 40,5 – 2,8 kPa 40,0 – 2,9 kPa Variable at 100, 75,
50, 25%
Dp2 differential pressure
at the 3 branches - head
loss of 3 valves in parallel
25,2 – 70,7kPa 14,0 – 59,4 kPa 14,4 – 7,7 kPa Variable at 100, 75,
50, 25%
Fr Flow rate 100% 1230 l/h 1230 l/h 1230 l/h
Fr Flow rate 75% 1044 l/h 1044 l/h 1044 l/h
Fr Flow rate 50% 615 l/h 615 l/h 615 l/h
Fr Flow rate 25% 308 l/h 308 l/h 308 l/h
Verification Report _rev_final_20171117_CIMBERIO_SMARTCIM Pag. 11
ETV02/2017
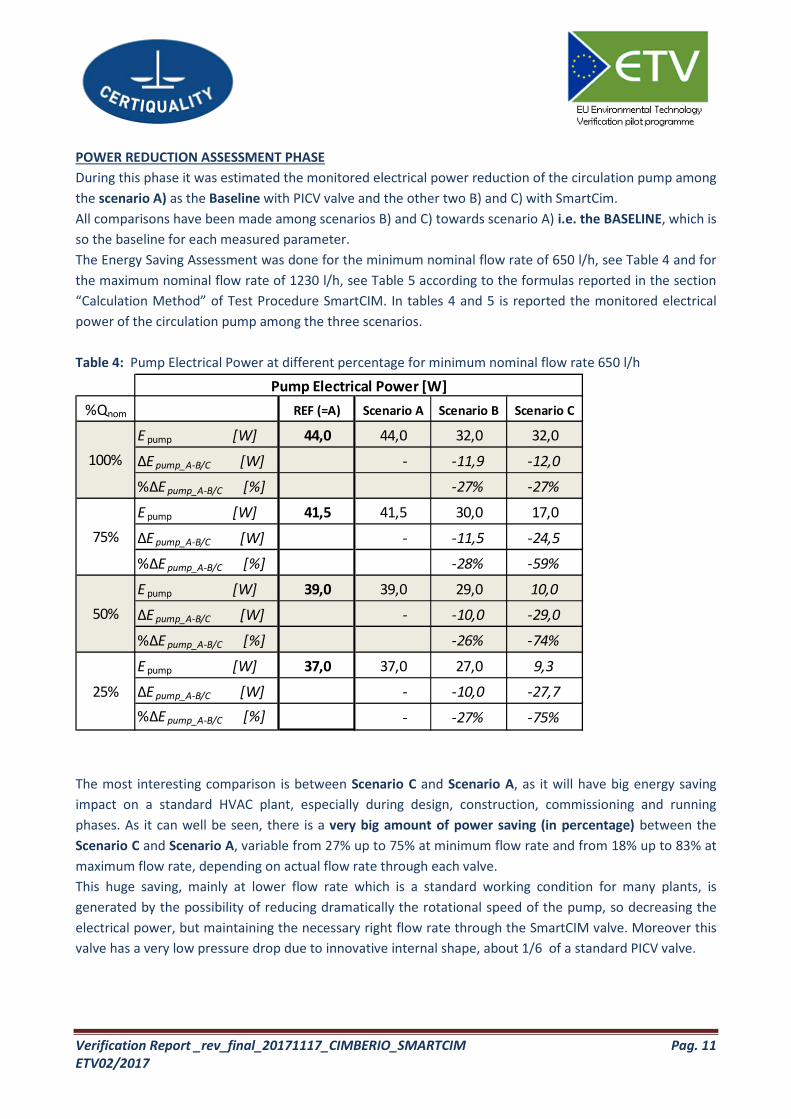
POWER REDUCTION ASSESSMENT PHASE
During this phase it was estimated the monitored electrical power reduction of the circulation pump among
the scenario A) as the Baseline with PICV valve and the other two B) and C) with SmartCim.
All comparisons have been made among scenarios B) and C) towards scenario A) i.e. the BASELINE, which is
so the baseline for each measured parameter.
The Energy Saving Assessment was done for the minimum nominal flow rate of 650 l/h, see Table 4 and for
the maximum nominal flow rate of 1230 l/h, see Table 5 according to the formulas reported in the section
“Calculation Method” of Test Procedure SmartCIM. In tables 4 and 5 is reported the monitored electrical
power of the circulation pump among the three scenarios.
Table 4: Pump Electrical Power at different percentage for minimum nominal flow rate 650 l/h
The most interesting comparison is between Scenario C and Scenario A, as it will have big energy saving
impact on a standard HVAC plant, especially during design, construction, commissioning and running
phases. As it can well be seen, there is a very big amount of power saving (in percentage) between the
Scenario C and Scenario A, variable from 27% up to 75% at minimum flow rate and from 18% up to 83% at
maximum flow rate, depending on actual flow rate through each valve.
This huge saving, mainly at lower flow rate which is a standard working condition for many plants, is
generated by the possibility of reducing dramatically the rotational speed of the pump, so decreasing the
electrical power, but maintaining the necessary right flow rate through the SmartCIM valve. Moreover this
valve has a very low pressure drop due to innovative internal shape, about 1/6 of a standard PICV valve.
%Qnom REF (=A) Scenario A Scenario B Scenario C
E pump [W] 44,0 44,0 32,0 32,0
ΔE pump_A-B/C [W] - -11,9 -12,0
%ΔE pump_A-B/C [%] -27% -27%
E pump [W] 41,5 41,5 30,0 17,0
ΔE pump_A-B/C [W] - -11,5 -24,5
%ΔE pump_A-B/C [%] -28% -59%
E pump [W] 39,0 39,0 29,0 10,0
ΔE pump_A-B/C [W] - -10,0 -29,0
%ΔE pump_A-B/C [%] -26% -74%
E pump [W] 37,0 37,0 27,0 9,3
ΔE pump_A-B/C [W] - -10,0 -27,7
%ΔE pump_A-B/C [%] - -27% -75%
Pump Electrical Power [W]
100%
75%
50%
25%

Verification Report _rev_final_20171117_CIMBERIO_SMARTCIM Pag. 12
ETV02/2017
Table 5: Pump Electrical consumption at different percentage for maximum nominal flow rate 1230 l/h
5.3 Evaluation of uncertainty and stability of measures
Each test was performed under steady state conditions. Once each hydraulic condition (flow and pressure)
was reached and stabilized, then measures were taken for 5 minutes. One measurement every 2 sec, which
means 30 measures per minute, was done for each of the reference instrumentation.
The uncertainties of measurement shall not exceed the values specified in Table 6, based on Standard BS
EN 14511-3:2013: Air conditioners, liquid chilling packages and heat pumps with electrically driven
compressors for space heating and cooling. Test methods.

Verification Report _rev_final_20171117_CIMBERIO_SMARTCIM Pag. 13
ETV02/2017
Table 6: Uncertainties of measurement for indicated values based on BS EN 14511-3:2013
The permissible deviation of the total flow rate and pressure drop at the 3 branches are defined Table 7.
Table 7: Permissible deviations from set values
Measured quantity
Permissible deviation of the
arithmetic mean values from
set values
Permissible deviations of
each
of the individual
measured
values from set values
a/ Total flow rate - reference sensor
- manual regulation of the valves ± 2.0 % ± 4.0 %
- automatic regulation of the valves with
actuator position > 50% ± 5.0 % ± 7.5 %
- automatic regulation of the valves with
actuator position < 50% ± 25 l/h ± 40 l/h
b/ Pressure drop at the 3 branches ± 5% ± 10%
5.4 Test run conditions and quality evaluation
The test run conditions managed by ReLAB were carefully checked during VB Certiquality quality audit step
and finally evaluated by Certiquality experts as consistent with test procedure [see ANNEX 3.
TESTPROCEDURE_SMARTCIM_FINAL] .
According to ETV GVP principles all the tests were run by using recognized International Standards (ie ISO,
ASTM, EN, UNI, etc) or in case relevant standard were missing by using drafts or GLP (Good Laboratory
Practices). The requirements of tests are described in the above-mentioned procedure.

Verification Report _rev_final_20171117_CIMBERIO_SMARTCIM Pag. 14
ETV02/2017
Data storage, transfer and control must be done in accordance with the EU ETV General Verification
Protocol (Version 1.2 - July 27th, 2016 Corrigendum 1 - October 15th, 2016) and furthermore follow the
principles of EN ISO 9001 Quality management systems – requirements (International Standardization
Organisation, 2008). Data management shall enable full control and retrieval of documents and records.
The ReLAB Laboratory is ISO 17025 accredited. A complete evaluation and audit made by Certiquality
confirms that the Laboratory test plans, procedures and manual are consistent with the requirements. The
audit were carried out by a qualified quality auditor of Certiquality with a large expertise of analytical
laboratories.
6. VERIFICATION RESULTS
6.1 Performance claim
On the basis of test results, the initial claim can be confirmed, mainly due to power saving values, as
already stated in paragraph 5.2, ranging, between the Scenario C and Scenario A, from 27% up to 75% at
minimum flow rate and from 18% up to 83% at maximum flow rate, depending on actual flow rate through
each valve.
As it can be seen, the highest power saving is gained at minimum flow rate, i.e. 75% saving at 153 l/h and
83% at 311 l/h. This fact is due to the specific characteristic of a pump which gives the maximum power
saving at the minimum flow rates: this is often a common condition in the distribution network, mainly in
the middle seasons when the HVAC plant do not work at full load.
This situation is well known by designers and plant managers, who would have the possibility to adjust the
main working parameters in a smooth continuous way and a wide range of heating or cooling loads.
Another interesting characteristic of SmartCIM is the very low pressure drop inside the valve, due to special
internal shape, that means a total head loss about 1 / 6 against a standard PICV: this aspect reduces,
besides power of pump, also the mechanical stress in distribution networks with advantages for
maintenance operations. These results are reported in tab 3a) and 3b) for operational parameter Dp2,
which measures the head loss of different valves and running conditions.
For above reasons, this new valve SmartCIM can be considered among the devices to be kept into
consideration during the design of a new plant or in case of revamping of an existing one. Of course the
present performances of this new device shall be deeper investigated in all type of installation to better
state the real advantage of this new technology.
6.2 Conclusions and considerations
The tests made by ReLAB Laboratory have simulated some usual conditions of standard HVAC plants
working with different flow rates, mainly at partial and low mass flow.
The results given by Test Report show that the new SmartCIM system can be considered an energy saving
technology, able to lower the electric power of the circulation pump into a distribution network. As seen
before, the most power benefit is obtained at low flow rates, which can be a common situation generated
by a different thermal load onto a side of a building (i.e. South oriented) or during the middle seasons.
Then as a consequence of reducing the power of pumping station, also the running costs of a HVAC plant
slow down.
At present all measured parameters and saving results are tightly linked to this specific hydraulic facility
used in ReLAB test and nothing can be told about other type of installation.
Verification Report _rev_final_20171117_CIMBERIO_SMARTCIM Pag. 15
ETV02/2017
The further step managed by the Verification Body Certiquality assess that, on the basis of ReLAB Test
Report and related documents, the relevant results are acceptable and sufficient for supporting the
proposer claim.
7. QUALITY ASSURANCE OF VERIFICATION PROCESS The overall process of verification was managed according Certiquality Quality Manual and related
procedures/instructions.
Certiquality is accredited ISO 17021 which requires Certiquality to have a Quality assurance system in line
with ISO 9001. The Italian Accreditation Body (ACCREDIA) verifies every year our conformity.
The staff and the experts responsible for quality assurance as well as the different quality assurance tasks
are reported in Table 8.
The specific verification protocol and the verification report require internal (by verification body) and
external review according to the EU ETV General Verification Protocol (European Commission, 2016). The
internal review for specific verification protocol, verification report and Statement of verification will be
carried out by Sabrina Melandri (SM), as Coordinator of Technology Area “Material, Resources and Waste”.
The internal approval for specific verification protocol, verification report and Statement of verification will
be carried out by Claudia Gistri (CG), as Project Manager of ETV. The external review will be carried out by
Piero Franz (PF).
The verification body will review the test plan and the test report. The review is done by Giuseppe Lo
Grasso (GL) and Marina Mari (MM).
A test system audit is conducted following general audit procedures by qualified auditors (Giuseppe Lo
Grasso for ETV procedures and Marina Mari for laboratory management system) from Certiquality.
During the verification process the proposer CIMBERIO representative Tiziano Guidetti, as Lab Manager,
was in charge of the following tasks:
- Review the specific verification protocol and the verification report
- Review and approve the test plan
- Review and approve the test report
- Accept the Statement of Verification.
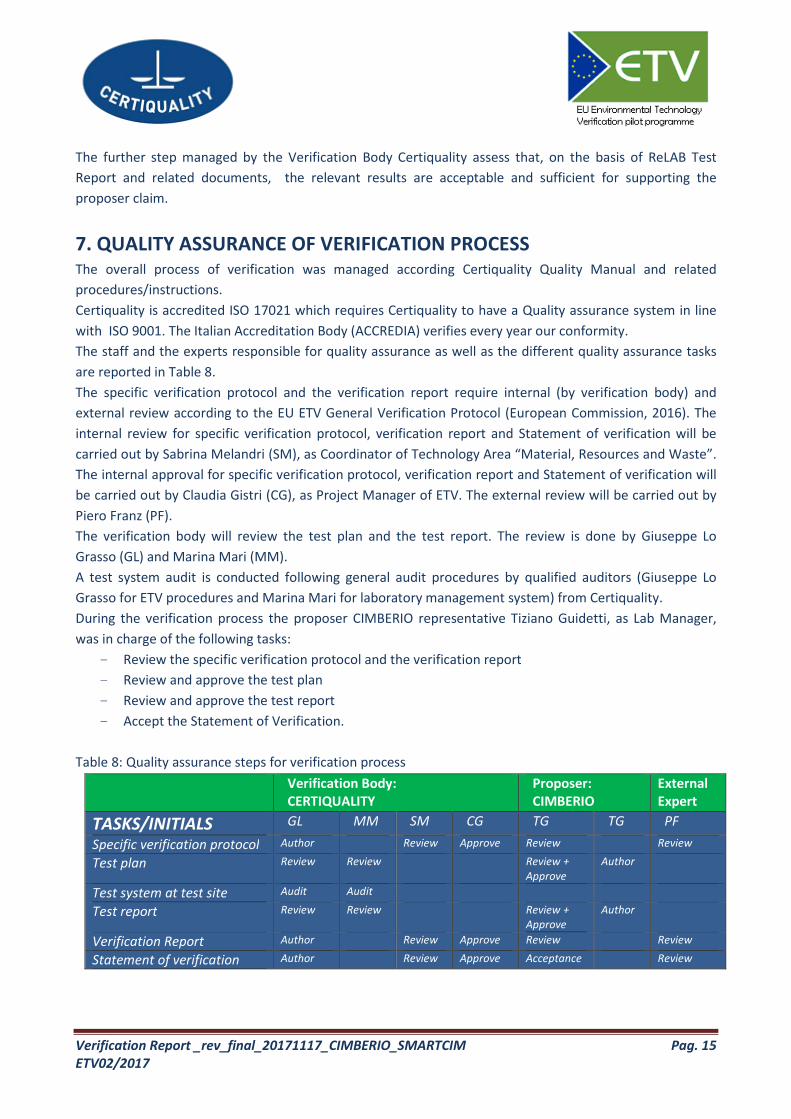
Table 8: Quality assurance steps for verification process
Verification Body:
CERTIQUALITY
Proposer:
CIMBERIO
External
Expert
TASKS/INITIALS GL MM SM CG TG TG PF
Specific verification protocol Author Review Approve Review Review
Test plan Review Review
Review +
Approve
Author
Test system at test site Audit Audit
Test report Review Review Review +
Approve
Author
Verification Report Author Review Approve Review Review
Statement of verification Author Review Approve Acceptance Review

Verification Report _rev_final_20171117_CIMBERIO_SMARTCIM Pag. 16
ETV02/2017
8. REFERENCES 1. European Commission (2014): EU Environmental Technology Verification pilot Programme. General
Verification Protocol. Version 1.2 - July 27th, 2016 Corrigendum 1 - October 15th, 2016
2. Regulation 17020 ETV of Certiquality and internal procedures.