verifications of various improvements to the … · verifications of various improvements to the...
TRANSCRIPT
Verifications of various improvements
to the vibration behavior of old masonry buildings
in Vienna
D. Schäfer, F. Kopf & S. Renna VCE – Vienna Consulting Engineers, Vienna
SUMMARY: (10 pt)
This paper presents experimental investigations on different provisions, which have been executed on a typical
“Gründerzeithaus”(unreinforced masonry building with timber floor) in the 5th
district of Vienna. The
experiments consist of investigations on the load bearing capacity of partition walls and timber ceilings.
Different provisions in order to distribute the vibrations in the building have been tested with various
measurement techniques. The different provisions on the façade wall and the partition wall have been observed
by measurements with conventional three dimensional acceleration sensors and on the other hand with a Laser-
Doppler-Scanning – Vibrometer. These measurements clearly describe the effect of the different provisions and
the vibration behavior of the building.
Keywords: historic masonry buildings, earthquake hazard, vibration behaviour
1. MEASUREMENTS AT FENDIGASSE
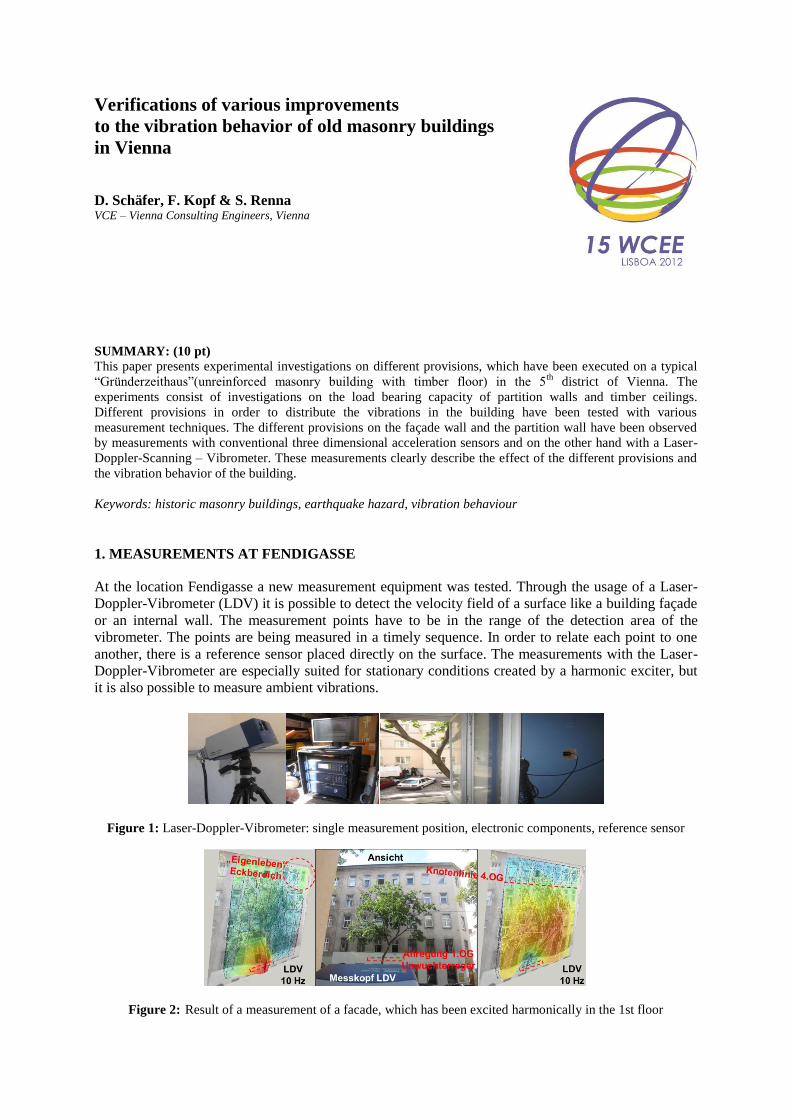
At the location Fendigasse a new measurement equipment was tested. Through the usage of a Laser-
Doppler-Vibrometer (LDV) it is possible to detect the velocity field of a surface like a building façade
or an internal wall. The measurement points have to be in the range of the detection area of the
vibrometer. The points are being measured in a timely sequence. In order to relate each point to one
another, there is a reference sensor placed directly on the surface. The measurements with the Laser-
Doppler-Vibrometer are especially suited for stationary conditions created by a harmonic exciter, but
it is also possible to measure ambient vibrations.
Figure 1: Laser-Doppler-Vibrometer: single measurement position, electronic components, reference sensor
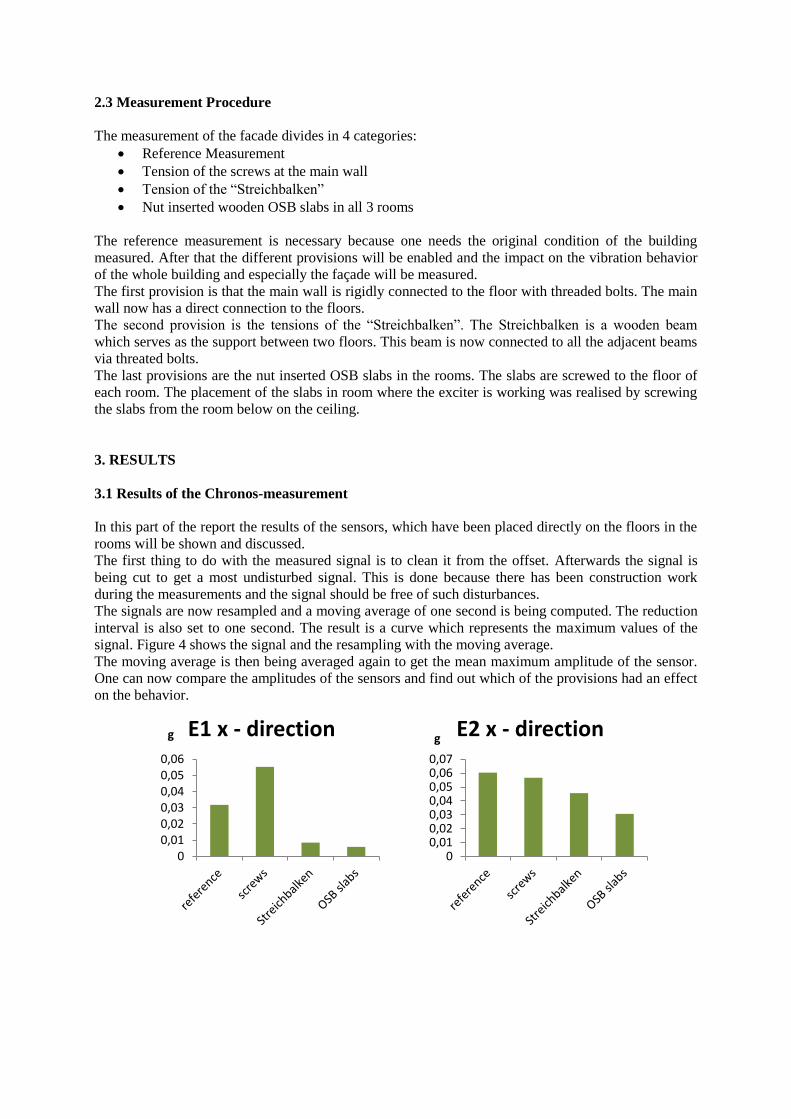
Figure 2: Result of a measurement of a facade, which has been excited harmonically in the 1st floor

The result of the measurement is directly after the measurement available. It is being projected on a
screenshot of the integrated camera and can also be exported as a video.
2. MEASUREMENTS AT THE FACADE OF A BUILDING AT FENDIGASSE
2.1 Settings of the Laser-Doppler-Vibrometer (LDV)
The settings of the LDV have been kept the same for all the measurements that have been conducted
during all these surveys in order to be able to compare them. All the mentioned settings are for the
Laser-Doppler-Vibrometer.
The vibrometer was standing 12 meters away from the facade on the other side of the street. Because
of the little distance and the huge size of the measured surface it was decided to put the vibrometer not
directly in front of the facade but inclined to the wall. Between the laser head and the façade there
were no obstacles so that a relatively homogenous raster of measurement points was created. Only the
windows had to be avoided that the full signal can be reflected and the point can be measured.
The measurement raster was fixed at 98 points. There is the possibility to compute the average of 3
measurements for each point. This would have significantly increased the measurement time so this
option was dropped. The function of measuring a point as often as needed was activated. If a point is
not measured correctly it appears yellow on the screen. If this happens the vibrometer measures this
particular point again but 3 times at maximum. In all the measurements there were only a few points
that had to be measured again and in the end all points were measured correctly.
The measurement time added up to 20 to 29 Minutes for all the 98 points, so in average it took 30
seconds to measure one point. The measurement range was set to 10 mm/s and the frequency band
from 0 to 1000 Hz.
2.2 Measurement Setup
The exciter “Hubert” was placed at the 4th floor of a “Gründerzeithaus” at the location Fendigasse 20.
The exciter operated at two different predefined frequencies: 4,75 Hz and 11,75 Hz. It can be operated
at full weight, where the amplitudes are high and at low weight, where amplitudes are less high. Due
to construction issues the exciter was operated with full weights at 4,75 Hz and without weights at
11,75 Hz.
Figure 3 shows the measurement layout. The sensors are colored in orange, the green circle shows the
exciter and the blue sensor is the reference sensor at the wall (Wilcoxon). The sensor positions were
chosen in order to capture the vibration behavior of the ceiling plate.
Figure 3: Measurement layout
2.3 Measurement Procedure
The measurement of the facade divides in 4 categories:
Reference Measurement
Tension of the screws at the main wall
Tension of the “Streichbalken”
Nut inserted wooden OSB slabs in all 3 rooms
The reference measurement is necessary because one needs the original condition of the building
measured. After that the different provisions will be enabled and the impact on the vibration behavior
of the whole building and especially the façade will be measured.
The first provision is that the main wall is rigidly connected to the floor with threaded bolts. The main
wall now has a direct connection to the floors.
The second provision is the tensions of the “Streichbalken”. The Streichbalken is a wooden beam
which serves as the support between two floors. This beam is now connected to all the adjacent beams
via threated bolts.
The last provisions are the nut inserted OSB slabs in the rooms. The slabs are screwed to the floor of
each room. The placement of the slabs in room where the exciter is working was realised by screwing
the slabs from the room below on the ceiling.
3. RESULTS
3.1 Results of the Chronos-measurement
In this part of the report the results of the sensors, which have been placed directly on the floors in the
rooms will be shown and discussed.
The first thing to do with the measured signal is to clean it from the offset. Afterwards the signal is
being cut to get a most undisturbed signal. This is done because there has been construction work
during the measurements and the signal should be free of such disturbances.
The signals are now resampled and a moving average of one second is being computed. The reduction
interval is also set to one second. The result is a curve which represents the maximum values of the
signal. Figure 4 shows the signal and the resampling with the moving average.
The moving average is then being averaged again to get the mean maximum amplitude of the sensor.
One can now compare the amplitudes of the sensors and find out which of the provisions had an effect
on the behavior.
00,010,020,030,040,050,06
g E1 x - direction
00,010,020,030,040,050,060,07
g E2 x - direction
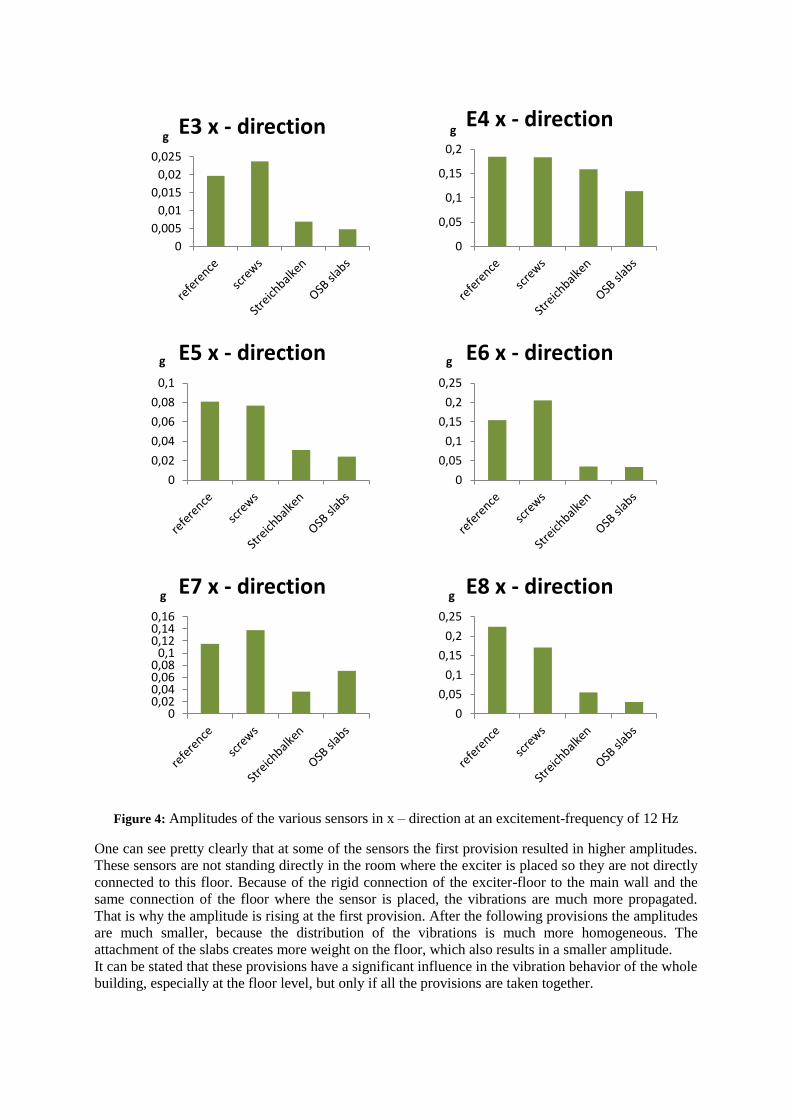
Figure 4: Amplitudes of the various sensors in x – direction at an excitement-frequency of 12 Hz
One can see pretty clearly that at some of the sensors the first provision resulted in higher amplitudes.
These sensors are not standing directly in the room where the exciter is placed so they are not directly
connected to this floor. Because of the rigid connection of the exciter-floor to the main wall and the
same connection of the floor where the sensor is placed, the vibrations are much more propagated.
That is why the amplitude is rising at the first provision. After the following provisions the amplitudes
are much smaller, because the distribution of the vibrations is much more homogeneous. The
attachment of the slabs creates more weight on the floor, which also results in a smaller amplitude.
It can be stated that these provisions have a significant influence in the vibration behavior of the whole
building, especially at the floor level, but only if all the provisions are taken together.
0
0,005
0,01
0,015
0,02
0,025
g E3 x - direction
0
0,05
0,1
0,15
0,2
g E4 x - direction
0
0,02
0,04
0,06
0,08
0,1
g E5 x - direction
0
0,05
0,1
0,15
0,2
0,25
g E6 x - direction
00,020,040,060,08
0,10,120,140,16
g E7 x - direction
0
0,05
0,1
0,15
0,2
0,25
g E8 x - direction
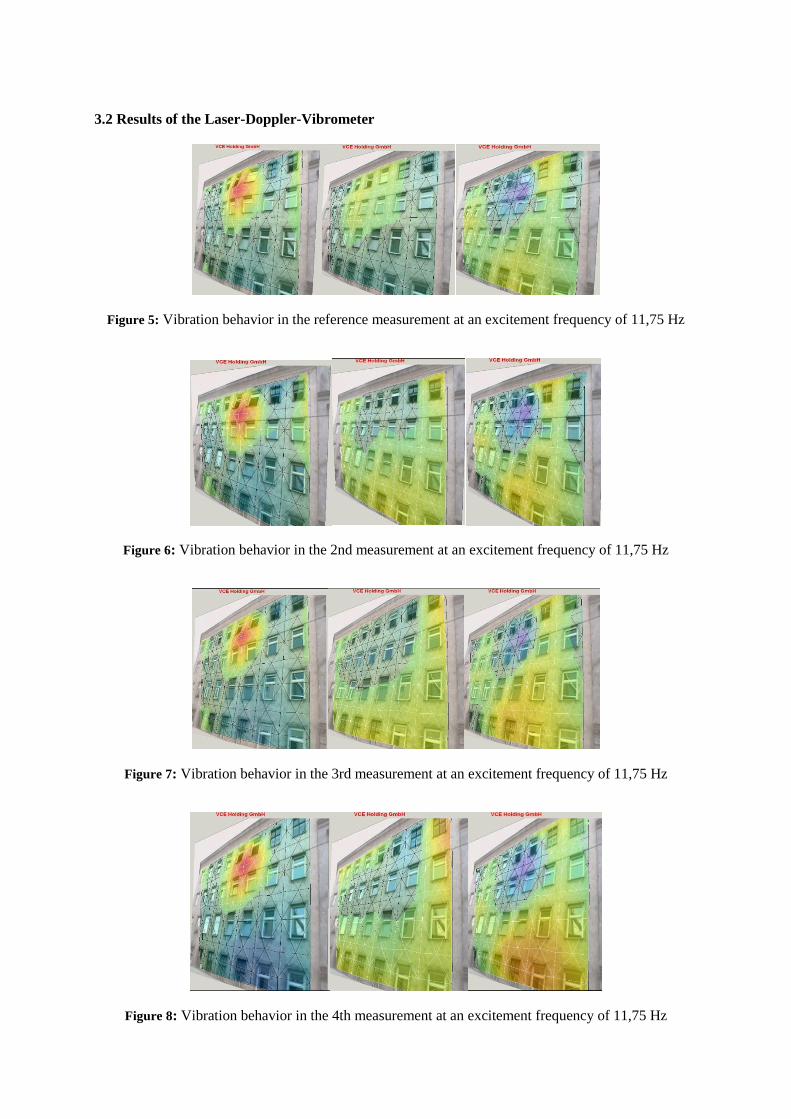
3.2 Results of the Laser-Doppler-Vibrometer
Figure 5: Vibration behavior in the reference measurement at an excitement frequency of 11,75 Hz
Figure 6: Vibration behavior in the 2nd measurement at an excitement frequency of 11,75 Hz
Figure 7: Vibration behavior in the 3rd measurement at an excitement frequency of 11,75 Hz
Figure 8: Vibration behavior in the 4th measurement at an excitement frequency of 11,75 Hz

The measurements show that the provisions have a major influence on the vibration behavior of the
whole building. The reference measurement is showing a clear picture of the amplitude distribution on
the façade. The maximum can be found in the 4th floor, where the exciter was operating. If one looks
at this maximum the same mechanisms as in the Chronos measurement can be found. The first
provision results in a little higher amplitude on the facade, but all the further provisions result in
reducing the amplitudes all over the surface because of the better distribution characteristic throughout
the whole building. In the last picture it can be seen that the maximum amplitude is reduced.
4. MEASUREMENTS AT A PARTITION WALL AT THE LOCATION FENDIGASSE
In Figure 9 one can see the layout of the measurement of the partition wall. This measurement was
conducted in the same building as above, however not the facade but the partition wall was
instrumented and measured. The vibrometer was placed as far away as possible , this is why it was
placed “behind” the door opening.
The excitement of the partition wall was realised through various techniques. The first technique was a
loud speaker (subwoofer) which was placed behind the wall. Various frequencies were tried out, but
the most effective for such a measurement is the periodic sweep. This sweep consists of a constant
periodic frequency slope from 20 Hz up to 20 kHz. This signal was repeated periodically so that every
point is measured with the same frequency characteristic.
Another excitement was tested. Different balls were thrown on the back of the partition wall. In
general this technique worked, but the reproducibility is very hard to realize.
Another trial was done with a medicine ball which was hung from the ceiling of the room which was
below the room with the partition wall. The partition wall was going from the 3rd
floor up to the roof
without any interruptions of any kind. This trial was by far the best one also because of its
reproducibility. The problem is that often one cannot access the room in the lower floor or that the
partition wall is interrupted in some kind.
The last trial was the again the loud speaker, but this time it was placed in front of the wall in the same
room where the vibrometer was standing. This setup was by far the worst and cannot be recommended
in any case. The vibrations of the loud speaker interrupted the measurement in a way that the
vibrometer head was moving constantly in any direction and the measurement was useless.
Figure 9: Measurement layout on the 2nd day: Measurement on the partition wall
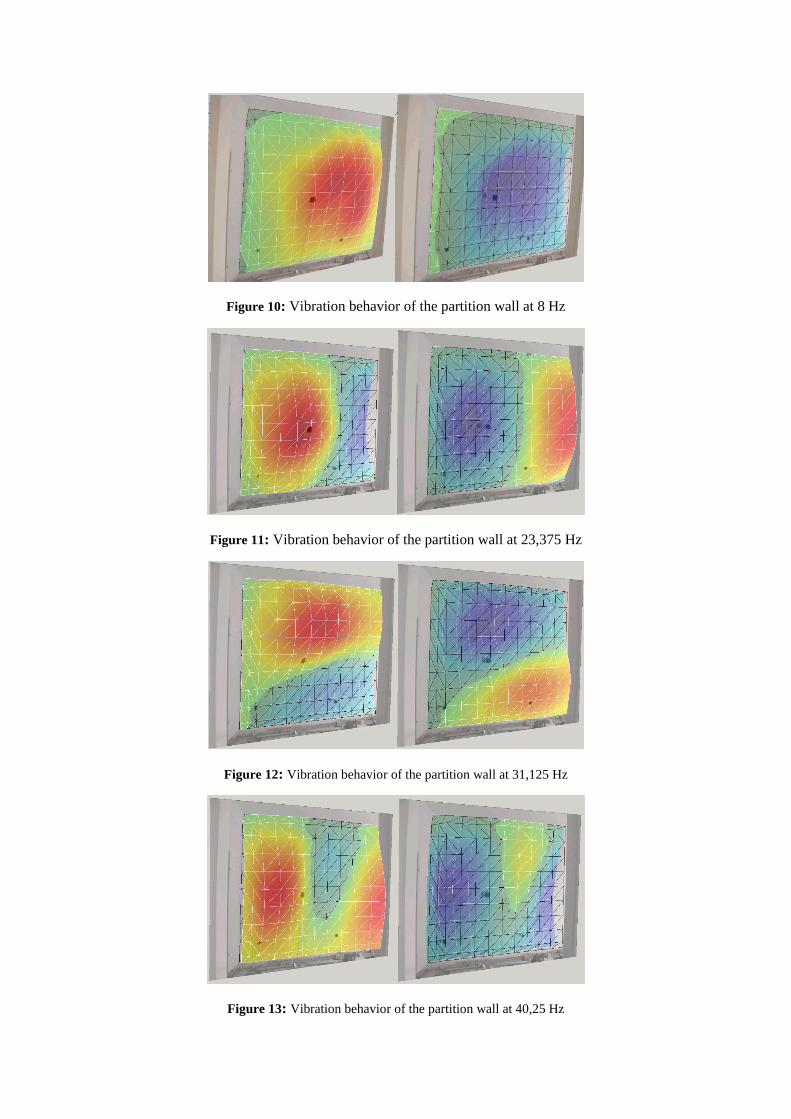
Figure 10: Vibration behavior of the partition wall at 8 Hz
Figure 11: Vibration behavior of the partition wall at 23,375 Hz
Figure 12: Vibration behavior of the partition wall at 31,125 Hz
Figure 13: Vibration behavior of the partition wall at 40,25 Hz
4.1 Numeric Analysis, Verification of the measurements
The formulas of Robert D. Blevins are being used to analytically verify the measured results:
√
(4.1)
For rectangular panels with various boundary conditions (free, simply supported, and clamped) there
are values for λij in the literature. λij is needed to determine the eigenfrequency for different
eigenmodes. The index i gives the number of half-waves in horizontal direction, while j stands for the
number in vertical direction. The green values in in Figure 17 show the measured frequencies and their
corresponding mode is coded as index ij.
With the measured frequencies and theoretically determined values for λij the quotient fij/ λij can be
computed. Through this value the E-modulus can be computed for the geometric conditions and
masses, which then results in the frequency.
(4.2)
The boundary conditions of the partition wall in the 4th floor of the building are by far not the same as
the theoretical and ideal boundary conditions used to compute the analytical values. The better the E-
modules fit to the real case, the more realistic are the boundary conditions.
It can be shown that the base frequency (mode 11) leads to lower E-module values than oscillation of
higher orders. The reason for that could also be because of the higher amplitude in this mode and the
nonlinear behavior of the material. The theoretic boundary conditions, which lead to lower standard
deviations (modes 2,4,8 and 9), are more realistic compared to the real condition.
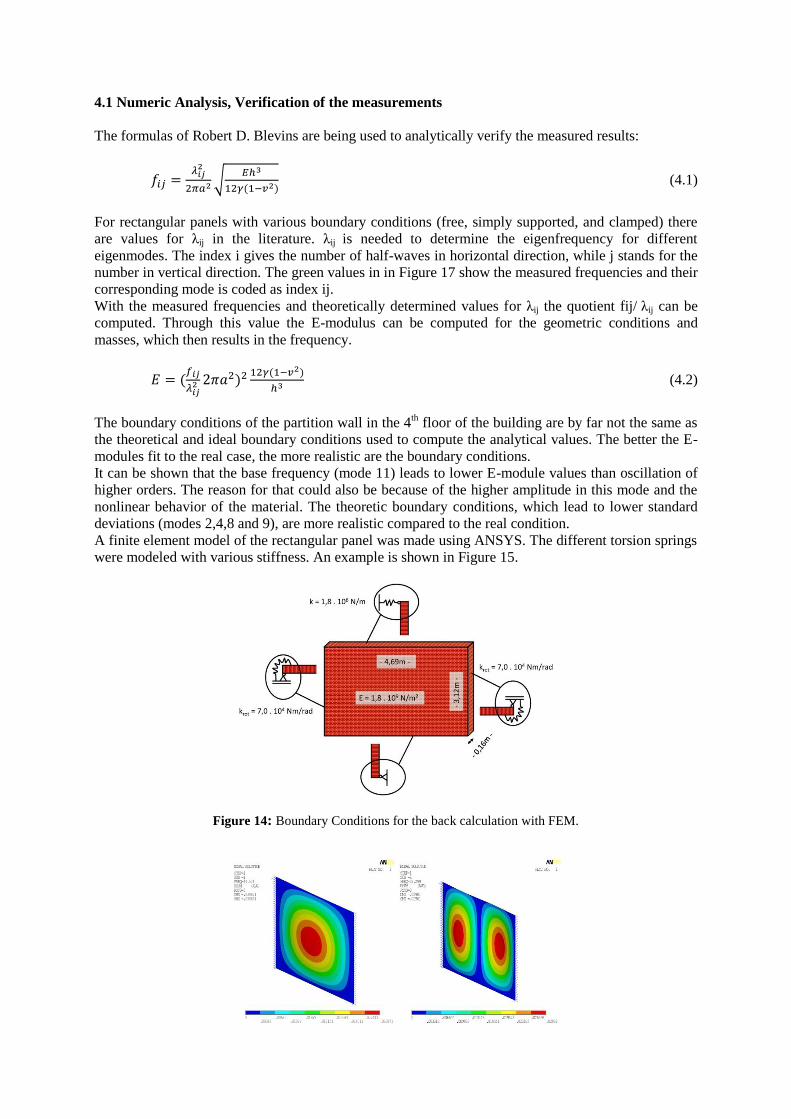
A finite element model of the rectangular panel was made using ANSYS. The different torsion springs
were modeled with various stiffness. An example is shown in Figure 15.
Figure 14: Boundary Conditions for the back calculation with FEM.

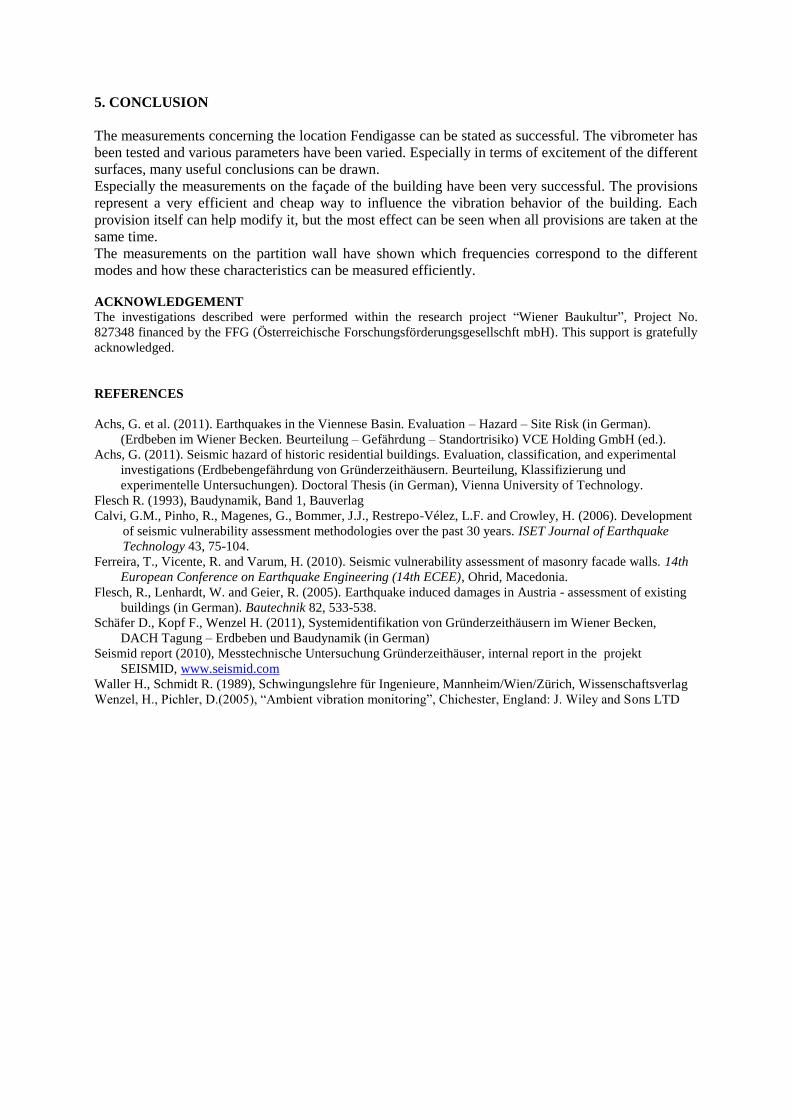
Figure 15: FEM-Calculations of the different modeshapes
The calculations using the finite element method also show that at the ground frequency the
calculations and the measurements do not perfectly match.
Figure 16: Comparison between the measured frequencies (green) and the FEM calculated frequencies (purple)
for the various modes.
5. CONCLUSION
The measurements concerning the location Fendigasse can be stated as successful. The vibrometer has
been tested and various parameters have been varied. Especially in terms of excitement of the different
surfaces, many useful conclusions can be drawn.
Especially the measurements on the façade of the building have been very successful. The provisions
represent a very efficient and cheap way to influence the vibration behavior of the building. Each
provision itself can help modify it, but the most effect can be seen when all provisions are taken at the
same time.
The measurements on the partition wall have shown which frequencies correspond to the different
modes and how these characteristics can be measured efficiently.
ACKNOWLEDGEMENT
The investigations described were performed within the research project “Wiener Baukultur”, Project No.
827348 financed by the FFG (Österreichische Forschungsförderungsgesellschft mbH). This support is gratefully
acknowledged.
REFERENCES
Achs, G. et al. (2011). Earthquakes in the Viennese Basin. Evaluation – Hazard – Site Risk (in German).
(Erdbeben im Wiener Becken. Beurteilung – Gefährdung – Standortrisiko) VCE Holding GmbH (ed.).
Achs, G. (2011). Seismic hazard of historic residential buildings. Evaluation, classification, and experimental
investigations (Erdbebengefährdung von Gründerzeithäusern. Beurteilung, Klassifizierung und
experimentelle Untersuchungen). Doctoral Thesis (in German), Vienna University of Technology.
Flesch R. (1993), Baudynamik, Band 1, Bauverlag
Calvi, G.M., Pinho, R., Magenes, G., Bommer, J.J., Restrepo-Vélez, L.F. and Crowley, H. (2006). Development
of seismic vulnerability assessment methodologies over the past 30 years. ISET Journal of Earthquake
Technology 43, 75-104.
Ferreira, T., Vicente, R. and Varum, H. (2010). Seismic vulnerability assessment of masonry facade walls. 14th
European Conference on Earthquake Engineering (14th ECEE), Ohrid, Macedonia.
Flesch, R., Lenhardt, W. and Geier, R. (2005). Earthquake induced damages in Austria - assessment of existing
buildings (in German). Bautechnik 82, 533-538.
Schäfer D., Kopf F., Wenzel H. (2011), Systemidentifikation von Gründerzeithäusern im Wiener Becken,
DACH Tagung – Erdbeben und Baudynamik (in German)
Seismid report (2010), Messtechnische Untersuchung Gründerzeithäuser, internal report in the projekt
SEISMID, www.seismid.com
Waller H., Schmidt R. (1989), Schwingungslehre für Ingenieure, Mannheim/Wien/Zürich, Wissenschaftsverlag
Wenzel, H., Pichler, D.(2005), “Ambient vibration monitoring”, Chichester, England: J. Wiley and Sons LTD